expanding the medical spectral window v5
TRANSCRIPT
Improving Non-Invasive Blood Analysis by Expanding the Medical
Spectral Window
Katherine Paseman
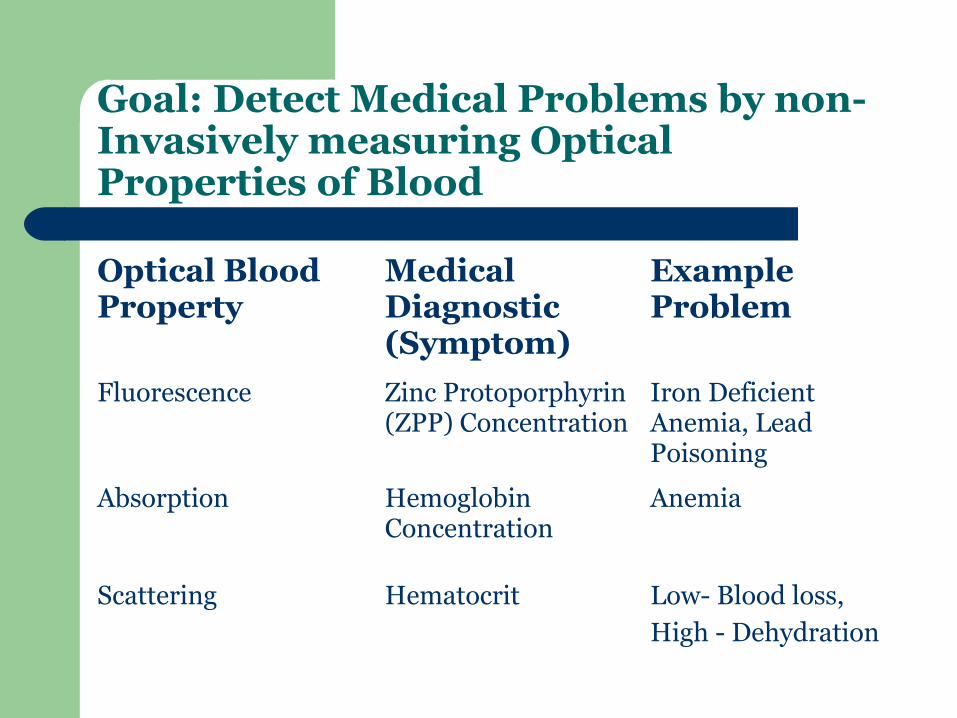
Goal: Detect Medical Problems by non-Invasively measuring Optical Properties of Blood
Optical Blood Property
Medical Diagnostic (Symptom)
Example Problem
Fluorescence Zinc Protoporphyrin (ZPP) Concentration
Iron Deficient Anemia, Lead Poisoning
Absorption Hemoglobin Concentration
Anemia
Scattering Hematocrit Low- Blood loss,High - Dehydration

Beer-Lambert Law
Optical approaches leverage the Beer-Lambert law which uses 3 variables to model light entering (Ii) and exiting (Io) a sample.
Io = Ii 10 –2.303 ε(λ) c t /(64,500 g Hb/mole)
t – Sample thickness – cm c – concentration of absorbent - g/liter (A typical
value of c for whole blood is 150 g Hb/liter.) ε(λ) – extinction coefficient of absorbent, which
is a function of the light’s wavelength.– Blood’s ε(λ) is very large for λ < 600 nm– This is why a flashlight shone through the hand only
transmits red light.
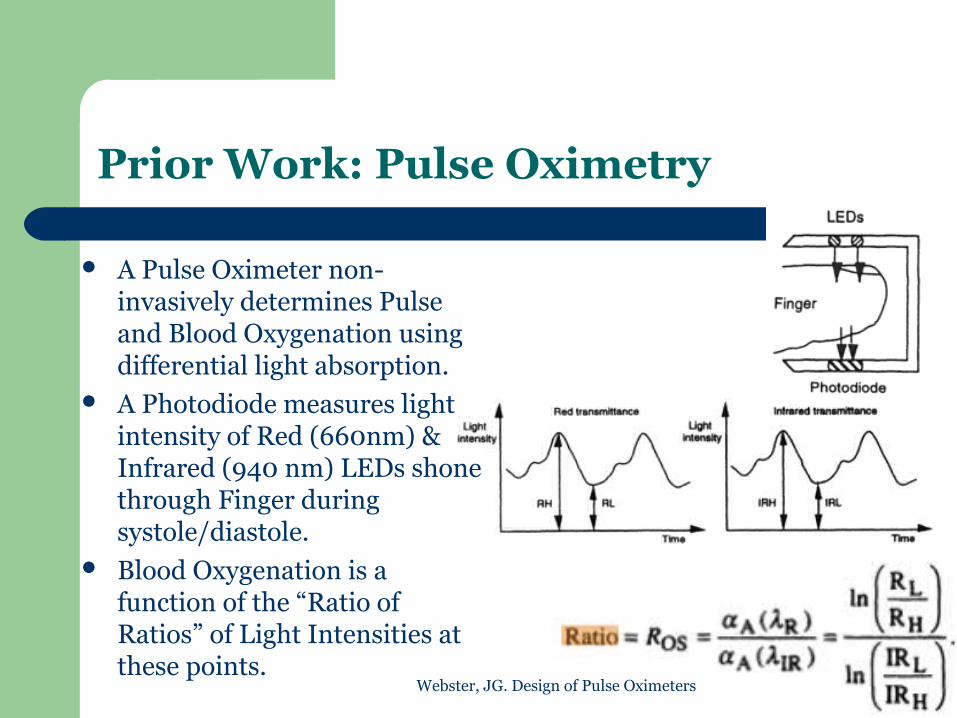
Prior Work: Pulse Oximetry
A Pulse Oximeter non-invasively determines Pulse and Blood Oxygenation using differential light absorption.
A Photodiode measures light intensity of Red (660nm) & Infrared (940 nm) LEDs shone through Finger during systole/diastole.
Blood Oxygenation is a function of the “Ratio of Ratios” of Light Intensities at these points.
Webster, JG. Design of Pulse Oximeters
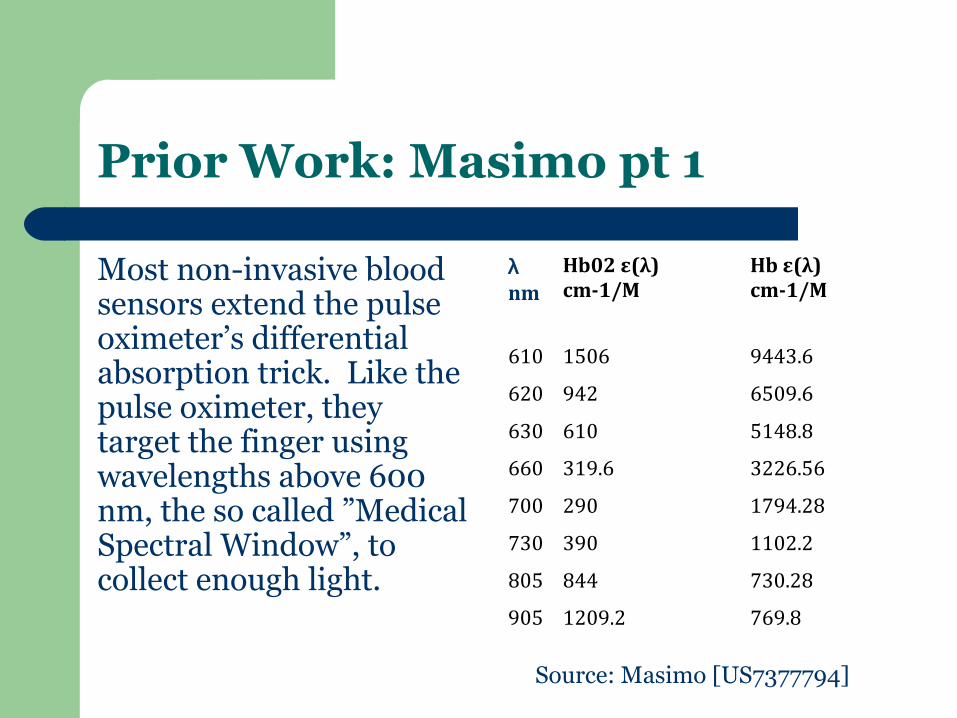
Prior Work: Masimo pt 1
Most non-invasive blood sensors extend the pulse oximeter’s differential absorption trick. Like the pulse oximeter, they target the finger using wavelengths above 600 nm, the so called ”Medical Spectral Window”, to collect enough light.
λnm
Hb02 ε(λ)cm-1/M
Hb ε(λ)cm-1/M
610 1506 9443.6
620 942 6509.6
630 610 5148.8
660 319.6 3226.56
700 290 1794.28
730 390 1102.2
805 844 730.28
905 1209.2 769.8
Source: Masimo [US7377794]

Prior Work: Masimo pt 2
MedicalSpectralWindow
Prior Work: Samsung pt 1
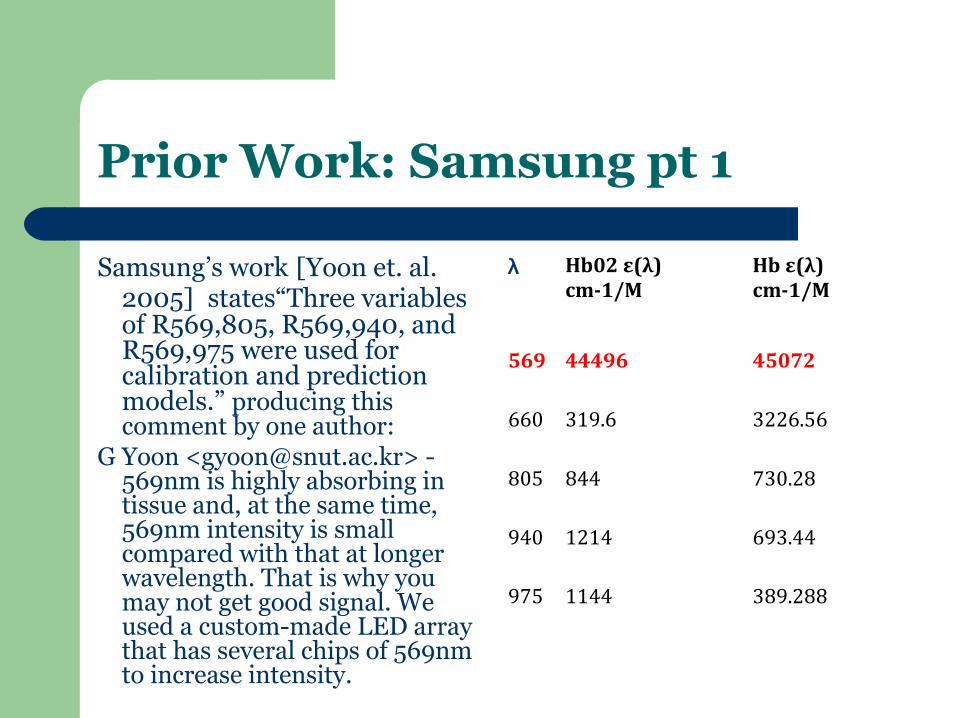
Samsung’s work [Yoon et. al. 2005] states“Three variables of R569,805, R569,940, and R569,975 were used for calibration and prediction models.” producing this comment by one author:
G Yoon <[email protected]> - 569nm is highly absorbing in tissue and, at the same time, 569nm intensity is small compared with that at longer wavelength. That is why you may not get good signal. We used a custom-made LED array that has several chips of 569nm to increase intensity.
λ Hb02 ε(λ)cm-1/M
Hb ε(λ)cm-1/M
569 44496 45072
660 319.6 3226.56
805 844 730.28
940 1214 693.44
975 1144 389.288
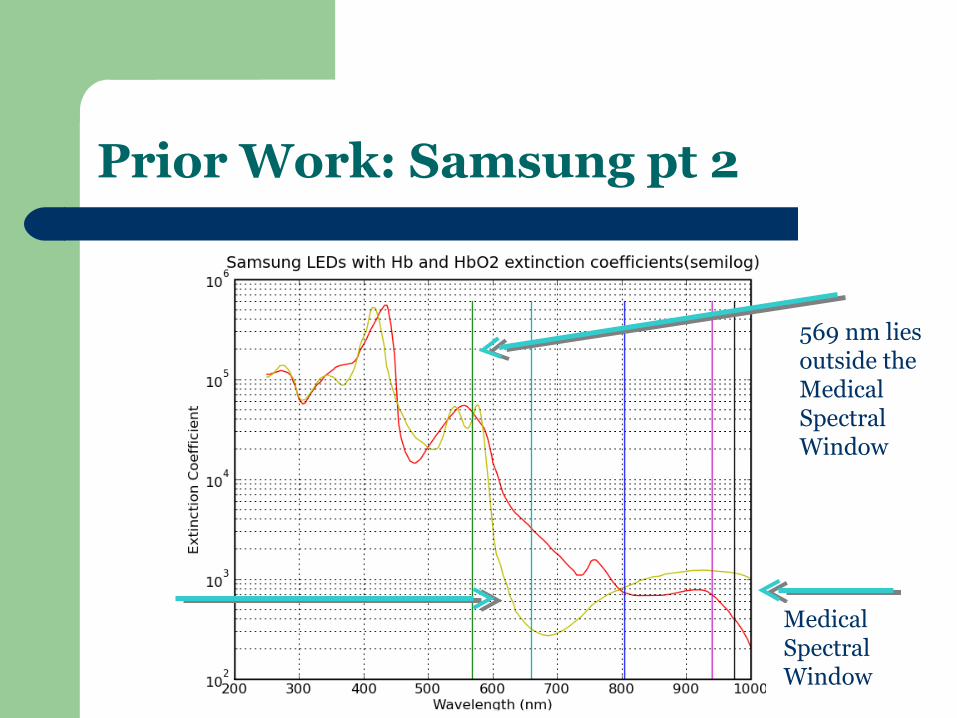
Prior Work: Samsung pt 2
MedicalSpectralWindow
569 nm lies outside the MedicalSpectralWindow

Our Research: Target Thumb Webbing for Absorption instead of Finger
Our hypothesis: We can extend the medical spectral window by offsetting the increase in extinction coefficient at λ< 600 nm with a decrease in sample thickness
[Sabrina Paseman 2008] did this by targeting the thumb webbing for fluorescence measurements.
We do this for absorption. This allows us to get better
absorption measurements by increasing signal and so decreasing noise based error.
It also allows us to detect additional sources of error.
The Apparatus
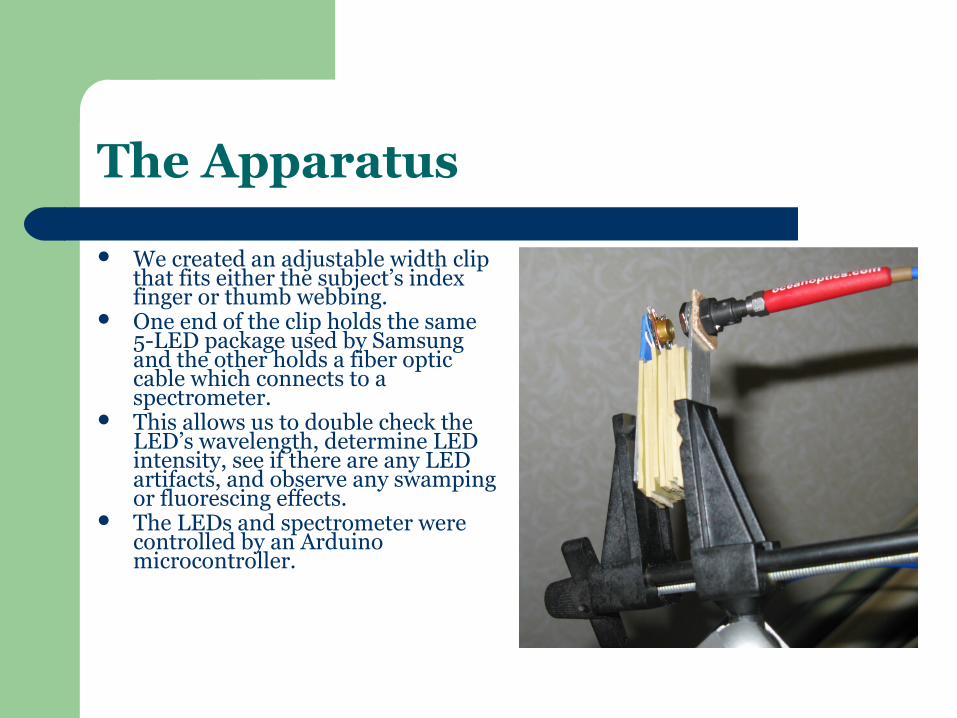
We created an adjustable width clip that fits either the subject’s index finger or thumb webbing.
One end of the clip holds the same 5-LED package used by Samsung and the other holds a fiber optic cable which connects to a spectrometer.
This allows us to double check the LED’s wavelength, determine LED intensity, see if there are any LED artifacts, and observe any swamping or fluorescing effects.
The LEDs and spectrometer were controlled by an Arduino microcontroller.
Experimental Approach 1
Clamp is adjusted to fit the subject’s index finger. Subject removes finger so distance between spectrometer and LED can be measured with a micrometer.
Thumb webbing is placed over the entire LED Spectrometer auto-adjusts the integration time to a
full scale reading and the data is collected. Subject removes thumb webbing and places index
finger over LED. Data is collected with the same integration time and plotted on the same axis for comparison
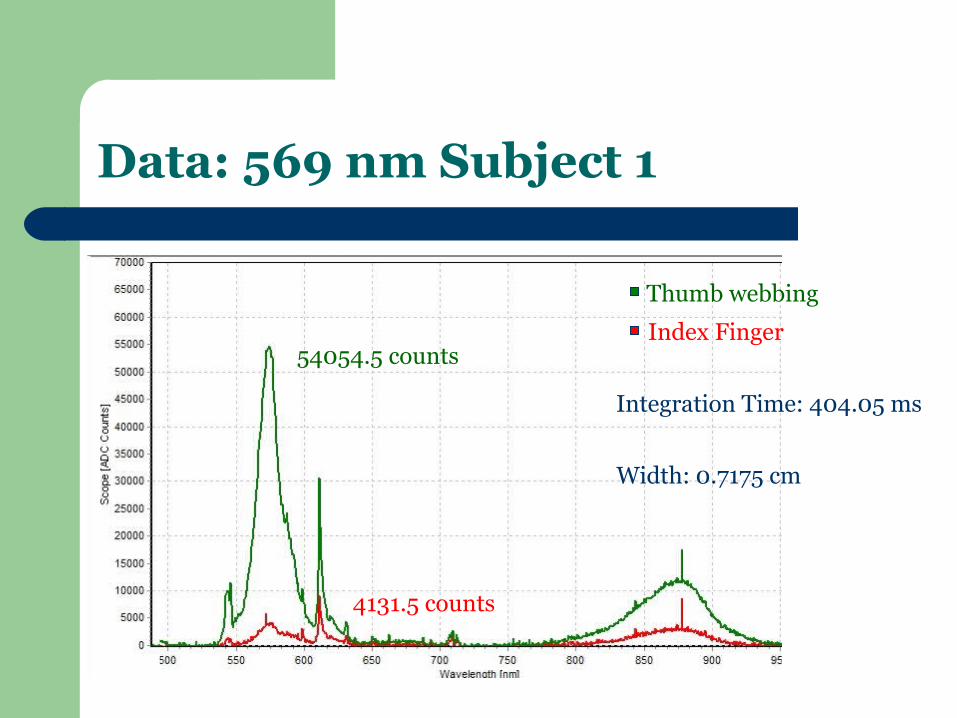
Data: 569 nm Subject 1
Thumb webbing
Index Finger
Integration Time: 404.05 ms
54054.5 counts
4131.5 counts
Width: 0.7175 cm
Findings
Transmission increases 13 fold Samsung’s LED chip has an artifact at around 875nm
when the 569nm LED is lit. If Samsung’s device uses a photodiode to collect light, especially at low intensities, much of the collected light would come from the artifact rather than the 569nm absorption
This method limited the quality of the readings we could take from subjects with darker skin

Hold LED underneath the thumb webbing and the spectrometer on the other side.
Let the spectrometer auto-integrate and capture the graph.
For data analysis, find the ratio between the ratios of the peak counts at 569nm and the integration time
Experimental Approach 2
Countsthumb webbing
Integration timethumb webbing
Countsindex finger
Integration timeindex finger
Absorption Amplification =
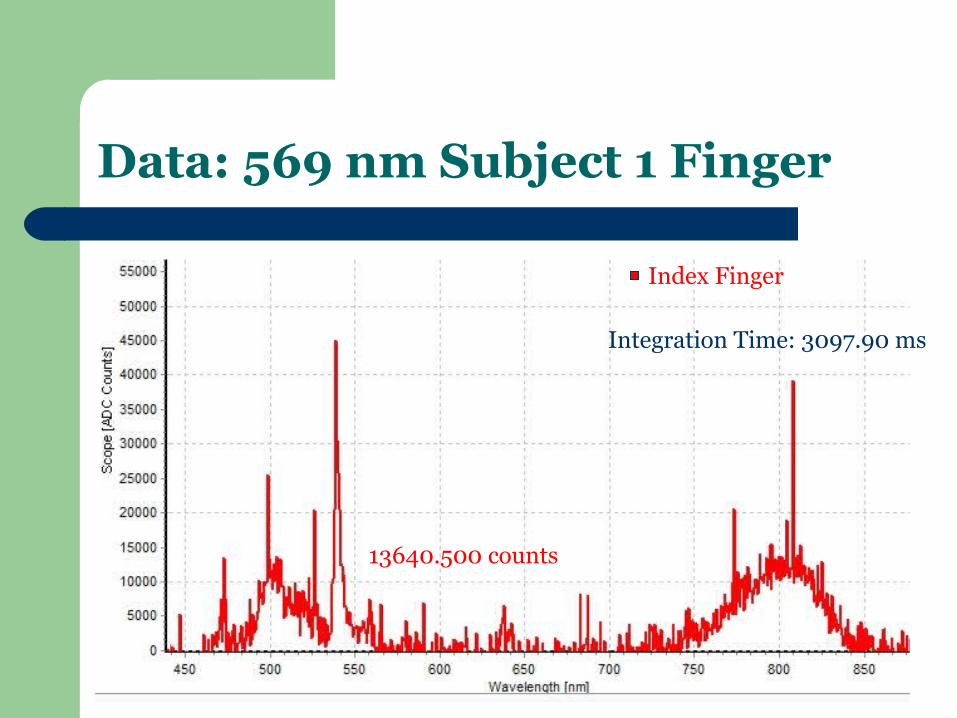
Data: 569 nm Subject 1 Finger
Index Finger
Integration Time: 3097.90 ms
13640.500 counts

Data: 569 nm Subject 1 Webbing
Thumb Webbing
Integration Time: 99.70 ms
32847.801 counts

Data: 569 nm Subject 2 Finger
Index Finger
Integration Time: 1736.15 ms
61598.500 counts
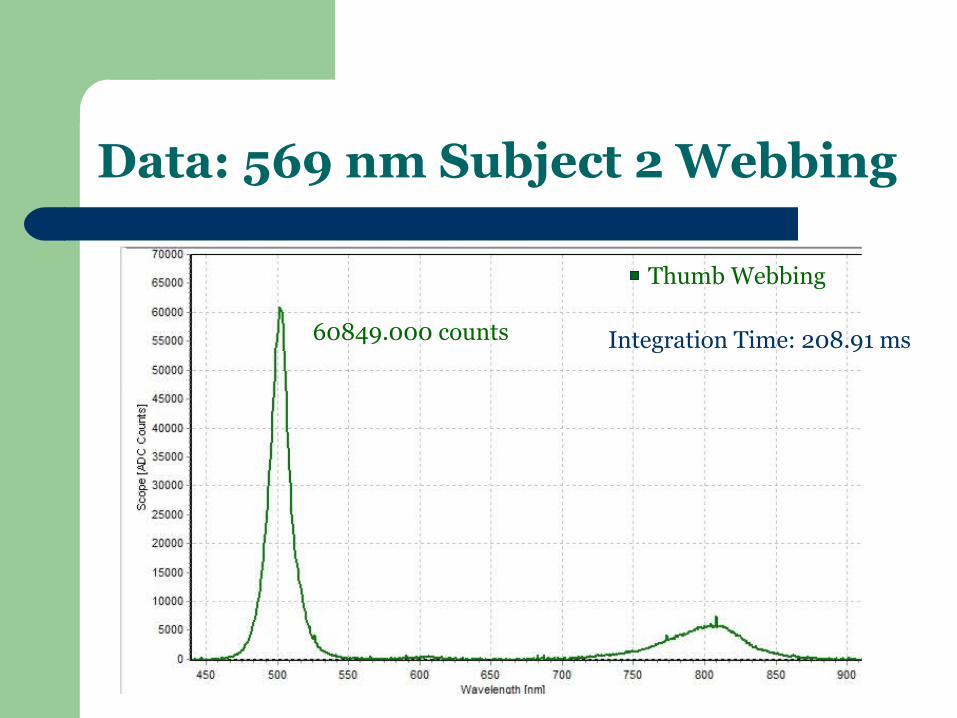
Data: 569 nm Subject 2 Webbing
Thumb Webbing
Integration Time: 208.91 ms60849.000 counts
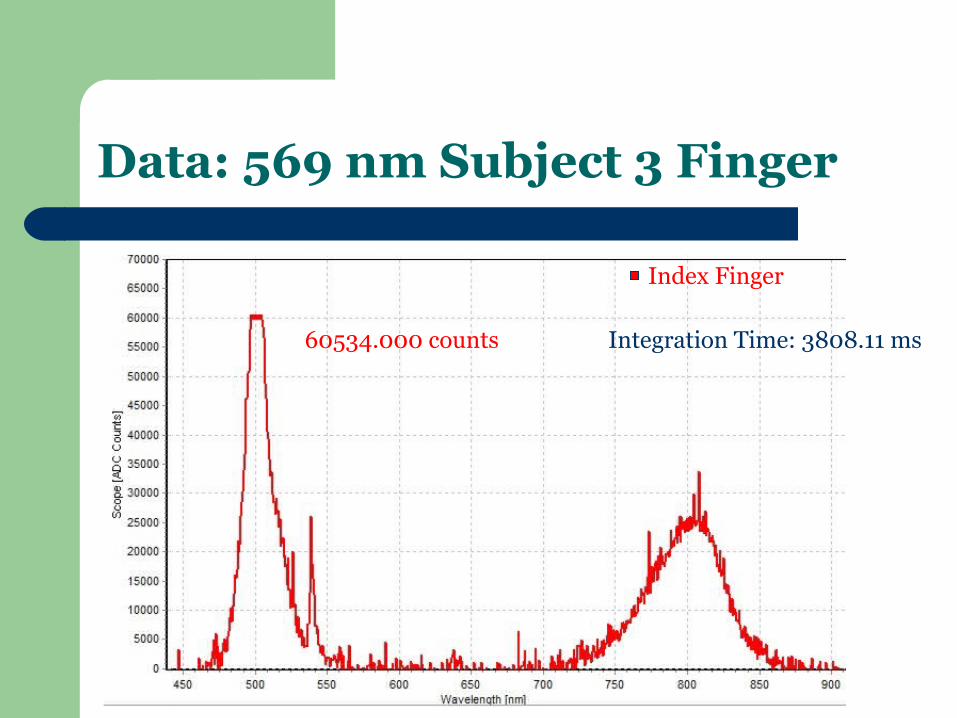
Data: 569 nm Subject 3 Finger
Index Finger
Integration Time: 3808.11 ms60534.000 counts
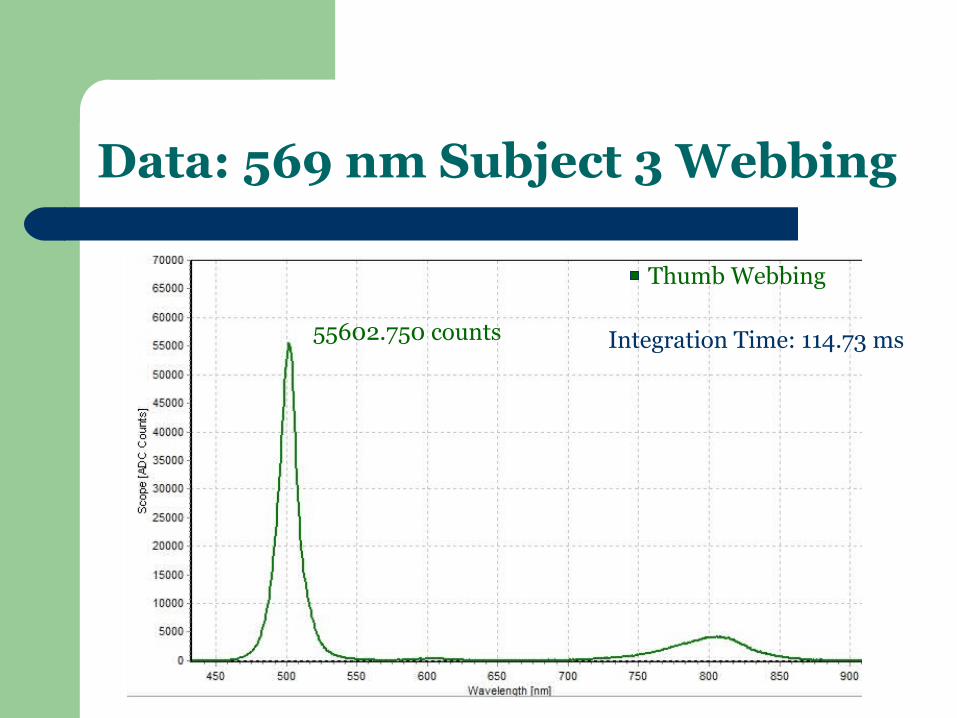
Data: 569 nm Subject 3 Webbing
Thumb Webbing
Integration Time: 114.73 ms55602.750 counts
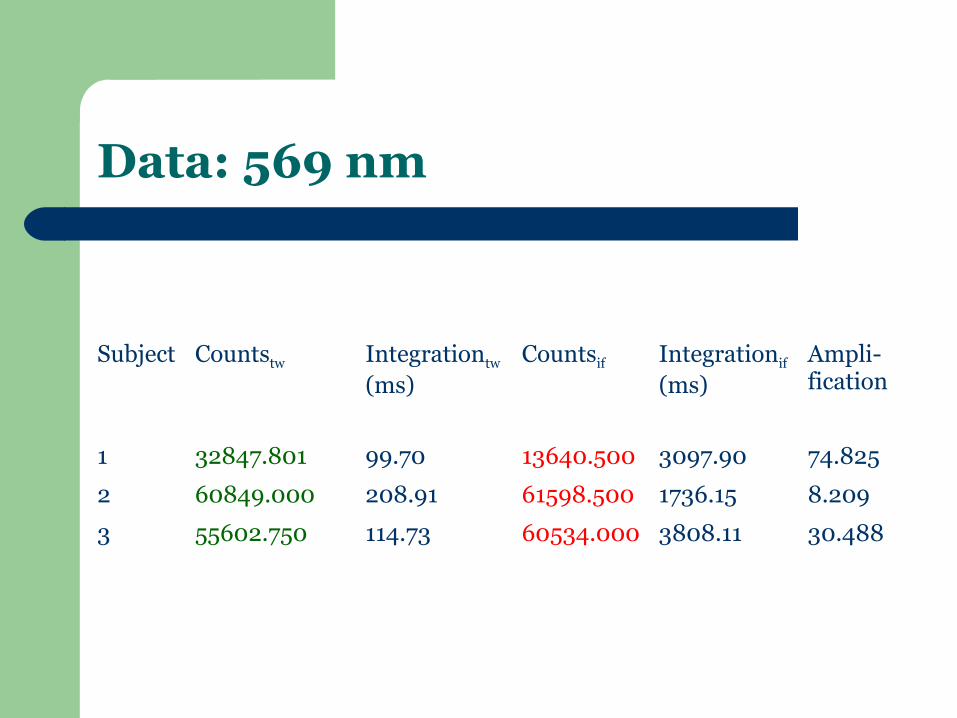
Data: 569 nm
Subject Countstw Integrationtw
(ms)Countsif Integrationif
(ms)Ampli-fication
1 32847.801 99.70 13640.500 3097.90 74.825
2 60849.000 208.91 61598.500 1736.15 8.209
3 55602.750 114.73 60534.000 3808.11 30.488

Conclusions
Transmission increases across the board but varies from subject to subject
Our suspicions about the artifact are confirmed by our second set up
Further Research
See if there is a statistically significant difference between the light absorption of systolic and diastolic blood at 569, 660, 805, 940 and 975 nm.
Correlate more medical problems to absorption differentials and fluorescent phenomena.
– See if there is a statistically significant difference between the fluorescence of systolic and diastolic blood excited at 425 nm.
Collect data for more subjects with varying melanin contents
References
[Sabrina Paseman 2008] Paseman, Sabrina. The Ferrometer: A Device to Detect Iron Deficient Anemia via Non-Invasive Optical Measurement of Zinc Protoporphyrin. Issue brief no. SO499. Los Angeles: University of Southern California, 2008. PDF file.
[US7377794] "Multiple Wavelength Sensor Interconnect” – p57 lists Masimo’s wavelengths
[Yoon et. Al. 2005] Yoon, Gilwon, Ph.D, et al. "Development of a Compact Home Health Monitor for Telemedicine." TELEMEDICINE AND e-HEALTH 11.6 (2005): 660-67. PDF File.
“Tabulated Molar Extinction Coefficient for Hemoglobin in Water” http://omlc.ogi.edu/spectra/hemoglobin/summary.html