expanding your data toolkit irene ricci sullivant supervisor of data office of research &...
TRANSCRIPT

Expanding Your Data Expanding Your Data ToolkitToolkit
Irene Ricci SullivantSupervisor of Data Office of Research & PlanningCamden City Public Schools
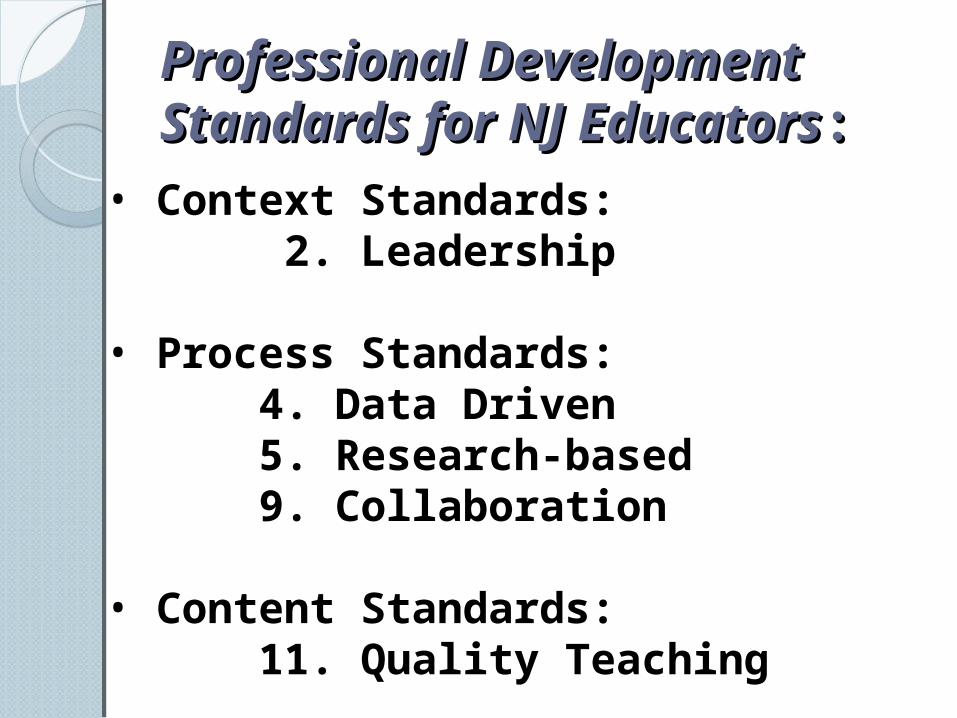
Professional Professional Development Standards Development Standards for NJ Educatorsfor NJ Educators::
• Context Standards: 2. Leadership
• Process Standards: 4. Data Driven 5. Research-based 9. Collaboration
• Content Standards: 11. Quality Teaching

ObjectivesObjectives
Participants will: Examine the current
data practices of the school community.
Compare current practice to what research has identified as effective data use.

ObjectivesObjectives
Participants will: Identify multiple
measures of data to examine.
Develop an understanding of student growth data and its use in continuous school improvement.
Our district is committed to Our district is committed to using data effectively.using data effectively.

Data . . .Data . . . Must drive Instruction Helps us to identify root causes
of student learning problems Is an essential component of
continuous school improve. Addresses important indicators
under QSAC and Priority School Achievement Indicators
Used to drive planning such as the Unified Plan, Professional Development Plan, and all the plans to come.

7
THINK THINK BEYOND TEST SCORESBEYOND TEST SCORES
“Output data are not the only kind of data”.
Source: “Making sense of data-driven decision making in education”, J. A.
Marsh, J. F. Pane and L. S. Hamilton, Rand Corporation, 2006

8
VARIABLES WHICH AFFECT STUDENT ACHIEVEMENT
Outside School Variables• Parent Involvement• Community Involvement• Other
School Variables• School Safety• School Climate• Other
District Variables• Curriculum Alignment• Professional Development,• Other
STUDENT ACHIEVEMENT
Teacher Variables• Teacher Expectations• Instructional Delivery• Other
Student Variables• Student Attendance• Student Behavior.• Other
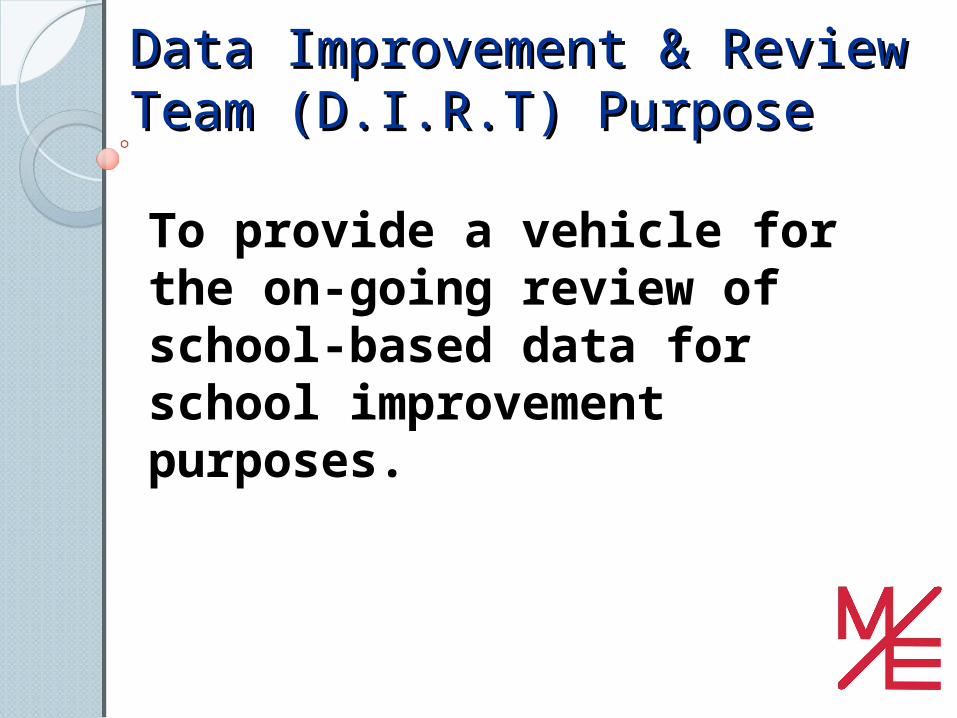
Data Improvement & Review Data Improvement & Review Team (D.I.R.T) PurposeTeam (D.I.R.T) Purpose
To provide a vehicle for the on-going review of school-based data for school improvement purposes.
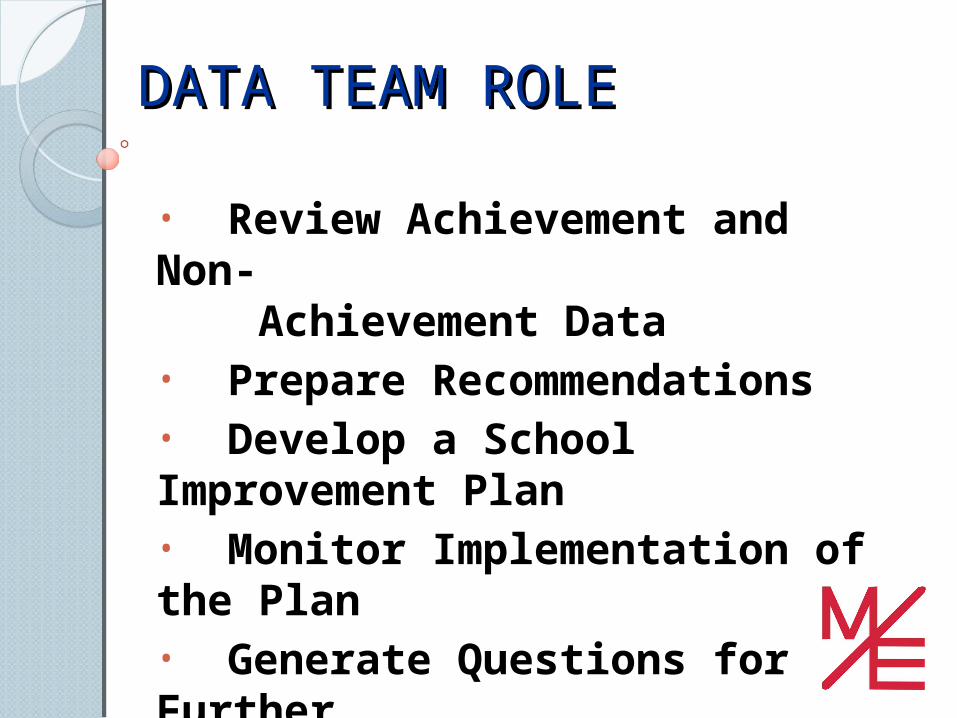
DATA TEAM ROLEDATA TEAM ROLE
• Review Achievement and Non- Achievement Data• Prepare Recommendations• Develop a School Improvement Plan• Monitor Implementation of the Plan• Generate Questions for Further Analyses

What the research tells What the research tells us. . .us. . .

U. S. Department of Education: U. S. Department of Education: Recommendations for Data UseRecommendations for Data Use
Make data part of an ongoing cycle of instructional improvement.
Teach students to examine their own data and set learning goals.
Establish a clear vision for school-wide data use
Hamilton, L., Halverson, R. et. al.(2009) Using student achievement data to support instructional decision making. (NCEE 2009-4067) Washington, DC: National Center for Education Evaluation and Regional Assistance, Institute of Education Sciences, U.S. Department of Education.

U. S. Department of Education: U. S. Department of Education: Recommendations for Data UseRecommendations for Data Use
Provide supports that foster a data-driven culture.
Develop and maintain a district-wide data system.
Hamilton, L., Halverson, R. et. al.(2009) Using student achievement data to support instructional decision making. (NCEE 2009-4067) Washington, DC: National Center for Education Evaluation and Regional Assistance, Institute of Education Sciences, U.S. Department of Education.
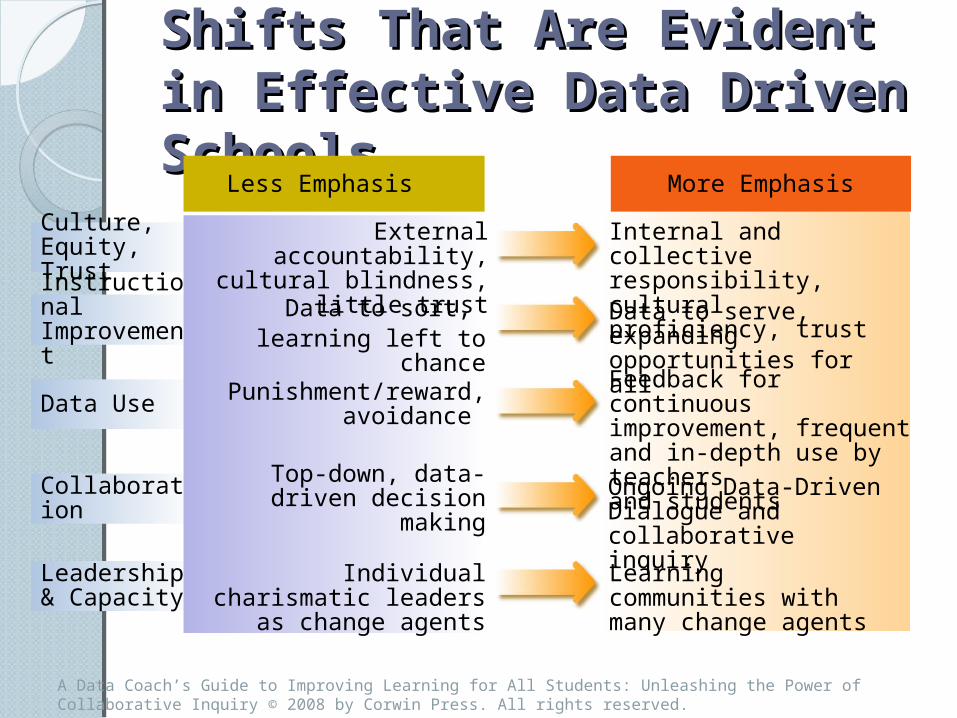
A Data Coach’s Guide to Improving Learning for All Students: Unleashing the Power of Collaborative Inquiry © 2008 by Corwin Press. All rights reserved.
Culture, Equity, Trust
Instructional Improvement
Collaboration
Data Use
Leadership & Capacity
Shifts That Are Evident in Shifts That Are Evident in Effective Data Driven Effective Data Driven SchoolsSchools
Less Emphasis More Emphasis
External accountability, cultural blindness, little trust
Internal and collective responsibility, cultural proficiency, trust
Data to sort, learning left to chance
Data to serve, expanding opportunities for all
Top-down, data-driven decision making Ongoing Data-Driven
Dialogue and collaborative inquiry
Punishment/reward, avoidance
Feedback for continuous improvement, frequent and in-depth use by teachers and students
Individual charismatic leaders as change agents
Learning communities with many change agents
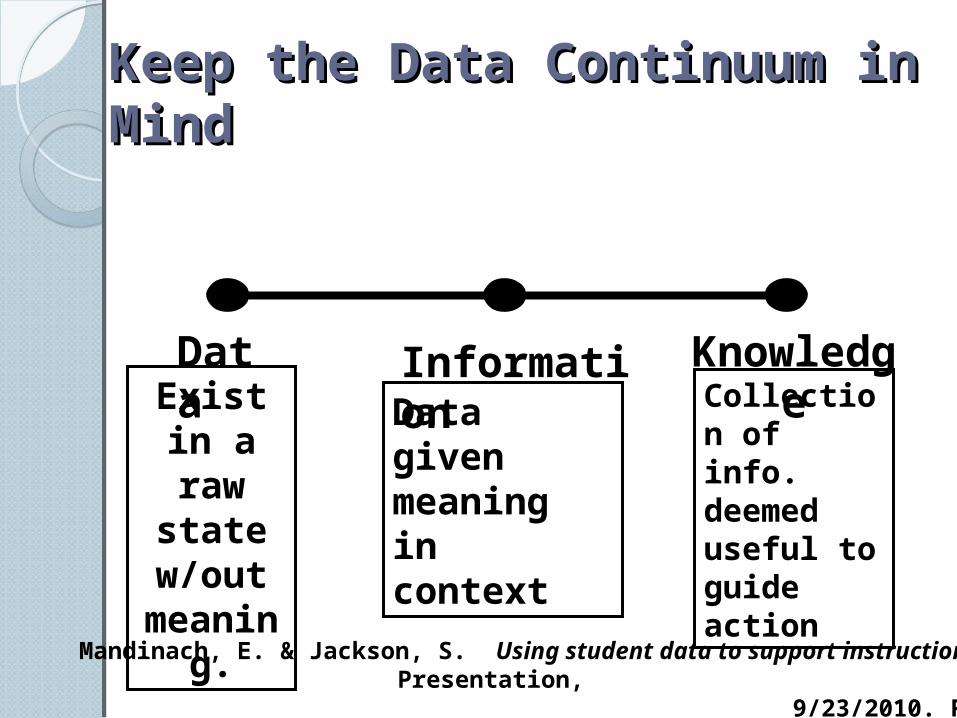
Keep the Data Continuum in Keep the Data Continuum in MindMind
Data InformationExist in a raw state
w/out meaning.
KnowledgeData given meaning in context
Collection of info. deemed useful to guide action
Mandinach, E. & Jackson, S. Using student data to support instruction. Presentation, 9/23/2010. REL Mid-Atlantic.

It is essential to activate the It is essential to activate the knowledge and work knowledge and work collaboratively in order to impact collaboratively in order to impact student achievement.student achievement.
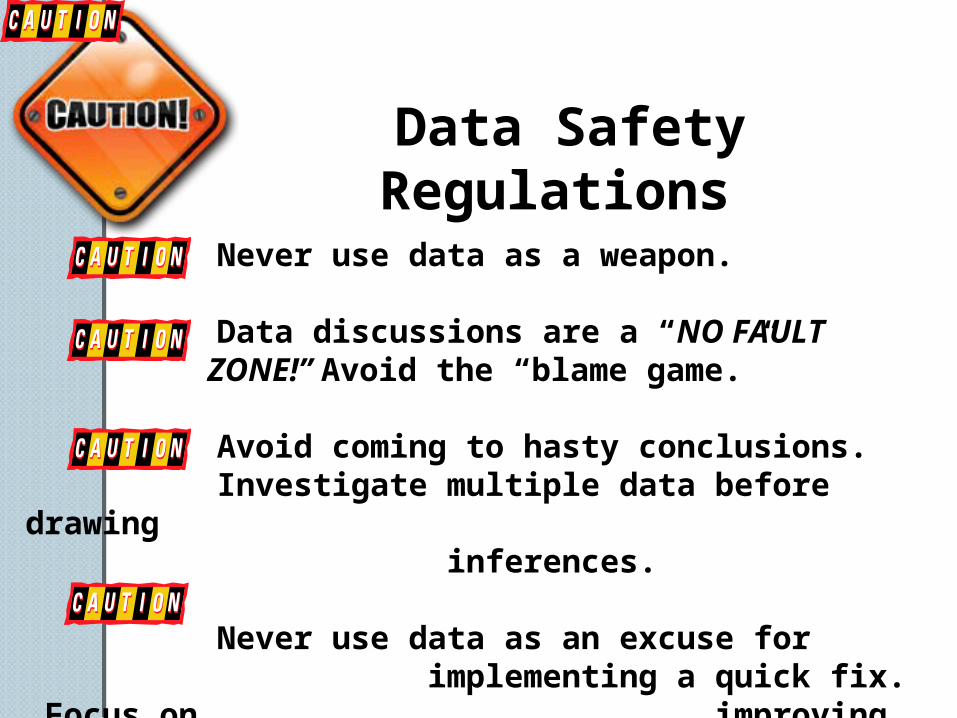
Data Safety Regulations
Never use data as a weapon.
Data discussions are a “NO FAULT ZONE!” Avoid the “blame game.”
Avoid coming to hasty conclusions. Investigate multiple data before drawing
inferences.
Never use data as an excuse for implementing a quick fix. Focus on improving instruction.
A Data Coach’s Guide to Improving Learning for All Students: Unleashing the Power of Collaborative Inquiry © 2008 by Corwin Press. All rights reserved.
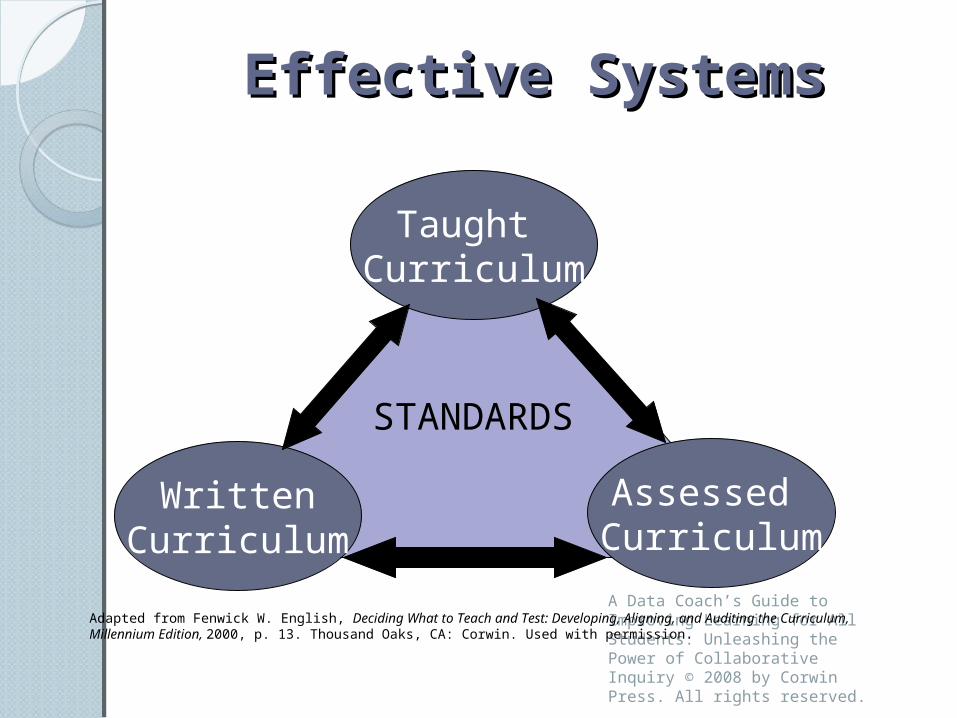
Effective SystemsEffective Systems
Taught Curriculum
WrittenCurriculum
Assessed Curriculum
STANDARDS
Adapted from Fenwick W. English, Deciding What to Teach and Test: Developing, Aligning, and Auditing the Curriculum, Millennium Edition, 2000, p. 13. Thousand Oaks, CA: Corwin. Used with permission.

When any part of our system When any part of our system is not aligned, we will not get is not aligned, we will not get the desired results.the desired results.
Taught
CurriculumW
ritte
n
Curricul
um
Ass
esse
d C
urricu
lum
STANDARDS
?Results

Multiple Measures of Multiple Measures of DataData
Adapted from: Bernhardt, V. L. (1998). Data analysis for comprehensive school-wide improvement. Larchmont, NY: Eye on Education.

What data are we using in our data world?
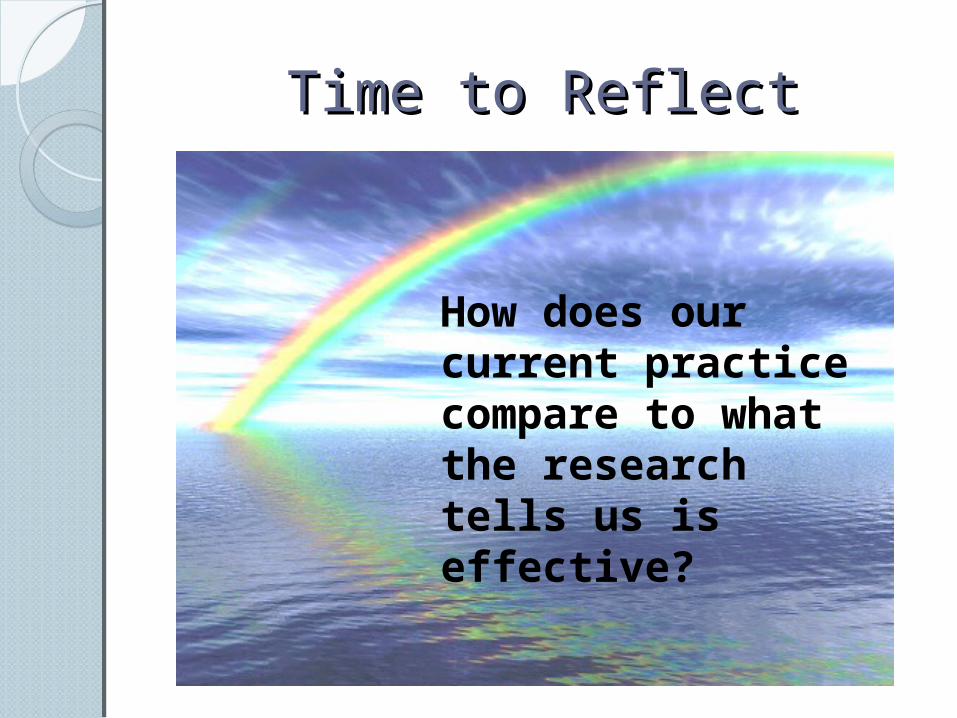
Time to ReflectTime to Reflect
How does our current practice compare to what the research tells us is effective?

Let’s Talk About Moving Let’s Talk About Moving Forward! Forward!
Where does our work with data go from here?

Our Shifting FocusOur Shifting Focus
From proficiency rates to growth

Understanding Student Understanding Student Growth Growth
The state is moving to a growth model. NJSMART has an excellent video resource help us understand how to use the new NJSMART district report NJASK Growth Profiles & student growth percentiles as a part of our examination of student learning data.
Video link http://survey.pcgus.com/njgrowth/player.html

Key points to remember Key points to remember about growthabout growth
NJASK is a criterion referenced test. Students are measured against the standards.
Cutoffs are set identifying whether a student is at, above, or below.
Adapted from: Using Student Growth Percentiles (2012). Downloaded from the www at http://survey.pcgus.com/njgrowth/player.html.

Key points to remember Key points to remember about growthabout growth
Adapted from: Using Student Growth Percentiles (2012). Downloaded from the www at http://survey.pcgus.com/njgrowth/player.html.
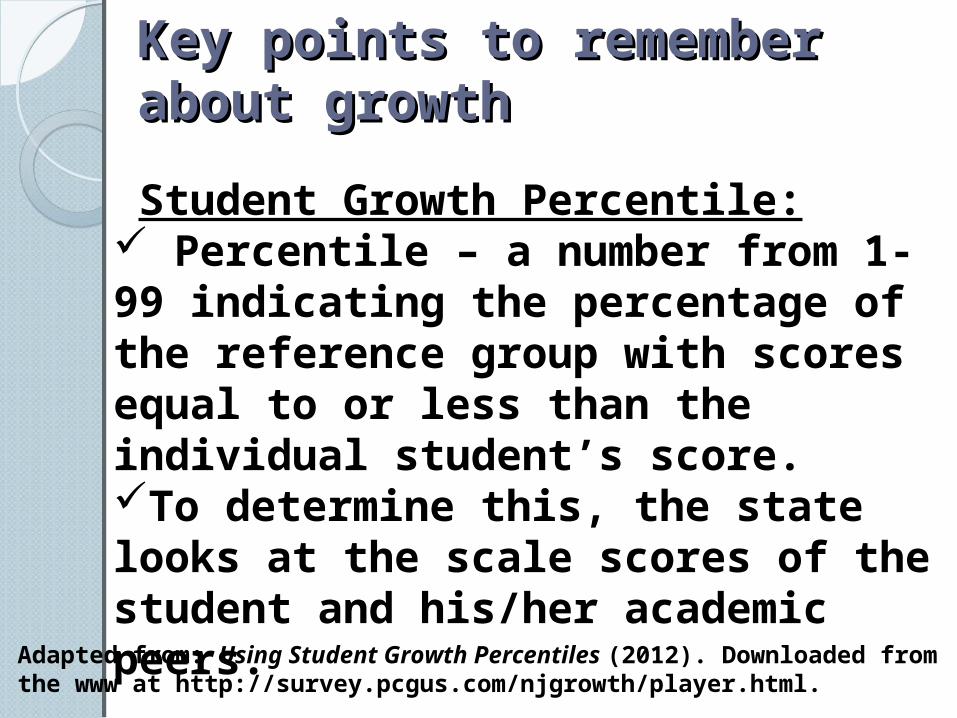
Key points to remember Key points to remember about growthabout growth
Student Growth Percentile: Percentile – a number from 1-99 indicating the percentage of the reference group with scores equal to or less than the individual student’s score.To determine this, the state looks at the scale scores of the student and his/her academic peers.Adapted from: Using Student Growth Percentiles (2012). Downloaded from the
www at http://survey.pcgus.com/njgrowth/player.html.

Key points to remember Key points to remember about growthabout growth
Adapted from: Using Student Growth Percentiles (2012). Downloaded from the www at http://survey.pcgus.com/njgrowth/player.html.

Key points to remember Key points to remember about growthabout growth
Median Student Growth Percentile Use this to determine growth of a class, a grade, a school, district.Median SGP is the middle of SGP if students are grouped from highest to lowest or, The average of the 2 middle scores in a distribution with an even number of scores.Adapted from: Using Student Growth Percentiles (2012). Downloaded from the
www at http://survey.pcgus.com/njgrowth/player.html.
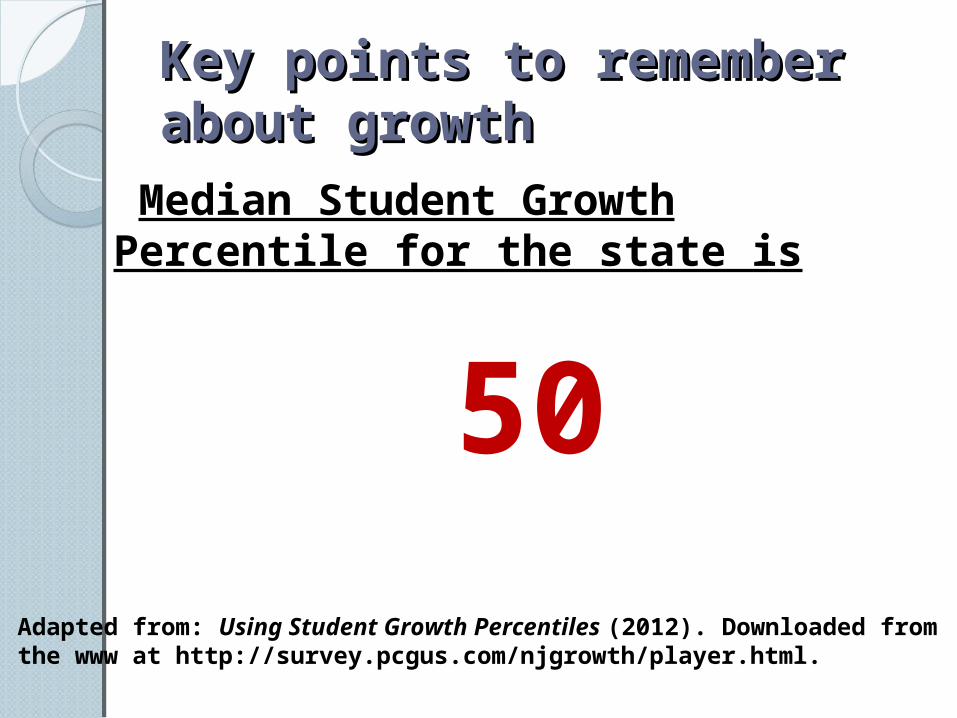
Key points to remember Key points to remember about growthabout growth
Median Student Growth Percentile for the state is
50Adapted from: Using Student Growth Percentiles (2012). Downloaded from the www at http://survey.pcgus.com/njgrowth/player.html.
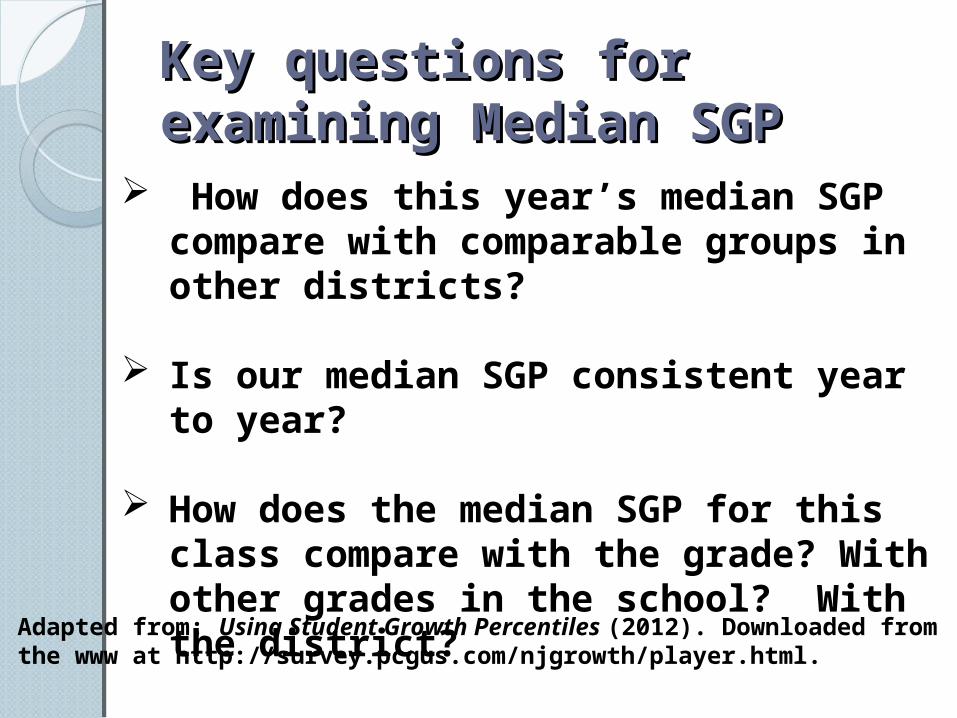
Key questions for Key questions for examining Median SGPexamining Median SGP
How does this year’s median SGP compare with comparable groups in other districts?
Is our median SGP consistent year to year?
How does the median SGP for this class compare with the grade? With other grades in the school? With the district?Adapted from: Using Student Growth Percentiles (2012). Downloaded from the
www at http://survey.pcgus.com/njgrowth/player.html.

So you have the data, So you have the data, what’s next?what’s next?

Suggestions for Suggestions for Examining Student Examining Student Achievement DataAchievement Data
• Use multiple measures.• Examine aggregate and
disaggregated data (total population, sub-groups).
• Drill down –cluster, strand, item analysis.
• Engage stakeholders in the process.
• Teach students to examine their own data.
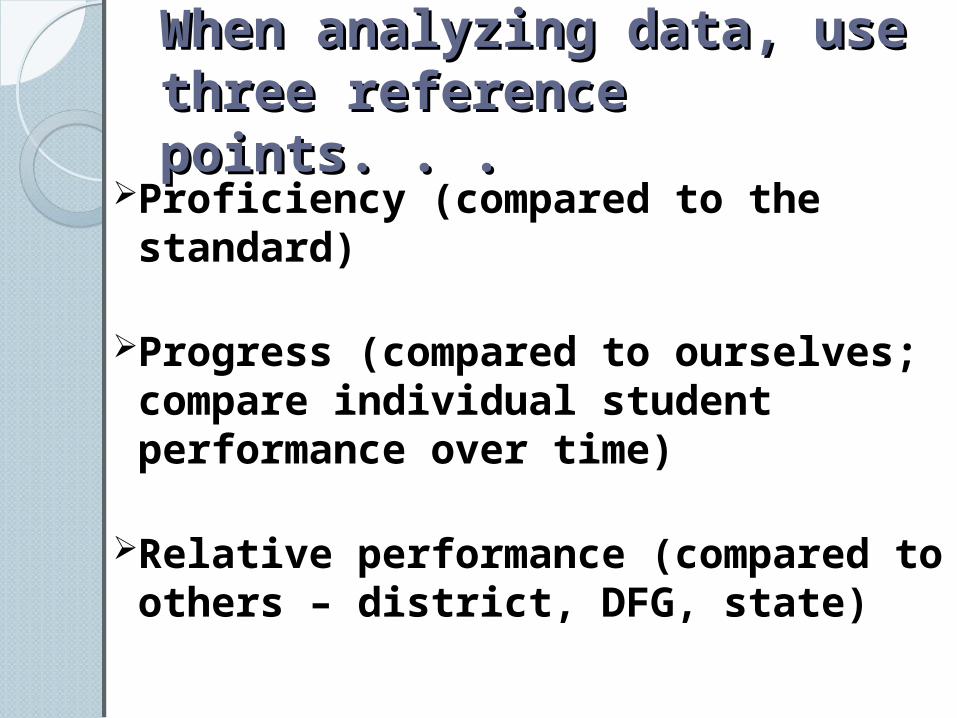
When analyzing data, use When analyzing data, use three reference points. . .three reference points. . .
Proficiency (compared to the standard)
Progress (compared to ourselves; compare individual student performance over time)
Relative performance (compared to others – district, DFG, state)

Look for trends over time.
Look at the aggregated and the disaggregated data
Proficiency Rate DataProficiency Rate Data
A Data Coach’s Guide to Improving Learning for All Students: Unleashing the Power of Collaborative Inquiry © 2008 by Corwin Press. All rights reserved.
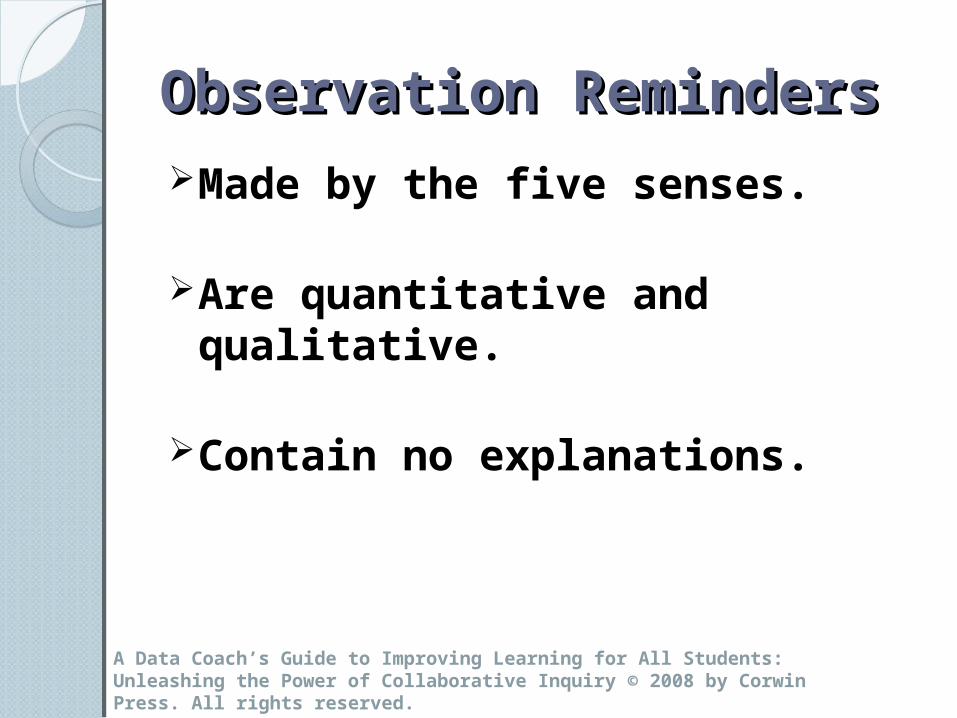
Observation RemindersObservation RemindersMade by the five senses.
Are quantitative and qualitative.
Contain no explanations.
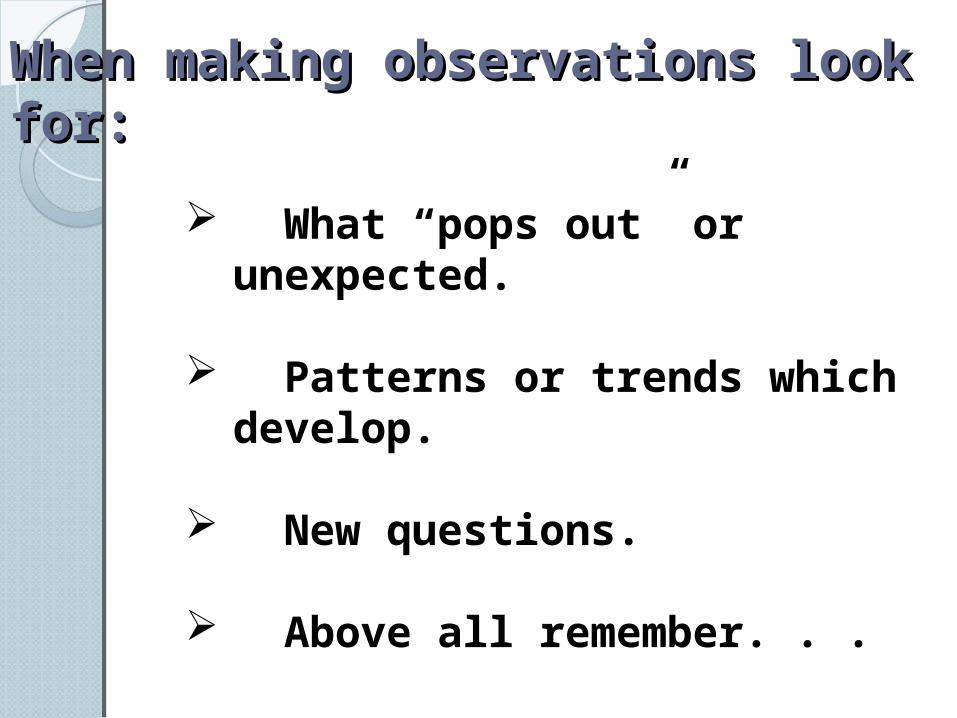
When making observations look When making observations look for:for:
What “pops out” or unexpected.
Patterns or trends which develop.
New questions.
Above all remember. . .

Observation RemindersObservation Reminders
Vital to set aside assumptions.
Hallmark is exploration & discovery.
Refrain from making judgments or drawing conclusions.

Keep the Data Continuum in Keep the Data Continuum in MindMind
Data InformationExist in a raw state
w/out meaning.
KnowledgeData given meaning in context
Collection of info. deemed useful to guide action
Mandinach, E. & Jackson, S. Using student data to support instruction. Presentation, 9/23/2010. REL Mid-Atlantic.
A Data Coach’s Guide to Improving Learning for All Students: Unleashing the Power of Collaborative Inquiry © 2008 by Corwin Press. All rights reserved.
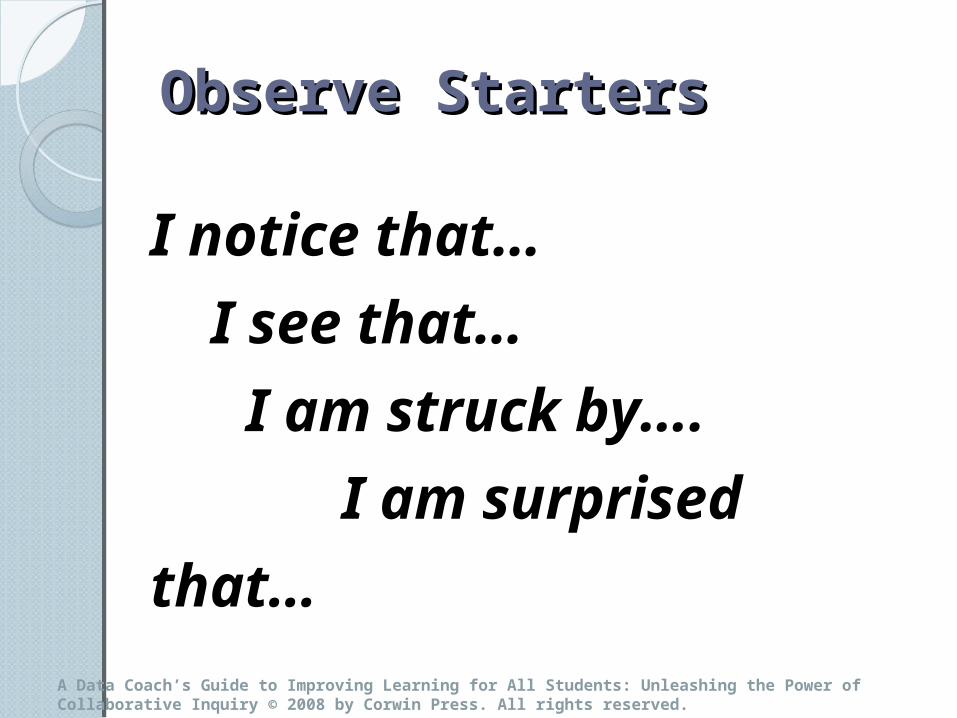
I notice that…
I see that…
I am struck by….
I am surprised that…
Observe StartersObserve Starters

Tools to organize your Tools to organize your datadata

Drawing Inferences, Drawing Inferences, Posing Questions, & Posing Questions, & Exploring Possible CausesExploring Possible Causes

A Data Coach’s Guide to Improving Learning for All Students: Unleashing the Power of Collaborative Inquiry © 2008 by Corwin Press. All rights reserved.
Infer/QuestionInfer/QuestionGenerate interpretations.
Generate multiple possible explanations or implications from the data.
Consider possible causes and all aspects of the community which might impact what is occurring.
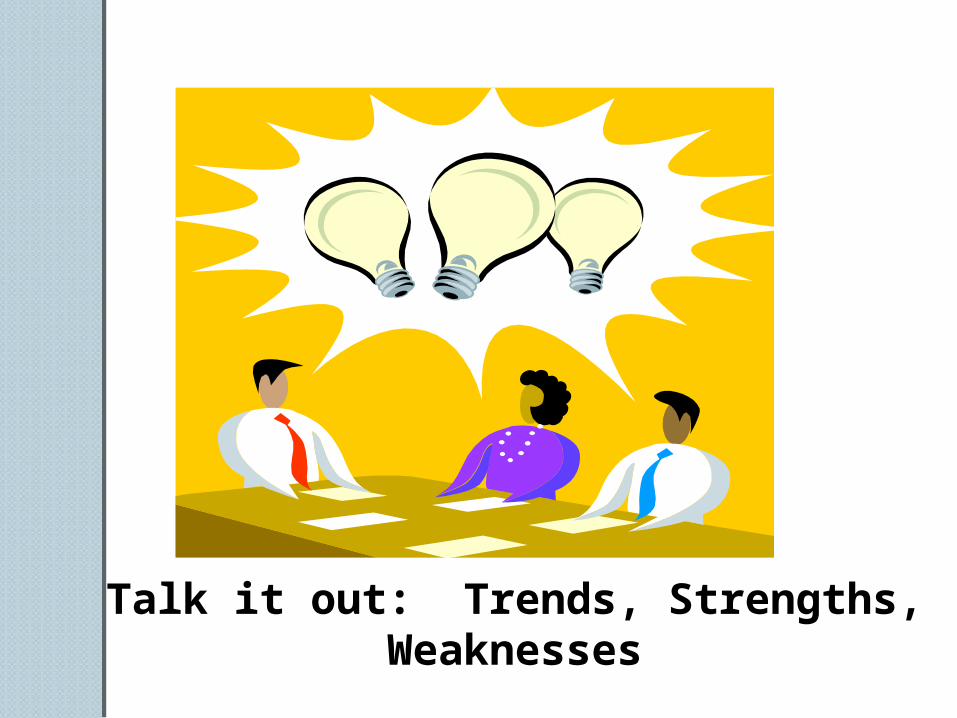
Talk it out: Trends, Strengths, Weaknesses
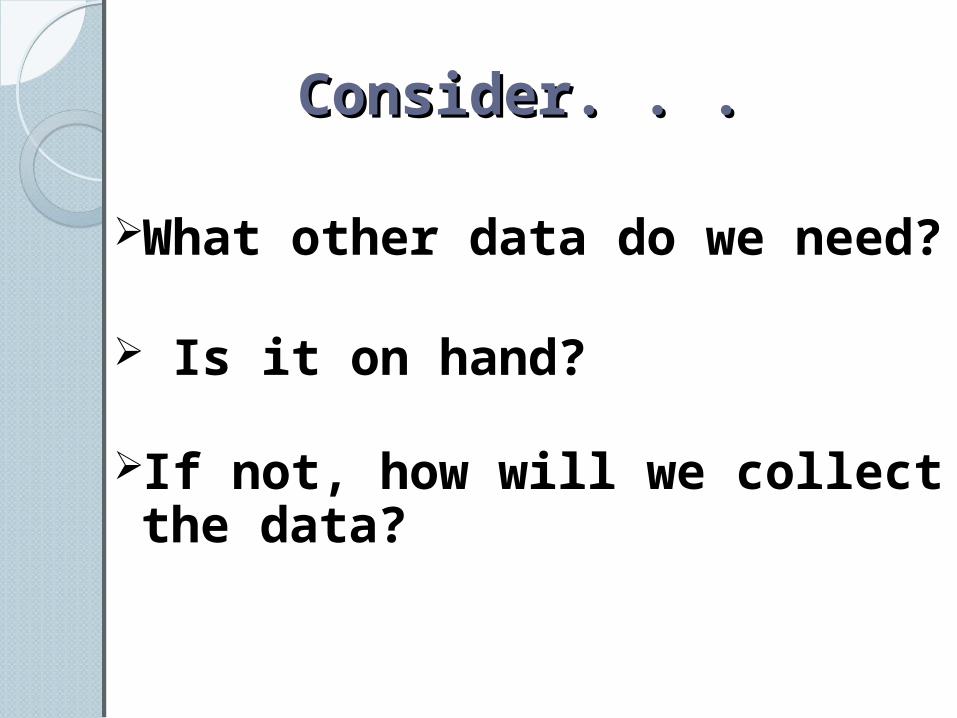
Consider. . .Consider. . .
What other data do we need?
Is it on hand?
If not, how will we collect the data?

Having data is only the Having data is only the beginning. . . beginning. . .
What we choose to do with the knowledge developed through data analysis is critical.

Based on the dataBased on the data, what , what actions will we take?actions will we take?
Action plan should include: Action steps, changes to
instruction, practice, or process.
Identify what success will look like.
How will we assess/monitor?

• Implement, take action, and monitor the results.
• Celebrate success.
• Balance long-and short-term improvement goals
On the pathway to On the pathway to improved achievementimproved achievement

A data driven learning A data driven learning community embraces community embraces collaborative inquiry.collaborative inquiry.
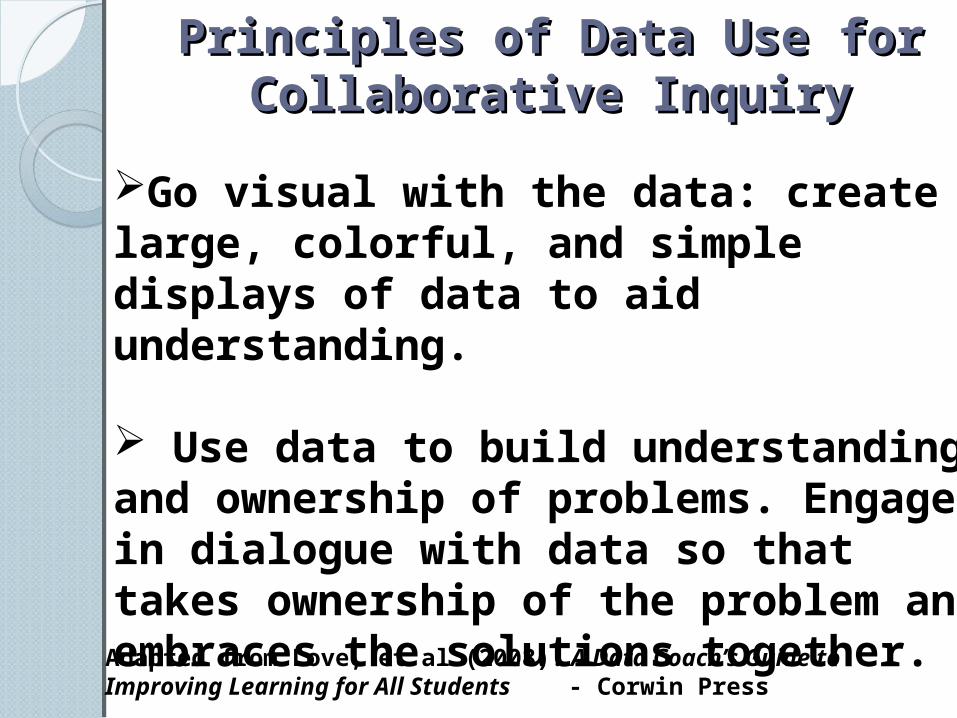
Principles of Data Use for Principles of Data Use for Collaborative InquiryCollaborative Inquiry
Go visual with the data: create large, colorful, and simple displays of data to aid understanding.
Use data to build understanding and ownership of problems. Engage in dialogue with data so that takes ownership of the problem and embraces the solutions together.
Adapted from Love, et al (2008). A Data Coach’s Guide to Improving Learning for All Students - Corwin Press
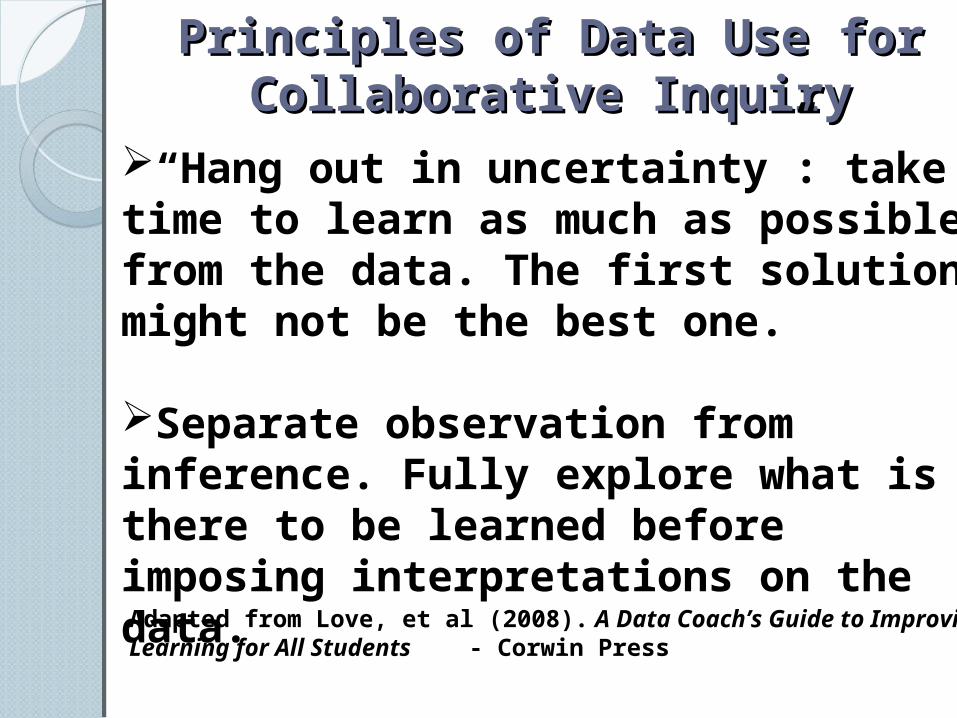
Principles of Data Use for Principles of Data Use for Collaborative InquiryCollaborative Inquiry
“Hang out in uncertainty”: take time to learn as much as possible from the data. The first solution might not be the best one.
Separate observation from inference. Fully explore what is there to be learned before imposing interpretations on the data.Adapted from Love, et al (2008). A Data Coach’s Guide to Improving Learning for All Students - Corwin Press
Principles of Data Use for Principles of Data Use for Collaborative InquiryCollaborative Inquiry
Pay attention to the process: carefully structure meetings to maximize engagement, learning, attention to equity issues, and the integrity and safety of the group. Assure that diverse voices are brought into the analysis. Multiple perspectives provide the richest information.
Adapted from Love, et al (2008). A Data Coach’s Guide to Improving Learning for All Students - Corwin Press

Takes action based on the Takes action based on the data!data!

ConnectinConnecting the Dotsg the Dots
Higher Student Achievement
High Capacity Data
Use
Effective
decisionmaking
Standards-based, rigorous, aligned curriculum
Improved instruction

““Data provide power to. . . Data provide power to. . . make good decisions, work make good decisions, work intelligently, work effectively intelligently, work effectively and efficiently, change things and efficiently, change things in better ways, know the in better ways, know the impact of our hard work and impact of our hard work and how it benefits children, and how it benefits children, and help us prepare for the help us prepare for the future” future” -- Victoria Bernhardt Victoria Bernhardt
As cited in V. Bernhardt. 2004. Data analysis for continuous school improvement 2nd edition. Larchmont, NY

Questions & Concerns

Contact informationContact informationIrene Ricci Sullivant
Supervisor of Data
Office of Research & Planning
Phone: 966-2000 ext. 38410
e-mail: [email protected]