expected results on 12 august 2015 co. name co. name co. name results on 120815.pdf · aarcon...
TRANSCRIPT

Co. Name Co. Name Co. NameAagam Capital Ltd. BSEL Infrastructure Realty Ltd. Golden Tobacco Ltd.
Aarcon Facilities Ltd. Cadila Healthcare Ltd. Goodyear India Ltd.
Abbott India Ltd. Camson Bio Technologies Ltd. Govind Rubber Ltd.
Abhishek Corporation Ltd. Career Point Ltd. Goyal Associates Ltd.
ABL Biotechnologies Ltd. Carnation Industries Ltd. Graviss Hospitality Ltd.
Accel Transmatic Ltd. CG-VAK Software & Exports Ltd. Gromo Trade & Consultancy Ltd.
Acropetal Technologies Ltd. Chandra Prabhu International Ltd. Gujchem Distillers India Ltd.
Adarsh Plant Protect Ltd. Chokhani Securities Ltd. Hardcastle & Waud Manufacturing Company Ltd.
ADF Foods Ltd. Cigniti Technologies Ltd. Hathway Bhawani Cabletel & Datacom Ltd.
Adinath Bio-Lab Ltd. Cimmco Ltd. HB Portfolio Ltd.
Aditya Birla Nuvo Ltd. City Union Bank Ltd. HB Stockholdings Ltd.
Aksharchem (India) Ltd. CMS Finvest Ltd. HEM Holdings & Trading Ltd.
Albert David Ltd. Coal India Ltd. Himadri Chemicals & Industries Ltd.
Alembic Ltd. Cosboard Industries Ltd. Hinduja Global Solutions Ltd.
Amit Securities Ltd. Cosco (India) Ltd. Hindustan Foods Ltd.
Anant Raj Ltd. Cosmo Ferrites Ltd. Hisar Metal Industries Ltd.
Anjani Dham Industries Ltd. Creative Eye Ltd. Honda Siel Power Products Ltd.
Anjani Foods Ltd. CSS Technergy Ltd. Hotel Leela Venture Ltd.
Anshuni Commercials Ltd. Daikaffil Chemicals India Ltd. HRB Floriculture Ltd.
Apollo Finvest (India) Ltd. DFM Foods Ltd. Hubtown Ltd.
Appu Marketing & Manufacturing Ltd. Dhanlaxmi Bank Ltd. ICVL Steels Ltd.
Aravali Securities & Finance Ltd. Dhanleela Investments & Trading Company Ltd. IDBI Bank Ltd.
Arcuttipore Tea Company Ltd. Dhanuka Agritech Ltd. IMC Finance Ltd.
Aris International Ltd. Dharamsi Morarji Chemical Company Ltd. India Cements Capital Ltd.
Arman Holdings Ltd. Dhenu Buildcon India Ltd. Indian Extractions Ltd.
Arnav Corporation Ltd. Divine Multimedia (India) Ltd. Indo Borax & Chemicals Ltd.
Arnold Holdings Ltd. Dolphin Medical Services Ltd. Industrial & Prudential Investment Company Ltd.
Aroni Commercials Ltd. Dolphin Offshore Enterprises (India) Ltd. Insilco Ltd.
Arun Varun Trade & Investment Ltd. DOT COM Global Ltd. Integra Engineering India Ltd.
Asahi Songwon Colors Ltd. Dynamic Industries Ltd. Integra Garments And Textiles Ltd.
Ashok Leyland Ltd. Dynavision Ltd. Integrated Financial Services Ltd.
Asian Food Products Ltd. Eastcoast Steel Ltd. Intellivate Capital Ventures Ltd.
Asian Star Company Ltd. Eastern Treads Ltd. Inter State Oil Carrier Ltd.
Asian Tea & Exports Ltd. Eduexel Infotainment Ltd. International Conveyors Ltd.
Astro Bio Systems Ltd. E-Land Apparel Ltd. Iris Mediaworks Ltd.
ATV Projects India Ltd. Elango Industries Ltd. ISL Consulting Ltd.
AUNDE India Ltd. Ellora Paper Mills Ltd. Jackson Investments Ltd.
Auro Laboratories Ltd. Elpro International Ltd. Jai Mata Glass Ltd.
Aurobindo Pharma Ltd. Emergent Global Edu & Services Ltd. Jay Ushin Ltd.
AVI Photochem Ltd. Emkay Global Financial Services Ltd. Jayaswal Neco Industries Ltd.
Axiscades Engineering Technologies Ltd. Emmbi Industries Ltd. JBM Auto Ltd.
Axtel Industries Ltd. Emmessar Biotech & Nutrition Ltd. Jeet Machine Tools Ltd.
Bafna Pharmaceuticals Ltd. ERP Soft Systems Ltd. Jindal Steel & Power Ltd.
Ballarpur Industries Ltd. Esaar (India) Ltd. JMG Corporation Ltd.
Balmer Lawrie & Company Ltd. Eureka Industries Ltd. Joonktollee Tea & Industries Ltd.
Balrampur Chini Mills Ltd. Evergreen Textiles Ltd. Jubilant Industries Ltd.
Bambino Agro Industries Ltd. Explicit Finance Ltd. Kaira Can Company Ltd.
Bank Of Maharashtra Fineotex Chemical Ltd. Kapashi Commercial Ltd.
Bannari Amman Spinning Mills Ltd. Frontier Capital Ltd. Karma Energy Ltd.
Bartronics India Ltd. Fruition Venture Ltd. KCP Ltd.
BDH Industries Ltd. Galaxy Bearings Ltd. Khoobsurat Ltd.
Bimetal Bearings Ltd. Garden Silk Mills Ltd. KLG Capital Services Ltd.
Binny Ltd. GD Trading & Agencies Ltd. Kopran Ltd.
Birla Precision Technologies Ltd. Genus Power Infrastructures Ltd. Kovai Medical Center & Hospital Ltd.
BJ Duplex Boards Ltd. GKB Ophthalmics Ltd. Kovalam Investment & Trading Company Ltd.
BKV Industries Ltd. Global Capital Markets Ltd. Kulkarni Power Tools Ltd.
Blue Pearl Texspin Ltd. Global Infratech & Finance Ltd. Lahoti Overseas Ltd.
BN Rathi Securities Ltd. Global Vectra Helicorp Ltd. Lambodhara Textiles Ltd.
Bodal Chemicals Ltd. Gokaldas Exports Ltd. Ledo Tea Company Ltd.
BS Ltd. Gokul Refoils and Solvent Ltd. Longview Tea Company Ltd.
Exp
ecte
d R
esu
lts
on
12
Au
gu
st 2
015
Expected Results on 12 August 2015
Exp
ecte
d R
esu
lts
on
12
Au
gu
st 2
015
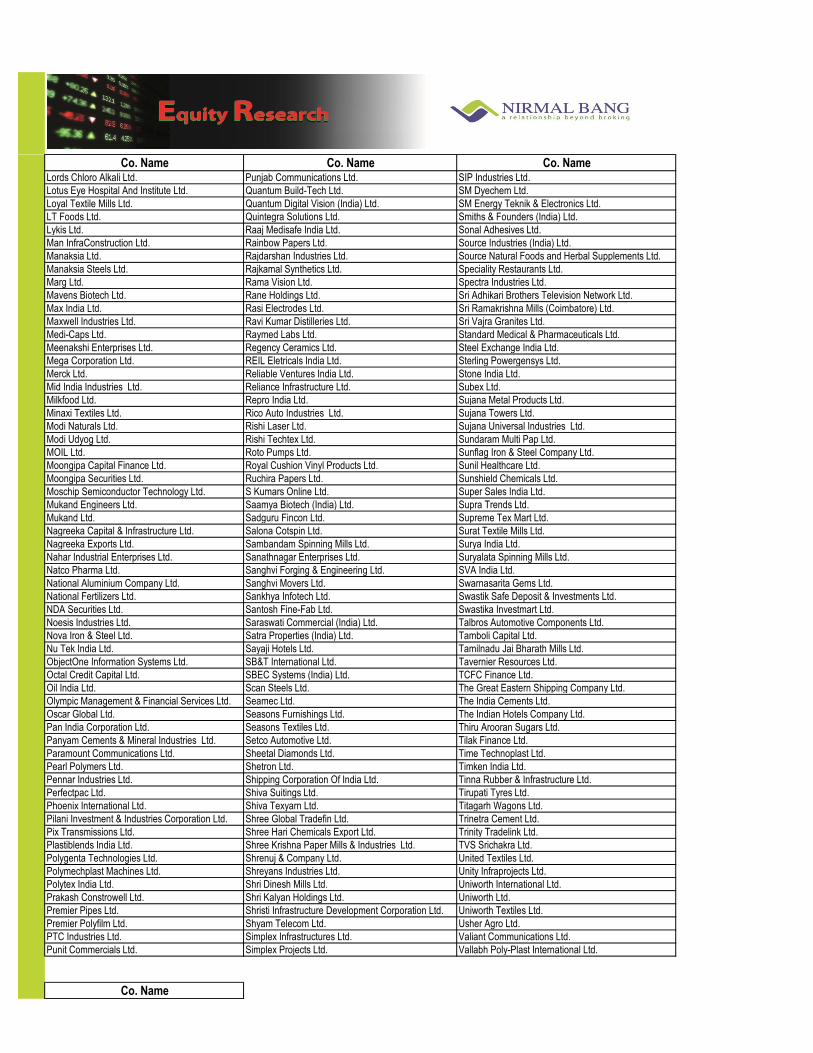
Co. Name Co. Name Co. NameLords Chloro Alkali Ltd. Punjab Communications Ltd. SIP Industries Ltd.
Lotus Eye Hospital And Institute Ltd. Quantum Build-Tech Ltd. SM Dyechem Ltd.
Loyal Textile Mills Ltd. Quantum Digital Vision (India) Ltd. SM Energy Teknik & Electronics Ltd.
LT Foods Ltd. Quintegra Solutions Ltd. Smiths & Founders (India) Ltd.
Lykis Ltd. Raaj Medisafe India Ltd. Sonal Adhesives Ltd.
Man InfraConstruction Ltd. Rainbow Papers Ltd. Source Industries (India) Ltd.
Manaksia Ltd. Rajdarshan Industries Ltd. Source Natural Foods and Herbal Supplements Ltd.
Manaksia Steels Ltd. Rajkamal Synthetics Ltd. Speciality Restaurants Ltd.
Marg Ltd. Rama Vision Ltd. Spectra Industries Ltd.
Mavens Biotech Ltd. Rane Holdings Ltd. Sri Adhikari Brothers Television Network Ltd.
Max India Ltd. Rasi Electrodes Ltd. Sri Ramakrishna Mills (Coimbatore) Ltd.
Maxwell Industries Ltd. Ravi Kumar Distilleries Ltd. Sri Vajra Granites Ltd.
Medi-Caps Ltd. Raymed Labs Ltd. Standard Medical & Pharmaceuticals Ltd.
Meenakshi Enterprises Ltd. Regency Ceramics Ltd. Steel Exchange India Ltd.
Mega Corporation Ltd. REIL Eletricals India Ltd. Sterling Powergensys Ltd.
Merck Ltd. Reliable Ventures India Ltd. Stone India Ltd.
Mid India Industries Ltd. Reliance Infrastructure Ltd. Subex Ltd.
Milkfood Ltd. Repro India Ltd. Sujana Metal Products Ltd.
Minaxi Textiles Ltd. Rico Auto Industries Ltd. Sujana Towers Ltd.
Modi Naturals Ltd. Rishi Laser Ltd. Sujana Universal Industries Ltd.
Modi Udyog Ltd. Rishi Techtex Ltd. Sundaram Multi Pap Ltd.
MOIL Ltd. Roto Pumps Ltd. Sunflag Iron & Steel Company Ltd.
Moongipa Capital Finance Ltd. Royal Cushion Vinyl Products Ltd. Sunil Healthcare Ltd.
Moongipa Securities Ltd. Ruchira Papers Ltd. Sunshield Chemicals Ltd.
Moschip Semiconductor Technology Ltd. S Kumars Online Ltd. Super Sales India Ltd.
Mukand Engineers Ltd. Saamya Biotech (India) Ltd. Supra Trends Ltd.
Mukand Ltd. Sadguru Fincon Ltd. Supreme Tex Mart Ltd.
Nagreeka Capital & Infrastructure Ltd. Salona Cotspin Ltd. Surat Textile Mills Ltd.
Nagreeka Exports Ltd. Sambandam Spinning Mills Ltd. Surya India Ltd.
Nahar Industrial Enterprises Ltd. Sanathnagar Enterprises Ltd. Suryalata Spinning Mills Ltd.
Natco Pharma Ltd. Sanghvi Forging & Engineering Ltd. SVA India Ltd.
National Aluminium Company Ltd. Sanghvi Movers Ltd. Swarnasarita Gems Ltd.
National Fertilizers Ltd. Sankhya Infotech Ltd. Swastik Safe Deposit & Investments Ltd.
NDA Securities Ltd. Santosh Fine-Fab Ltd. Swastika Investmart Ltd.
Noesis Industries Ltd. Saraswati Commercial (India) Ltd. Talbros Automotive Components Ltd.
Nova Iron & Steel Ltd. Satra Properties (India) Ltd. Tamboli Capital Ltd.
Nu Tek India Ltd. Sayaji Hotels Ltd. Tamilnadu Jai Bharath Mills Ltd.
ObjectOne Information Systems Ltd. SB&T International Ltd. Tavernier Resources Ltd.
Octal Credit Capital Ltd. SBEC Systems (India) Ltd. TCFC Finance Ltd.
Oil India Ltd. Scan Steels Ltd. The Great Eastern Shipping Company Ltd.
Olympic Management & Financial Services Ltd. Seamec Ltd. The India Cements Ltd.
Oscar Global Ltd. Seasons Furnishings Ltd. The Indian Hotels Company Ltd.
Pan India Corporation Ltd. Seasons Textiles Ltd. Thiru Arooran Sugars Ltd.
Panyam Cements & Mineral Industries Ltd. Setco Automotive Ltd. Tilak Finance Ltd.
Paramount Communications Ltd. Sheetal Diamonds Ltd. Time Technoplast Ltd.
Pearl Polymers Ltd. Shetron Ltd. Timken India Ltd.
Pennar Industries Ltd. Shipping Corporation Of India Ltd. Tinna Rubber & Infrastructure Ltd.
Perfectpac Ltd. Shiva Suitings Ltd. Tirupati Tyres Ltd.
Phoenix International Ltd. Shiva Texyarn Ltd. Titagarh Wagons Ltd.
Pilani Investment & Industries Corporation Ltd. Shree Global Tradefin Ltd. Trinetra Cement Ltd.
Pix Transmissions Ltd. Shree Hari Chemicals Export Ltd. Trinity Tradelink Ltd.
Plastiblends India Ltd. Shree Krishna Paper Mills & Industries Ltd. TVS Srichakra Ltd.
Polygenta Technologies Ltd. Shrenuj & Company Ltd. United Textiles Ltd.
Polymechplast Machines Ltd. Shreyans Industries Ltd. Unity Infraprojects Ltd.
Polytex India Ltd. Shri Dinesh Mills Ltd. Uniworth International Ltd.
Prakash Constrowell Ltd. Shri Kalyan Holdings Ltd. Uniworth Ltd.
Premier Pipes Ltd. Shristi Infrastructure Development Corporation Ltd. Uniworth Textiles Ltd.
Premier Polyfilm Ltd. Shyam Telecom Ltd. Usher Agro Ltd.
PTC Industries Ltd. Simplex Infrastructures Ltd. Valiant Communications Ltd.
Punit Commercials Ltd. Simplex Projects Ltd. Vallabh Poly-Plast International Ltd.
Co. Name

Exp
ecte
d R
esu
lts
on
12
Au
gu
st 2
015
VBC Ferro Alloys Ltd.
VCK Capital Market Services Ltd.
Vegepro Foods & Feeds Ltd.
Venmax Drugs And Pharmaceuticals Ltd.
Vidhi Dyestuffs Manufacturing Ltd.
Vijay Shanthi Builders Ltd.
Vikas GlobalOne Ltd.
Vipul Ltd.
Vivo Bio Tech Ltd.
VJTF Eduservices Ltd.
Voltas Ltd.
VST Industries Ltd.
Vyapar Industries Ltd.
Waterbase Ltd.
Weizmann Forex Ltd.
Weizmann Ltd.
Welspun Enterprises Ltd.
West Leisure Resorts Ltd.
Western India Cottons Ltd.
Western Ministil Ltd.
Wheels India Ltd.
Winro Commercial (India) Ltd.
Winsome Diamonds and Jewellery Ltd.
Wires & Fabriks (S.A.) Ltd.
Wonderla Holidays Ltd.
WW Technology Holdings Ltd.
Zicom Electronic Security Systems Ltd.
Zodiac Clothing Company Ltd.
Zuari Agro Chemicals Ltd.
Zuari Global Ltd.

Co_Name Year Equity N.Sale O.O.I T. Exp O.I PBIDT Int. Dep. PBT T.Tax PAT A.PAT EPS Div (%)
Aagam Capital 201406 5.00 0.04 0.02 0.02 0.00 0.00 0.02 -0.01 0.03 0.03 0.06 0 S
Aagam Capital 201409 5.00 0.04 0.01 0.03 0.03 0.03 0.03 0.06 0 S
Aagam Capital 201412 5.00 0.04 0.01 0.03 0.00 0.03 0.03 0.03 0.06 0 S
Aagam Capital 201503 5.00 0.05 0.02 0.03 0.00 0.03 0.03 0.03 -0.05 0 S
Aarcon Facilities 201406 5.06 0.01 0.04 0.02 -0.02 -0.02 -0.02 -0.02 0 S
Aarcon Facilities 201409 5.06 0.05 0.01 -0.04 -0.04 -0.04 -0.04 0 S
Aarcon Facilities 201412 5.06 0.06 0.10 0.05 0.01 0.01 0.01 0.01 0 S
Aarcon Facilities 201503 5.06 0.28 0.12 0.01 0.18 0.13 0.05 0.08 -0.03 -0.03 0 S
Abbott India 201406 21.25 516.91 10.34 457.16 9.60 79.69 0.01 3.49 76.19 25.26 50.93 50.93 23.97 310 S
Abbott India 201409 21.25 577.42 11.29 500.70 12.21 100.22 0.01 4.43 95.78 32.04 63.74 63.74 30.00 310 S
Abbott India 201412 21.25 562.28 11.26 487.69 12.60 98.45 0.02 3.64 94.79 30.26 64.53 64.53 30.37 310 S
Abbott India 201503 21.25 580.99 19.72 532.80 13.53 81.44 0.46 3.38 77.60 27.84 49.76 49.76 23.42 310 S
Abhishek Corporation 201406 16.01 5.29 5.22 0.00 0.07 14.75 3.72 -18.40 0.00 -18.40 -18.40 -11.50 0 S
Abhishek Corporation 201409 16.01 1.73 5.02 0.48 -2.81 15.42 3.72 -21.95 -21.95 -21.95 -13.71 0 S
Abhishek Corporation 201412 16.01 2.33 6.04 -3.71 16.13 3.72 -23.56 -23.56 -23.56 -14.72 0 S
Abhishek Corporation 201503 16.01 1.62 5.10 0.16 -3.33 16.86 1.17 -21.35 -21.35 -21.35 -12.56 0 S
ABL Biotechnologies 201406 8.20 0.00 0.02 -0.02 0.02 -0.04 -0.04 -0.04 -0.05 0 C
ABL Biotechnologies 201409 8.20 0.02 0.00 -0.02 0.02 -0.04 -0.04 -0.04 -0.05 0 C
ABL Biotechnologies 201412 8.20 0.00 0.02 -0.02 0.02 -0.04 -0.04 -0.04 -0.05 0 C
ABL Biotechnologies 201503 8.20 0.00 0.02 -0.02 0.02 -0.04 -0.04 -0.04 -0.04 0 C
Accel Transmatic 201406 11.04 0.30 0.56 0.04 -0.23 0.22 0.67 -1.63 -1.63 -1.63 -1.48 0 S
Accel Transmatic 201409 11.04 0.13 0.48 0.03 -0.33 0.29 0.67 -1.29 -1.29 -1.29 -1.16 0 S
Accel Transmatic 201412 11.04 0.12 0.54 0.03 -0.39 0.16 0.67 -1.22 -1.22 -1.22 -1.11 0 S
Accel Transmatic 201503 11.04 0.23 2.52 0.21 -2.08 0.21 0.64 -2.92 -2.92 -2.92 -2.65 0 S
Acropetal Technologies 201406 38.89 8.69 8.24 1.12 1.57 3.59 6.97 -9.00 -9.00 -10.40 -2.67 0 C
Acropetal Technologies 201409 38.89 10.53 18.10 4.88 -2.69 3.63 6.99 -13.31 -13.31 -14.75 -3.79 0 C
Acropetal Technologies 201412 38.89 3.89 2.76 -5.96 -4.84 3.81 7.67 -16.33 -16.33 -17.73 -4.56 0 C
Acropetal Technologies 201503 38.89 8.48 178.78 5.84 -164.46 9.12 12.32 -178.88 -8.78 -170.10 -175.38 0 C
Adarsh Plant Protect 201406 9.90 2.28 2.28 -0.01 0.13 0.06 -0.20 -0.20 -0.20 -0.20 0 S
Adarsh Plant Protect 201409 9.90 1.98 0.01 2.01 -0.02 0.15 0.06 -0.22 -0.22 -0.22 -0.23 0 S
Adarsh Plant Protect 201412 9.91 2.27 0.01 2.28 0.00 0.13 0.06 -0.19 -0.20 -0.19 -0.20 0 S
Adarsh Plant Protect 201503 9.91 2.34 0.04 2.32 0.05 0.13 0.04 -0.11 -0.11 -0.11 -0.12 0 S
ADF Foods 201406 22.38 52.86 3.13 49.43 1.97 8.53 0.35 2.71 5.48 1.44 4.03 4.22 1.83 15 C
ADF Foods 201409 22.38 44.10 1.99 42.28 2.45 6.25 0.37 2.86 3.03 0.53 2.50 2.72 1.14 15 C
ADF Foods 201412 22.38 43.75 2.37 44.74 1.76 3.14 0.36 2.88 1.64 0.15 1.49 1.31 0.66 15 C
ADF Foods 201503 22.38 54.27 1.33 51.72 0.90 4.78 0.31 2.91 1.55 0.73 0.82 0.82 0.37 15 C
Adinath Bio-Lab 201406 22.07 0.30 0.22 0.03 0.11 0.06 0.05 0.05 0.05 0 S
Adinath Bio-Lab 201409 22.07 0.29 0.21 0.02 0.10 0.06 0.04 0.04 0.04 0 S
Adinath Bio-Lab 201412 22.07 0.32 0.23 0.02 0.12 0.06 0.06 0.06 0.06 0 S
Adinath Bio-Lab 201503 22.07 0.45 0.32 0.13 0.12 0.01 0.01 0.01 0 S
Aditya Birla Nuvo 201406 130.08 6126.56 80.57 5008.97 74.60 1272.76 408.79 404.99 445.65 167.60 278.05 263.70 20.27 70 C
Aditya Birla Nuvo 201409 130.12 6493.76 103.49 5187.76 107.00 1516.49 419.95 381.82 714.72 236.94 477.78 452.05 34.75 70 C
Aditya Birla Nuvo 201412 130.13 6539.35 100.62 5248.72 92.76 1484.01 440.94 451.89 591.18 198.86 392.32 368.14 28.29 70 C
Aditya Birla Nuvo 201503 130.14 6957.36 116.13 5678.71 131.87 1526.65 489.57 464.05 573.03 230.08 342.95 331.63 25.48 70 C
Aksharchem (India) 201406 4.95 38.59 0.04 31.78 6.86 0.37 0.39 6.09 2.01 4.09 4.09 8.25 50 S
Aksharchem (India) 201409 4.95 47.59 0.12 39.33 1.20 9.57 0.83 0.98 8.92 2.03 6.88 6.88 9.41 50 S
Aksharchem (India) 201412 4.95 45.95 0.02 40.89 0.41 5.48 0.77 0.96 3.75 1.32 2.43 2.43 3.32 50 S
Aksharchem (India) 201503 7.31 50.16 0.10 44.21 0.39 6.45 0.84 1.00 4.61 2.03 2.58 2.58 3.53 50 S
Exp
ecte
d R
esu
lts
on
12
Au
gu
st 2
015

Co_Name Year Equity N.Sale O.O.I T. Exp O.I PBIDT Int. Dep. PBT T.Tax PAT A.PAT EPS Div (%)
Exp
ecte
d R
esu
lts
on
12
Au
gu
st 2
015
Albert David 201406 5.71 82.08 0.22 74.77 0.33 7.86 0.84 4.17 2.84 0.92 1.92 1.92 3.36 50 S
Albert David 201409 5.71 94.22 0.27 80.57 0.57 14.49 0.56 3.48 10.45 3.39 7.06 7.06 12.37 50 S
Albert David 201412 5.71 76.41 0.16 71.53 0.45 5.49 0.58 3.86 1.05 0.39 0.67 0.67 1.17 50 S
Albert David 201503 5.71 70.48 0.26 60.92 0.45 10.26 0.44 3.90 5.93 1.87 4.06 4.06 7.11 50 S
Alembic 201406 53.41 30.07 2.66 26.87 0.40 6.26 0.39 1.94 3.93 0.76 3.17 3.17 0.12 8 S
Alembic 201409 53.41 36.35 3.13 35.06 17.31 21.73 0.01 1.78 19.94 0.69 19.25 19.25 0.72 8 S
Alembic 201412 53.41 35.80 2.38 39.49 0.22 -1.09 1.86 -2.95 -0.45 -2.50 -2.50 -0.09 8 S
Alembic 201503 53.41 32.28 1.67 33.00 2.09 3.04 0.01 0.45 2.58 -1.67 4.25 4.25 0.16 8 S
Amit Securities 201406 7.33 1.14 0.06 1.17 0.18 0.22 0.22 0.02 0.20 0.20 0.28 0 S
Amit Securities 201409 7.33 1.16 0.16 1.19 0.13 0.13 0.04 0.09 0.09 0.12 0 S
Amit Securities 201412 7.33 1.50 0.16 1.53 0.13 0.13 0.03 0.10 0.10 0.14 0 S
Amit Securities 201503 7.33 1.09 0.15 1.13 0.11 0.11 0.04 0.07 0.07 0.10 0 S
Anant Raj 201406 59.02 70.91 47.85 1.93 24.98 4.48 6.09 14.42 2.77 11.65 10.71 0.39 12 C
Anant Raj 201409 59.02 194.79 30.60 1.81 166.00 27.89 6.89 131.23 28.31 102.87 102.64 3.49 12 C
Anant Raj 201412 59.02 73.04 43.89 1.25 30.40 6.52 7.93 15.95 3.83 12.11 11.91 0.41 12 C
Anant Raj 201503 59.02 145.34 110.84 1.82 36.32 15.76 7.55 14.96 -1.52 16.53 17.10 0.56 12 C
Anjani Dham Industries 201406 9.50 61.48 59.09 0.06 2.45 1.72 0.54 0.19 0.19 0.19 0.20 0 S
Anjani Dham Industries 201409 9.50 62.17 59.63 0.03 2.58 1.93 0.57 0.08 0.08 0.08 0.08 0 S
Anjani Dham Industries 201412 9.50 62.12 58.92 0.06 3.26 2.61 0.57 0.08 0.08 0.08 0.08 0 S
Anjani Dham Industries 201503 9.50 60.16 57.43 0.17 2.90 1.84 0.84 0.22 0.22 0.22 0.23 0 S
Anjani Foods 201406 3.99 4.99 4.98 0.08 0.10 0.14 0.14 -0.18 0.02 -0.20 -0.17 -0.43 0 C
Anjani Foods 201409 3.99 5.56 5.38 0.11 0.30 0.14 0.14 0.01 0.03 -0.02 -0.06 -0.15 0 C
Anjani Foods 201412 3.99 3.40 3.30 0.14 0.24 0.14 0.13 -0.04 0.00 -0.03 -0.02 -0.06 0 C
Anjani Foods 201503 3.99 2.65 2.69 0.47 0.44 0.12 0.24 0.08 0.15 -0.07 -0.03 -0.06 0 C
Anshuni Commercials 201406 0.24 0.04 0.02 -0.01 -0.01 -0.01 -0.01 -0.52 0 S
Anshuni Commercials 201409 0.24 0.02 0.03 0.01 0.01 0.01 0.01 0.49 0 S
Anshuni Commercials 201412 0.24 0.02 0.02 0.01 0.01 0.01 0.01 0.20 0 S
Anshuni Commercials 201503 0.24 0.48 0.43 0.03 0.08 0.00 0.01 0.06 0.02 0.04 0.04 1.76 0 S
Apollo Finvest (India) 201406 3.74 1.37 0.19 0.02 1.20 0.00 1.19 1.19 1.19 3.19 0 S
Apollo Finvest (India) 201409 3.74 0.53 0.22 0.02 0.33 0.00 0.32 0.32 0.32 0.87 0 S
Apollo Finvest (India) 201412 3.74 0.50 0.19 0.02 0.32 0.01 0.31 0.31 0.31 0.84 0 S
Apollo Finvest (India) 201503 3.74 0.92 0.39 0.02 0.55 0.05 0.50 0.57 -0.07 -0.07 -0.19 0 S
Appu Marketing & Manufacturing 201406 14.58 0.54 0.50 0.03 0.03 0.01 0.02 0.02 0.01 0 C
Appu Marketing & Manufacturing 201409 14.58 2.02 2.04 0.02 0.00 0.00 0.00 0.00 0 S
Appu Marketing & Manufacturing 201412 14.58 2.04 2.00 0.00 0.05 0.05 0.02 0.03 0.03 0.02 0 S
Appu Marketing & Manufacturing 201503 14.58 0.59 0.87 0.34 0.06 0.06 0.02 0.04 0.04 0.03 0 S
Aravali Securities & Finance 201406 15.15 0.13 0.17 0.08 0.04 0.28 0.03 -0.27 -0.27 -0.27 -0.18 0 S
Aravali Securities & Finance 201409 15.15 0.24 0.16 0.15 0.22 0.40 0.03 -0.20 -0.20 -0.20 -0.13 0 S
Aravali Securities & Finance 201412 15.15 0.23 0.20 0.18 0.22 0.45 0.03 -0.27 -0.27 -0.27 -0.18 0 S
Aravali Securities & Finance 201503 15.15 0.28 1.99 0.11 -1.60 0.53 0.02 -2.16 -2.16 -2.16 -1.42 0 S
Arcuttipore Tea Company 201406 5.02 0.77 0.00 0.62 0.15 0.08 0.04 0.03 0.03 0.03 0.01 0 S
Arcuttipore Tea Company 201409 5.02 0.85 0.00 0.26 0.59 0.10 0.04 0.44 0.44 0.44 0.09 0 S
Arcuttipore Tea Company 201412 5.02 1.58 0.00 1.68 -0.11 0.10 0.05 -0.25 -0.25 -0.25 -0.05 0 S
Arcuttipore Tea Company 201503 5.02 1.39 0.49 2.48 -0.60 0.06 -0.04 -0.62 -0.62 -0.62 -0.12 0 S
Aris International 201406 4.62 0.06 0.02 0.05 0.05 0.05 0.05 0.11 0 S
Aris International 201409 4.62 0.00 0.00 0.00 0.00 0.00 0 S
Aris International 201412 4.62 0.02 -0.02 -0.02 -0.02 -0.02 0 S
Aris International 201503 0.46 0.03 0.05 0.00 -0.02 -0.02 -0.02 -0.02 0 S

Co_Name Year Equity N.Sale O.O.I T. Exp O.I PBIDT Int. Dep. PBT T.Tax PAT A.PAT EPS Div (%)
Exp
ecte
d R
esu
lts
on
12
Au
gu
st 2
015
Arman Holdings 201406 5.21 0.11 0.18 0.03 -0.04 -0.04 -0.04 -0.04 -0.08 0 S
Arman Holdings 201409 5.21 0.11 0.14 0.03 0.00 0.00 0.00 0.00 0 S
Arman Holdings 201412 5.21 0.17 0.19 0.03 0.02 0.02 0.02 0.02 0.04 0 S
Arman Holdings 201503 5.21 0.39 0.40 0.07 0.05 0.05 0.01 0.04 0.04 0.07 0 S
Arnav Corporation 201406 45.16 1.51 1.46 0.05 0.00 0.05 0.05 0.05 0.01 0 S
Arnav Corporation 201409 45.16 2.26 2.17 0.09 0.00 0.08 0.08 0.08 0.19 0 S
Arnav Corporation 201412 89.42 4.15 4.07 0.08 0.08 0.08 0.08 0.01 0 S
Arnav Corporation 201503 89.42 2.53 2.72 -0.19 0.00 0.00 -0.20 0.01 -0.20 -0.20 -0.02 0 S
Arnold Holdings 201406 5.01 2.39 1.95 0.43 0.43 0.43 0.43 0.86 5 S
Arnold Holdings 201409 5.01 5.80 5.33 0.47 0.47 0.47 0.47 0.94 5 S
Arnold Holdings 201412 5.01 10.13 9.65 0.48 0.48 0.48 0.48 0.95 5 S
Arnold Holdings 201503 5.01 13.46 12.98 0.49 0.63 0.01 -0.15 0.21 -0.36 -0.36 -0.71 5 S
Aroni Commercials 201406 4.13 1.55 0.15 0.05 1.45 0.02 1.44 1.44 1.44 3.48 0 S
Aroni Commercials 201409 4.13 0.81 0.22 0.59 1.18 0.04 0.02 1.13 1.13 1.13 2.73 0 S
Aroni Commercials 201412 4.13 0.55 0.23 0.02 0.33 0.02 0.32 0.32 0.32 0.77 0 S
Aroni Commercials 201503 4.13 0.25 0.03 -0.22 0.02 -0.24 0.16 -0.40 -0.40 -0.98 0 S
Arun Varun Trade & Investment 201406 0.40 0.44 0.03 0.41 0.01 0.02 0.39 0.12 0.27 0.27 6.68 0 S
Arun Varun Trade & Investment 201409 0.40 0.41 0.02 0.39 0.01 0.02 0.37 0.07 0.30 0.30 7.38 0 S
Arun Varun Trade & Investment 201412 0.40 0.55 0.02 0.54 0.01 0.05 0.48 0.05 0.44 0.44 10.96 0 S
Arun Varun Trade & Investment 201503 0.40 0.55 0.12 0.44 0.01 0.02 0.41 0.08 0.33 0.33 8.25 0 S
Asahi Songwon Colors 201406 12.27 81.00 0.20 70.89 10.31 1.69 2.03 6.60 2.38 4.22 4.22 3.43 35 S
Asahi Songwon Colors 201409 12.27 58.20 0.40 50.39 8.21 1.16 1.51 5.92 1.84 4.08 4.08 3.33 35 S
Asahi Songwon Colors 201412 12.27 66.42 0.08 56.02 10.48 1.12 1.52 7.84 2.69 5.15 5.15 4.19 35 S
Asahi Songwon Colors 201503 12.27 51.45 0.29 42.77 8.97 1.25 1.59 6.13 1.86 4.27 4.27 3.48 35 S
Ashok Leyland 201406 266.07 2434.62 43.18 2361.72 23.12 139.20 106.34 103.32 -70.45 -22.50 -47.95 -47.95 -0.18 45 S
Ashok Leyland 201409 284.59 3150.37 67.31 2983.29 25.70 260.09 100.75 103.08 165.24 44.55 120.69 120.69 0.42 45 S
Ashok Leyland 201412 284.59 3290.62 70.37 3122.85 19.32 257.47 98.22 99.86 59.40 27.30 32.10 32.10 0.11 45 S
Ashok Leyland 201503 284.59 4435.53 70.17 4048.61 37.25 494.34 88.21 110.08 288.02 58.04 229.97 229.97 0.81 45 S
Asian Food Products 201406 1.58 0.01 0.00 -0.01 -0.01 -0.01 -0.01 -0.07 0 S
Asian Food Products 201409 1.58 0.01 0.00 0.00 0.00 0.00 0.00 -0.01 0 S
Asian Food Products 201412 1.58 0.01 0.00 0.00 0.00 0.00 0.00 -0.01 0 S
Asian Food Products 201503 1.58 0.01 0.01 0.01 0.01 0.01 0.01 0.05 0 S
Asian Star Company 201406 16.01 853.87 820.33 0.14 33.69 6.24 2.79 24.66 4.99 19.67 19.67 12.29 15 C
Asian Star Company 201409 16.01 786.16 753.99 0.17 32.34 6.94 5.11 20.29 3.51 16.79 16.79 10.65 15 C
Asian Star Company 201412 16.01 708.65 680.15 0.20 28.70 7.58 4.08 22.75 3.03 19.72 19.72 12.32 15 C
Asian Star Company 201503 16.01 872.58 829.84 1.14 43.89 6.11 4.14 33.63 7.85 25.79 25.79 16.11 15 C
Asian Tea & Exports 201406 10.00 3.96 0.05 3.77 0.24 0.11 0.02 0.10 0.10 0.10 0.10 0 C
Asian Tea & Exports 201409 10.00 5.67 0.13 5.61 0.19 0.06 0.03 0.11 0.11 0.11 0.11 0 C
Asian Tea & Exports 201412 10.00 11.19 0.04 10.91 0.33 0.20 0.03 0.10 0.10 0.10 0.10 0 C
Asian Tea & Exports 201503 10.00 9.37 1.56 9.16 0.00 1.77 0.52 0.24 1.01 0.09 0.92 0.92 0 C
Astro Bio Systems 201406 17.22 0.02 0.02 0.00 0.00 0.00 0.00 0.00 0 S
Astro Bio Systems 201409 17.22 0.02 -0.02 0.00 -0.03 -0.03 -0.03 -0.01 0 S
Astro Bio Systems 201412 17.22 0.02 -0.02 0.00 -0.02 -0.02 -0.02 -0.01 0 S
Astro Bio Systems 201503 17.22 0.02 -0.02 0.00 -0.02 -0.02 -0.02 -0.01 0 S
ATV Projects India 201406 52.56 2.91 2.85 0.20 0.27 0.21 0.06 0.06 0.06 0.01 0 S
ATV Projects India 201409 52.56 9.06 8.93 0.22 0.35 0.21 0.15 0.15 0.15 0.10 0 S
ATV Projects India 201412 52.56 10.97 10.68 0.00 0.29 0.05 0.24 0.24 0.24 0.03 0 S
ATV Projects India 201503 52.56 39.83 38.35 0.32 1.80 0.07 1.73 1.73 1.73 6.77 0 S

Co_Name Year Equity N.Sale O.O.I T. Exp O.I PBIDT Int. Dep. PBT T.Tax PAT A.PAT EPS Div (%)
Exp
ecte
d R
esu
lts
on
12
Au
gu
st 2
015
AUNDE India 201406 10.72 31.55 28.84 0.11 2.82 2.47 0.76 -0.41 0.12 -0.53 -0.53 -0.50 0 S
AUNDE India 201409 10.72 31.32 28.18 0.37 3.51 2.30 1.04 0.17 0.17 0.17 0.16 0 S
AUNDE India 201412 10.72 27.27 23.71 0.07 3.63 1.95 1.06 -0.28 -0.28 -0.28 -0.26 0 S
AUNDE India 201503 10.72 22.23 26.63 0.28 -4.12 2.03 1.04 -7.19 -2.48 -4.71 -4.71 -4.39 0 S
Auro Laboratories 201406 6.23 6.83 6.27 0.08 0.63 0.36 0.19 0.08 0.00 0.08 0.08 0.13 0 S
Auro Laboratories 201409 6.23 8.99 8.28 0.01 0.72 0.42 0.20 0.09 0.09 0.09 0.15 0 S
Auro Laboratories 201412 6.23 8.33 7.59 0.03 0.77 0.46 0.21 0.09 0.09 0.09 0.15 0 S
Auro Laboratories 201503 6.23 8.51 7.68 0.13 0.96 0.31 0.12 0.54 0.54 0.54 0.86 0 S
Aurobindo Pharma 201406 29.15 2894.61 16.46 2252.92 12.23 670.38 18.85 90.83 560.70 146.43 414.27 415.43 14.25 450 C
Aurobindo Pharma 201409 29.15 2862.19 19.03 2286.03 27.29 622.48 20.97 89.85 511.66 140.43 371.23 372.18 12.77 450 C
Aurobindo Pharma 201412 29.15 3142.46 23.70 2574.19 35.92 627.89 21.89 67.26 538.74 156.34 382.40 384.35 13.19 450 C
Aurobindo Pharma 201503 29.20 3143.97 18.10 2505.98 7.93 664.02 22.60 84.67 556.75 153.40 403.35 403.80 13.84 450 C
AVI Photochem 201406 3.48 1.03 0.90 0.13 0.01 0.12 0.02 0.10 0.10 0.28 0 S
AVI Photochem 201409 3.48 0.60 0.25 0.35 0.01 0.34 0.01 0.34 0.34 0.97 0 S
AVI Photochem 201412 3.48 0.14 0.18 -0.04 0.01 -0.05 -0.05 -0.05 -0.21 0 S
AVI Photochem 201503 1.04 0.02 0.04 0.18 -0.13 0.00 0.01 -0.14 0.03 -0.17 -0.17 -0.16 0 S
Axiscades Engineering Technologies 201406 10.00 71.82 64.39 0.28 7.71 0.56 1.95 5.20 1.45 3.75 3.66 1.35 0 C
Axiscades Engineering Technologies 201409 13.61 79.15 0.25 69.42 0.48 10.45 0.39 1.83 6.21 1.87 4.34 4.22 1.59 0 C
Axiscades Engineering Technologies 201412 13.61 83.47 0.06 71.67 0.31 12.17 0.43 2.75 8.64 2.87 5.77 5.56 2.05 0 C
Axiscades Engineering Technologies 201503 13.61 83.15 71.02 0.59 12.72 0.55 2.81 8.77 2.82 5.95 5.98 2.19 0 C
Axtel Industries 201406 16.16 5.09 8.15 -0.01 -3.08 0.51 0.73 -4.31 -4.31 -4.31 -2.67 0 S
Axtel Industries 201409 16.16 5.15 10.36 0.07 -5.14 0.60 0.73 -6.47 -6.47 -6.47 -4.00 0 S
Axtel Industries 201412 16.16 8.81 6.00 0.12 2.92 0.58 0.73 1.62 1.62 1.62 1.00 0 S
Axtel Industries 201503 16.16 20.88 17.71 0.06 3.23 0.25 1.71 1.28 -0.35 1.63 1.63 1.01 0 S
Bafna Pharmaceuticals 201406 18.66 35.23 29.61 0.11 5.72 3.33 1.97 0.42 0.11 0.31 0.31 0.17 0 S
Bafna Pharmaceuticals 201409 18.66 23.19 41.77 20.92 0.64 44.68 4.05 1.66 36.28 3.06 33.22 33.22 17.81 0 S
Bafna Pharmaceuticals 201412 18.66 23.62 24.46 -0.01 -0.86 2.41 1.24 -4.51 0.14 -4.65 -4.65 -2.49 0 S
Bafna Pharmaceuticals 201503 18.66 19.37 -0.66 42.18 0.41 -23.05 2.69 0.36 -26.10 -3.33 -22.77 -22.77 -12.21 0 S
Ballarpur Industries 201406 131.12 1198.30 20.76 984.47 234.59 96.23 149.68 -11.32 -12.44 1.12 0.42 0.01 10 C
Ballarpur Industries 201409 131.12 1205.41 21.81 1009.48 217.74 111.09 120.43 -13.78 -14.19 0.41 1.67 0.03 10 C
Ballarpur Industries 201412 131.12 1189.19 21.23 1057.55 152.87 112.27 113.30 -72.70 1.08 -73.78 -50.60 -0.77 10 C
Ballarpur Industries 201503 131.12 1231.31 17.82 1029.44 219.69 88.70 104.36 24.08 -2.37 26.45 27.55 0.46 10 C
Balmer Lawrie & Company 201406 28.50 716.29 8.54 689.56 11.03 46.30 2.02 5.86 38.42 13.46 24.96 24.96 8.76 180 S
Balmer Lawrie & Company 201409 28.50 683.15 6.26 662.42 8.37 35.36 1.40 6.87 27.09 9.76 17.33 17.33 6.08 180 S
Balmer Lawrie & Company 201412 28.50 704.75 7.43 676.98 23.66 58.84 0.86 7.25 50.73 14.49 36.24 36.24 12.71 180 S
Balmer Lawrie & Company 201503 28.50 604.06 9.89 544.94 32.34 101.35 0.80 6.35 94.20 25.29 68.91 68.91 24.18 180 S
Balrampur Chini Mills 201406 24.49 804.36 757.72 2.69 49.33 31.42 21.87 -3.96 -3.96 -3.96 -0.16 0 S
Balrampur Chini Mills 201409 24.49 682.61 682.52 3.95 4.04 27.95 39.99 -63.90 0.00 -63.90 -63.90 -2.61 0 S
Balrampur Chini Mills 201412 24.49 841.69 868.42 2.93 -23.80 16.18 25.71 -65.69 0.00 -65.69 -65.69 -2.68 0 S
Balrampur Chini Mills 201503 24.49 658.32 555.87 9.51 111.96 26.54 28.03 57.39 -18.43 75.82 75.82 3.10 0 S
Bambino Agro Industries 201406 8.01 62.31 56.08 6.24 2.65 1.09 2.50 0.99 1.51 1.51 1.89 15 S
Bambino Agro Industries 201409 8.01 80.33 74.13 6.20 3.02 0.23 2.95 -0.64 3.59 3.59 4.48 15 S
Bambino Agro Industries 201412 8.01 61.45 55.97 5.48 2.72 0.89 1.87 0.27 1.60 1.60 2.00 15 S
Bambino Agro Industries 201503 8.01 64.47 57.77 6.71 3.87 0.37 2.46 2.40 0.06 0.06 0.08 15 S
Bank Of Maharashtra 201406 839.10 3095.69 633.61 190.43 471.36 2181.15 235.11 117.29 117.82 117.82 1.40 8 S
Bank Of Maharashtra 201409 1063.18 3197.52 625.49 222.04 588.06 2206.01 294.65 131.74 162.91 162.91 1.57 8 S
Bank Of Maharashtra 201412 1063.18 3154.93 590.42 211.92 619.27 2157.16 39.13 -18.11 57.24 57.24 0.54 8 S
Bank Of Maharashtra 201503 1063.18 3217.30 676.41 381.59 676.40 2246.08 244.49 131.77 112.72 112.72 1.06 8 S

Co_Name Year Equity N.Sale O.O.I T. Exp O.I PBIDT Int. Dep. PBT T.Tax PAT A.PAT EPS Div (%)
Exp
ecte
d R
esu
lts
on
12
Au
gu
st 2
015
Bannari Amman Spinning Mills 201406 15.75 168.38 4.18 146.11 26.45 10.26 7.49 8.70 2.70 6.00 6.00 3.81 20 S
Bannari Amman Spinning Mills 201409 15.75 159.85 4.48 142.51 21.82 10.14 7.57 4.12 1.53 2.58 2.58 1.64 20 S
Bannari Amman Spinning Mills 201412 15.75 162.80 2.61 146.85 18.56 8.34 7.18 3.03 1.00 2.03 2.03 1.29 20 S
Bannari Amman Spinning Mills 201503 15.75 176.26 1.87 165.38 1.31 14.06 7.46 4.43 3.30 1.09 2.21 2.21 1.40 20 S
Bartronics India 201406 34.05 5.18 5.36 0.98 0.79 11.96 11.36 -22.53 -2.66 -19.88 -19.88 -5.84 0 S
Bartronics India 201409 34.05 4.01 4.52 15.48 14.97 8.06 8.85 -1.94 -1.96 0.02 0.02 0 S
Bartronics India 201412 34.05 6.18 5.28 11.38 12.28 12.39 7.63 -7.74 -1.39 -6.35 -6.35 -1.86 0 S
Bartronics India 201503 34.05 7.24 6.36 -5.60 -4.72 12.36 4.77 -21.84 0.68 -22.52 -22.52 -6.61 0 S
BDH Industries 201406 5.76 12.18 0.00 11.06 0.31 1.44 0.14 0.19 1.10 0.36 0.75 0.75 1.29 12 S
BDH Industries 201409 5.76 12.08 0.01 11.08 0.34 1.34 0.13 0.17 1.04 0.31 0.73 0.73 1.27 12 S
BDH Industries 201412 5.76 8.16 0.00 7.41 0.27 1.03 0.15 0.18 0.70 0.23 0.47 0.47 0.82 12 S
BDH Industries 201503 5.76 12.18 0.00 11.27 0.30 1.21 0.06 0.20 0.96 0.33 0.63 0.63 1.09 12 S
Bimetal Bearings 201406 3.83 34.17 1.42 34.76 1.18 2.00 0.07 1.37 0.56 0.18 0.39 0.39 1.01 75 S
Bimetal Bearings 201409 3.83 43.02 1.74 40.68 1.98 6.06 0.06 1.61 4.40 1.37 3.02 3.02 7.91 75 S
Bimetal Bearings 201412 3.83 35.37 0.93 37.79 1.32 -0.17 0.07 1.45 -1.69 -0.50 -1.11 -1.19 -3.10 75 S
Bimetal Bearings 201503 3.83 38.67 1.92 38.07 1.24 3.75 0.12 -0.17 3.81 0.69 3.28 3.12 8.15 75 S
Binny 201406 11.16 2.39 0.63 0.10 1.86 0.22 0.07 1.57 0.29 1.28 1.28 0.57 0 S
Binny 201409 11.16 2.58 0.62 0.02 1.98 0.09 0.08 1.81 0.39 1.42 1.42 0.64 0 S
Binny 201412 11.16 2.14 0.67 0.31 1.78 0.91 0.08 0.79 0.15 0.64 0.64 0.29 0 S
Binny 201503 11.16 0.12 0.92 0.70 -0.10 1.22 0.42 -1.73 -0.36 -1.37 -1.37 -0.62 0 S
Birla Precision Technologies 201406 10.53 35.38 0.09 32.85 0.95 3.57 1.37 2.13 0.08 0.12 -0.04 -0.04 -0.01 0 S
Birla Precision Technologies 201409 10.53 40.58 0.13 37.83 0.96 3.84 1.80 1.33 0.71 0.43 0.28 0.28 0.05 0 S
Birla Precision Technologies 201412 10.53 38.01 0.29 34.67 0.56 4.20 1.87 1.58 0.75 0.28 0.48 0.48 0.09 0 S
Birla Precision Technologies 201503 10.53 40.14 0.63 39.46 1.14 2.45 2.39 1.57 -1.51 -0.21 -1.30 -1.30 -0.25 0 S
BJ Duplex Boards 201406 5.04 0.56 0.54 0.00 0.02 0.02 0.02 0.02 0.05 0 S
BJ Duplex Boards 201409 5.04 0.01 -0.01 -0.01 -0.01 -0.01 -0.03 0 S
BJ Duplex Boards 201412 5.04 0.02 -0.02 -0.02 -0.02 -0.02 -0.03 0 S
BJ Duplex Boards 201503 5.04 0.09 0.09 0.05 0.04 0.04 0.04 0.04 0.08 0 S
BKV Industries 201406 1.55 0.07 0.05 0.02 0.01 0.01 0.01 0.01 0.01 0 S
BKV Industries 201409 1.55 0.07 0.10 -0.03 0.00 -0.04 -0.04 -0.04 -0.02 0 S
BKV Industries 201412 1.55 0.07 0.06 0.01 0.01 0.01 0.01 0.01 0.01 0 S
BKV Industries 201503 1.55 0.07 0.00 0.06 0.01 0.00 0.02 0.00 0.01 0.01 0.01 0 S
Blue Pearl Texspin 201406 5.12 0.05 0.04 0.00 0.00 0.00 0.00 0.00 0 S
Blue Pearl Texspin 201409 5.12 0.06 0.06 0.00 0.00 0.00 0.00 0.00 0 S
Blue Pearl Texspin 201412 5.12 0.04 0.04 0 S
Blue Pearl Texspin 201503 5.12 0.02 0.02 0.00 0.00 0.00 0.00 0.00 0 S
BN Rathi Securities 201406 2.52 2.47 0.47 2.57 0.28 0.66 0.06 0.03 0.58 0.18 0.40 0.40 1.58 15 S
BN Rathi Securities 201409 2.52 2.92 0.55 3.03 0.49 0.93 0.09 0.14 0.69 0.24 0.45 0.45 1.80 15 S
BN Rathi Securities 201412 2.52 2.21 0.43 2.41 0.35 0.59 0.09 0.06 0.44 0.14 0.30 0.30 1.20 15 S
BN Rathi Securities 201503 2.52 3.02 0.26 3.18 0.54 0.64 0.14 0.11 0.40 0.14 0.26 0.26 1.02 15 S
Bodal Chemicals 201406 21.82 381.11 4.17 293.22 1.85 93.91 9.43 5.73 78.75 26.75 52.01 52.01 4.77 0 S
Bodal Chemicals 201409 21.82 247.07 2.44 212.22 1.82 39.10 5.95 5.80 27.36 9.27 18.09 18.09 1.65 0 S
Bodal Chemicals 201412 21.82 173.61 2.09 150.36 0.72 26.06 5.87 6.07 14.13 1.38 12.75 12.75 1.17 0 S
Bodal Chemicals 201503 21.82 234.02 0.81 205.25 0.32 29.91 6.04 4.66 19.22 10.04 9.18 9.18 0.84 0 S
BS 201406 43.90 501.76 433.23 0.45 68.98 30.72 9.18 28.61 9.54 19.07 19.07 0.43 10 C
BS 201409 43.94 713.43 649.66 2.44 66.20 33.36 9.26 23.11 7.45 15.66 15.66 0.36 10 C
BS 201412 43.98 688.44 617.85 1.62 72.21 34.50 13.83 23.41 7.67 15.74 15.74 0.36 10 C
BS 201503 43.98 769.53 0.00 677.12 4.64 97.05 42.63 15.86 38.05 13.33 24.72 24.72 10 C

Co_Name Year Equity N.Sale O.O.I T. Exp O.I PBIDT Int. Dep. PBT T.Tax PAT A.PAT EPS Div (%)
Exp
ecte
d R
esu
lts
on
12
Au
gu
st 2
015
BSEL Infrastructure Realty 201406 82.62 0.10 0.25 0.29 0.15 0.04 0.10 0.15 -0.05 -0.05 -0.01 0 S
BSEL Infrastructure Realty 201409 82.62 0.08 0.33 0.78 0.54 0.04 0.50 0.15 0.36 0.36 0.04 0 S
BSEL Infrastructure Realty 201412 82.62 0.11 0.39 0.59 0.32 0.04 0.28 0.28 0.28 0.03 0 S
BSEL Infrastructure Realty 201503 82.62 0.08 0.27 0.44 0.25 0.04 0.21 0.30 -0.10 -0.10 -0.01 0 S
Cadila Healthcare 201406 102.37 2020.38 29.74 1674.01 10.41 386.52 18.08 67.70 299.56 52.44 247.12 240.21 11.73 240 C
Cadila Healthcare 201409 102.37 2063.53 44.47 1687.01 14.61 435.60 17.26 73.29 345.28 57.13 288.15 278.09 13.58 240 C
Cadila Healthcare 201412 102.37 2159.54 29.92 1742.25 10.01 457.22 16.24 70.72 374.87 79.10 295.77 281.91 13.77 240 C
Cadila Healthcare 201503 102.37 2247.12 41.11 1792.36 20.34 516.21 16.28 75.54 425.82 70.75 355.07 350.38 17.11 240 C
Camson Bio Technologies 201406 28.33 46.24 39.04 0.02 7.22 1.15 3.34 2.73 -1.23 3.96 4.01 1.57 10 C
Camson Bio Technologies 201409 30.00 47.10 42.39 0.15 4.86 0.84 3.36 0.66 0.44 0.22 0.23 0.08 10 C
Camson Bio Technologies 201412 30.00 63.51 55.99 0.35 7.88 1.02 3.51 3.35 1.90 1.45 1.75 0.58 10 C
Camson Bio Technologies 201503 30.00 46.17 50.85 5.91 1.22 2.08 3.79 -4.65 0.87 -5.52 -4.06 -1.41 10 C
Career Point 201406 18.13 16.02 15.32 3.38 4.07 1.19 1.83 1.05 -1.28 2.33 2.46 1.36 0 C
Career Point 201409 18.13 16.70 14.94 2.03 3.79 1.20 1.81 -4.58 -2.43 -2.15 -2.06 -1.13 0 C
Career Point 201412 18.13 20.30 16.18 2.96 7.09 1.24 0.38 4.60 3.04 1.56 1.79 0.99 0 C
Career Point 201503 18.13 24.86 21.62 2.79 6.03 1.33 1.35 3.35 -0.16 3.51 3.63 2.00 0 C
Carnation Industries 201406 3.46 21.09 1.13 21.12 0.98 2.07 1.24 0.38 0.45 0.09 0.36 0.36 1.04 8 S
Carnation Industries 201409 3.46 24.81 1.42 24.27 0.36 2.33 1.31 0.49 0.54 0.31 0.22 0.22 0.65 8 S
Carnation Industries 201412 3.46 22.76 0.96 22.15 0.57 2.14 1.24 0.38 0.51 -0.10 0.61 0.61 1.77 8 S
Carnation Industries 201503 3.46 23.16 1.28 23.24 0.70 1.89 1.25 0.38 0.27 0.06 0.21 0.21 0.60 8 S
CG-VAK Software & Exports 201406 5.05 2.33 2.19 0.09 0.22 0.02 0.10 0.11 -0.01 0.12 0.12 0.23 5 S
CG-VAK Software & Exports 201409 5.05 2.87 2.39 0.08 0.55 0.01 0.11 0.44 0.04 0.39 0.39 0.78 5 S
CG-VAK Software & Exports 201412 5.05 2.94 2.30 0.10 0.75 0.02 0.10 0.62 0.19 0.43 0.43 0.85 5 S
CG-VAK Software & Exports 201503 5.05 2.40 2.06 -0.04 0.31 0.01 0.23 0.07 0.07 0.00 0.00 5 S
Chandra Prabhu International 201406 3.70 18.75 18.13 0.12 0.74 0.17 0.05 0.52 0.52 0.52 1.41 10 S
Chandra Prabhu International 201409 3.70 11.01 10.26 0.12 0.86 0.05 0.82 0.43 0.38 0.38 1.04 10 S
Chandra Prabhu International 201412 3.70 6.06 6.91 0.03 -0.82 0.03 0.05 -0.90 -0.28 -0.61 -0.61 -1.66 10 S
Chandra Prabhu International 201503 3.70 12.79 12.93 -0.01 -0.15 0.26 0.13 -0.54 -0.12 -0.42 -0.42 -1.14 10 S
Chokhani Securities 201406 4.70 0.77 0.04 0.00 0.73 0.73 0.05 0.68 0.68 1.45 0 S
Chokhani Securities 201409 4.70 0.39 0.08 0.60 0.91 0.91 0.06 0.85 0.85 1.80 0 S
Chokhani Securities 201412 4.70 -0.35 0.07 0.30 -0.12 -0.12 -0.12 -0.12 -0.25 0 S
Chokhani Securities 201503 4.70 -0.73 0.38 1.39 0.28 0.28 0.02 0.26 0.26 0.55 0 S
Cigniti Technologies 201406 22.92 77.18 -0.19 69.41 0.24 7.82 0.20 0.97 6.65 1.07 5.58 5.58 2.46 0 C
Cigniti Technologies 201409 22.92 80.55 0.32 73.62 0.30 7.55 0.62 1.34 5.58 -0.84 6.42 6.42 2.80 0 C
Cigniti Technologies 201412 24.74 103.78 0.38 88.74 0.11 15.54 0.66 2.33 12.55 3.08 9.46 9.46 3.82 0 C
Cigniti Technologies 201503 24.74 117.37 -0.12 107.61 0.52 10.16 1.46 0.79 7.56 2.23 5.33 5.33 2.29 0 C
Cimmco 201406 20.15 3.99 6.77 2.15 -0.63 2.59 0.71 -3.93 -3.93 -3.93 -0.87 0 S
Cimmco 201409 20.15 2.25 3.59 0.72 -0.63 1.71 0.71 -8.53 -8.53 -8.53 -1.42 0 S
Cimmco 201412 20.15 1.72 3.86 0.51 -1.64 1.98 0.71 -9.54 -9.54 -9.54 -4.73 0 S
Cimmco 201503 20.15 23.31 0.15 24.86 0.19 -1.21 1.49 0.73 -3.43 0.34 -3.78 -3.78 -1.87 0 S
City Union Bank 201406 54.27 643.33 124.74 110.70 172.69 456.61 130.00 30.50 99.50 99.50 1.83 110 S
City Union Bank 201409 59.49 682.85 123.52 90.15 172.85 476.63 118.25 24.50 93.75 93.75 1.61 110 S
City Union Bank 201412 59.66 684.50 139.26 97.79 168.30 474.74 141.20 38.50 102.70 102.70 1.73 110 S
City Union Bank 201503 59.66 688.18 131.31 105.47 178.82 483.52 131.58 32.50 99.08 99.08 1.66 110 S
CMS Finvest 201406 14.00 1.81 1.49 0.18 0.50 0.00 0.50 0.50 0.50 0.34 0 S
CMS Finvest 201409 14.00 0.03 0.51 0.19 -0.29 0.00 -0.29 -0.29 -0.29 -0.21 0 S
CMS Finvest 201412 14.00 0.48 0.76 0.15 -0.13 0.00 -0.13 -0.13 -0.13 -0.09 0 S
CMS Finvest 201503 14.00 1.61 1.79 0.24 0.06 0.00 0.06 0.06 0.06 0.04 0 S
Co_Name Year Equity N.Sale O.O.I T. Exp O.I PBIDT Int. Dep. PBT T.Tax PAT A.PAT EPS Div (%)
Exp
ecte
d R
esu
lts
on
12
Au
gu
st 2
015
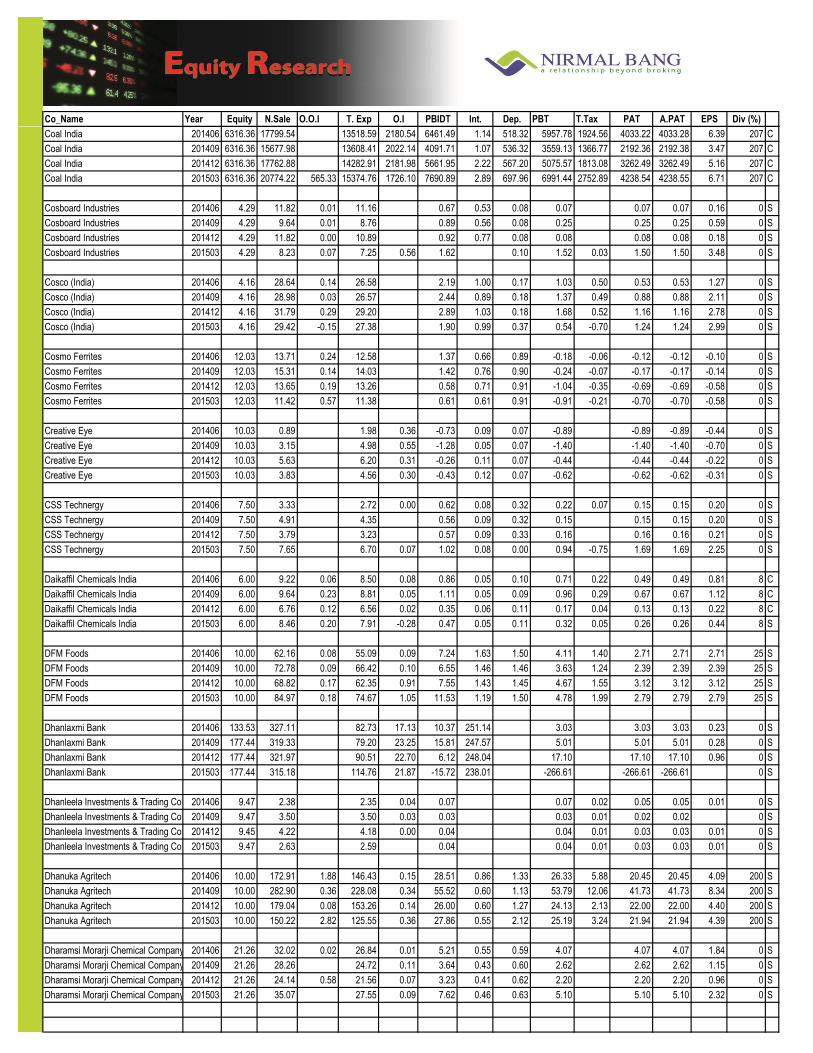
Coal India 201406 6316.36 17799.54 13518.59 2180.54 6461.49 1.14 518.32 5957.78 1924.56 4033.22 4033.28 6.39 207 C
Coal India 201409 6316.36 15677.98 13608.41 2022.14 4091.71 1.07 536.32 3559.13 1366.77 2192.36 2192.38 3.47 207 C
Coal India 201412 6316.36 17762.88 14282.91 2181.98 5661.95 2.22 567.20 5075.57 1813.08 3262.49 3262.49 5.16 207 C
Coal India 201503 6316.36 20774.22 565.33 15374.76 1726.10 7690.89 2.89 697.96 6991.44 2752.89 4238.54 4238.55 6.71 207 C
Cosboard Industries 201406 4.29 11.82 0.01 11.16 0.67 0.53 0.08 0.07 0.07 0.07 0.16 0 S
Cosboard Industries 201409 4.29 9.64 0.01 8.76 0.89 0.56 0.08 0.25 0.25 0.25 0.59 0 S
Cosboard Industries 201412 4.29 11.82 0.00 10.89 0.92 0.77 0.08 0.08 0.08 0.08 0.18 0 S
Cosboard Industries 201503 4.29 8.23 0.07 7.25 0.56 1.62 0.10 1.52 0.03 1.50 1.50 3.48 0 S
Cosco (India) 201406 4.16 28.64 0.14 26.58 2.19 1.00 0.17 1.03 0.50 0.53 0.53 1.27 0 S
Cosco (India) 201409 4.16 28.98 0.03 26.57 2.44 0.89 0.18 1.37 0.49 0.88 0.88 2.11 0 S
Cosco (India) 201412 4.16 31.79 0.29 29.20 2.89 1.03 0.18 1.68 0.52 1.16 1.16 2.78 0 S
Cosco (India) 201503 4.16 29.42 -0.15 27.38 1.90 0.99 0.37 0.54 -0.70 1.24 1.24 2.99 0 S
Cosmo Ferrites 201406 12.03 13.71 0.24 12.58 1.37 0.66 0.89 -0.18 -0.06 -0.12 -0.12 -0.10 0 S
Cosmo Ferrites 201409 12.03 15.31 0.14 14.03 1.42 0.76 0.90 -0.24 -0.07 -0.17 -0.17 -0.14 0 S
Cosmo Ferrites 201412 12.03 13.65 0.19 13.26 0.58 0.71 0.91 -1.04 -0.35 -0.69 -0.69 -0.58 0 S
Cosmo Ferrites 201503 12.03 11.42 0.57 11.38 0.61 0.61 0.91 -0.91 -0.21 -0.70 -0.70 -0.58 0 S
Creative Eye 201406 10.03 0.89 1.98 0.36 -0.73 0.09 0.07 -0.89 -0.89 -0.89 -0.44 0 S
Creative Eye 201409 10.03 3.15 4.98 0.55 -1.28 0.05 0.07 -1.40 -1.40 -1.40 -0.70 0 S
Creative Eye 201412 10.03 5.63 6.20 0.31 -0.26 0.11 0.07 -0.44 -0.44 -0.44 -0.22 0 S
Creative Eye 201503 10.03 3.83 4.56 0.30 -0.43 0.12 0.07 -0.62 -0.62 -0.62 -0.31 0 S
CSS Technergy 201406 7.50 3.33 2.72 0.00 0.62 0.08 0.32 0.22 0.07 0.15 0.15 0.20 0 S
CSS Technergy 201409 7.50 4.91 4.35 0.56 0.09 0.32 0.15 0.15 0.15 0.20 0 S
CSS Technergy 201412 7.50 3.79 3.23 0.57 0.09 0.33 0.16 0.16 0.16 0.21 0 S
CSS Technergy 201503 7.50 7.65 6.70 0.07 1.02 0.08 0.00 0.94 -0.75 1.69 1.69 2.25 0 S
Daikaffil Chemicals India 201406 6.00 9.22 0.06 8.50 0.08 0.86 0.05 0.10 0.71 0.22 0.49 0.49 0.81 8 C
Daikaffil Chemicals India 201409 6.00 9.64 0.23 8.81 0.05 1.11 0.05 0.09 0.96 0.29 0.67 0.67 1.12 8 C
Daikaffil Chemicals India 201412 6.00 6.76 0.12 6.56 0.02 0.35 0.06 0.11 0.17 0.04 0.13 0.13 0.22 8 C
Daikaffil Chemicals India 201503 6.00 8.46 0.20 7.91 -0.28 0.47 0.05 0.11 0.32 0.05 0.26 0.26 0.44 8 S
DFM Foods 201406 10.00 62.16 0.08 55.09 0.09 7.24 1.63 1.50 4.11 1.40 2.71 2.71 2.71 25 S
DFM Foods 201409 10.00 72.78 0.09 66.42 0.10 6.55 1.46 1.46 3.63 1.24 2.39 2.39 2.39 25 S
DFM Foods 201412 10.00 68.82 0.17 62.35 0.91 7.55 1.43 1.45 4.67 1.55 3.12 3.12 3.12 25 S
DFM Foods 201503 10.00 84.97 0.18 74.67 1.05 11.53 1.19 1.50 4.78 1.99 2.79 2.79 2.79 25 S
Dhanlaxmi Bank 201406 133.53 327.11 82.73 17.13 10.37 251.14 3.03 3.03 3.03 0.23 0 S
Dhanlaxmi Bank 201409 177.44 319.33 79.20 23.25 15.81 247.57 5.01 5.01 5.01 0.28 0 S
Dhanlaxmi Bank 201412 177.44 321.97 90.51 22.70 6.12 248.04 17.10 17.10 17.10 0.96 0 S
Dhanlaxmi Bank 201503 177.44 315.18 114.76 21.87 -15.72 238.01 -266.61 -266.61 -266.61 0 S
Dhanleela Investments & Trading Company 201406 9.47 2.38 2.35 0.04 0.07 0.07 0.02 0.05 0.05 0.01 0 S
Dhanleela Investments & Trading Company 201409 9.47 3.50 3.50 0.03 0.03 0.03 0.01 0.02 0.02 0 S
Dhanleela Investments & Trading Company 201412 9.45 4.22 4.18 0.00 0.04 0.04 0.01 0.03 0.03 0.01 0 S
Dhanleela Investments & Trading Company 201503 9.47 2.63 2.59 0.04 0.04 0.01 0.03 0.03 0.01 0 S
Dhanuka Agritech 201406 10.00 172.91 1.88 146.43 0.15 28.51 0.86 1.33 26.33 5.88 20.45 20.45 4.09 200 S
Dhanuka Agritech 201409 10.00 282.90 0.36 228.08 0.34 55.52 0.60 1.13 53.79 12.06 41.73 41.73 8.34 200 S
Dhanuka Agritech 201412 10.00 179.04 0.08 153.26 0.14 26.00 0.60 1.27 24.13 2.13 22.00 22.00 4.40 200 S
Dhanuka Agritech 201503 10.00 150.22 2.82 125.55 0.36 27.86 0.55 2.12 25.19 3.24 21.94 21.94 4.39 200 S
Dharamsi Morarji Chemical Company 201406 21.26 32.02 0.02 26.84 0.01 5.21 0.55 0.59 4.07 4.07 4.07 1.84 0 S
Dharamsi Morarji Chemical Company 201409 21.26 28.26 24.72 0.11 3.64 0.43 0.60 2.62 2.62 2.62 1.15 0 S
Dharamsi Morarji Chemical Company 201412 21.26 24.14 0.58 21.56 0.07 3.23 0.41 0.62 2.20 2.20 2.20 0.96 0 S
Dharamsi Morarji Chemical Company 201503 21.26 35.07 27.55 0.09 7.62 0.46 0.63 5.10 5.10 5.10 2.32 0 S

Co_Name Year Equity N.Sale O.O.I T. Exp O.I PBIDT Int. Dep. PBT T.Tax PAT A.PAT EPS Div (%)
Exp
ecte
d R
esu
lts
on
12
Au
gu
st 2
015
Dhenu Buildcon India 201406 1.83 3.79 3.77 0.02 0.02 0.02 0.02 0.01 0 S
Dhenu Buildcon India 201409 1.83 4.22 4.22 0.02 0.02 0.00 0.02 0.02 0.01 0 S
Dhenu Buildcon India 201412 1.83 4.50 4.49 -0.02 -0.02 0.00 -0.02 0.00 -0.02 -0.02 -0.01 0 S
Dhenu Buildcon India 201503 1.83 3.89 3.92 -0.03 -0.03 -0.03 -0.03 -0.02 0 S
Divine Multimedia (India) 201406 6.69 -1.89 0.02 0.14 -1.78 0.12 0.01 -1.90 -1.90 -1.90 0 S
Divine Multimedia (India) 201409 6.69 -0.68 0.01 0.01 -0.68 0.12 0.01 -0.81 -0.81 -0.81 0 S
Divine Multimedia (India) 201412 6.69 -1.12 0.01 -1.13 0.12 0.01 -1.26 -1.26 -1.26 0 S
Divine Multimedia (India) 201503 6.69 0.07 -0.07 0.12 0.03 -0.12 -0.12 -0.12 -0.02 0 S
Dolphin Medical Services 201406 15.10 0.12 0.15 0.00 -0.03 0.01 0.17 -0.21 -0.21 -0.21 -0.14 0 S
Dolphin Medical Services 201409 15.10 0.09 0.11 -0.01 0.01 0.17 -0.20 -0.20 -0.20 -0.13 0 S
Dolphin Medical Services 201412 15.10 0.09 0.10 -0.01 0.01 0.09 -0.11 -0.11 -0.11 -0.07 0 S
Dolphin Medical Services 201503 15.10 0.08 0.06 0.02 0.01 0.08 -0.08 -0.02 -0.06 -0.06 -0.04 0 S
Dolphin Offshore Enterprises (India) 201406 16.77 60.35 -3.39 22.08 0.00 34.87 4.17 5.30 25.39 1.07 24.32 24.32 14.50 0 C
Dolphin Offshore Enterprises (India) 201409 16.77 43.18 -1.70 16.39 -0.01 25.08 3.73 5.40 15.95 -0.59 16.55 16.54 9.86 0 C
Dolphin Offshore Enterprises (India) 201412 16.77 43.69 7.20 18.76 0.03 32.16 3.98 5.47 22.71 0.31 22.41 22.41 13.36 0 C
Dolphin Offshore Enterprises (India) 201503 16.77 49.23 2.58 41.14 0.03 10.71 3.07 5.71 -26.07 1.50 -27.58 -27.58 -16.44 0 C
DOT COM Global 201406 5.35 0.03 -0.03 0.00 -0.03 -0.03 -0.03 -0.06 0 S
DOT COM Global 201409 5.35 0.09 -0.09 0.00 -0.09 -0.09 -0.09 -0.17 0 S
DOT COM Global 201412 5.35 0.01 -0.01 0.00 -0.01 -0.01 -0.01 -0.02 0 S
DOT COM Global 201503 5.35 0.05 -0.05 -0.05 -0.05 -0.05 -0.09 0 S
Dynamic Industries 201406 3.03 38.41 0.05 35.75 0.68 3.40 0.56 0.23 2.61 0.85 1.76 1.76 5.80 10 S
Dynamic Industries 201409 3.03 13.98 0.03 12.84 0.22 1.39 0.45 0.23 0.71 0.28 0.43 0.43 1.43 10 S
Dynamic Industries 201412 3.03 7.67 0.02 7.16 0.11 0.64 0.24 0.21 0.19 0.04 0.15 0.15 0.49 10 S
Dynamic Industries 201503 3.03 8.91 0.02 7.30 0.40 2.03 0.23 0.34 0.43 0.51 -0.09 -0.09 -0.28 10 S
Dynavision 201406 3.84 0.83 0.11 0.72 0.00 0.71 0.71 0.71 1.86 0 S
Dynavision 201409 3.84 1.17 0.18 0.99 0.00 0.99 0.99 0.99 2.56 0 S
Dynavision 201412 3.84 1.17 0.12 1.04 0.00 1.04 1.04 1.04 2.71 0 S
Dynavision 201503 3.84 1.16 0.11 1.06 0.00 1.05 1.05 1.05 2.74 0 S
Eastcoast Steel 201406 5.40 0.10 0.12 0.02 0.01 0.00 0.00 0.00 0 S
Eastcoast Steel 201409 5.40 0.14 0.11 -0.03 0.01 -0.05 -0.05 -0.05 -0.09 0 S
Eastcoast Steel 201412 5.40 0.19 0.11 -0.08 0.01 -0.09 -0.09 -0.09 -0.17 0 S
Eastcoast Steel 201503 5.40 0.12 0.10 -0.02 0.01 -0.03 -0.03 -0.03 -0.05 0 S
Eastern Treads 201406 5.38 24.99 0.22 24.13 0.04 1.12 0.36 0.25 1.56 0.55 1.01 1.01 1.87 5 S
Eastern Treads 201409 5.23 20.92 0.23 20.72 0.78 1.21 0.36 0.26 0.59 0.19 0.40 0.40 0.76 5 S
Eastern Treads 201412 5.23 21.88 0.19 20.97 0.24 1.33 0.42 0.28 0.64 0.16 0.48 0.48 0.92 5 S
Eastern Treads 201503 5.23 19.01 0.18 18.99 0.02 0.21 0.41 0.17 -0.37 -0.06 -0.31 -0.31 -0.59 5 S
Eduexel Infotainment 201406 8.46 0.03 0.03 0.00 0.00 0.00 0.00 0.00 0 S
Eduexel Infotainment 201409 8.42 0.03 0.04 -0.01 0.00 -0.01 -0.01 -0.01 -0.01 0 S
Eduexel Infotainment 201412 8.46 0.01 0.01 0.00 0.00 0 S
Eduexel Infotainment 201503 8.46 0.01 -0.01 -0.01 -0.01 -0.01 0 S
E-Land Apparel 201406 47.99 43.00 1.41 47.74 1.04 -2.29 0.70 0.58 10.73 10.73 10.73 2.24 0 S
E-Land Apparel 201409 47.99 39.64 1.96 44.24 0.56 -2.08 1.10 0.54 -12.09 26.24 -38.33 -38.33 -7.99 0 S
E-Land Apparel 201412 47.99 41.02 2.70 51.12 2.07 -5.33 0.92 0.57 -6.82 -0.47 -6.35 -6.35 -1.32 0 S
E-Land Apparel 201503 47.99 49.20 2.68 54.93 0.57 -2.48 1.64 0.96 -5.07 -5.07 -5.07 -1.06 0 S
Elango Industries 201406 3.82 0.06 -0.06 0.00 -0.07 -0.07 -0.07 -0.17 0 S
Elango Industries 201409 3.82 0.05 -0.05 0.00 -0.05 -0.05 -0.05 -0.14 0 S
Elango Industries 201412 3.82 0.06 -0.06 -0.06 -0.06 -0.06 -0.17 0 S
Elango Industries 201503 3.82 0.56 -0.56 -0.56 -0.56 -0.56 -1.47 0 S
Co_Name Year Equity N.Sale O.O.I T. Exp O.I PBIDT Int. Dep. PBT T.Tax PAT A.PAT EPS Div (%)
Exp
ecte
d R
esu
lts
on
12
Au
gu
st 2
015
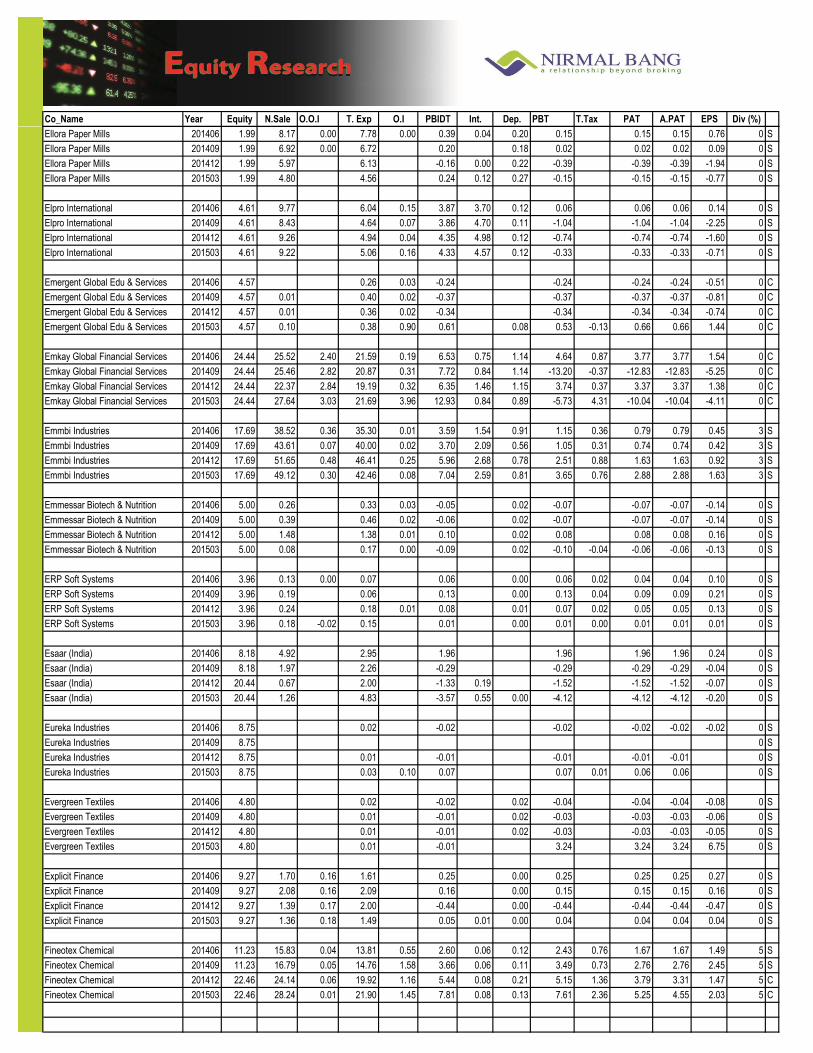
Ellora Paper Mills 201406 1.99 8.17 0.00 7.78 0.00 0.39 0.04 0.20 0.15 0.15 0.15 0.76 0 S
Ellora Paper Mills 201409 1.99 6.92 0.00 6.72 0.20 0.18 0.02 0.02 0.02 0.09 0 S
Ellora Paper Mills 201412 1.99 5.97 6.13 -0.16 0.00 0.22 -0.39 -0.39 -0.39 -1.94 0 S
Ellora Paper Mills 201503 1.99 4.80 4.56 0.24 0.12 0.27 -0.15 -0.15 -0.15 -0.77 0 S
Elpro International 201406 4.61 9.77 6.04 0.15 3.87 3.70 0.12 0.06 0.06 0.06 0.14 0 S
Elpro International 201409 4.61 8.43 4.64 0.07 3.86 4.70 0.11 -1.04 -1.04 -1.04 -2.25 0 S
Elpro International 201412 4.61 9.26 4.94 0.04 4.35 4.98 0.12 -0.74 -0.74 -0.74 -1.60 0 S
Elpro International 201503 4.61 9.22 5.06 0.16 4.33 4.57 0.12 -0.33 -0.33 -0.33 -0.71 0 S
Emergent Global Edu & Services 201406 4.57 0.26 0.03 -0.24 -0.24 -0.24 -0.24 -0.51 0 C
Emergent Global Edu & Services 201409 4.57 0.01 0.40 0.02 -0.37 -0.37 -0.37 -0.37 -0.81 0 C
Emergent Global Edu & Services 201412 4.57 0.01 0.36 0.02 -0.34 -0.34 -0.34 -0.34 -0.74 0 C
Emergent Global Edu & Services 201503 4.57 0.10 0.38 0.90 0.61 0.08 0.53 -0.13 0.66 0.66 1.44 0 C
Emkay Global Financial Services 201406 24.44 25.52 2.40 21.59 0.19 6.53 0.75 1.14 4.64 0.87 3.77 3.77 1.54 0 C
Emkay Global Financial Services 201409 24.44 25.46 2.82 20.87 0.31 7.72 0.84 1.14 -13.20 -0.37 -12.83 -12.83 -5.25 0 C
Emkay Global Financial Services 201412 24.44 22.37 2.84 19.19 0.32 6.35 1.46 1.15 3.74 0.37 3.37 3.37 1.38 0 C
Emkay Global Financial Services 201503 24.44 27.64 3.03 21.69 3.96 12.93 0.84 0.89 -5.73 4.31 -10.04 -10.04 -4.11 0 C
Emmbi Industries 201406 17.69 38.52 0.36 35.30 0.01 3.59 1.54 0.91 1.15 0.36 0.79 0.79 0.45 3 S
Emmbi Industries 201409 17.69 43.61 0.07 40.00 0.02 3.70 2.09 0.56 1.05 0.31 0.74 0.74 0.42 3 S
Emmbi Industries 201412 17.69 51.65 0.48 46.41 0.25 5.96 2.68 0.78 2.51 0.88 1.63 1.63 0.92 3 S
Emmbi Industries 201503 17.69 49.12 0.30 42.46 0.08 7.04 2.59 0.81 3.65 0.76 2.88 2.88 1.63 3 S
Emmessar Biotech & Nutrition 201406 5.00 0.26 0.33 0.03 -0.05 0.02 -0.07 -0.07 -0.07 -0.14 0 S
Emmessar Biotech & Nutrition 201409 5.00 0.39 0.46 0.02 -0.06 0.02 -0.07 -0.07 -0.07 -0.14 0 S
Emmessar Biotech & Nutrition 201412 5.00 1.48 1.38 0.01 0.10 0.02 0.08 0.08 0.08 0.16 0 S
Emmessar Biotech & Nutrition 201503 5.00 0.08 0.17 0.00 -0.09 0.02 -0.10 -0.04 -0.06 -0.06 -0.13 0 S
ERP Soft Systems 201406 3.96 0.13 0.00 0.07 0.06 0.00 0.06 0.02 0.04 0.04 0.10 0 S
ERP Soft Systems 201409 3.96 0.19 0.06 0.13 0.00 0.13 0.04 0.09 0.09 0.21 0 S
ERP Soft Systems 201412 3.96 0.24 0.18 0.01 0.08 0.01 0.07 0.02 0.05 0.05 0.13 0 S
ERP Soft Systems 201503 3.96 0.18 -0.02 0.15 0.01 0.00 0.01 0.00 0.01 0.01 0.01 0 S
Esaar (India) 201406 8.18 4.92 2.95 1.96 1.96 1.96 1.96 0.24 0 S
Esaar (India) 201409 8.18 1.97 2.26 -0.29 -0.29 -0.29 -0.29 -0.04 0 S
Esaar (India) 201412 20.44 0.67 2.00 -1.33 0.19 -1.52 -1.52 -1.52 -0.07 0 S
Esaar (India) 201503 20.44 1.26 4.83 -3.57 0.55 0.00 -4.12 -4.12 -4.12 -0.20 0 S
Eureka Industries 201406 8.75 0.02 -0.02 -0.02 -0.02 -0.02 -0.02 0 S
Eureka Industries 201409 8.75 0 S
Eureka Industries 201412 8.75 0.01 -0.01 -0.01 -0.01 -0.01 0 S
Eureka Industries 201503 8.75 0.03 0.10 0.07 0.07 0.01 0.06 0.06 0 S
Evergreen Textiles 201406 4.80 0.02 -0.02 0.02 -0.04 -0.04 -0.04 -0.08 0 S
Evergreen Textiles 201409 4.80 0.01 -0.01 0.02 -0.03 -0.03 -0.03 -0.06 0 S
Evergreen Textiles 201412 4.80 0.01 -0.01 0.02 -0.03 -0.03 -0.03 -0.05 0 S
Evergreen Textiles 201503 4.80 0.01 -0.01 3.24 3.24 3.24 6.75 0 S
Explicit Finance 201406 9.27 1.70 0.16 1.61 0.25 0.00 0.25 0.25 0.25 0.27 0 S
Explicit Finance 201409 9.27 2.08 0.16 2.09 0.16 0.00 0.15 0.15 0.15 0.16 0 S
Explicit Finance 201412 9.27 1.39 0.17 2.00 -0.44 0.00 -0.44 -0.44 -0.44 -0.47 0 S
Explicit Finance 201503 9.27 1.36 0.18 1.49 0.05 0.01 0.00 0.04 0.04 0.04 0.04 0 S
Fineotex Chemical 201406 11.23 15.83 0.04 13.81 0.55 2.60 0.06 0.12 2.43 0.76 1.67 1.67 1.49 5 S
Fineotex Chemical 201409 11.23 16.79 0.05 14.76 1.58 3.66 0.06 0.11 3.49 0.73 2.76 2.76 2.45 5 S
Fineotex Chemical 201412 22.46 24.14 0.06 19.92 1.16 5.44 0.08 0.21 5.15 1.36 3.79 3.31 1.47 5 C
Fineotex Chemical 201503 22.46 28.24 0.01 21.90 1.45 7.81 0.08 0.13 7.61 2.36 5.25 4.55 2.03 5 C

Co_Name Year Equity N.Sale O.O.I T. Exp O.I PBIDT Int. Dep. PBT T.Tax PAT A.PAT EPS Div (%)
Exp
ecte
d R
esu
lts
on
12
Au
gu
st 2
015
Frontier Capital 201406 0.25 0.80 0.32 0.01 0.50 0.00 0.50 0.16 0.34 0.34 13.83 10 C
Frontier Capital 201409 0.25 0.70 0.50 0.06 0.26 0.02 0.00 0.24 0.08 0.16 0.16 6.63 10 C
Frontier Capital 201412 0.25 0.78 0.26 0.00 0.52 0.00 0.51 0.16 0.35 0.35 14.32 10 C
Frontier Capital 201503 0.25 0.61 1.48 0.02 -0.85 0.09 -0.94 -0.23 -0.71 -0.71 -28.87 10 C
Fruition Venture 201406 4.00 0.63 0.49 0.14 0.00 0.13 0.01 0.13 0.13 0.31 0 S
Fruition Venture 201409 4.00 0.67 0.64 0.04 0.06 0.00 0.06 0.01 0.05 0.05 0.13 0 S
Fruition Venture 201412 4.00 3.60 3.46 0.00 0.15 0.00 0.14 0.04 0.10 0.10 0.25 0 S
Fruition Venture 201503 4.00 0.91 0.63 0.01 0.29 0.01 0.29 0.26 0.02 0.02 0.06 0 S
Galaxy Bearings 201406 3.18 9.51 0.13 8.51 1.13 0.47 0.16 0.50 0.24 0.26 0.26 0.83 0 S
Galaxy Bearings 201409 3.18 11.06 0.11 9.79 1.39 0.47 0.17 0.75 0.28 0.47 0.47 1.48 0 S
Galaxy Bearings 201412 3.18 9.98 0.09 7.92 2.15 0.48 0.17 1.50 0.54 0.96 0.96 3.00 0 S
Galaxy Bearings 201503 3.18 12.75 0.26 10.23 2.78 0.50 0.70 1.57 0.40 1.18 1.18 3.70 0 S
Garden Silk Mills 201406 40.13 707.34 671.35 2.50 38.48 44.76 26.45 -32.73 -32.73 -32.73 -8.16 0 C
Garden Silk Mills 201409 40.13 707.70 676.02 0.83 32.51 45.34 18.33 -31.16 -31.16 -31.16 -7.76 0 C
Garden Silk Mills 201412 40.13 638.23 629.85 -0.01 8.37 45.66 17.57 -54.86 -54.86 -54.86 -13.67 0 C
Garden Silk Mills 201503 42.08 587.72 554.87 4.39 37.23 47.71 13.78 -24.25 -24.25 -24.25 -6.03 0 C
GD Trading & Agencies 201406 0.10 0.00 0.00 0.00 0.00 0.00 0.24 0 S
GD Trading & Agencies 201409 0.10 0.00 0.00 0.00 0.00 0.00 -0.40 0 S
GD Trading & Agencies 201412 0.10 0.00 0.00 0.00 0.00 0.00 -0.20 0 S
GD Trading & Agencies 201503 0.10 0.02 0.02 0.00 0.00 0.00 0.00 0.27 0 S
Genus Power Infrastructures 201406 25.67 169.42 1.59 148.12 1.21 24.10 5.87 2.64 15.59 3.28 12.32 12.32 0.48 10 S
Genus Power Infrastructures 201409 25.67 237.56 4.88 209.47 2.43 35.40 8.20 4.09 5.67 3.93 1.74 1.74 0.07 10 S
Genus Power Infrastructures 201412 25.67 211.24 0.96 185.67 3.53 30.05 8.44 3.03 18.58 3.94 14.64 14.64 0.57 10 S
Genus Power Infrastructures 201503 25.67 296.79 0.94 255.38 2.43 44.79 9.92 6.33 28.54 6.02 24.42 22.52 0.95 10 S
GKB Ophthalmics 201406 4.15 5.36 4.84 0.10 0.62 0.70 0.45 -0.53 -0.09 -0.44 -0.44 -1.06 0 S
GKB Ophthalmics 201409 4.15 5.80 0.02 6.59 0.31 -0.47 0.71 0.44 -1.61 -0.14 -1.48 -1.48 -3.55 0 S
GKB Ophthalmics 201412 4.15 10.31 0.06 10.77 0.87 0.47 0.76 0.44 -0.73 -0.73 -0.73 -1.75 0 S
GKB Ophthalmics 201503 4.15 8.31 8.53 0.03 -0.20 0.32 0.15 -0.15 -0.54 0.38 0.38 0.92 0 S
Global Capital Markets 201406 24.89 0.62 -0.05 0.15 0.17 0.59 0.01 0.07 0.51 0.51 0.51 0.20 0 S
Global Capital Markets 201409 24.89 0.08 0.32 0.21 -0.04 0.05 -0.09 -0.09 -0.09 -0.03 0 S
Global Capital Markets 201412 24.89 1.01 0.05 1.61 0.29 -0.27 0.01 0.06 -0.33 -0.33 -0.33 -0.13 0 S
Global Capital Markets 201503 24.89 0.11 0.62 0.25 -0.26 0.02 0.07 -0.35 0.00 -0.34 -0.34 -0.14 0 S
Global Infratech & Finance 201406 23.86 7.40 0.45 7.68 0.17 0.00 0.00 0.16 0.16 0.16 0.01 0 S
Global Infratech & Finance 201409 23.86 2.69 4.14 6.47 0.36 0.01 0.36 0.36 0.36 0.01 0 S
Global Infratech & Finance 201412 26.24 5.39 5.25 0.14 0.01 0.13 0.13 0.13 0 S
Global Infratech & Finance 201503 26.24 18.13 0.17 17.64 0.65 0.18 0.01 0.46 0.35 0.11 0.11 0 S
Global Vectra Helicorp 201406 14.00 98.37 0.66 73.17 0.65 26.52 4.62 6.37 15.53 4.98 10.55 10.55 6.78 0 S
Global Vectra Helicorp 201409 14.00 78.04 0.28 66.50 1.11 12.93 4.12 6.27 2.55 0.84 1.71 1.71 0.47 0 S
Global Vectra Helicorp 201412 14.00 83.53 0.33 69.78 0.32 14.40 3.97 6.53 3.90 1.70 2.20 2.20 0.82 0 S
Global Vectra Helicorp 201503 14.00 84.70 0.91 62.14 10.89 34.35 4.00 6.55 19.77 11.10 8.66 8.66 5.41 0 S
Gokaldas Exports 201406 17.19 258.40 13.39 267.60 13.70 17.87 13.13 7.47 -2.73 -2.73 -2.73 -0.79 0 S
Gokaldas Exports 201409 17.28 302.92 14.12 303.38 8.58 22.23 11.59 7.35 3.30 3.30 3.30 0.96 0 S
Gokaldas Exports 201412 17.30 205.10 18.60 224.66 18.32 17.35 11.10 7.31 -1.05 -1.05 -1.05 -0.30 0 S
Gokaldas Exports 201503 17.30 237.42 20.18 253.09 14.43 18.94 11.01 7.80 34.84 34.84 34.84 10.07 0 S
Gokul Refoils and Solvent 201406 26.38 1554.72 6.96 1537.64 20.95 44.99 32.59 9.01 3.38 1.29 2.10 2.10 0.16 0 S
Gokul Refoils and Solvent 201409 26.38 1675.03 13.15 1661.62 5.84 32.40 21.10 9.16 2.14 0.61 1.53 1.53 0.12 0 S
Gokul Refoils and Solvent 201412 26.38 1231.44 13.05 1216.45 11.98 40.03 24.72 9.93 5.38 2.40 2.98 2.98 0.50 0 S
Gokul Refoils and Solvent 201503 26.38 1369.34 5.79 1350.40 13.83 38.56 29.20 4.52 4.44 -1.38 5.82 5.82 0.94 0 S

Co_Name Year Equity N.Sale O.O.I T. Exp O.I PBIDT Int. Dep. PBT T.Tax PAT A.PAT EPS Div (%)
Exp
ecte
d R
esu
lts
on
12
Au
gu
st 2
015
Golden Tobacco 201406 17.59 16.17 0.18 17.39 0.31 -0.73 5.73 0.30 -6.76 -6.76 -6.76 -3.84 0 S
Golden Tobacco 201409 17.59 13.25 0.43 15.77 0.17 -1.92 5.67 0.31 -7.90 -7.90 -7.90 -4.49 0 S
Golden Tobacco 201412 17.59 10.57 0.60 14.25 0.19 -2.88 5.68 0.30 -8.87 -8.87 -8.87 -5.04 0 S
Golden Tobacco 201503 17.59 10.02 0.37 11.72 0.52 -0.81 5.99 0.30 -7.11 -7.11 -7.11 -4.04 0 S
Goodyear India 201406 23.07 432.61 0.42 388.31 6.96 51.68 0.94 6.88 43.86 14.95 28.91 28.91 12.53 100 S
Goodyear India 201409 23.07 401.15 0.45 361.76 6.63 46.47 0.79 7.39 38.29 13.07 25.22 25.22 10.93 100 S
Goodyear India 201412 23.07 359.47 0.50 329.80 6.96 37.13 0.69 7.67 28.77 9.77 19.00 19.00 8.25 100 S
Goodyear India 201503 23.07 274.60 0.45 248.58 6.61 33.08 0.60 8.76 23.72 8.10 15.62 15.62 6.77 100 S
Govind Rubber 201406 21.84 65.62 0.01 61.30 0.11 4.44 5.26 0.84 -1.66 -1.66 -1.66 -0.77 0 S
Govind Rubber 201409 21.84 103.57 95.97 0.22 7.82 5.11 0.85 1.86 0.07 1.79 1.79 0.82 0 S
Govind Rubber 201412 21.84 84.00 80.47 3.21 6.74 5.39 0.87 0.48 0.48 0.48 0.22 0 S
Govind Rubber 201503 21.84 85.51 79.98 0.44 5.97 4.78 1.05 -0.33 0.29 -0.62 -0.62 -0.29 0 S
Goyal Associates 201406 5.08 0.14 0.04 0.12 0.06 0.01 0.05 0.05 0.05 0.01 0 S
Goyal Associates 201409 5.08 0.06 0.03 0.03 0.01 0.02 0.02 0.02 0 S
Goyal Associates 201412 5.08 0.06 0.10 -0.03 0.01 -0.04 -0.04 -0.04 -0.01 0 S
Goyal Associates 201503 5.08 0.14 0.19 0.03 -0.03 -0.03 0.01 -0.02 -0.02 0 S
Graviss Hospitality 201406 14.10 11.48 0.03 11.77 0.04 -0.22 0.32 1.42 -1.96 -1.96 -1.96 -0.28 0 C
Graviss Hospitality 201409 17.29 10.20 0.02 10.95 0.03 -0.70 0.36 1.42 -2.48 -2.48 -2.48 -0.29 0 C
Graviss Hospitality 201412 14.10 14.51 0.08 11.84 0.05 2.80 0.37 1.42 1.01 1.01 1.01 0.12 0 C
Graviss Hospitality 201503 14.10 15.33 0.01 12.72 0.10 2.72 0.31 1.47 0.94 -0.29 1.23 1.23 0.17 0 C
Gromo Trade & Consultancy 201406 28.39 0.57 0.61 0.69 0.49 0.49 0.49 0.49 0.21 0 S
Gromo Trade & Consultancy 201409 28.39 0.47 0.85 0.60 0.72 0.72 0.72 0.72 0.25 0 S
Gromo Trade & Consultancy 201412 28.39 0.86 1.27 -0.41 -0.41 -0.41 -0.41 -0.15 0 S
Gromo Trade & Consultancy 201503 28.39 6.49 8.42 -1.93 -1.93 -0.19 -1.74 -1.74 -0.68 0 S
Gujchem Distillers India 201406 0.16 0.12 0.10 -0.03 0.02 0.02 -0.06 -0.06 -0.06 -3.79 0 S
Gujchem Distillers India 201409 0.16 0.17 0.09 -0.08 0.02 0.02 -0.12 -0.12 -0.12 -7.20 0 S
Gujchem Distillers India 201412 0.16 0.12 0.10 -0.02 0.02 0.02 -0.06 -0.06 -0.06 -3.93 0 S
Gujchem Distillers India 201503 0.16 0.27 0.07 -0.20 0.01 0.02 -0.23 -0.23 -0.23 -14.32 0 S
Hardcastle & Waud Manufacturing Company 201406 0.68 0.75 0.10 1.11 0.34 0.08 0.07 0.01 0.01 0.00 0.00 0 S
Hardcastle & Waud Manufacturing Company 201409 0.68 0.76 0.21 1.06 1.03 0.94 0.12 0.83 -0.11 0.94 0.94 13.82 0 S
Hardcastle & Waud Manufacturing Company 201412 0.68 0.58 0.30 0.94 0.26 0.20 0.05 0.15 -0.16 0.32 0.32 4.67 0 S
Hardcastle & Waud Manufacturing Company 201503 0.68 0.70 0.26 1.42 0.69 0.22 0.08 0.14 0.09 0.05 0.05 0.69 0 S
Hathway Bhawani Cabletel & Datacom 201406 8.00 3.89 4.31 0.02 -0.41 0.05 0.20 -0.61 0.05 -0.66 -0.66 -0.82 0 S
Hathway Bhawani Cabletel & Datacom 201409 8.10 3.80 4.06 0.02 -0.24 0.05 0.24 -0.53 -0.03 -0.50 -0.50 -0.63 0 S
Hathway Bhawani Cabletel & Datacom 201412 8.10 3.59 4.31 0.02 -0.71 0.06 0.20 -0.96 0.00 -0.96 -0.96 -1.19 0 S
Hathway Bhawani Cabletel & Datacom 201503 8.10 4.15 5.02 0.03 -0.84 0.05 0.14 -1.08 -0.06 -1.02 -1.02 -1.24 0 S
HB Portfolio 201406 12.27 0.73 0.29 0.43 0.00 0.01 0.42 0.09 0.33 0.33 0.27 5 S
HB Portfolio 201409 12.27 0.73 0.34 0.00 0.39 0.00 0.01 0.38 0.08 0.30 0.30 0.26 5 S
HB Portfolio 201412 12.27 0.99 0.40 0.06 0.65 0.00 0.01 0.64 0.13 0.51 0.51 0.43 5 S
HB Portfolio 201503 12.27 0.30 0.00 0.32 -0.01 0.26 0.02 -0.29 0.05 -0.34 -0.34 -0.28 5 S
HB Stockholdings 201406 24.34 5.71 0.64 5.07 0.02 5.06 0.84 4.22 4.22 1.77 0 S
HB Stockholdings 201409 24.34 0.92 0.83 0.08 0.02 0.07 0.18 -0.11 -0.11 -0.05 0 S
HB Stockholdings 201412 24.34 2.54 0.43 2.12 0.02 2.10 0.83 1.27 1.27 0.53 0 S
HB Stockholdings 201503 24.34 -1.04 0.77 -1.81 0.19 0.18 -2.17 -1.80 -0.38 -0.38 -0.16 0 S
HEM Holdings & Trading 201406 0.24 0.00 0.02 0.02 0.01 0.01 0.01 0.01 0.24 0 S
HEM Holdings & Trading 201409 0.24 0.00 0.01 0.02 0.01 0.01 0.01 0.01 0.55 0 S
HEM Holdings & Trading 201412 0.24 0.01 0.01 0.03 0.03 0.00 0.03 0.03 0.03 1.04 0 S
HEM Holdings & Trading 201503 0.24 0.03 0.01 0.03 0.04 0.04 0.04 0.04 1.77 0 S

Co_Name Year Equity N.Sale O.O.I T. Exp O.I PBIDT Int. Dep. PBT T.Tax PAT A.PAT EPS Div (%)
Exp
ecte
d R
esu
lts
on
12
Au
gu
st 2
015
Himadri Chemicals & Industries 201406 38.57 351.47 306.05 11.33 56.75 25.59 13.84 17.32 2.96 14.36 14.36 0.37 10 S
Himadri Chemicals & Industries 201409 38.57 356.98 0.24 320.57 1.64 38.29 29.36 14.25 -5.32 -1.97 -3.35 -3.35 -0.09 10 S
Himadri Chemicals & Industries 201412 38.57 326.22 0.73 298.05 1.25 30.15 30.34 14.27 -14.46 -5.00 -9.46 -9.46 -0.25 10 S
Himadri Chemicals & Industries 201503 38.57 341.15 0.71 338.16 1.62 5.32 16.22 13.00 -23.90 -7.95 -15.95 -15.95 -0.41 10 S
Hinduja Global Solutions 201406 20.63 666.22 589.68 7.91 84.45 10.79 27.82 45.83 13.33 32.50 32.50 15.76 200 C
Hinduja Global Solutions 201409 20.66 702.07 622.02 5.18 85.23 9.69 23.59 51.95 13.49 38.45 38.45 18.65 200 C
Hinduja Global Solutions 201412 20.68 732.53 642.16 3.86 94.23 9.53 25.75 58.95 6.18 52.77 52.77 25.49 200 C
Hinduja Global Solutions 201503 20.72 706.77 644.07 10.72 73.42 8.62 28.09 36.70 -4.60 41.30 41.30 19.98 200 C
Hindustan Foods 201406 5.00 2.49 0.80 3.54 -0.25 0.35 0.12 -0.72 -0.72 -0.72 -1.44 0 S
Hindustan Foods 201409 5.00 3.56 1.36 5.14 -0.22 0.41 0.13 -0.77 -0.77 -0.77 -1.53 0 S
Hindustan Foods 201412 5.00 1.91 0.89 2.78 0.02 0.40 0.14 -0.51 -0.51 -0.51 -1.03 0 S
Hindustan Foods 201503 5.00 5.65 0.77 11.68 11.07 5.80 0.39 0.91 4.50 4.50 4.50 9.00 0 S
Hisar Metal Industries 201406 3.60 55.93 0.15 53.00 3.08 1.89 0.66 0.53 0.18 0.35 0.35 0.97 10 S
Hisar Metal Industries 201409 3.60 55.27 0.12 52.08 3.31 2.12 0.65 0.54 0.17 0.37 0.37 1.01 10 S
Hisar Metal Industries 201412 3.60 52.53 0.16 49.60 3.09 2.16 0.64 0.29 0.09 0.20 0.20 0.56 10 S
Hisar Metal Industries 201503 3.60 59.61 0.18 58.01 1.78 1.53 -0.44 0.69 0.28 0.41 0.41 1.14 10 S
Honda Siel Power Products 201406 10.14 160.45 1.67 147.04 1.18 16.26 5.03 11.23 3.81 7.42 7.42 7.32 60 S
Honda Siel Power Products 201409 10.14 126.55 2.47 119.05 2.39 12.36 5.39 6.97 2.38 4.59 4.59 4.53 60 S
Honda Siel Power Products 201412 10.14 151.88 3.24 131.93 1.30 24.49 5.53 18.96 6.80 12.16 12.16 11.99 60 S
Honda Siel Power Products 201503 10.14 182.22 2.25 163.02 2.22 23.67 5.36 21.78 7.33 14.45 14.45 14.25 60 S
Hotel Leela Venture 201406 90.32 155.44 142.61 1.82 14.65 130.73 58.54 -174.62 -174.62 -174.62 -3.87 0 S
Hotel Leela Venture 201409 90.32 157.54 135.31 0.88 23.11 129.40 53.89 -160.18 -160.18 -160.18 -3.55 0 S
Hotel Leela Venture 201412 93.32 213.60 148.35 2.82 68.07 132.90 60.21 -125.04 -125.04 -125.04 -2.68 0 S
Hotel Leela Venture 201503 93.32 228.37 184.95 196.99 240.41 67.46 -10.33 -54.29 43.96 43.96 0.96 0 S
HRB Floriculture 201406 2.28 0.66 0.46 0.22 0.42 0.05 0.37 0.37 0.37 1.60 0 S
HRB Floriculture 201409 2.28 0.36 0.32 -0.01 0.03 0.00 0.05 -0.02 -0.02 -0.02 -0.08 0 S
HRB Floriculture 201412 2.28 0.36 0.30 -0.02 0.05 0.00 0.05 0.00 0.00 0.00 -0.01 0 S
HRB Floriculture 201503 2.28 0.52 0.63 -0.13 -0.24 0.01 0.04 -0.29 0.03 -0.32 -0.32 -0.14 0 S
Hubtown 201406 72.74 120.52 0.93 44.91 8.33 84.87 80.02 1.16 3.69 1.54 1.02 2.15 0.14 10 S
Hubtown 201409 72.74 195.63 1.79 113.64 17.91 101.69 78.20 1.08 22.41 5.65 20.26 16.76 2.86 10 S
Hubtown 201412 72.74 121.43 7.02 29.61 7.36 106.20 80.16 1.02 25.02 5.63 19.39 19.39 2.67 10 S
Hubtown 201503 72.74 151.02 0.24 110.44 9.38 50.20 84.21 0.77 -34.78 -5.94 -30.50 -28.84 -4.19 10 S
ICVL Steels 201406 3.15 0.03 0.03 0.00 0.00 0.00 0.00 0.00 0 S
ICVL Steels 201409 3.15 0.01 -0.01 -0.01 -0.01 -0.01 0 S
ICVL Steels 201412 3.15 0.02 0.00 -0.02 -0.02 -0.02 -0.02 -0.01 0 S
ICVL Steels 201503 3.15 0.57 0.52 0.00 0.05 0.02 0.03 0.01 0.02 0.02 0.01 0 S
IDBI Bank 201406 1603.94 6732.98 822.40 499.75 928.26 5482.07 152.10 45.93 106.17 106.17 0.66 8 S
IDBI Bank 201409 1603.96 6850.12 969.69 760.40 1196.88 5443.95 206.41 87.92 118.49 118.49 0.74 8 S
IDBI Bank 201412 1603.96 7158.80 1093.93 777.19 1113.81 5728.25 157.56 54.77 102.79 102.79 0.64 8 S
IDBI Bank 201503 1603.96 7412.08 1141.39 1970.29 2489.16 5751.82 771.26 225.32 545.94 545.94 3.40 8 S
IMC Finance 201406 0.24 0.02 0.01 0.01 0.01 0.01 0.01 0.40 0 S
IMC Finance 201409 0.24 0.01 0.01 -0.01 -0.01 -0.01 -0.01 -0.39 0 S
IMC Finance 201412 0.24 0.01 0.01 0.00 0.00 0.00 0.00 -0.07 0 S
IMC Finance 201503 0.24 0.01 0.01 0.00 0.00 0.00 0.00 -0.04 0 S
India Cements Capital 201406 21.71 0.91 0.25 0.87 0.01 0.30 0.01 0.07 0.22 0.03 0.19 0.19 0.09 0 S
India Cements Capital 201409 21.71 0.76 0.25 0.90 0.01 0.12 0.01 0.05 0.07 0.02 0.04 0.04 0.02 0 S
India Cements Capital 201412 21.71 0.75 0.25 0.92 0.03 0.11 0.00 0.05 0.06 0.02 0.04 0.04 0.02 0 S
India Cements Capital 201503 21.71 0.87 0.81 0.04 0.10 0.00 0.05 0.04 0.05 -0.01 -0.01 0 S

Co_Name Year Equity N.Sale O.O.I T. Exp O.I PBIDT Int. Dep. PBT T.Tax PAT A.PAT EPS Div (%)
Exp
ecte
d R
esu
lts
on
12
Au
gu
st 2
015
Indian Extractions 201406 3.34 0.03 0.10 0.10 0.03 0.00 0.01 0.01 0.01 0.01 0.04 0 S
Indian Extractions 201409 3.34 0.10 -0.10 0.00 0.01 -0.11 -0.11 -0.11 -0.34 0 S
Indian Extractions 201412 3.34 0.08 0.02 -0.06 0.00 0.01 -0.07 -0.07 -0.07 -0.22 0 S
Indian Extractions 201503 3.34 1.85 0.03 -1.82 0.14 -1.96 -1.96 -1.96 -5.86 0 S
Indo Borax & Chemicals 201406 3.48 18.39 13.92 1.00 5.47 0.01 0.19 5.27 1.70 3.58 3.58 11.14 15 S
Indo Borax & Chemicals 201409 3.21 17.92 13.93 1.02 5.01 0.01 0.33 4.67 1.49 3.19 3.19 9.93 15 S
Indo Borax & Chemicals 201412 3.21 19.06 14.76 1.03 5.33 0.01 0.33 4.99 1.61 3.38 3.38 10.55 15 S
Indo Borax & Chemicals 201503 3.21 17.24 14.50 0.88 3.62 0.00 0.30 3.32 1.04 2.28 2.28 7.05 15 S
Industrial & Prudential Investment Company 201406 0.58 5.36 0.10 5.26 0.00 5.26 5.26 5.26 90.29 550 S
Industrial & Prudential Investment Company 201409 0.58 1.20 0.11 1.09 0.00 1.09 0.09 1.00 1.00 17.11 550 S
Industrial & Prudential Investment Company 201412 0.58 0.87 0.08 0.79 0.00 0.79 0.09 0.70 0.70 12.00 550 S
Industrial & Prudential Investment Company 201503 0.58 0.33 0.45 -0.12 0.00 -0.12 -0.03 -0.09 -0.09 -1.50 550 S
Insilco 201406 62.72 16.03 16.53 1.05 0.55 0.01 0.41 0.13 0.13 0.13 0.02 0 S
Insilco 201409 62.72 13.09 14.13 0.66 -0.38 0.01 0.24 -0.63 -0.63 -0.63 -0.10 0 S
Insilco 201412 62.72 13.52 14.46 0.64 -0.30 0.01 0.30 -0.61 -0.61 -0.61 -0.10 0 S
Insilco 201503 62.72 14.33 13.80 2.22 2.75 0.01 0.21 2.53 2.53 2.53 0.40 0 S
Integra Engineering India 201406 3.43 5.11 0.12 5.23 0.19 0.19 0.07 0.16 -0.05 -0.05 -0.05 -0.01 0 S
Integra Engineering India 201409 3.43 5.37 0.28 5.43 0.32 0.55 0.09 0.17 0.29 0.29 0.29 0.09 0 S
Integra Engineering India 201412 3.43 5.38 0.21 5.48 0.40 0.52 0.11 0.47 -0.49 -0.11 -0.38 -0.38 -0.11 0 S
Integra Engineering India 201503 3.43 6.13 0.10 6.49 0.71 0.44 0.12 0.19 0.14 0.14 0.14 0.04 0 S
Integra Garments And Textiles 201406 10.90 0.46 -0.46 0.07 0.38 -0.91 -0.91 -0.91 -0.25 0 S
Integra Garments And Textiles 201409 10.90 0.09 -0.09 0.38 -0.47 -0.47 -0.47 -0.13 0 S
Integra Garments And Textiles 201412 10.90 0.08 -0.08 0.37 -0.45 -0.45 -0.45 -0.12 0 S
Integra Garments And Textiles 201503 10.90 -0.50 0.50 0.02 0.38 0.10 0.10 0.10 -0.03 0 S
Integrated Financial Services 201406 6.00 0.28 0.01 0.08 0.21 0.00 0.20 0.04 0.17 0.17 0.28 5 S
Integrated Financial Services 201409 6.00 0.74 0.02 0.09 0.67 0.00 0.67 0.06 0.61 0.61 1.01 5 S
Integrated Financial Services 201412 6.00 0.10 0.39 0.10 0.39 0.00 0.39 0.11 0.28 0.28 0.47 5 S
Integrated Financial Services 201503 6.00 1.71 0.57 0.25 2.04 0.00 2.03 0.40 1.63 1.63 2.72 5 S
Intellivate Capital Ventures 201406 2.91 0.04 0.02 0.02 0.02 0.01 0.01 0.01 0 S
Intellivate Capital Ventures 201409 2.91 0.04 0.02 0.03 0.03 0.01 0.02 0.02 0 S
Intellivate Capital Ventures 201412 2.91 0.01 0.02 -0.01 -0.01 -0.01 -0.01 -0.01 0 S
Intellivate Capital Ventures 201503 2.91 0.02 0.03 -0.01 -0.01 -0.01 -0.01 0 S
Inter State Oil Carrier 201406 4.99 4.60 4.08 0.26 0.79 0.09 0.45 0.25 0.25 0.25 0.49 0 S
Inter State Oil Carrier 201409 4.99 4.78 4.31 0.30 0.77 0.12 0.08 0.57 0.57 0.57 1.14 0 S
Inter State Oil Carrier 201412 4.99 4.63 4.13 -0.29 0.22 0.11 0.27 -0.16 -0.16 -0.16 -0.32 0 S
Inter State Oil Carrier 201503 4.99 4.63 3.92 0.05 0.76 0.14 0.28 0.34 0.69 -0.35 -0.35 -0.71 0 S
International Conveyors 201406 6.75 20.92 0.04 19.74 1.39 2.61 1.03 1.16 0.42 0.15 0.27 0.27 0.04 25 S
International Conveyors 201409 6.75 29.07 0.07 23.61 0.65 6.18 1.30 1.22 3.66 1.21 2.45 2.45 0.36 25 S
International Conveyors 201412 6.75 17.92 0.03 15.34 0.82 3.43 1.45 1.20 0.78 0.24 0.54 0.54 0.08 25 S
International Conveyors 201503 6.75 29.31 0.04 26.15 0.42 3.62 1.06 1.22 1.34 0.32 1.02 1.02 0.15 25 S
Iris Mediaworks 201406 49.98 23.24 22.91 0.34 0.01 0.09 0.24 0.24 0.24 0.02 0 S
Iris Mediaworks 201409 49.98 23.80 23.52 0.28 0.00 0.09 0.19 0.19 0.19 0.02 0 S
Iris Mediaworks 201412 49.98 32.55 32.17 0.39 0.00 0.09 0.29 0.29 0.29 0.03 0 S
Iris Mediaworks 201503 49.98 12.42 14.17 0.48 -1.28 0.12 -1.40 -0.02 -1.43 -1.38 -0.14 0 S
ISL Consulting 201406 12.00 4.72 0.09 3.90 0.91 0.00 0.91 0.91 0.91 0.76 0 S
ISL Consulting 201409 12.00 7.01 0.10 5.89 1.23 0.00 1.22 1.22 1.22 1.02 0 S
ISL Consulting 201412 12.00 7.87 0.10 6.00 1.97 0.00 1.97 1.97 1.97 1.64 0 S
ISL Consulting 201503 12.00 1.82 0.45 5.78 -3.52 0.02 -3.53 0.09 -3.63 -3.63 -3.02 0 S

Co_Name Year Equity N.Sale O.O.I T. Exp O.I PBIDT Int. Dep. PBT T.Tax PAT A.PAT EPS Div (%)
Exp
ecte
d R
esu
lts
on
12
Au
gu
st 2
015
Jackson Investments 201406 29.07 3.38 3.11 0.27 0.27 0.27 0.27 0.09 0 S
Jackson Investments 201409 29.07 16.49 16.32 0.17 0.17 0.17 0.17 0.06 0 S
Jackson Investments 201412 29.07 1.33 1.14 0.18 0.18 0.18 0.18 0.06 0 S
Jackson Investments 201503 29.07 4.29 4.47 -0.18 -0.18 0.14 -0.32 -0.32 -0.11 0 S
Jai Mata Glass 201406 10.00 0.01 0.03 -0.01 0.01 -0.03 -0.03 -0.03 0.00 0 S
Jai Mata Glass 201409 10.00 0.10 0.06 0.04 0.01 0.02 0.02 0.02 0.00 0 S
Jai Mata Glass 201412 10.00 0.00 0.24 -0.24 0.01 -0.25 -0.25 -0.25 -0.03 0 S
Jai Mata Glass 201503 10.00 0.03 0.00 -0.03 0.05 -0.06 -0.06 -0.06 -0.01 0 S
Jay Ushin 201406 3.87 151.05 145.72 2.39 7.72 2.41 3.06 2.26 0.96 1.31 1.31 3.38 25 S
Jay Ushin 201409 3.87 167.74 163.78 3.79 7.75 2.18 2.97 2.61 1.06 1.55 1.55 4.00 25 S
Jay Ushin 201412 3.87 161.03 157.07 3.11 7.06 2.93 3.57 0.56 0.52 0.04 0.04 0.10 25 S
Jay Ushin 201503 3.87 170.39 164.30 3.54 9.63 1.28 3.81 -0.26 -1.03 0.78 0.78 2.01 25 S
Jayaswal Neco Industries 201406 598.63 689.21 0.05 603.24 6.06 92.08 41.68 29.46 20.94 7.05 13.89 13.89 0.23 0 S
Jayaswal Neco Industries 201409 638.63 829.40 0.04 735.42 2.64 96.66 41.50 29.78 25.38 4.23 21.15 21.15 0.34 0 S
Jayaswal Neco Industries 201412 638.63 703.00 0.03 612.10 1.60 92.53 45.18 13.19 34.16 5.55 -44.53 28.61 -0.70 0 S
Jayaswal Neco Industries 201503 638.63 802.50 0.04 710.71 10.09 101.92 56.49 10.41 35.02 23.56 11.46 11.46 0.18 0 S
JBM Auto 201406 10.20 355.94 33.01 336.70 0.57 52.82 8.60 10.00 36.23 12.26 23.97 21.40 20.96 30 C
JBM Auto 201409 10.20 362.46 40.70 357.85 45.30 9.28 8.25 27.78 10.68 17.10 15.11 3.71 30 C
JBM Auto 201412 20.40 337.14 52.55 337.92 2.33 54.10 9.39 10.02 34.69 5.56 29.13 23.62 5.64 30 C
JBM Auto 201503 20.40 327.28 47.88 333.54 1.19 42.81 7.65 11.50 23.67 1.22 22.45 17.58 4.18 30 C
Jeet Machine Tools 201406 1.96 0.03 -0.03 -0.03 -0.03 -0.03 -0.01 0 S
Jeet Machine Tools 201409 1.96 0.15 0.00 0.11 0.01 0.05 0.05 0.05 0.05 0.25 0 S
Jeet Machine Tools 201412 1.96 0.00 0.03 0.01 -0.02 -0.02 -0.02 -0.02 -0.11 0 S
Jeet Machine Tools 201503 1.96 0.03 0.01 -0.02 0.00 -0.02 -0.02 -0.02 -0.11 0 S
Jindal Steel & Power 201406 91.49 4870.44 107.94 3349.40 90.41 1719.39 535.45 667.12 516.82 115.24 401.58 418.13 4.57 160 C
Jindal Steel & Power 201409 91.49 5072.67 70.42 3507.13 44.17 1680.13 598.64 650.32 431.17 31.06 400.11 441.83 4.83 160 C
Jindal Steel & Power 201412 91.49 4973.71 70.95 3619.83 34.27 1459.10 702.40 714.68 -1813.13 -138.02 -1675.11 -1618.78 -17.69 160 C
Jindal Steel & Power 201503 91.49 4481.03 44.56 3735.98 60.83 850.44 770.85 700.71 -677.61 -96.44 -581.17 -519.30 -5.68 160 C
JMG Corporation 201406 4.95 0.31 0.05 -0.26 0.01 -0.27 -0.27 -0.27 -0.14 0 S
JMG Corporation 201409 4.95 0.10 0.29 0.21 0.02 0.01 0.01 0.01 0.01 0.01 0 S
JMG Corporation 201412 4.95 0.10 0.28 0.12 -0.06 0.01 -0.07 -0.07 -0.07 -0.04 0 S
JMG Corporation 201503 4.95 0.25 0.20 -0.05 -0.02 -0.02 -0.06 -0.02 -0.03 0 S
Joonktollee Tea & Industries 201406 4.14 14.22 0.46 15.01 1.90 1.58 1.02 1.20 -0.64 -0.64 -0.64 -1.54 60 S
Joonktollee Tea & Industries 201409 4.14 27.80 0.24 24.57 1.25 4.73 1.11 1.33 2.29 2.29 2.29 5.52 60 S
Joonktollee Tea & Industries 201412 4.14 23.47 0.36 20.84 1.33 4.31 1.04 1.37 1.90 1.90 1.90 4.59 60 S
Joonktollee Tea & Industries 201503 4.14 21.48 -0.01 25.15 2.11 -1.57 1.03 -0.02 -2.58 -0.09 -2.51 -2.49 -6.06 60 S
Jubilant Industries 201406 11.85 211.62 2.80 216.82 0.26 -2.14 9.12 7.64 -18.90 -18.90 -18.90 -15.95 0 C
Jubilant Industries 201409 11.85 226.80 2.88 233.56 0.17 -3.71 9.08 7.63 -20.42 -20.42 -20.42 -17.23 0 C
Jubilant Industries 201412 11.85 223.20 2.66 232.91 0.17 -6.88 9.64 7.55 -24.07 -24.07 -24.07 -20.31 0 C
Jubilant Industries 201503 11.85 186.05 2.19 202.79 1.64 -12.91 10.37 7.92 -54.55 -0.16 -54.39 -54.39 -45.91 0 C
Kaira Can Company 201406 0.92 46.72 42.01 0.23 4.94 0.64 1.25 3.05 0.91 2.14 2.14 23.24 50 S
Kaira Can Company 201409 0.92 27.93 25.24 0.11 2.80 0.93 1.28 0.59 0.32 0.27 0.27 2.94 50 S
Kaira Can Company 201412 0.92 31.76 29.34 0.05 2.47 0.71 1.26 0.51 0.32 0.19 0.19 2.03 50 S
Kaira Can Company 201503 0.92 39.17 0.01 36.35 0.65 3.49 0.78 0.87 1.85 0.71 1.13 1.13 12.29 50 S
Kapashi Commercial 201406 1.00 0.16 0.03 0.13 0.13 0.03 0.11 0.11 0 S
Kapashi Commercial 201409 1.00 0.17 0.02 0.15 0.15 0.04 0.11 0.11 1.13 0 S
Kapashi Commercial 201412 1.00 0.17 0.03 0.15 0.15 0.04 0.11 0.11 1.08 0 S
Kapashi Commercial 201503 1.00 0.18 0.03 0.14 0.01 0.13 0.05 0.09 0.09 0.85 0 S

Co_Name Year Equity N.Sale O.O.I T. Exp O.I PBIDT Int. Dep. PBT T.Tax PAT A.PAT EPS Div (%)
Exp
ecte
d R
esu
lts
on
12
Au
gu
st 2
015
Karma Energy 201406 11.57 3.01 0.18 2.61 0.55 1.12 1.84 1.20 -1.92 -0.30 -1.62 -1.62 -1.40 5 S
Karma Energy 201409 11.57 2.72 0.06 2.41 0.42 0.79 1.78 1.22 1.60 0.22 1.37 1.37 1.19 5 S
Karma Energy 201412 11.57 0.68 0.25 2.16 -0.20 -1.42 2.33 1.22 -4.97 -1.41 -3.56 -3.56 -3.07 5 S
Karma Energy 201503 11.57 7.72 0.71 3.06 0.56 5.93 1.19 1.27 1.07 0.40 0.67 0.67 0.58 5 S
KCP 201406 12.89 134.57 1.12 130.41 3.93 9.21 11.60 8.53 -10.92 -3.38 -7.54 -7.54 -0.61 75 S
KCP 201409 12.89 145.42 3.15 116.79 0.96 32.74 11.95 8.81 11.98 3.04 8.94 8.94 0.67 75 S
KCP 201412 12.89 150.88 2.76 131.50 0.70 22.84 11.77 7.14 2.60 1.52 1.01 1.08 0.07 75 S
KCP 201503 12.89 163.20 3.51 132.73 9.47 43.45 13.54 9.83 20.08 6.63 13.45 13.45 1.04 75 S
Khoobsurat 201406 13.29 0.34 0.04 0.17 0.20 0.02 0.19 0.19 0.19 0.14 0 S
Khoobsurat 201409 13.29 6.24 6.07 0.17 0.02 0.15 0.15 0.15 0.11 0 S
Khoobsurat 201412 13.29 0.31 0.14 0.17 0.05 0.13 0.13 0.13 0.10 0 S
Khoobsurat 201503 13.29 2.67 2.94 -0.27 -0.03 -0.24 0.08 -0.31 -0.31 -0.23 0 S
KLG Capital Services 201406 3.20 0.12 0.02 0.10 0.00 0.10 0.03 0.07 0.07 0.21 0 S
KLG Capital Services 201409 3.20 0.10 0.04 0.04 0.10 0.10 0.03 0.07 0.07 0.23 0 S
KLG Capital Services 201412 3.20 0.07 0.07 0.00 0.00 0.00 0.00 0.00 0.01 0 S
KLG Capital Services 201503 3.20 0.17 0.16 0.01 0.00 0.01 0.01 0.01 0.01 0 S
Kopran 201406 39.05 66.89 1.49 61.21 1.94 9.11 2.92 3.16 3.03 3.03 3.03 0.78 0 S
Kopran 201409 39.05 77.49 1.92 71.88 1.83 9.36 3.04 3.23 3.09 3.09 3.09 0.79 0 S
Kopran 201412 41.10 68.68 1.31 62.93 1.00 8.06 3.24 3.30 1.52 1.52 1.52 0.38 0 S
Kopran 201503 41.10 105.31 2.49 97.95 1.71 11.56 3.76 -0.11 7.84 7.84 7.84 1.99 0 S
Kovai Medical Center & Hospital 201406 10.94 92.04 0.04 69.78 1.41 23.71 5.52 5.76 12.42 4.13 8.29 8.29 7.58 15 S
Kovai Medical Center & Hospital 201409 10.94 98.67 0.10 75.16 1.63 25.25 5.18 5.45 14.62 5.49 9.13 9.13 8.34 15 S
Kovai Medical Center & Hospital 201412 10.94 105.49 0.08 79.23 1.80 28.13 4.96 5.05 18.12 6.20 11.93 11.93 10.90 15 S
Kovai Medical Center & Hospital 201503 10.94 105.25 0.07 83.18 1.78 23.92 4.71 4.94 14.27 4.92 9.35 9.35 8.55 15 S
Kovalam Investment & Trading Company 201406 2.22 0.55 0.02 0.52 0.52 0.17 0.36 0.36 1.60 0 S
Kovalam Investment & Trading Company 201409 2.22 0.86 0.01 -0.09 0.76 0.76 0.19 0.57 0.57 -2.57 0 S
Kovalam Investment & Trading Company 201412 2.22 0.54 0.01 0.52 0.52 0.16 0.37 0.37 1.65 0 S
Kovalam Investment & Trading Company 201503 2.22 1.63 0.00 0.20 1.44 1.44 0.55 0.89 0.89 4.00 0 S
Kulkarni Power Tools 201406 1.70 17.63 0.12 16.94 0.18 0.99 0.99 0.95 -0.95 -0.11 -0.84 -0.84 -2.47 10 S
Kulkarni Power Tools 201409 1.70 24.67 0.15 21.88 0.12 3.06 1.12 0.96 0.98 -0.11 1.09 1.09 3.21 10 S
Kulkarni Power Tools 201412 1.70 21.80 0.20 19.90 0.03 2.13 1.17 0.94 0.02 -0.17 0.19 0.19 0.56 10 S
Kulkarni Power Tools 201503 1.70 21.62 0.18 21.07 1.39 2.12 1.10 0.91 0.11 0.27 -0.16 -0.16 -0.47 10 S
Lahoti Overseas 201406 5.83 104.35 3.79 108.17 3.22 3.20 2.04 0.84 0.33 0.30 0.02 0.02 0.01 20 S
Lahoti Overseas 201409 5.83 119.28 3.12 119.49 1.53 4.45 1.89 -0.23 2.78 1.07 1.71 1.71 0.59 20 S
Lahoti Overseas 201412 5.83 180.07 5.24 178.69 -0.07 6.55 2.25 0.31 4.00 1.54 2.46 2.46 0.84 20 S
Lahoti Overseas 201503 5.83 166.00 6.19 170.04 5.62 7.78 2.76 1.74 3.28 0.08 3.20 3.20 1.10 20 S
Lambodhara Textiles 201406 4.54 31.29 0.76 27.28 0.12 4.89 1.70 1.36 1.83 0.37 1.46 1.46 3.22 10 S
Lambodhara Textiles 201409 4.54 38.26 1.64 34.72 0.12 5.31 1.83 1.35 2.13 0.43 1.71 1.71 3.76 10 S
Lambodhara Textiles 201412 4.54 29.88 0.64 26.33 0.07 4.26 1.64 1.42 1.20 0.24 0.96 0.96 2.11 10 S
Lambodhara Textiles 201503 4.54 29.80 1.46 26.77 0.12 4.61 1.87 1.92 0.82 -0.21 1.02 1.02 2.25 10 S
Ledo Tea Company 201406 0.86 1.06 0.99 0.01 0.08 0.03 0.09 -0.04 -0.04 -0.04 -0.50 0 S
Ledo Tea Company 201409 0.86 3.19 2.71 0.01 0.49 0.06 0.09 0.34 0.34 0.34 3.99 0 S
Ledo Tea Company 201412 0.86 2.00 2.14 0.00 -0.13 0.01 0.10 -0.24 -0.24 -0.24 -2.75 0 S
Ledo Tea Company 201503 0.86 3.51 5.24 0.10 -1.63 0.14 0.09 -1.87 -0.31 0.28 -1.56 3.20 0 S
Longview Tea Company 201406 3.00 0.08 0.16 0.08 0.02 0.07 0.01 0.05 0.05 0.18 0 S
Longview Tea Company 201409 3.00 0.18 0.17 -0.01 0.02 -0.03 -0.03 -0.03 -0.07 0 S
Longview Tea Company 201412 3.00 0.47 0.58 0.17 0.06 0.02 0.05 0.01 0.04 0.04 0.12 0 S
Longview Tea Company 201503 3.00 0.24 0.38 0.17 0.03 0.02 0.00 0.02 -0.02 0.04 0.04 0.12 0 S

Co_Name Year Equity N.Sale O.O.I T. Exp O.I PBIDT Int. Dep. PBT T.Tax PAT A.PAT EPS Div (%)
Exp
ecte
d R
esu
lts
on
12
Au
gu
st 2
015
Lords Chloro Alkali 201406 25.15 0.64 0.06 -0.59 0.00 0.56 -1.15 -1.15 -1.15 -0.46 0 S
Lords Chloro Alkali 201409 25.15 0.90 -0.05 -0.95 0.00 0.55 -1.50 -1.50 -1.50 -0.80 0 S
Lords Chloro Alkali 201412 25.15 0.86 0.10 -0.75 0.07 0.56 -1.37 -1.37 -1.37 -0.55 0 S
Lords Chloro Alkali 201503 25.15 9.05 10.02 0.88 -0.09 0.16 -0.47 0.21 -3.13 3.34 3.34 1.33 0 S
Lotus Eye Hospital And Institute 201406 20.80 7.81 6.66 0.08 1.23 0.00 0.93 0.30 0.09 0.20 0.20 0.10 0 S
Lotus Eye Hospital And Institute 201409 20.80 7.27 7.07 0.05 0.25 0.01 1.02 -0.78 -0.12 -0.66 -0.66 -0.32 0 S
Lotus Eye Hospital And Institute 201412 20.80 7.80 6.96 0.02 0.86 0.02 1.14 -0.30 -0.30 -0.30 -0.14 0 S
Lotus Eye Hospital And Institute 201503 20.80 7.01 7.07 0.28 0.23 0.02 1.68 -1.45 -0.22 -1.23 -1.23 -0.59 0 S
Loyal Textile Mills 201406 4.82 327.32 18.68 304.64 0.46 41.82 18.02 19.89 3.91 1.41 2.50 2.50 5.19 75 S
Loyal Textile Mills 201409 4.82 327.47 20.96 310.47 0.32 38.28 17.60 19.93 0.75 0.30 0.45 0.45 0.95 75 S
Loyal Textile Mills 201412 4.82 332.25 19.47 313.50 0.22 38.44 16.85 20.20 1.41 0.48 0.93 0.93 1.91 75 S
Loyal Textile Mills 201503 4.82 1320.22 80.74 1239.33 1.65 163.29 69.23 82.93 11.13 -4.69 15.82 15.82 32.86 75 C
LT Foods 201406 26.40 657.27 17.48 590.83 0.15 84.07 38.20 8.79 37.08 13.82 23.24 20.89 7.92 23 C
LT Foods 201409 26.40 666.77 13.90 606.68 0.68 74.66 34.15 12.73 27.78 7.99 19.74 19.09 7.24 23 C
LT Foods 201412 26.40 704.15 3.84 645.26 0.16 62.89 34.68 11.61 16.60 5.56 11.04 10.86 4.12 23 C
LT Foods 201503 26.45 706.39 8.82 627.99 0.18 87.40 44.12 13.44 29.84 7.44 22.40 21.65 8.19 23 C
Lykis 201406 18.96 29.23 1.60 30.56 0.23 0.51 0.36 0.07 0.08 0.08 0.08 0.04 0 S
Lykis 201409 18.96 37.06 2.19 38.84 0.12 0.53 0.45 0.07 0.01 0.01 0.01 0.01 0 S
Lykis 201412 18.96 46.44 2.68 47.00 0.08 2.20 0.46 0.07 1.67 0.35 1.32 1.32 0.72 0 S
Lykis 201503 18.96 44.97 2.67 47.36 0.72 0.99 0.45 0.54 0.01 -0.04 0.05 0.05 0.02 0 S
Man InfraConstruction 201406 49.50 95.93 1.77 83.55 14.91 29.06 0.39 3.19 25.48 8.75 16.74 16.09 3.25 14 C
Man InfraConstruction 201409 49.50 60.99 5.64 62.13 33.50 38.00 0.52 3.18 34.30 11.14 23.16 22.82 0.92 14 C
Man InfraConstruction 201412 49.50 55.71 0.48 50.25 9.29 15.22 3.53 3.05 8.65 3.01 5.64 5.42 0.22 14 C
Man InfraConstruction 201503 49.50 53.25 1.05 54.02 12.38 12.65 2.87 2.82 6.96 3.82 3.15 3.08 0.12 14 C
Manaksia 201406 13.11 558.28 6.31 474.44 2.91 93.05 12.99 32.61 47.45 2.43 45.02 44.99 6.87 100 C
Manaksia 201409 13.11 402.35 9.82 346.57 4.16 69.76 10.08 33.24 26.44 0.89 25.56 25.52 3.90 100 C
Manaksia 201412 13.11 225.32 7.73 187.15 0.67 46.57 6.96 12.11 27.51 5.99 21.52 21.56 3.28 100 C
Manaksia 201503 13.11 277.46 0.80 235.03 2.37 45.59 11.20 13.64 20.75 2.09 18.67 18.28 2.85 100 C
Manaksia Steels 201412 6.55 42.37 1.38 40.23 -0.97 2.56 0.05 1.84 0.67 0.67 0.67 0.10 0 S
Manaksia Steels 201503 6.55 68.61 1.64 68.74 2.51 4.02 1.16 1.83 1.03 -0.19 1.22 1.22 0.19 0 S
Marg 201406 38.12 40.31 40.99 0.46 -0.22 39.46 9.80 -49.48 -2.15 -47.33 -47.33 -12.42 0 S
Marg 201409 38.12 46.53 45.01 0.79 2.31 59.73 5.55 -62.97 -1.08 -61.89 -61.89 -16.23 0 S
Marg 201412 38.12 52.93 51.69 1.00 2.24 42.71 3.66 -44.13 0.11 -44.24 -44.24 -11.61 0 S
Marg 201503 38.12 28.41 49.64 6.43 -14.80 3.07 -18.21 0.78 -18.99 -18.99 -4.98 0 S
Mavens Biotech 201406 10.99 0.25 0.19 0.03 0.09 0.04 0.04 0.04 0.04 0 S
Mavens Biotech 201409 10.99 0.18 0.13 0.03 0.07 0.04 0.03 0.03 0.03 0 S
Mavens Biotech 201412 10.99 0.23 0.17 0.03 0.08 0.04 0.04 0.04 0.04 0 S
Mavens Biotech 201503 10.99 0.40 0.24 0.16 0.15 0.01 0.01 0.01 0 S
Max India 201406 53.26 15.05 20.77 98.36 92.64 0.10 1.00 91.54 10.28 81.26 81.26 3.05 180 S
Max India 201409 53.30 14.89 23.15 0.01 -8.25 0.10 1.11 -9.46 1.84 -11.30 -11.30 -0.42 180 S
Max India 201412 53.30 416.37 27.84 0.07 388.60 0.10 1.10 387.40 58.17 329.23 329.23 12.35 180 S
Max India 201503 53.30 38.76 39.41 1.15 0.50 0.16 1.17 -0.83 7.42 -8.25 -8.25 -0.31 180 S
Maxwell Industries 201406 12.62 66.05 0.49 59.55 0.08 7.07 3.07 0.87 3.13 1.01 2.12 2.12 10 S
Maxwell Industries 201409 12.62 66.94 0.45 61.59 0.18 5.98 3.12 1.24 1.62 0.49 1.13 1.13 10 S
Maxwell Industries 201412 12.62 62.33 0.50 55.43 0.06 7.46 3.11 1.01 3.34 1.13 2.21 2.21 0.35 10 S
Maxwell Industries 201503 12.62 63.86 0.49 56.68 0.17 7.85 3.24 1.79 2.82 1.28 1.55 1.55 0.24 10 S

Co_Name Year Equity N.Sale O.O.I T. Exp O.I PBIDT Int. Dep. PBT T.Tax PAT A.PAT EPS Div (%)
Exp
ecte
d R
esu
lts
on
12
Au
gu
st 2
015
Medi-Caps 201406 12.47 7.04 0.10 6.31 0.83 0.08 0.75 0.18 0.57 0.57 0.45 0 S
Medi-Caps 201409 12.47 7.56 0.14 7.28 0.51 0.93 0.09 0.84 0.27 0.57 0.57 0.46 0 S
Medi-Caps 201412 12.47 6.59 0.03 6.22 0.05 0.45 0.09 0.37 0.20 0.17 0.17 0.13 0 S
Medi-Caps 201503 12.47 6.18 0.20 5.71 0.18 0.85 0.07 0.78 0.15 0.63 0.63 0.51 0 S
Meenakshi Enterprises 201406 12.40 0.16 0.08 0.08 0.00 0.08 0.02 0.06 0.06 0.04 0 S
Meenakshi Enterprises 201409 12.40 2.41 2.32 0.09 0.00 0.09 0.03 0.05 0.05 0.04 0 S
Meenakshi Enterprises 201412 12.40 0.11 0.05 0.06 0.00 0.06 0.06 0.06 0.05 0 S
Meenakshi Enterprises 201503 12.40 1.77 1.93 -0.16 0.01 -0.18 0.01 -0.19 -0.19 -0.15 0 S
Mega Corporation 201406 10.00 0.43 0.00 0.43 0.00 0.00 0.26 -0.26 -0.26 -0.26 0 S
Mega Corporation 201409 10.00 0.46 0.00 0.35 0.11 0.00 0.02 0.08 0.08 0.08 0 S
Mega Corporation 201412 10.00 0.21 0.00 0.06 0.15 0.00 0.02 0.12 0.12 0.12 0 S
Mega Corporation 201503 10.00 0.21 0.01 0.06 0.16 0.00 0.09 0.07 -0.04 0.11 0.11 0 S
Merck 201406 16.60 232.65 6.04 208.66 4.74 34.77 3.13 31.63 10.63 21.00 21.00 12.65 60 S
Merck 201409 16.60 214.30 6.71 196.67 5.09 29.43 2.89 26.54 8.95 17.58 17.58 10.59 60 S
Merck 201412 16.60 198.35 15.73 213.65 5.50 5.93 3.56 2.37 1.29 1.09 1.09 0.65 60 S
Merck 201503 16.60 189.71 9.05 185.82 4.94 17.88 4.43 13.45 3.83 9.62 9.62 5.80 60 S
Mid India Industries 201406 16.30 8.60 8.45 0.00 0.15 0.03 0.07 0.05 0.01 0.04 0.04 0.03 0 S
Mid India Industries 201409 16.30 8.46 8.51 0.03 -0.02 0.03 0.07 -0.11 -0.11 -0.11 -0.07 0 S
Mid India Industries 201412 16.30 3.40 3.41 0.01 0.00 0.00 0.07 -0.07 0.01 -0.08 -0.08 -0.05 0 S
Mid India Industries 201503 16.30 8.76 8.44 0.00 0.32 0.01 0.03 0.28 0.02 0.26 0.26 0.16 0 S
Milkfood 201406 4.89 101.19 1.08 99.72 2.55 2.49 1.46 -1.40 -1.40 -1.40 -2.86 0 S
Milkfood 201409 4.89 58.54 0.03 56.67 0.03 1.93 2.34 1.75 -2.16 -2.16 -2.16 -4.41 0 S
Milkfood 201412 4.89 113.78 0.81 106.28 0.03 8.34 2.93 1.53 3.88 3.88 3.88 7.93 0 S
Milkfood 201503 4.89 95.90 0.11 92.38 1.00 4.63 1.58 1.64 1.41 0.71 0.70 0.70 1.43 0 S
Minaxi Textiles 201406 4.94 10.11 8.35 0.01 1.77 0.77 0.40 0.59 0.12 0.47 0.47 0 S
Minaxi Textiles 201409 4.94 13.81 12.25 0.01 1.56 0.63 0.41 0.52 0.24 0.28 0.28 0 S
Minaxi Textiles 201412 4.94 20.48 17.44 0.01 3.05 1.21 0.68 1.16 0.21 0.95 0.95 0.19 0 S
Minaxi Textiles 201503 4.94 20.20 17.81 0.41 2.79 1.02 0.80 0.96 0.21 0.75 0.75 0.15 0 S
Modi Naturals 201406 11.12 39.99 38.85 1.14 0.58 0.48 0.08 0.08 0.08 0.07 0 S
Modi Naturals 201409 11.12 49.59 48.24 1.35 0.71 0.49 0.14 0.14 0.14 0.20 0 S
Modi Naturals 201412 11.12 72.81 71.71 1.10 0.58 0.49 0.03 0.03 0.03 0.03 0 S
Modi Naturals 201503 11.12 71.56 71.20 0.37 0.76 -0.29 -0.11 -0.01 -0.09 -0.09 0.14 0 S
Modi Udyog 201412 30.24 2.02 2.00 0.02 0.02 0.01 0.01 0.01 0 S
Modi Udyog 201503 30.24 1.33 1.35 -0.02 -0.02 0.01 -0.03 -0.03 -0.01 0 S
MOIL 201406 168.00 200.63 102.14 70.99 169.48 8.83 160.66 54.61 106.05 106.05 6.31 85 S
MOIL 201409 168.00 242.87 141.12 74.84 176.60 10.17 166.43 55.29 111.14 111.14 6.62 85 S
MOIL 201412 168.00 218.39 115.09 72.16 175.46 9.37 166.09 57.74 108.35 108.35 6.45 85 S
MOIL 201503 168.00 161.37 85.87 98.61 174.11 16.71 157.40 54.93 102.47 102.47 6.10 85 S
Moongipa Capital Finance 201406 3.06 0.13 0.13 0.03 0.03 0.01 0.00 0.02 0.01 0.01 0.01 0.05 0 S
Moongipa Capital Finance 201409 3.06 0.18 0.13 0.03 0.08 0.01 0.00 0.07 0.02 0.05 0.05 0.15 0 S
Moongipa Capital Finance 201412 3.06 0.16 0.15 0.01 0.02 0.01 0.00 0.01 0.00 0.01 0.01 0.02 0 S
Moongipa Capital Finance 201503 3.06 0.12 0.15 0.01 -0.02 0.01 -0.03 0.00 -0.03 -0.03 -0.11 0 S
Moongipa Securities 201412 5.01 1.24 0.00 1.30 0.10 0.03 0.00 0.00 0.03 0.01 0.02 0.02 0.04 0 S
Moongipa Securities 201503 5.01 1.44 0.00 1.72 0.11 -0.17 0.01 0.01 -0.18 -0.06 -0.13 -0.13 -0.26 0 S
Moschip Semiconductor Technology 201406 46.04 1.21 1.78 0.02 -0.55 0.47 0.22 -1.24 -1.23 -1.23 -0.27 0 C
Moschip Semiconductor Technology 201409 46.04 0.99 1.91 0.02 -0.90 0.56 0.11 -1.57 -1.41 -1.41 -0.34 0 C
Moschip Semiconductor Technology 201412 46.04 1.21 2.09 0.02 -0.85 0.60 0.11 -1.56 -1.56 -1.56 -0.34 0 C
Moschip Semiconductor Technology 201503 46.04 2.59 2.72 0.15 0.01 0.61 -0.03 -0.57 -0.44 -0.44 -0.10 0 C

Co_Name Year Equity N.Sale O.O.I T. Exp O.I PBIDT Int. Dep. PBT T.Tax PAT A.PAT EPS Div (%)
Exp
ecte
d R
esu
lts
on
12
Au
gu
st 2
015
Mukand Engineers 201406 12.58 26.36 0.12 24.57 0.41 2.32 1.39 0.32 0.61 0.19 0.42 0.42 0.33 0 S
Mukand Engineers 201409 12.58 40.59 0.19 38.91 0.40 2.27 1.38 0.27 0.62 0.23 0.39 0.39 0.31 0 S
Mukand Engineers 201412 12.58 35.82 0.07 33.93 0.33 2.29 1.63 0.30 0.36 0.12 0.24 0.24 0.19 0 S
Mukand Engineers 201503 12.58 36.52 0.26 35.48 0.29 1.59 1.58 0.25 -0.24 -0.95 0.71 0.71 0.56 0 S
Mukand 201406 141.42 673.16 5.22 609.80 13.20 81.78 59.60 18.45 0.61 0.22 0.39 0.39 0.03 0 S
Mukand 201409 141.42 757.88 5.97 677.60 3.45 89.70 65.73 18.49 2.36 0.62 1.75 1.75 0.12 0 S
Mukand 201412 141.42 713.09 4.71 623.42 1.93 96.31 69.63 18.75 4.81 1.30 3.52 3.52 0.25 0 S
Mukand 201503 141.42 650.06 9.56 576.29 7.14 90.47 71.13 19.27 -5.65 -1.58 -4.07 -4.07 0.12 0 S
Nagreeka Capital & Infrastructure 201406 6.31 4.95 0.10 4.85 4.66 0.01 0.18 0.18 0.18 0.15 0 S
Nagreeka Capital & Infrastructure 201409 6.31 6.41 0.19 6.22 5.87 0.01 0.35 0.35 0.35 0.27 0 S
Nagreeka Capital & Infrastructure 201412 6.31 -5.73 2.10 -7.83 6.04 0.01 -13.88 -13.88 -13.88 -11.00 0 S
Nagreeka Capital & Infrastructure 201503 6.31 11.28 6.52 4.76 6.76 0.01 -2.00 -39.18 37.16 37.16 29.46 0 S
Nagreeka Exports 201406 6.26 124.06 113.57 0.04 10.53 6.51 2.56 1.45 1.45 1.45 1.16 10 S
Nagreeka Exports 201409 6.26 91.81 83.98 0.15 7.98 4.85 2.53 0.60 0.60 0.60 0.48 10 S
Nagreeka Exports 201412 6.26 133.55 125.79 0.15 7.91 4.88 2.56 0.46 0.46 0.46 0.37 10 S
Nagreeka Exports 201503 6.26 123.11 123.34 5.53 5.30 4.88 -1.58 2.00 -0.53 2.53 2.53 2.03 10 S
Nahar Industrial Enterprises 201406 39.84 485.57 4.58 435.17 2.27 57.25 27.86 35.81 -6.41 -1.01 -5.40 -5.40 -1.36 10 S
Nahar Industrial Enterprises 201409 39.84 430.04 3.86 392.83 1.11 42.17 23.91 36.61 -18.34 -5.49 -12.85 -12.85 -3.23 10 S
Nahar Industrial Enterprises 201412 39.84 442.72 6.64 396.28 1.15 54.24 20.49 31.75 -5.99 -5.99 -5.99 -1.50 10 S
Nahar Industrial Enterprises 201503 39.84 423.86 5.69 379.47 1.14 51.22 24.64 31.08 -4.49 -0.73 -3.76 -3.76 -0.94 10 S
Natco Pharma 201406 33.07 190.48 19.48 152.79 1.52 58.69 6.56 11.14 40.99 8.78 32.21 33.46 10.12 50 C
Natco Pharma 201409 33.07 209.06 10.17 160.38 3.19 62.04 7.24 11.15 43.65 12.41 31.24 32.37 9.79 50 C
Natco Pharma 201412 33.23 184.27 11.19 147.90 7.34 54.90 8.51 12.18 19.08 5.42 13.66 14.34 4.33 50 C
Natco Pharma 201503 33.23 190.57 10.23 151.34 3.20 52.66 9.37 12.80 30.49 -22.66 53.15 54.44 16.41 50 C
National Aluminium Company 201406 1288.62 1651.29 28.75 1403.55 190.36 466.85 0.00 95.51 371.34 100.35 270.99 270.99 1.05 30 S
National Aluminium Company 201409 1288.62 1955.34 40.18 1521.22 168.61 642.91 0.00 103.76 539.15 197.63 341.52 341.52 1.33 30 S
National Aluminium Company 201412 1288.62 1876.81 29.19 1378.79 151.61 678.82 0.00 116.50 562.32 207.85 354.47 354.47 1.38 30 S
National Aluminium Company 201503 1288.62 1778.46 22.79 1373.23 162.06 590.08 97.89 640.61 285.74 354.87 354.87 1.38 30 S
National Fertilizers 201406 490.58 2160.99 1.21 2065.39 6.03 102.84 58.46 18.58 25.80 7.78 18.02 18.02 0.37 0 S
National Fertilizers 201409 490.58 2322.45 1.18 2157.48 8.09 174.24 63.93 26.35 83.96 22.21 61.75 61.75 1.26 0 S
National Fertilizers 201412 490.58 2481.28 1.52 2308.22 8.85 183.43 68.94 18.60 95.89 48.85 47.04 47.04 0.96 0 S
National Fertilizers 201503 490.58 1554.97 1.31 1612.03 13.88 -41.87 110.03 9.03 -160.93 -60.36 -100.57 -100.57 -2.05 0 S
NDA Securities 201406 5.09 1.17 1.14 0.13 0.16 0.03 0.05 0.08 0.00 0.08 0.08 0.17 0 S
NDA Securities 201409 5.09 1.12 1.25 0.14 0.01 0.03 0.05 -0.07 -0.07 -0.07 -0.13 0 S
NDA Securities 201412 5.09 0.97 1.19 0.14 -0.08 0.04 0.05 -0.17 0.00 -0.17 -0.17 -0.33 0 S
NDA Securities 201503 5.09 1.35 1.33 0.15 0.18 0.03 0.15 0.00 0.03 -0.03 -0.03 0.07 0 S
Noesis Industries 201406 26.33 0.21 -0.20 8.23 0.14 -8.57 -8.57 -8.57 -3.25 0 S
Noesis Industries 201409 26.33 0.00 0.17 -0.17 0.44 0.14 -0.75 -8.44 -0.75 2.63 0 S
Noesis Industries 201412 26.33 2.09 -2.09 0.07 0.13 -2.29 -2.29 -2.29 -0.86 0 S
Noesis Industries 201503 26.33 0.01 5.44 -5.44 0.08 0.31 -6.82 -0.05 -6.77 -6.77 -2.57 0 S
Nova Iron & Steel 201406 36.14 3.72 4.03 4.66 0.02 3.11 2.27 0.53 0.32 0.32 0.32 0.09 0 S
Nova Iron & Steel 201409 36.14 0.66 1.52 0.02 -0.85 1.52 0.53 -2.91 3.77 -2.91 1.04 0 S
Nova Iron & Steel 201412 36.14 0.19 1.76 0.02 -1.55 1.65 0.54 -3.73 -3.73 -3.73 -1.03 0 S
Nova Iron & Steel 201503 36.14 0.69 1.67 0.14 -0.85 1.34 0.10 -2.28 -0.10 -2.18 -2.18 -0.60 0 S
Nu Tek India 201406 77.26 24.07 20.92 0.09 3.24 0.88 1.78 0.58 0.17 0.41 0.41 0.03 0 C
Nu Tek India 201409 77.26 21.80 18.86 0.10 3.04 0.70 1.69 0.64 0.16 0.48 0.48 0.03 0 C
Nu Tek India 201412 77.26 26.12 26.53 0.01 -0.41 0.67 1.79 -2.87 0.25 -3.12 -3.12 -0.20 0 C
Nu Tek India 201503 77.26 9.64 9.91 0.16 -0.11 0.73 1.79 -2.63 -0.03 -2.60 -2.60 -0.17 0 C

Co_Name Year Equity N.Sale O.O.I T. Exp O.I PBIDT Int. Dep. PBT T.Tax PAT A.PAT EPS Div (%)
Exp
ecte
d R
esu
lts
on
12
Au
gu
st 2
015
ObjectOne Information Systems 201406 10.51 6.89 6.63 0.02 0.28 0.00 0.17 0.11 0.02 0.10 0.10 0.09 0 C
ObjectOne Information Systems 201409 10.51 1.29 1.21 0.02 0.10 0.00 0.17 -0.08 0.01 -0.09 -0.09 -0.08 0 S
ObjectOne Information Systems 201412 10.51 1.65 1.35 -0.03 0.28 0.00 0.09 0.19 0.01 0.18 0.18 0.17 0 S
ObjectOne Information Systems 201503 10.51 1.65 1.44 0.02 0.22 0.01 0.12 0.10 0.02 0.08 0.08 0.08 0 S
Octal Credit Capital 201409 5.00 0.08 0.02 0.01 0.06 0.00 0.00 0.06 0.00 0.06 0.06 0.12 0 S
Octal Credit Capital 201412 5.00 0.08 0.02 0.00 0.06 0.00 0.06 0.06 0.06 0.11 0 S
Octal Credit Capital 201503 5.00 0.16 0.47 0.25 -0.06 0.00 -0.06 -0.01 -0.05 -0.05 -0.10 0 S
Oil India 201406 601.14 2514.77 140.56 1400.17 281.68 1536.84 85.74 164.74 1286.36 434.49 851.87 851.87 14.17 215 S
Oil India 201409 601.14 2080.96 111.52 1383.29 429.78 1238.97 78.07 194.04 966.86 358.53 608.33 608.33 10.12 215 S
Oil India 201412 601.14 2061.53 133.22 1542.90 295.15 947.00 79.92 177.25 689.83 191.55 498.28 498.28 8.29 215 S
Oil India 201503 601.14 2572.86 140.13 1889.71 265.02 1088.30 96.95 205.70 785.65 233.93 551.72 551.72 9.18 215 S
Olympic Management & Financial Services 201406 3.01 0.00 0.01 0.01 0.01 0.04 -0.03 -0.04 -0.03 -0.12 0 S
Olympic Management & Financial Services 201409 3.01 0.01 0.02 0.01 0.04 -0.04 -0.05 -0.04 -0.15 0 S
Olympic Management & Financial Services 201412 3.01 0.01 0.02 0.01 0.00 0.04 -0.04 -0.04 -0.04 -0.14 0 S
Olympic Management & Financial Services 201503 3.01 0.02 0.03 0.01 0.00 0.04 -0.04 -0.04 -0.04 -0.14 0 S
Oscar Global 201406 3.29 4.05 0.02 3.88 0.19 0.03 0.16 0.04 0.12 0.12 0.35 0 S
Oscar Global 201409 3.29 4.75 4.40 0.35 0.05 0.30 0.03 0.27 0.27 0.83 0 S
Oscar Global 201412 3.29 5.06 4.93 0.13 0.06 0.07 0.04 0.03 0.03 0.09 0 S
Oscar Global 201503 3.29 2.65 0.04 2.80 -0.11 0.00 0.06 -0.17 0.04 -0.21 -0.21 -0.64 0 S
Pan India Corporation 201406 214.26 0.13 -0.13 0.00 -0.14 -0.14 -0.14 -0.01 0 S
Pan India Corporation 201409 214.26 0.08 0.00 -0.08 0.00 -0.09 -0.09 -0.09 0 S
Pan India Corporation 201412 214.26 0.05 0.01 -0.05 0.00 -0.05 -0.05 -0.05 0 S
Pan India Corporation 201503 214.26 0.32 0.29 0.01 0.04 0.04 0.01 0.01 0.01 -0.01 0 S
Panyam Cements & Mineral Industries 201406 16.02 4.64 1.13 -3.51 2.58 1.46 -7.55 -7.55 -7.55 -4.71 0 S
Panyam Cements & Mineral Industries 201409 16.02 8.24 11.27 1.15 -1.88 2.28 1.43 -5.59 -5.59 -5.59 -3.49 0 S
Panyam Cements & Mineral Industries 201412 16.02 26.22 28.01 1.15 -0.64 3.67 1.16 -5.48 -5.48 -5.48 -3.42 0 S
Panyam Cements & Mineral Industries 201503 16.02 54.53 47.73 1.80 8.60 3.27 1.87 3.46 3.46 3.46 2.16 0 S
Paramount Communications 201406 25.05 104.12 0.94 103.14 0.25 2.18 8.96 2.50 -7.11 -7.11 -7.11 -0.57 0 C
Paramount Communications 201409 25.05 93.03 0.46 108.40 0.22 -14.70 9.28 2.17 -26.14 -26.14 -26.14 -2.09 0 C
Paramount Communications 201412 25.05 116.92 4.86 135.27 0.28 -13.20 22.35 2.16 -37.71 -37.71 -37.71 -3.01 0 C
Paramount Communications 201503 25.05 129.42 2.82 143.41 1.33 -9.83 17.71 2.47 -30.00 -30.00 -30.00 -2.40 0 C
Pearl Polymers 201406 16.83 56.45 0.10 53.89 0.19 2.85 1.89 1.59 -0.63 -0.63 -0.63 -0.38 0 S
Pearl Polymers 201409 16.83 46.39 0.13 44.43 0.21 2.30 1.57 1.47 -0.74 -0.74 -0.74 -0.44 0 S
Pearl Polymers 201412 16.83 45.25 1.54 45.91 0.61 1.48 1.38 1.51 -1.40 -1.40 -1.40 -0.83 0 S
Pearl Polymers 201503 16.83 49.88 0.87 46.62 0.06 4.20 1.39 1.96 0.85 0.59 0.26 0.26 0.15 0 S
Pennar Industries 201406 60.17 276.70 254.23 0.51 22.98 7.56 5.83 9.59 2.81 6.78 5.81 0.48 0 C
Pennar Industries 201409 60.17 289.23 264.98 0.74 24.99 7.47 3.11 14.41 7.33 7.08 6.37 0.53 0 C
Pennar Industries 201412 60.17 295.03 269.41 0.11 25.73 7.62 4.37 13.74 5.05 8.69 7.70 0.64 0 C
Pennar Industries 201503 60.17 366.67 321.48 1.97 47.16 13.76 4.54 28.86 8.28 20.58 16.02 1.33 0 C
Perfectpac 201406 1.33 20.86 20.40 0.18 0.65 0.39 0.38 -2.22 -0.72 -1.50 -1.50 -11.32 0 S
Perfectpac 201409 1.33 14.52 14.69 0.28 0.10 0.32 0.30 13.26 2.97 10.29 10.29 77.22 0 S
Perfectpac 201412 1.33 12.56 12.40 0.00 0.16 0.19 0.31 -0.38 -0.13 -0.25 -0.25 -1.87 0 S
Perfectpac 201503 1.33 15.58 15.44 0.09 0.22 0.21 1.09 -0.75 -0.51 -0.24 -0.24 -1.79 0 S
Phoenix International 201406 16.79 8.02 5.70 0.03 2.35 1.56 0.46 0.33 0.10 0.23 0.23 0.14 0 S
Phoenix International 201409 16.79 10.03 7.74 0.04 2.34 1.54 0.46 0.33 0.05 0.28 0.28 0.17 0 S
Phoenix International 201412 16.79 9.89 7.59 0.04 2.34 1.50 0.46 0.38 0.10 0.28 0.28 0.17 0 S
Phoenix International 201503 16.79 11.23 9.47 0.11 1.87 1.50 -0.06 0.43 0.30 0.13 0.13 0.08 0 S

Co_Name Year Equity N.Sale O.O.I T. Exp O.I PBIDT Int. Dep. PBT T.Tax PAT A.PAT EPS Div (%)
Exp
ecte
d R
esu
lts
on
12
Au
gu
st 2
015
Pilani Investment & Industries Corporation 201406 7.91 3.61 0.46 0.57 0.19 3.68 0.03 3.65 0.75 2.90 2.90 3.67 250 S
Pilani Investment & Industries Corporation 201409 7.91 37.85 0.46 0.67 37.64 0.03 37.61 0.82 36.79 36.79 46.51 250 S
Pilani Investment & Industries Corporation 201412 7.91 3.53 0.52 0.54 3.51 0.03 3.47 0.76 2.72 2.72 3.43 250 S
Pilani Investment & Industries Corporation 201503 7.91 3.64 0.46 4.57 0.00 -0.47 0.04 -0.51 -0.52 0.02 0.02 0.02 250 S
Pix Transmissions 201406 13.63 47.52 0.97 38.06 10.43 5.68 3.83 0.92 0.00 0.92 0.92 0.71 15 S
Pix Transmissions 201409 13.63 51.56 0.31 42.69 9.17 4.56 2.51 2.10 -1.37 3.47 3.47 2.55 15 S
Pix Transmissions 201412 13.63 49.65 0.84 42.84 7.65 4.18 2.72 0.75 2.44 -1.69 -1.69 -1.24 15 S
Pix Transmissions 201503 13.63 54.31 0.50 45.41 9.40 4.31 2.84 2.25 1.51 0.75 0.75 0.55 15 S
Plastiblends India 201406 6.50 116.97 105.53 0.44 11.88 0.94 1.66 9.28 3.29 5.99 5.99 4.61 110 S
Plastiblends India 201409 6.50 133.42 118.63 0.93 15.72 0.88 1.61 13.24 4.33 8.90 8.90 6.85 110 S
Plastiblends India 201412 6.50 120.51 109.78 0.44 11.17 0.98 1.59 8.60 2.60 6.00 6.00 4.61 110 S
Plastiblends India 201503 6.50 123.47 109.62 0.04 13.89 0.81 1.39 11.70 3.44 9.16 8.26 7.05 110 S
Polygenta Technologies 201406 122.66 14.31 0.09 25.35 0.35 -10.60 3.47 4.24 -18.30 -18.30 -18.30 -1.26 0 S
Polygenta Technologies 201409 144.73 16.84 0.11 27.84 0.27 -10.62 5.26 4.07 -19.95 -19.95 -19.95 -1.38 0 S
Polygenta Technologies 201412 144.73 9.95 0.04 18.11 0.23 -7.89 3.76 4.07 -15.72 -15.72 -15.72 -1.10 0 S
Polygenta Technologies 201503 144.73 13.07 0.18 19.87 5.37 -1.26 3.28 3.13 -10.06 -0.77 -9.29 -9.29 -0.64 0 S
Polymechplast Machines 201406 5.28 5.36 0.02 5.75 -0.38 0.12 0.06 -0.56 -0.56 -0.56 -0.96 0 S
Polymechplast Machines 201409 5.28 4.94 0.01 5.01 -0.06 0.13 0.06 -0.25 -0.25 -0.25 -0.43 0 S
Polymechplast Machines 201412 5.28 4.97 0.01 4.99 -0.01 0.13 0.06 -0.19 -0.19 -0.19 -0.33 0 S
Polymechplast Machines 201503 5.28 8.09 0.03 7.72 0.40 0.23 0.12 1.70 0.14 1.56 1.56 2.70 0 S
Polytex India 201406 13.50 0.22 0.13 0.09 0.00 0.08 0.08 0.08 0.06 0 S
Polytex India 201409 13.50 0.22 0.12 0.10 0.01 0.10 0.10 0.10 0.07 0 S
Polytex India 201412 13.50 0.22 0.12 0.10 0.01 0.10 0.10 0.10 0.07 0 S
Polytex India 201503 13.50 0.24 -0.02 0.18 0.04 -0.01 0.05 0.05 0.05 0.04 0 S
Prakash Constrowell 201406 12.57 15.53 0.08 13.26 0.06 2.41 1.21 0.42 0.78 0.25 0.53 0.53 0.04 0 S
Prakash Constrowell 201409 12.57 25.67 0.39 23.74 0.18 2.50 0.75 0.42 1.32 0.43 0.89 0.89 0.07 0 S
Prakash Constrowell 201412 12.57 26.05 0.42 23.59 0.05 2.93 1.13 0.42 1.38 0.45 0.93 0.93 0.07 0 S
Prakash Constrowell 201503 12.57 60.92 0.18 58.97 0.15 2.27 0.31 0.42 1.55 0.75 0.77 0.79 0.06 0 S
Premier Pipes 201406 3.55 8.04 7.71 0.04 0.37 0.17 0.11 0.08 0.03 0.06 0.06 0.16 0 S
Premier Pipes 201409 3.55 9.47 8.84 0.02 0.64 0.36 0.11 0.17 0.05 0.12 0.12 0.33 0 S
Premier Pipes 201412 3.55 8.69 8.38 0.31 0.09 0.12 0.10 0.03 0.07 0.07 0.20 0 S
Premier Pipes 201503 3.55 7.86 7.88 0.47 0.44 0.44 -0.03 0.00 -0.03 0.02 0.02 0.07 0 S
Premier Polyfilm 201406 10.59 18.40 0.19 17.21 1.38 0.26 0.39 0.73 0.17 0.56 0.56 0.27 0 S
Premier Polyfilm 201409 10.59 20.01 0.33 19.04 1.30 0.11 -0.05 1.24 0.24 1.00 1.00 0.48 0 S
Premier Polyfilm 201412 10.59 23.76 0.32 22.14 1.94 0.13 0.17 1.64 0.39 1.25 1.25 0.60 0 S
Premier Polyfilm 201503 10.59 22.41 0.40 20.99 1.82 0.32 0.98 0.52 0.60 -0.08 -0.08 -0.04 0 S
PTC Industries 201412 5.24 25.25 0.93 21.14 0.62 5.66 0.45 1.63 2.83 0.56 2.28 2.28 4.59 0 S
PTC Industries 201503 5.24 25.22 0.46 21.08 0.24 4.83 0.73 1.60 0.97 0.15 0.82 0.82 1.70 0 S
Punit Commercials 201406 0.24 2.78 0.82 2.66 0.94 0.00 0.94 0.94 0.94 39.14 0 S
Punit Commercials 201409 0.24 10.37 -0.09 10.34 -0.06 0.02 -0.07 -0.07 -0.07 -3.10 0 S
Punit Commercials 201412 0.24 2.78 0.10 2.90 -0.02 0.05 -0.07 -0.07 -0.07 -2.93 0 S
Punit Commercials 201503 0.24 -0.58 0.14 -0.71 0.06 0.01 -0.79 0.00 -0.78 -0.78 -32.65 0 S
Punjab Communications 201406 12.02 3.61 0.14 8.90 2.56 -2.59 0.02 0.04 -2.66 -2.66 -2.66 -2.21 0 S
Punjab Communications 201409 12.02 4.15 0.03 9.90 2.47 -3.26 0.03 0.04 -3.33 -3.33 -3.33 -2.77 0 S
Punjab Communications 201412 12.02 5.21 0.01 10.23 2.60 -2.41 0.04 0.07 -2.52 -2.52 -2.52 -2.10 0 S
Punjab Communications 201503 12.02 7.80 0.07 10.08 2.43 0.22 0.06 0.23 -1.76 -1.76 -1.76 -1.46 0 S
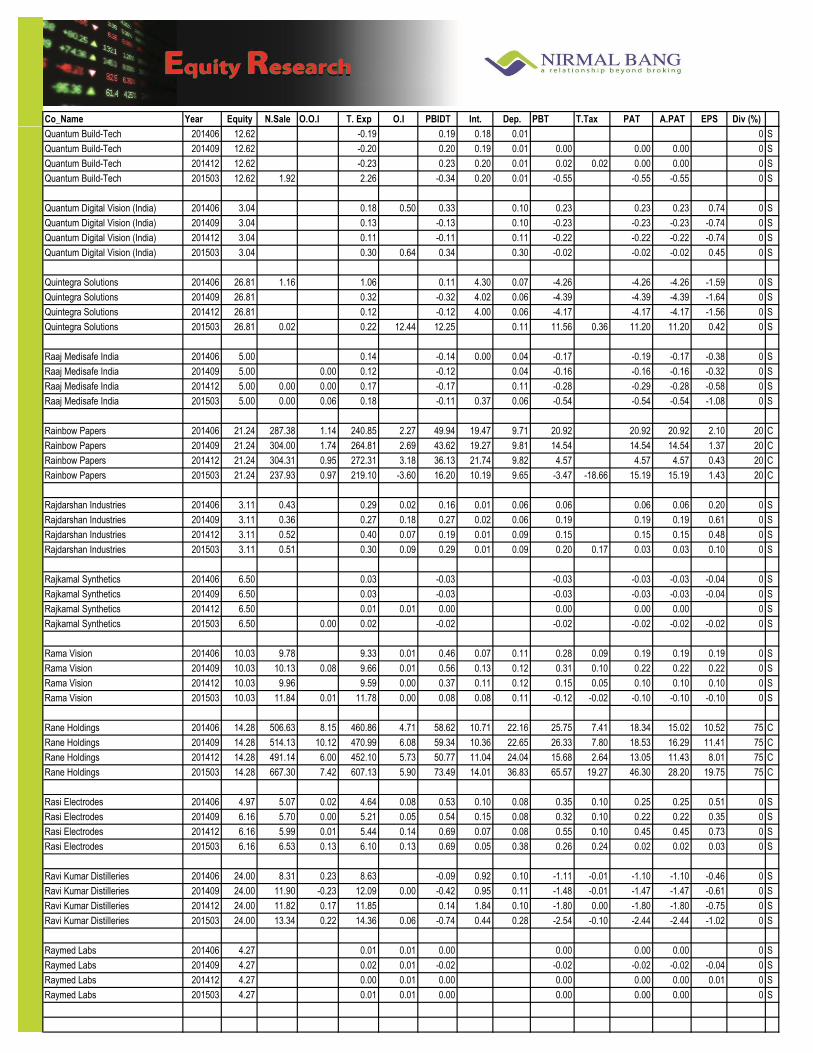
Co_Name Year Equity N.Sale O.O.I T. Exp O.I PBIDT Int. Dep. PBT T.Tax PAT A.PAT EPS Div (%)
Exp
ecte
d R
esu
lts
on
12
Au
gu
st 2
015
Quantum Build-Tech 201406 12.62 -0.19 0.19 0.18 0.01 0 S
Quantum Build-Tech 201409 12.62 -0.20 0.20 0.19 0.01 0.00 0.00 0.00 0 S
Quantum Build-Tech 201412 12.62 -0.23 0.23 0.20 0.01 0.02 0.02 0.00 0.00 0 S
Quantum Build-Tech 201503 12.62 1.92 2.26 -0.34 0.20 0.01 -0.55 -0.55 -0.55 0 S
Quantum Digital Vision (India) 201406 3.04 0.18 0.50 0.33 0.10 0.23 0.23 0.23 0.74 0 S
Quantum Digital Vision (India) 201409 3.04 0.13 -0.13 0.10 -0.23 -0.23 -0.23 -0.74 0 S
Quantum Digital Vision (India) 201412 3.04 0.11 -0.11 0.11 -0.22 -0.22 -0.22 -0.74 0 S
Quantum Digital Vision (India) 201503 3.04 0.30 0.64 0.34 0.30 -0.02 -0.02 -0.02 0.45 0 S
Quintegra Solutions 201406 26.81 1.16 1.06 0.11 4.30 0.07 -4.26 -4.26 -4.26 -1.59 0 S
Quintegra Solutions 201409 26.81 0.32 -0.32 4.02 0.06 -4.39 -4.39 -4.39 -1.64 0 S
Quintegra Solutions 201412 26.81 0.12 -0.12 4.00 0.06 -4.17 -4.17 -4.17 -1.56 0 S
Quintegra Solutions 201503 26.81 0.02 0.22 12.44 12.25 0.11 11.56 0.36 11.20 11.20 0.42 0 S
Raaj Medisafe India 201406 5.00 0.14 -0.14 0.00 0.04 -0.17 -0.19 -0.17 -0.38 0 S
Raaj Medisafe India 201409 5.00 0.00 0.12 -0.12 0.04 -0.16 -0.16 -0.16 -0.32 0 S
Raaj Medisafe India 201412 5.00 0.00 0.00 0.17 -0.17 0.11 -0.28 -0.29 -0.28 -0.58 0 S
Raaj Medisafe India 201503 5.00 0.00 0.06 0.18 -0.11 0.37 0.06 -0.54 -0.54 -0.54 -1.08 0 S
Rainbow Papers 201406 21.24 287.38 1.14 240.85 2.27 49.94 19.47 9.71 20.92 20.92 20.92 2.10 20 C
Rainbow Papers 201409 21.24 304.00 1.74 264.81 2.69 43.62 19.27 9.81 14.54 14.54 14.54 1.37 20 C
Rainbow Papers 201412 21.24 304.31 0.95 272.31 3.18 36.13 21.74 9.82 4.57 4.57 4.57 0.43 20 C
Rainbow Papers 201503 21.24 237.93 0.97 219.10 -3.60 16.20 10.19 9.65 -3.47 -18.66 15.19 15.19 1.43 20 C
Rajdarshan Industries 201406 3.11 0.43 0.29 0.02 0.16 0.01 0.06 0.06 0.06 0.06 0.20 0 S
Rajdarshan Industries 201409 3.11 0.36 0.27 0.18 0.27 0.02 0.06 0.19 0.19 0.19 0.61 0 S
Rajdarshan Industries 201412 3.11 0.52 0.40 0.07 0.19 0.01 0.09 0.15 0.15 0.15 0.48 0 S
Rajdarshan Industries 201503 3.11 0.51 0.30 0.09 0.29 0.01 0.09 0.20 0.17 0.03 0.03 0.10 0 S
Rajkamal Synthetics 201406 6.50 0.03 -0.03 -0.03 -0.03 -0.03 -0.04 0 S
Rajkamal Synthetics 201409 6.50 0.03 -0.03 -0.03 -0.03 -0.03 -0.04 0 S
Rajkamal Synthetics 201412 6.50 0.01 0.01 0.00 0.00 0.00 0.00 0 S
Rajkamal Synthetics 201503 6.50 0.00 0.02 -0.02 -0.02 -0.02 -0.02 -0.02 0 S
Rama Vision 201406 10.03 9.78 9.33 0.01 0.46 0.07 0.11 0.28 0.09 0.19 0.19 0.19 0 S
Rama Vision 201409 10.03 10.13 0.08 9.66 0.01 0.56 0.13 0.12 0.31 0.10 0.22 0.22 0.22 0 S
Rama Vision 201412 10.03 9.96 9.59 0.00 0.37 0.11 0.12 0.15 0.05 0.10 0.10 0.10 0 S
Rama Vision 201503 10.03 11.84 0.01 11.78 0.00 0.08 0.08 0.11 -0.12 -0.02 -0.10 -0.10 -0.10 0 S
Rane Holdings 201406 14.28 506.63 8.15 460.86 4.71 58.62 10.71 22.16 25.75 7.41 18.34 15.02 10.52 75 C
Rane Holdings 201409 14.28 514.13 10.12 470.99 6.08 59.34 10.36 22.65 26.33 7.80 18.53 16.29 11.41 75 C
Rane Holdings 201412 14.28 491.14 6.00 452.10 5.73 50.77 11.04 24.04 15.68 2.64 13.05 11.43 8.01 75 C
Rane Holdings 201503 14.28 667.30 7.42 607.13 5.90 73.49 14.01 36.83 65.57 19.27 46.30 28.20 19.75 75 C
Rasi Electrodes 201406 4.97 5.07 0.02 4.64 0.08 0.53 0.10 0.08 0.35 0.10 0.25 0.25 0.51 0 S
Rasi Electrodes 201409 6.16 5.70 0.00 5.21 0.05 0.54 0.15 0.08 0.32 0.10 0.22 0.22 0.35 0 S
Rasi Electrodes 201412 6.16 5.99 0.01 5.44 0.14 0.69 0.07 0.08 0.55 0.10 0.45 0.45 0.73 0 S
Rasi Electrodes 201503 6.16 6.53 0.13 6.10 0.13 0.69 0.05 0.38 0.26 0.24 0.02 0.02 0.03 0 S
Ravi Kumar Distilleries 201406 24.00 8.31 0.23 8.63 -0.09 0.92 0.10 -1.11 -0.01 -1.10 -1.10 -0.46 0 S
Ravi Kumar Distilleries 201409 24.00 11.90 -0.23 12.09 0.00 -0.42 0.95 0.11 -1.48 -0.01 -1.47 -1.47 -0.61 0 S
Ravi Kumar Distilleries 201412 24.00 11.82 0.17 11.85 0.14 1.84 0.10 -1.80 0.00 -1.80 -1.80 -0.75 0 S
Ravi Kumar Distilleries 201503 24.00 13.34 0.22 14.36 0.06 -0.74 0.44 0.28 -2.54 -0.10 -2.44 -2.44 -1.02 0 S
Raymed Labs 201406 4.27 0.01 0.01 0.00 0.00 0.00 0.00 0 S
Raymed Labs 201409 4.27 0.02 0.01 -0.02 -0.02 -0.02 -0.02 -0.04 0 S
Raymed Labs 201412 4.27 0.00 0.01 0.00 0.00 0.00 0.00 0.01 0 S
Raymed Labs 201503 4.27 0.01 0.01 0.00 0.00 0.00 0.00 0 S

Co_Name Year Equity N.Sale O.O.I T. Exp O.I PBIDT Int. Dep. PBT T.Tax PAT A.PAT EPS Div (%)
Exp
ecte
d R
esu
lts
on
12
Au
gu
st 2
015
Regency Ceramics 201406 26.44 0.39 0.02 -0.36 0.40 2.32 -3.08 -3.08 -3.08 -1.16 0 S
Regency Ceramics 201409 26.44 0.38 0.01 -0.37 0.43 3.00 -3.81 -3.81 -3.81 -1.44 0 S
Regency Ceramics 201412 26.44 0.28 0.01 -0.27 0.45 3.00 -3.72 -3.72 -3.72 -1.41 0 S
Regency Ceramics 201503 26.44 0.41 0.61 0.19 3.00 -2.81 -2.81 -2.81 -1.06 0 S
REIL Eletricals India 201406 3.78 3.50 3.59 -0.09 0.09 0.13 -0.30 -0.30 -0.30 -0.81 0 S
REIL Eletricals India 201409 3.78 3.09 3.25 -0.16 0.12 0.13 -0.40 -0.40 -0.40 -1.07 0 S
REIL Eletricals India 201412 3.78 3.29 3.22 0.06 0.10 0.13 -0.17 -0.17 -0.17 -0.44 0 S
REIL Eletricals India 201503 3.78 4.46 3.82 0.00 0.64 0.13 -0.09 0.60 0.01 0.59 0.59 1.56 0 S
Reliable Ventures India 201406 11.01 3.40 2.82 0.08 0.66 0.00 0.32 0.34 0.10 0.24 0.24 0.21 0 S
Reliable Ventures India 201409 11.01 2.98 2.86 0.14 0.26 0.00 0.31 -0.05 0.15 -0.20 -0.20 -0.18 0 S
Reliable Ventures India 201412 11.01 3.46 2.87 0.09 0.69 0.00 0.31 0.38 0.11 0.27 0.27 0.25 0 S
Reliable Ventures India 201503 11.01 3.64 2.87 0.11 0.88 0.56 0.32 0.13 0.19 0.19 0.17 0 S
Reliance Infrastructure 201406 262.58 4135.10 15.79 3465.48 397.60 1083.01 480.75 142.03 460.23 106.14 354.09 457.62 17.40 75 C
Reliance Infrastructure 201409 262.58 4035.56 22.39 3333.13 429.13 1153.95 564.64 227.36 361.95 52.81 309.14 431.19 16.40 75 C
Reliance Infrastructure 201412 262.58 4338.51 32.90 3592.91 416.99 1195.49 618.47 219.01 358.01 27.99 330.02 452.37 17.20 75 C
Reliance Infrastructure 201503 263.03 4424.01 194.20 3896.21 409.42 1131.42 683.46 244.42 203.54 -116.97 320.51 459.11 17.46 75 C
Repro India 201406 10.90 92.32 2.63 87.36 7.07 14.65 2.05 4.64 7.97 2.15 5.82 5.82 5.34 100 S
Repro India 201409 10.90 92.27 1.51 82.77 1.52 12.53 1.22 4.45 6.86 1.20 5.66 5.66 5.19 100 S
Repro India 201412 10.90 94.69 1.99 86.44 3.88 14.13 2.23 4.54 7.36 1.13 6.23 6.23 5.72 100 S
Repro India 201503 10.90 107.09 2.57 97.61 1.27 13.33 4.23 5.03 4.07 2.03 2.04 2.04 1.87 100 S
Rico Auto Industries 201406 13.53 383.04 10.86 367.42 11.07 37.55 12.86 22.01 1.22 2.50 -1.28 -1.28 -0.09 10 C
Rico Auto Industries 201409 13.53 378.35 9.71 352.67 8.00 43.39 17.22 21.89 3.10 1.41 1.69 1.69 0.12 10 C
Rico Auto Industries 201412 13.53 348.44 8.23 334.70 10.33 32.30 17.94 22.97 198.48 38.28 160.20 160.20 11.84 10 C
Rico Auto Industries 201503 13.53 226.59 18.05 235.39 6.44 15.69 4.25 17.73 -16.25 -9.26 -6.99 -7.18 -0.53 10 C
Rishi Laser 201406 9.19 29.11 28.37 -0.07 0.68 2.27 2.58 -4.18 -0.26 -3.91 -3.81 -4.15 0 C
Rishi Laser 201409 9.19 24.33 24.00 0.27 0.60 2.37 2.58 -4.35 -0.27 -4.08 -3.84 -4.18 0 C
Rishi Laser 201412 9.19 24.38 23.79 0.32 0.92 2.34 2.59 -4.01 -0.28 -3.73 -3.50 -3.81 0 C
Rishi Laser 201503 9.19 23.01 22.68 0.12 0.44 2.50 2.49 -4.55 -0.35 -4.20 -4.08 -4.44 0 C
Rishi Techtex 201406 5.52 11.82 0.01 10.72 0.03 1.13 0.45 0.44 0.25 0.25 0.25 0.44 0 S
Rishi Techtex 201409 5.52 11.77 0.03 10.75 1.05 0.42 0.45 0.19 0.19 0.19 0.34 0 S
Rishi Techtex 201412 5.52 11.68 0.05 10.57 1.15 0.41 0.44 0.30 0.30 0.30 0.54 0 S
Rishi Techtex 201503 5.52 13.19 0.03 12.24 0.98 0.28 0.27 0.59 0.59 0.59 1.07 0 S
Roto Pumps 201406 3.09 18.84 0.10 15.63 0.27 3.58 0.44 0.63 2.51 0.85 1.67 1.67 5.40 30 S
Roto Pumps 201409 3.09 26.17 0.10 20.77 -0.24 5.26 0.43 1.16 3.67 1.22 2.45 2.45 7.92 30 S
Roto Pumps 201412 3.09 23.92 0.18 19.79 0.02 4.32 0.69 1.02 2.62 0.89 1.73 1.73 1.12 30 S
Roto Pumps 201503 3.09 24.88 0.10 19.46 0.03 5.55 0.68 2.04 2.83 1.25 1.57 1.57 1.02 30 S
Royal Cushion Vinyl Products 201406 12.07 17.08 0.21 19.82 -2.53 2.83 1.93 -7.29 -7.30 -7.29 -6.05 0 S
Royal Cushion Vinyl Products 201409 12.07 21.05 0.00 23.77 -2.71 2.83 2.00 -7.55 -7.55 -7.55 -6.26 0 S
Royal Cushion Vinyl Products 201412 12.07 20.33 0.04 22.06 -1.69 2.88 1.89 -6.46 -6.46 -6.46 -5.35 0 S
Royal Cushion Vinyl Products 201503 12.07 16.23 0.70 19.61 6.01 3.34 -3.76 7.10 6.06 7.10 5.02 0 S
Ruchira Papers 201406 22.42 82.95 72.98 0.18 10.15 3.03 2.36 4.76 1.50 3.26 3.26 1.45 12 S
Ruchira Papers 201409 22.42 92.39 82.57 0.31 10.13 2.69 2.41 5.07 1.62 3.45 3.45 1.54 12 S
Ruchira Papers 201412 22.42 82.27 73.12 0.07 9.23 2.46 2.44 4.33 1.87 2.46 2.46 1.10 12 S
Ruchira Papers 201503 22.42 88.94 78.72 0.80 11.02 2.27 2.37 6.28 2.62 3.66 3.66 1.63 12 S
S Kumars Online 201406 28.63 0.15 0.13 0.00 0.02 0.00 0.03 -0.01 0.02 -0.03 -0.03 -0.01 0 S
S Kumars Online 201409 28.63 0.13 0.00 -0.13 0.00 0.03 -0.16 0.00 -0.16 -0.16 -0.06 0 S
S Kumars Online 201412 28.63 0.12 0.00 -0.12 0.00 0.03 -0.15 0.00 -0.15 -0.15 -0.05 0 S
S Kumars Online 201503 28.63 0.32 0.12 -0.20 0.00 0.05 -0.26 -0.03 -0.23 -0.23 -0.08 0 S

Co_Name Year Equity N.Sale O.O.I T. Exp O.I PBIDT Int. Dep. PBT T.Tax PAT A.PAT EPS Div (%)
Exp
ecte
d R
esu
lts
on
12
Au
gu
st 2
015
Saamya Biotech (India) 201406 24.88 0.03 -0.03 0.01 0.06 -0.10 -0.10 -0.10 -0.04 0 S
Saamya Biotech (India) 201409 24.88 0.03 -0.03 0.00 0.06 -0.09 -0.09 -0.09 -0.04 0 S
Saamya Biotech (India) 201412 24.88 3.67 3.65 0.02 0.17 -0.15 -0.15 -0.15 -0.06 0 S
Saamya Biotech (India) 201503 24.88 25.10 24.82 0.03 0.31 -0.01 0.71 -0.40 -0.05 -0.34 -0.34 -0.14 0 S
Sadguru Fincon 201406 1.10 0.00 0.00 0.00 0.00 0.00 -0.04 0 S
Sadguru Fincon 201409 1.10 0.01 0.03 -0.02 -0.02 -0.02 -0.02 -0.19 0 S
Sadguru Fincon 201412 1.10 0.00 0.00 0.00 0.00 0.00 -0.03 0 S
Sadguru Fincon 201503 1.10 0.17 0.02 0.15 0.15 0.04 0.11 0.11 1.01 0 S
Salona Cotspin 201406 5.26 22.57 0.30 19.70 0.10 3.27 0.94 1.41 0.93 0.19 0.74 0.74 1.41 12 S
Salona Cotspin 201409 5.26 24.27 0.28 20.54 0.06 4.06 0.72 1.41 1.93 0.39 1.55 1.55 2.94 12 S
Salona Cotspin 201412 5.26 30.41 0.39 30.07 0.04 0.76 0.68 1.41 -1.33 -0.27 -1.07 -1.07 -2.03 12 S
Salona Cotspin 201503 5.26 24.55 0.27 23.09 0.17 1.91 0.69 0.21 1.01 0.13 0.89 0.89 1.68 12 S
Sambandam Spinning Mills 201406 4.28 69.53 0.09 58.43 0.17 11.36 3.33 2.64 5.39 1.63 3.76 3.76 8.82 20 S
Sambandam Spinning Mills 201409 4.28 57.81 0.13 49.37 0.20 8.77 3.11 2.59 3.08 1.26 1.82 1.82 4.28 20 S
Sambandam Spinning Mills 201412 4.28 57.76 0.10 56.76 0.19 1.29 2.66 2.61 -3.99 -1.40 -2.59 -2.59 -6.06 20 S
Sambandam Spinning Mills 201503 4.28 56.86 0.05 50.97 0.31 6.26 2.64 3.02 0.60 0.14 0.46 0.46 1.08 20 S
Sanathnagar Enterprises 201406 3.15 18.12 0.01 9.22 8.91 2.34 0.12 6.44 2.09 4.35 4.35 13.82 0 S
Sanathnagar Enterprises 201409 3.15 1.47 0.12 4.05 -2.46 1.21 0.12 -3.79 -1.31 -2.48 -2.48 -7.87 0 S
Sanathnagar Enterprises 201412 3.15 0.45 0.05 0.30 0.20 1.39 0.12 -1.31 -0.33 -0.98 -0.98 -3.11 0 S
Sanathnagar Enterprises 201503 3.15 4.61 4.07 0.02 0.55 0.59 0.87 -0.92 -0.30 -0.62 -0.62 -1.96 0 S
Sanghvi Forging & Engineering 201406 13.29 14.22 0.22 13.09 0.08 1.44 3.68 1.95 -4.20 -4.20 -4.20 -3.16 0 S
Sanghvi Forging & Engineering 201409 13.29 20.73 0.37 17.39 0.18 3.89 3.58 1.98 -1.67 -1.67 -1.67 -1.25 0 S
Sanghvi Forging & Engineering 201412 13.89 25.51 0.24 20.03 0.12 5.84 4.29 1.98 -0.43 -0.43 -0.43 -0.31 0 C
Sanghvi Forging & Engineering 201503 13.89 25.75 0.25 20.97 -0.13 4.90 4.30 2.44 -1.85 0.00 -1.85 -1.85 -1.24 0 C
Sanghvi Movers 201406 8.66 57.16 0.47 28.96 2.97 31.64 10.80 29.98 -9.14 -2.97 -6.18 -6.18 -1.43 0 S
Sanghvi Movers 201409 8.66 54.76 0.82 30.44 3.02 28.16 10.70 30.06 -12.60 -4.09 -8.51 -8.51 -1.97 0 S
Sanghvi Movers 201412 8.66 86.10 0.61 36.10 0.99 51.60 10.59 30.37 10.64 3.45 7.19 7.19 1.66 0 S
Sanghvi Movers 201503 8.66 107.98 0.34 34.24 0.41 74.48 10.58 29.61 34.30 18.74 15.56 15.56 3.59 0 S
Sankhya Infotech 201406 11.25 39.71 36.05 0.21 3.87 1.09 1.24 1.55 0.32 1.22 1.22 1.09 0 S
Sankhya Infotech 201409 11.25 46.08 40.45 -0.18 5.45 1.20 1.24 3.01 1.81 1.20 1.20 1.06 0 S
Sankhya Infotech 201412 11.25 49.64 45.84 0.00 3.80 1.23 1.26 1.31 1.14 0.18 0.18 0.16 0 S
Sankhya Infotech 201503 11.25 46.55 44.52 2.03 1.25 1.37 -0.59 0.54 -1.13 -1.13 -1.00 0 S
Santosh Fine-Fab 201406 3.53 10.79 0.64 11.07 0.02 0.38 0.21 0.07 0.10 0.04 0.06 0.07 0.18 0 S
Santosh Fine-Fab 201409 3.53 9.81 0.27 9.64 0.06 0.50 0.21 0.07 0.22 0.08 0.14 0.14 0.40 0 S
Santosh Fine-Fab 201412 3.53 6.13 0.25 6.11 0.07 0.34 0.25 0.07 0.03 0.02 0.02 0.02 0.04 0 S
Santosh Fine-Fab 201503 3.53 8.26 0.31 8.62 0.05 -0.01 0.15 0.09 -0.22 -0.11 -0.10 -0.10 -0.29 0 S
Saraswati Commercial (India) 201406 0.64 1.24 0.11 0.32 1.45 1.25 0.20 0.20 0.20 3.06 0 S
Saraswati Commercial (India) 201409 0.64 5.19 0.20 0.37 5.35 1.47 3.88 3.88 3.88 60.61 0 S
Saraswati Commercial (India) 201412 0.64 1.41 0.07 2.05 3.40 1.00 2.40 2.40 2.40 37.50 0 S
Saraswati Commercial (India) 201503 0.64 1.38 0.33 1.82 2.86 1.05 1.81 1.52 0.28 0.28 4.44 0 S
Satra Properties (India) 201406 32.27 3.53 4.68 0.16 -0.99 6.11 0.09 -7.18 -7.18 -7.18 -0.44 5 S
Satra Properties (India) 201409 32.27 25.76 24.72 0.26 1.29 4.01 0.08 -2.80 -2.80 -2.80 -0.17 5 S
Satra Properties (India) 201412 32.27 7.52 0.04 7.16 -0.01 0.40 2.53 0.08 -2.22 -2.22 -2.22 -0.14 5 S
Satra Properties (India) 201503 35.67 21.12 16.99 13.33 17.46 2.49 0.09 14.89 1.37 13.51 13.51 0.82 5 S
Sayaji Hotels 201406 17.52 30.98 0.47 24.48 6.98 2.93 3.32 0.73 0.45 0.28 0.28 0.16 0 S
Sayaji Hotels 201409 17.52 25.39 0.06 23.35 0.00 2.10 3.06 3.42 -4.38 -0.24 -4.14 -4.14 -2.36 0 S
Sayaji Hotels 201412 17.52 39.04 0.07 29.77 9.34 3.15 3.66 2.53 -0.66 3.19 3.19 1.82 0 S
Sayaji Hotels 201503 17.52 40.04 0.67 31.11 9.60 2.54 10.02 -2.96 -0.98 -1.98 -1.98 -1.13 0 S
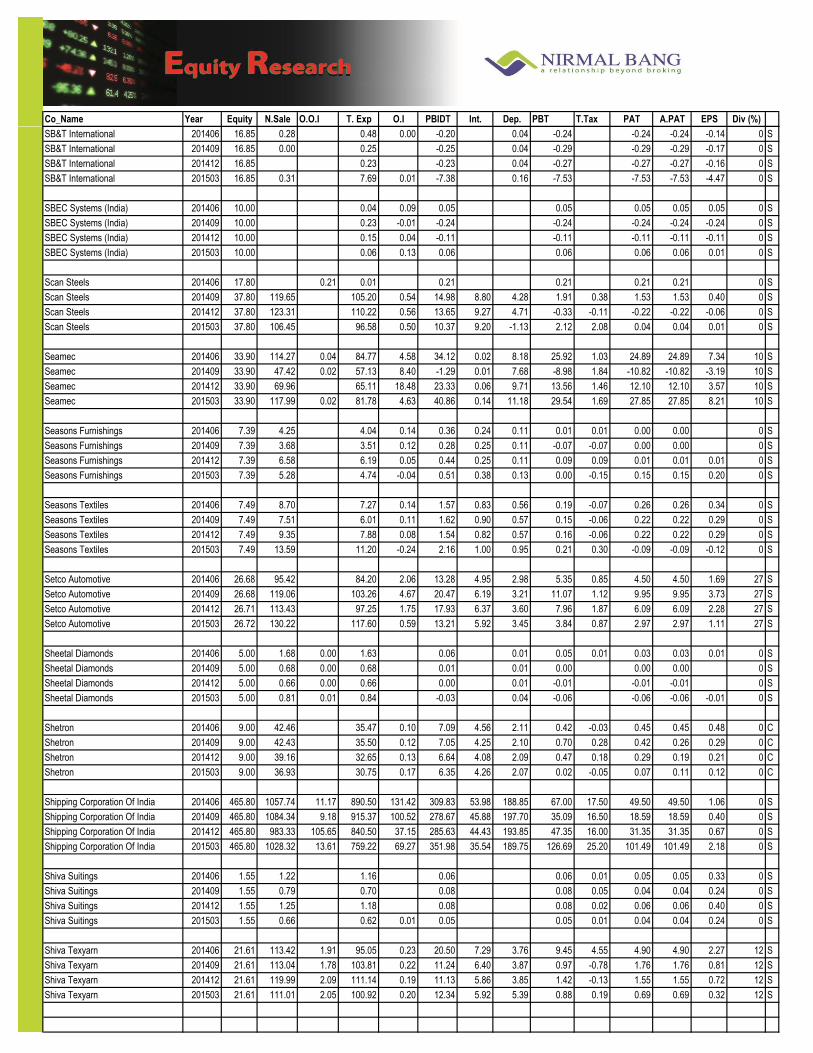
Co_Name Year Equity N.Sale O.O.I T. Exp O.I PBIDT Int. Dep. PBT T.Tax PAT A.PAT EPS Div (%)
Exp
ecte
d R
esu
lts
on
12
Au
gu
st 2
015
SB&T International 201406 16.85 0.28 0.48 0.00 -0.20 0.04 -0.24 -0.24 -0.24 -0.14 0 S
SB&T International 201409 16.85 0.00 0.25 -0.25 0.04 -0.29 -0.29 -0.29 -0.17 0 S
SB&T International 201412 16.85 0.23 -0.23 0.04 -0.27 -0.27 -0.27 -0.16 0 S
SB&T International 201503 16.85 0.31 7.69 0.01 -7.38 0.16 -7.53 -7.53 -7.53 -4.47 0 S
SBEC Systems (India) 201406 10.00 0.04 0.09 0.05 0.05 0.05 0.05 0.05 0 S
SBEC Systems (India) 201409 10.00 0.23 -0.01 -0.24 -0.24 -0.24 -0.24 -0.24 0 S
SBEC Systems (India) 201412 10.00 0.15 0.04 -0.11 -0.11 -0.11 -0.11 -0.11 0 S
SBEC Systems (India) 201503 10.00 0.06 0.13 0.06 0.06 0.06 0.06 0.01 0 S
Scan Steels 201406 17.80 0.21 0.01 0.21 0.21 0.21 0.21 0 S
Scan Steels 201409 37.80 119.65 105.20 0.54 14.98 8.80 4.28 1.91 0.38 1.53 1.53 0.40 0 S
Scan Steels 201412 37.80 123.31 110.22 0.56 13.65 9.27 4.71 -0.33 -0.11 -0.22 -0.22 -0.06 0 S
Scan Steels 201503 37.80 106.45 96.58 0.50 10.37 9.20 -1.13 2.12 2.08 0.04 0.04 0.01 0 S
Seamec 201406 33.90 114.27 0.04 84.77 4.58 34.12 0.02 8.18 25.92 1.03 24.89 24.89 7.34 10 S
Seamec 201409 33.90 47.42 0.02 57.13 8.40 -1.29 0.01 7.68 -8.98 1.84 -10.82 -10.82 -3.19 10 S
Seamec 201412 33.90 69.96 65.11 18.48 23.33 0.06 9.71 13.56 1.46 12.10 12.10 3.57 10 S
Seamec 201503 33.90 117.99 0.02 81.78 4.63 40.86 0.14 11.18 29.54 1.69 27.85 27.85 8.21 10 S
Seasons Furnishings 201406 7.39 4.25 4.04 0.14 0.36 0.24 0.11 0.01 0.01 0.00 0.00 0 S
Seasons Furnishings 201409 7.39 3.68 3.51 0.12 0.28 0.25 0.11 -0.07 -0.07 0.00 0.00 0 S
Seasons Furnishings 201412 7.39 6.58 6.19 0.05 0.44 0.25 0.11 0.09 0.09 0.01 0.01 0.01 0 S
Seasons Furnishings 201503 7.39 5.28 4.74 -0.04 0.51 0.38 0.13 0.00 -0.15 0.15 0.15 0.20 0 S
Seasons Textiles 201406 7.49 8.70 7.27 0.14 1.57 0.83 0.56 0.19 -0.07 0.26 0.26 0.34 0 S
Seasons Textiles 201409 7.49 7.51 6.01 0.11 1.62 0.90 0.57 0.15 -0.06 0.22 0.22 0.29 0 S
Seasons Textiles 201412 7.49 9.35 7.88 0.08 1.54 0.82 0.57 0.16 -0.06 0.22 0.22 0.29 0 S
Seasons Textiles 201503 7.49 13.59 11.20 -0.24 2.16 1.00 0.95 0.21 0.30 -0.09 -0.09 -0.12 0 S
Setco Automotive 201406 26.68 95.42 84.20 2.06 13.28 4.95 2.98 5.35 0.85 4.50 4.50 1.69 27 S
Setco Automotive 201409 26.68 119.06 103.26 4.67 20.47 6.19 3.21 11.07 1.12 9.95 9.95 3.73 27 S
Setco Automotive 201412 26.71 113.43 97.25 1.75 17.93 6.37 3.60 7.96 1.87 6.09 6.09 2.28 27 S
Setco Automotive 201503 26.72 130.22 117.60 0.59 13.21 5.92 3.45 3.84 0.87 2.97 2.97 1.11 27 S
Sheetal Diamonds 201406 5.00 1.68 0.00 1.63 0.06 0.01 0.05 0.01 0.03 0.03 0.01 0 S
Sheetal Diamonds 201409 5.00 0.68 0.00 0.68 0.01 0.01 0.00 0.00 0.00 0 S
Sheetal Diamonds 201412 5.00 0.66 0.00 0.66 0.00 0.01 -0.01 -0.01 -0.01 0 S
Sheetal Diamonds 201503 5.00 0.81 0.01 0.84 -0.03 0.04 -0.06 -0.06 -0.06 -0.01 0 S
Shetron 201406 9.00 42.46 35.47 0.10 7.09 4.56 2.11 0.42 -0.03 0.45 0.45 0.48 0 C
Shetron 201409 9.00 42.43 35.50 0.12 7.05 4.25 2.10 0.70 0.28 0.42 0.26 0.29 0 C
Shetron 201412 9.00 39.16 32.65 0.13 6.64 4.08 2.09 0.47 0.18 0.29 0.19 0.21 0 C
Shetron 201503 9.00 36.93 30.75 0.17 6.35 4.26 2.07 0.02 -0.05 0.07 0.11 0.12 0 C
Shipping Corporation Of India 201406 465.80 1057.74 11.17 890.50 131.42 309.83 53.98 188.85 67.00 17.50 49.50 49.50 1.06 0 S
Shipping Corporation Of India 201409 465.80 1084.34 9.18 915.37 100.52 278.67 45.88 197.70 35.09 16.50 18.59 18.59 0.40 0 S
Shipping Corporation Of India 201412 465.80 983.33 105.65 840.50 37.15 285.63 44.43 193.85 47.35 16.00 31.35 31.35 0.67 0 S
Shipping Corporation Of India 201503 465.80 1028.32 13.61 759.22 69.27 351.98 35.54 189.75 126.69 25.20 101.49 101.49 2.18 0 S
Shiva Suitings 201406 1.55 1.22 1.16 0.06 0.06 0.01 0.05 0.05 0.33 0 S
Shiva Suitings 201409 1.55 0.79 0.70 0.08 0.08 0.05 0.04 0.04 0.24 0 S
Shiva Suitings 201412 1.55 1.25 1.18 0.08 0.08 0.02 0.06 0.06 0.40 0 S
Shiva Suitings 201503 1.55 0.66 0.62 0.01 0.05 0.05 0.01 0.04 0.04 0.24 0 S
Shiva Texyarn 201406 21.61 113.42 1.91 95.05 0.23 20.50 7.29 3.76 9.45 4.55 4.90 4.90 2.27 12 S
Shiva Texyarn 201409 21.61 113.04 1.78 103.81 0.22 11.24 6.40 3.87 0.97 -0.78 1.76 1.76 0.81 12 S
Shiva Texyarn 201412 21.61 119.99 2.09 111.14 0.19 11.13 5.86 3.85 1.42 -0.13 1.55 1.55 0.72 12 S
Shiva Texyarn 201503 21.61 111.01 2.05 100.92 0.20 12.34 5.92 5.39 0.88 0.19 0.69 0.69 0.32 12 S

Co_Name Year Equity N.Sale O.O.I T. Exp O.I PBIDT Int. Dep. PBT T.Tax PAT A.PAT EPS Div (%)
Exp
ecte
d R
esu
lts
on
12
Au
gu
st 2
015
Shree Global Tradefin 201406 104.45 0.41 0.20 -0.21 -0.21 -0.21 -0.21 -0.01 0 S
Shree Global Tradefin 201409 113.95 0.38 0.32 -0.06 0.08 -0.14 -0.14 -0.14 -0.01 0 S
Shree Global Tradefin 201412 113.95 118.47 117.35 0.01 1.13 0.13 1.00 0.13 0.87 0.87 0.04 0 S
Shree Global Tradefin 201503 113.95 175.12 174.85 -0.31 -0.04 0.15 -0.19 -0.08 -0.12 -0.12 -0.01 0 S
Shree Hari Chemicals Export 201406 4.45 64.31 0.03 25.98 0.13 38.49 0.05 0.38 38.06 12.29 25.77 25.77 57.95 10 S
Shree Hari Chemicals Export 201409 4.45 16.31 -0.03 10.22 0.54 6.59 0.02 0.48 6.10 3.43 2.67 2.67 6.00 10 S
Shree Hari Chemicals Export 201412 4.45 23.87 0.09 25.02 1.06 0.00 0.05 0.53 -0.58 0.11 -0.69 -0.69 -1.55 10 S
Shree Hari Chemicals Export 201503 4.45 26.37 0.05 20.26 0.79 6.96 0.04 1.94 4.98 0.66 4.32 4.32 9.72 10 S
Shree Krishna Paper Mills & Industries 201406 13.52 38.33 0.23 35.69 0.09 2.96 1.35 0.84 0.77 0.77 0.77 0.52 0 S
Shree Krishna Paper Mills & Industries 201409 13.52 33.83 0.26 31.57 0.18 2.70 1.35 0.83 0.52 0.52 0.52 0.34 0 S
Shree Krishna Paper Mills & Industries 201412 13.52 34.64 0.26 32.70 0.05 2.26 1.45 0.84 -0.04 -0.04 -0.04 -0.07 0 S
Shree Krishna Paper Mills & Industries 201503 13.52 33.11 0.19 32.09 0.10 1.31 1.30 0.84 -0.83 -0.83 -0.83 -0.66 0 S
Shrenuj & Company 201406 19.29 1344.22 1275.25 3.35 72.32 44.75 4.70 22.87 2.41 20.47 20.51 2.13 10 C
Shrenuj & Company 201409 38.58 1276.47 1200.63 4.83 80.67 44.55 5.08 31.04 4.01 27.03 27.72 1.44 10 C
Shrenuj & Company 201412 38.58 1867.69 1803.97 6.55 70.28 42.85 4.86 22.58 2.36 20.22 20.60 1.07 10 C
Shrenuj & Company 201503 38.55 996.73 960.19 4.97 41.52 30.80 3.76 6.95 3.12 3.83 4.46 0.23 10 C
Shreyans Industries 201406 13.83 87.07 0.41 80.69 0.41 7.19 1.59 1.56 4.04 1.55 2.49 2.49 1.80 12 S
Shreyans Industries 201409 13.83 85.77 0.33 81.12 0.71 5.69 1.77 1.54 2.37 0.81 1.56 1.56 1.13 12 S
Shreyans Industries 201412 13.83 84.12 0.45 80.18 0.02 4.42 1.84 1.56 1.02 0.40 0.62 0.62 0.45 12 S
Shreyans Industries 201503 13.83 110.55 0.84 103.61 2.83 10.61 1.78 2.55 6.28 1.15 5.12 5.12 3.71 12 S
Shri Dinesh Mills 201406 5.08 16.95 0.33 16.33 0.50 1.45 0.70 2.75 -2.00 -0.53 -1.47 -1.47 -2.89 18 S
Shri Dinesh Mills 201409 5.08 21.28 0.18 17.31 0.59 4.74 0.68 1.02 3.04 -0.66 3.70 3.70 7.28 18 S
Shri Dinesh Mills 201412 5.08 18.70 0.11 16.05 0.49 3.25 0.66 2.04 0.55 0.49 0.06 0.06 0.12 18 S
Shri Dinesh Mills 201503 5.08 23.56 0.13 19.50 1.01 5.20 0.67 2.07 2.46 0.21 2.25 2.25 4.43 18 S
Shri Kalyan Holdings 201406 9.98 0.09 0.28 -0.19 0.01 0.06 -0.26 -0.26 -0.26 -0.26 0 S
Shri Kalyan Holdings 201409 9.98 0.03 0.25 -0.22 0.01 0.06 -0.29 -0.29 -0.29 -0.29 0 S
Shri Kalyan Holdings 201412 9.98 0.15 0.14 0.00 0.01 0.06 -0.07 -0.07 -0.07 -0.07 0 S
Shri Kalyan Holdings 201503 9.98 0.27 0.23 0.04 0.14 0.06 -0.15 -0.15 -0.15 -0.15 0 S
Shristi Infrastructure Development Corporation 201406 22.20 35.27 24.14 0.40 11.52 10.63 0.16 0.73 0.33 0.40 0.40 0.18 3 C
Shristi Infrastructure Development Corporation 201409 22.20 37.95 26.27 0.91 12.59 11.34 0.17 1.08 0.34 0.74 0.74 0.33 3 C
Shristi Infrastructure Development Corporation 201412 22.20 48.23 35.17 0.61 13.67 11.78 0.17 1.73 0.54 1.19 1.17 0.52 3 C
Shristi Infrastructure Development Corporation 201503 22.20 32.65 22.55 2.26 12.35 11.80 0.41 0.15 -0.10 0.24 0.27 0.12 3 C
Shyam Telecom 201406 11.27 85.21 0.15 85.85 0.07 -0.43 0.00 0.75 -1.18 -0.25 -0.93 -0.93 -0.82 0 S
Shyam Telecom 201409 11.27 76.89 0.10 77.53 0.22 -0.31 0.02 0.68 -1.01 -0.33 -0.68 -0.68 -0.60 0 S
Shyam Telecom 201412 11.27 86.04 0.11 88.00 0.33 -1.52 0.13 0.74 -2.96 -0.66 -2.29 -2.29 -2.03 0 S
Shyam Telecom 201503 11.27 86.59 0.11 96.99 0.71 -9.58 0.06 0.67 -31.87 0.25 -32.12 -32.12 -28.50 0 S
Simplex Infrastructures 201406 9.93 1340.41 6.99 1212.28 11.13 146.25 90.99 35.23 20.03 7.33 12.70 12.70 2.57 25 S
Simplex Infrastructures 201409 9.93 1248.29 10.81 1120.70 11.18 149.58 92.93 36.74 19.91 7.17 12.74 12.74 2.58 25 S
Simplex Infrastructures 201412 9.93 1419.10 14.63 1282.84 5.27 156.16 96.73 35.92 23.51 8.75 14.76 14.76 2.98 25 S
Simplex Infrastructures 201503 9.93 1532.99 6.36 1401.76 25.44 163.03 103.68 28.91 30.44 8.21 22.23 22.23 4.49 25 S
Simplex Projects 201406 12.60 163.16 0.85 153.07 2.52 13.46 12.70 5.34 -6.12 -6.12 -6.12 1.84 0 C
Simplex Projects 201409 12.60 166.42 0.15 157.88 1.14 9.83 14.43 4.73 -9.27 -9.27 -9.27 -7.35 0 C
Simplex Projects 201412 12.60 97.03 0.08 84.44 3.72 16.38 13.70 5.35 -4.32 -4.32 -4.32 -3.43 0 C
Simplex Projects 201503 12.60 102.95 1.09 105.15 -0.27 -1.39 19.55 4.81 -17.86 -1.26 -16.61 -16.61 0 C
SIP Industries 201406 4.68 0.07 -0.07 0.01 -0.07 -0.07 -0.07 -0.15 0 S
SIP Industries 201409 4.68 0.00 0.05 0.00 -0.05 0.00 0.07 -0.11 0.00 -0.11 -0.11 -0.24 0 S
SIP Industries 201412 4.68 0.04 -0.04 0.01 -0.04 -0.04 -0.04 -0.09 0 S
SIP Industries 201503 4.68 0.05 -0.05 0.00 -0.05 0.58 -0.05 1.25 0 S

Co_Name Year Equity N.Sale O.O.I T. Exp O.I PBIDT Int. Dep. PBT T.Tax PAT A.PAT EPS Div (%)
Exp
ecte
d R
esu
lts
on
12
Au
gu
st 2
015
SM Dyechem 201406 14.83 0.08 -0.08 0.02 -0.10 -0.10 -0.10 -0.06 0 S
SM Dyechem 201409 14.83 8.92 8.97 -0.05 0.02 -0.07 -0.07 -0.07 -0.05 0 S
SM Dyechem 201412 14.83 5.88 5.93 -0.06 0.02 -0.08 -0.08 -0.08 -0.05 0 S
SM Dyechem 201503 14.83 0.21 -0.21 0.02 -0.23 -0.23 -0.23 -0.15 0 S
SM Energy Teknik & Electronics 201406 12.32 0.05 0.02 0.03 0.03 0 S
SM Energy Teknik & Electronics 201409 12.32 0.05 0.05 -0.01 0.03 -0.04 -0.04 -0.04 -0.03 0 S
SM Energy Teknik & Electronics 201412 12.32 0.05 0.02 0.03 0.03 0.00 0.00 0.00 0 S
SM Energy Teknik & Electronics 201503 12.32 0.05 0.09 -0.04 0.11 -0.16 -0.04 -0.12 -0.12 -0.09 0 S
Smiths & Founders (India) 201406 4.32 1.37 1.53 0.02 -0.13 0.17 0.11 -0.41 -0.41 -0.41 -0.94 0 S
Smiths & Founders (India) 201409 5.32 1.60 1.70 0.01 -0.09 0.23 0.14 -0.45 -0.45 -0.45 -0.04 0 S
Smiths & Founders (India) 201412 10.20 1.85 2.04 0.01 -0.17 0.24 0.12 -0.53 -0.53 -0.53 -0.05 0 S
Smiths & Founders (India) 201503 10.20 1.72 1.90 0.05 -0.14 0.25 0.03 -0.42 -0.42 -0.42 -0.04 0 S
Sonal Adhesives 201406 6.06 10.24 0.19 9.63 0.80 0.53 0.13 0.14 0.14 0.14 0.23 0 S
Sonal Adhesives 201409 6.06 10.68 0.15 10.10 0.72 0.50 0.13 0.09 0.09 0.09 0.15 0 S
Sonal Adhesives 201412 6.06 9.89 0.26 8.83 1.32 0.94 0.13 0.25 0.25 0.25 0.42 0 S
Sonal Adhesives 201503 6.06 12.47 0.40 11.57 1.30 0.84 0.40 0.07 0.09 -0.03 -0.03 -0.04 0 S
Source Industries (India) 201406 11.40 0.01 0.02 0.00 0.00 0.00 0.00 0 S
Source Industries (India) 201409 11.40 0.02 0.08 -0.06 -0.06 -0.06 -0.06 -0.05 0 S
Source Industries (India) 201412 11.40 0.01 0.02 -0.01 -0.01 -0.01 -0.01 -0.01 0 S
Source Industries (India) 201503 11.40 0.03 0.02 0.01 0.01 0.01 0.01 0.01 0 S
Source Natural Foods and Herbal Supplements 201406 5.20 1.26 0.00 1.18 0.00 0.08 0.06 0.03 0.03 0.03 0.06 0 S
Source Natural Foods and Herbal Supplements 201409 6.10 1.99 0.00 1.63 0.36 0.00 0.07 0.29 0.29 0.29 0.48 0 S
Source Natural Foods and Herbal Supplements 201412 6.10 1.51 0.00 1.51 -0.01 0.00 0.07 -0.08 -0.08 -0.08 -0.12 0 S
Source Natural Foods and Herbal Supplements 201503 6.10 1.79 0.00 1.52 0.26 0.35 -0.09 -0.09 -0.09 -0.14 0 S
Speciality Restaurants 201406 46.96 68.29 2.03 64.25 1.82 7.89 0.02 5.55 2.32 0.41 1.91 1.91 0.41 10 S
Speciality Restaurants 201409 46.96 70.88 4.13 68.02 2.11 9.10 0.03 6.08 2.99 0.61 2.38 2.38 0.51 10 S
Speciality Restaurants 201412 46.96 79.11 1.33 71.95 1.96 10.45 0.01 6.48 3.96 0.74 3.22 3.22 0.68 10 S
Speciality Restaurants 201503 46.96 72.11 1.50 66.04 1.81 9.38 0.02 7.11 2.25 0.31 1.94 1.94 0.41 10 S
Spectra Industries 201406 7.08 18.89 0.12 18.59 0.04 0.47 0.27 0.15 0.05 0.05 0.05 0.06 0 S
Spectra Industries 201409 7.08 22.29 0.22 22.37 0.26 0.40 0.18 0.15 0.07 0.07 0.07 0.10 0 S
Spectra Industries 201412 7.08 28.66 0.24 28.99 0.55 0.46 0.16 0.15 0.15 0.15 0.15 0.21 0 S
Spectra Industries 201503 7.08 38.54 0.21 38.29 0.07 0.52 0.27 0.44 -0.19 -0.14 -0.05 -0.05 -0.07 0 S
Sri Adhikari Brothers Television Network 201406 24.95 19.81 14.64 0.02 5.19 0.38 2.19 2.63 2.63 2.63 0.82 6 S
Sri Adhikari Brothers Television Network 201409 34.95 22.01 16.02 0.01 6.01 1.06 2.22 2.73 2.73 2.73 0.78 6 S
Sri Adhikari Brothers Television Network 201412 34.95 23.10 16.45 0.02 6.67 2.42 3.70 0.54 0.54 0.54 0.16 6 S
Sri Adhikari Brothers Television Network 201503 34.95 26.28 19.53 0.03 6.79 2.69 3.74 0.36 1.31 -0.95 -0.95 -0.27 6 S
Sri Ramakrishna Mills (Coimbatore) 201406 7.12 3.18 0.73 3.86 0.05 0.10 0.78 0.18 -0.86 -0.86 -0.86 -1.21 0 S
Sri Ramakrishna Mills (Coimbatore) 201409 7.12 3.71 1.07 4.99 0.16 -0.05 0.70 0.13 -0.88 0.00 -0.88 -0.88 -1.23 0 S
Sri Ramakrishna Mills (Coimbatore) 201412 7.12 2.90 0.98 4.23 0.09 -0.26 0.66 0.15 -1.07 -1.07 -1.07 -1.51 0 S
Sri Ramakrishna Mills (Coimbatore) 201503 7.12 3.15 0.55 6.04 -0.19 -2.53 2.36 0.78 1.17 1.17 1.17 1.64 0 S
Sri Vajra Granites 201406 7.26 1.23 0.01 1.54 -0.31 0.08 0.08 -0.47 -0.47 -0.47 0 S
Sri Vajra Granites 201409 7.26 1.46 0.01 1.80 -0.34 0.06 0.08 -0.47 -0.47 -0.47 0 S
Sri Vajra Granites 201412 7.26 0.81 0.03 1.04 -0.20 0.09 0.08 -0.36 -0.36 -0.36 0 S
Sri Vajra Granites 201503 7.26 0.86 -0.03 1.65 0.09 -0.73 0.09 0.08 -0.90 -0.90 -0.90 0 S
Standard Medical & Pharmaceuticals 201406 10.81 0.02 -0.02 0.00 -0.02 -0.02 -0.02 -0.02 0 S
Standard Medical & Pharmaceuticals 201409 10.81 0.08 -0.08 0.00 -1.45 -1.45 -1.45 -1.34 0 S
Standard Medical & Pharmaceuticals 201412 10.81 0.03 -0.03 0.00 -0.03 -0.03 -0.03 -0.02 0 S
Standard Medical & Pharmaceuticals 201503 10.81 0.02 0.02 0.01 0.00 0.01 0.01 0.01 0 S

Co_Name Year Equity N.Sale O.O.I T. Exp O.I PBIDT Int. Dep. PBT T.Tax PAT A.PAT EPS Div (%)
Exp
ecte
d R
esu
lts
on
12
Au
gu
st 2
015
Steel Exchange India 201406 51.95 296.76 266.03 2.07 32.80 19.44 4.30 9.05 9.05 9.05 1.74 0 S
Steel Exchange India 201409 51.95 388.09 358.40 0.53 30.22 19.55 3.42 7.26 7.26 7.26 1.40 0 S
Steel Exchange India 201412 51.95 342.43 358.68 44.94 28.68 34.33 5.90 -11.55 -11.55 -11.55 -2.22 0 S
Steel Exchange India 201503 51.95 415.15 369.48 4.59 50.27 36.57 6.38 7.31 6.31 1.00 1.00 0.19 0 S
Sterling Powergensys 201406 5.10 0.19 0.40 -0.22 0.05 0.05 -0.31 -0.31 -0.31 -0.62 0 S
Sterling Powergensys 201409 5.10 0.62 0.64 -0.02 0.02 0.07 -0.11 -0.11 -0.11 -0.21 0 S
Sterling Powergensys 201412 5.10 0.02 0.26 -0.24 0.02 0.07 -0.33 -0.33 -0.33 -0.64 0 S
Sterling Powergensys 201503 5.10 0.19 0.71 1.08 0.56 0.04 0.02 0.51 0.51 0.51 1.00 0 S
Stone India 201406 8.18 22.71 0.04 21.32 0.06 1.49 1.30 0.63 -0.43 0.10 -0.53 -0.53 -0.65 0 S
Stone India 201409 8.18 23.80 0.01 22.26 0.04 1.59 1.27 0.62 -0.30 -0.05 -0.25 -0.25 -0.30 0 S
Stone India 201412 8.18 18.83 19.01 0.04 -0.14 1.39 0.67 -2.20 0.03 -2.23 -2.23 -2.73 0 S
Stone India 201503 8.83 19.66 0.03 19.26 0.12 0.55 1.42 0.69 -2.98 -0.70 -2.28 -2.28 -2.78 0 S
Subex 201406 169.10 65.18 68.62 0.31 -3.13 15.58 1.22 -19.93 0.67 -20.60 -20.60 -1.22 0 C
Subex 201409 169.10 90.50 67.00 3.44 26.94 15.37 1.01 10.56 0.94 9.62 9.62 0.57 0 C
Subex 201412 174.76 91.99 67.18 0.25 25.06 15.16 0.86 9.04 2.30 6.74 6.74 0.40 0 C
Subex 201503 182.92 112.16 80.61 0.60 32.15 14.94 0.93 16.28 1.87 14.41 14.41 0.84 0 C
Sujana Metal Products 201406 98.18 848.87 1.99 784.62 1.35 67.59 49.58 10.68 7.33 0.71 6.62 6.62 0.23 0 S
Sujana Metal Products 201409 98.18 815.02 1.84 760.12 4.53 61.27 46.39 9.33 3.51 0.27 3.24 3.24 0.16 0 S
Sujana Metal Products 201412 91.88 929.10 0.02 868.91 8.68 68.89 56.65 9.29 2.67 1.60 1.07 1.07 0.05 0 S
Sujana Metal Products 201503 100.73 854.54 0.22 787.72 -4.26 62.78 63.28 9.67 -8.12 1.87 -10.00 -10.00 -0.50 0 S
Sujana Towers 201406 51.92 503.45 1.12 446.56 0.27 58.29 50.31 6.80 1.18 0.30 0.88 1.06 0.20 0 C
Sujana Towers 201409 51.92 789.48 1.13 735.25 0.27 55.63 46.21 6.88 2.54 0.71 1.83 2.01 0.39 0 C
Sujana Towers 201412 51.92 547.02 0.09 491.16 0.12 56.07 48.20 6.73 1.14 1.11 0.03 0.22 0.04 0 C
Sujana Towers 201503 51.92 423.89 2.18 336.84 0.08 89.31 82.31 7.21 -0.21 -0.91 0.70 0.51 0.10 0 C
Sujana Universal Industries 201406 168.84 812.99 781.46 0.96 32.50 27.31 4.35 0.83 0.28 0.55 0.55 0.03 0 S
Sujana Universal Industries 201409 168.84 793.56 771.90 1.82 23.48 19.10 3.44 0.95 0.32 0.63 0.63 0.04 0 S
Sujana Universal Industries 201412 168.84 766.25 729.74 0.20 36.72 31.70 3.44 1.58 0.54 1.05 1.05 0.06 0 S
Sujana Universal Industries 201503 168.84 887.36 883.62 16.70 20.43 31.53 10.08 -21.17 -7.01 -14.16 -14.16 -0.84 0 S
Sundaram Multi Pap 201406 21.56 27.73 30.30 3.17 0.60 3.49 0.74 -3.63 -3.63 -3.63 -0.17 1 S
Sundaram Multi Pap 201409 21.56 16.23 16.43 0.17 -0.03 3.40 0.75 -4.78 -4.78 -4.78 -0.22 1 S
Sundaram Multi Pap 201412 21.56 16.21 0.07 16.04 7.85 8.09 2.63 0.85 -7.03 -7.03 -7.03 -0.33 1 S
Sundaram Multi Pap 201503 21.56 23.13 0.00 19.81 0.29 3.62 2.65 0.57 -2.06 -0.74 -1.31 -1.31 -0.06 1 S
Sunflag Iron & Steel Company 201406 162.20 416.61 376.30 1.18 41.49 18.89 12.77 9.83 5.34 4.49 4.49 0.28 0 S
Sunflag Iron & Steel Company 201409 180.22 475.91 432.33 1.18 44.76 18.10 13.21 -12.00 -0.68 -11.32 -11.32 -0.68 0 S
Sunflag Iron & Steel Company 201412 180.22 463.14 418.82 1.35 45.67 19.11 13.54 13.02 -0.47 13.49 13.49 0.75 0 S
Sunflag Iron & Steel Company 201503 180.22 400.93 359.86 2.29 43.36 15.34 11.61 40.98 23.23 17.75 17.75 0.98 0 S
Sunil Healthcare 201406 10.26 15.25 0.15 12.50 0.08 2.98 0.55 1.25 1.18 0.50 0.68 0.68 0.66 0 S
Sunil Healthcare 201409 10.26 19.53 0.17 16.57 0.14 3.28 0.60 1.27 1.41 0.35 1.06 1.06 1.04 0 S
Sunil Healthcare 201412 10.26 19.94 0.12 17.23 0.01 2.85 0.81 0.61 1.43 0.50 0.94 0.94 0.91 0 S
Sunil Healthcare 201503 10.26 17.38 0.09 14.69 0.59 3.37 0.36 0.87 2.14 0.83 1.30 1.30 1.27 0 S
Sunshield Chemicals 201406 7.35 30.71 0.06 29.14 0.04 1.67 0.89 0.66 0.12 0.09 0.03 0.03 0.04 0 S
Sunshield Chemicals 201409 7.35 33.01 0.04 31.62 -0.04 1.39 0.90 0.96 -0.47 -0.20 -0.27 -0.27 -0.37 0 S
Sunshield Chemicals 201412 7.35 27.36 0.20 28.75 -1.19 0.80 0.83 -2.82 -0.73 -2.09 -2.09 -2.84 0 S
Sunshield Chemicals 201503 7.35 27.48 0.15 27.32 0.68 0.99 0.91 0.82 -0.74 0.11 -0.85 -0.85 -1.16 0 S
Super Sales India 201406 3.07 52.14 1.85 45.57 0.84 9.26 2.15 7.49 -0.38 -0.16 -0.22 -0.22 -0.73 25 S
Super Sales India 201409 3.07 60.74 1.95 50.18 1.11 13.62 2.14 6.90 4.58 0.91 3.68 3.68 11.98 25 S
Super Sales India 201412 3.07 51.32 2.17 44.56 0.82 9.75 1.50 6.49 1.75 0.54 1.21 1.21 3.95 25 S
Super Sales India 201503 3.07 48.46 1.96 44.13 2.44 8.74 1.73 -9.08 15.15 4.01 11.14 11.14 36.28 25 S
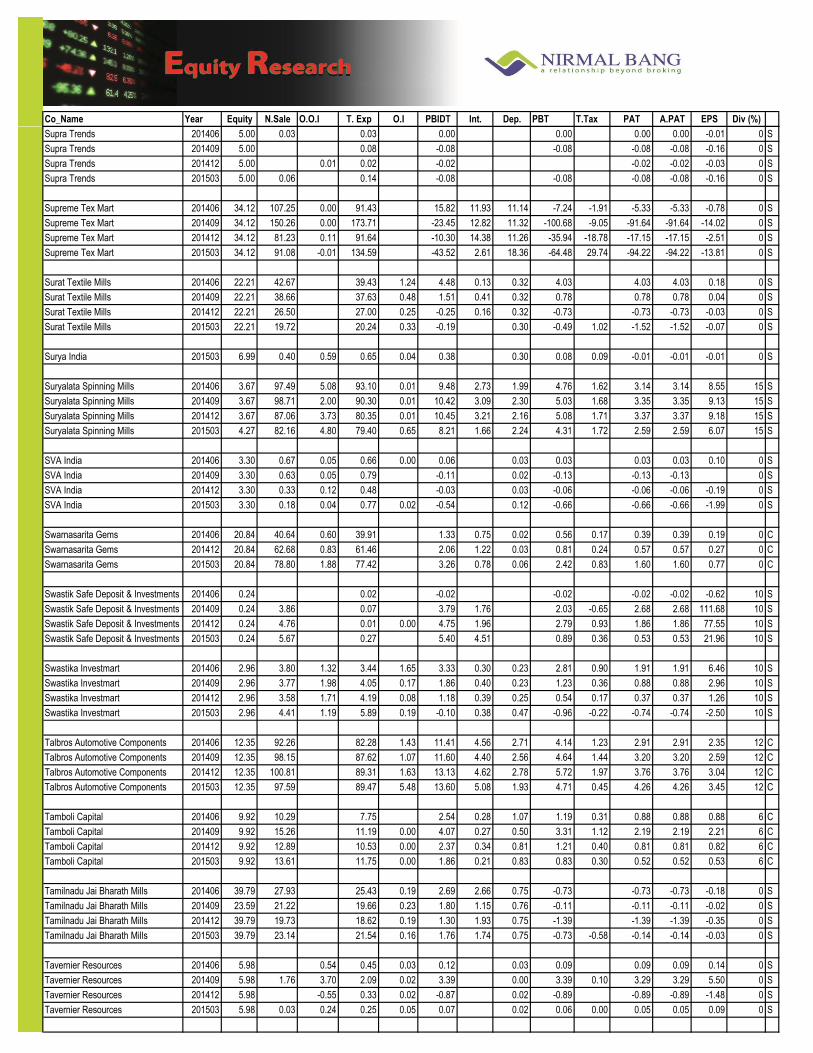
Co_Name Year Equity N.Sale O.O.I T. Exp O.I PBIDT Int. Dep. PBT T.Tax PAT A.PAT EPS Div (%)
Exp
ecte
d R
esu
lts
on
12
Au
gu
st 2
015
Supra Trends 201406 5.00 0.03 0.03 0.00 0.00 0.00 0.00 -0.01 0 S
Supra Trends 201409 5.00 0.08 -0.08 -0.08 -0.08 -0.08 -0.16 0 S
Supra Trends 201412 5.00 0.01 0.02 -0.02 -0.02 -0.02 -0.03 0 S
Supra Trends 201503 5.00 0.06 0.14 -0.08 -0.08 -0.08 -0.08 -0.16 0 S
Supreme Tex Mart 201406 34.12 107.25 0.00 91.43 15.82 11.93 11.14 -7.24 -1.91 -5.33 -5.33 -0.78 0 S
Supreme Tex Mart 201409 34.12 150.26 0.00 173.71 -23.45 12.82 11.32 -100.68 -9.05 -91.64 -91.64 -14.02 0 S
Supreme Tex Mart 201412 34.12 81.23 0.11 91.64 -10.30 14.38 11.26 -35.94 -18.78 -17.15 -17.15 -2.51 0 S
Supreme Tex Mart 201503 34.12 91.08 -0.01 134.59 -43.52 2.61 18.36 -64.48 29.74 -94.22 -94.22 -13.81 0 S
Surat Textile Mills 201406 22.21 42.67 39.43 1.24 4.48 0.13 0.32 4.03 4.03 4.03 0.18 0 S
Surat Textile Mills 201409 22.21 38.66 37.63 0.48 1.51 0.41 0.32 0.78 0.78 0.78 0.04 0 S
Surat Textile Mills 201412 22.21 26.50 27.00 0.25 -0.25 0.16 0.32 -0.73 -0.73 -0.73 -0.03 0 S
Surat Textile Mills 201503 22.21 19.72 20.24 0.33 -0.19 0.30 -0.49 1.02 -1.52 -1.52 -0.07 0 S
Surya India 201503 6.99 0.40 0.59 0.65 0.04 0.38 0.30 0.08 0.09 -0.01 -0.01 -0.01 0 S
Suryalata Spinning Mills 201406 3.67 97.49 5.08 93.10 0.01 9.48 2.73 1.99 4.76 1.62 3.14 3.14 8.55 15 S
Suryalata Spinning Mills 201409 3.67 98.71 2.00 90.30 0.01 10.42 3.09 2.30 5.03 1.68 3.35 3.35 9.13 15 S
Suryalata Spinning Mills 201412 3.67 87.06 3.73 80.35 0.01 10.45 3.21 2.16 5.08 1.71 3.37 3.37 9.18 15 S
Suryalata Spinning Mills 201503 4.27 82.16 4.80 79.40 0.65 8.21 1.66 2.24 4.31 1.72 2.59 2.59 6.07 15 S
SVA India 201406 3.30 0.67 0.05 0.66 0.00 0.06 0.03 0.03 0.03 0.03 0.10 0 S
SVA India 201409 3.30 0.63 0.05 0.79 -0.11 0.02 -0.13 -0.13 -0.13 0 S
SVA India 201412 3.30 0.33 0.12 0.48 -0.03 0.03 -0.06 -0.06 -0.06 -0.19 0 S
SVA India 201503 3.30 0.18 0.04 0.77 0.02 -0.54 0.12 -0.66 -0.66 -0.66 -1.99 0 S
Swarnasarita Gems 201406 20.84 40.64 0.60 39.91 1.33 0.75 0.02 0.56 0.17 0.39 0.39 0.19 0 C
Swarnasarita Gems 201412 20.84 62.68 0.83 61.46 2.06 1.22 0.03 0.81 0.24 0.57 0.57 0.27 0 C
Swarnasarita Gems 201503 20.84 78.80 1.88 77.42 3.26 0.78 0.06 2.42 0.83 1.60 1.60 0.77 0 C
Swastik Safe Deposit & Investments 201406 0.24 0.02 -0.02 -0.02 -0.02 -0.02 -0.62 10 S
Swastik Safe Deposit & Investments 201409 0.24 3.86 0.07 3.79 1.76 2.03 -0.65 2.68 2.68 111.68 10 S
Swastik Safe Deposit & Investments 201412 0.24 4.76 0.01 0.00 4.75 1.96 2.79 0.93 1.86 1.86 77.55 10 S
Swastik Safe Deposit & Investments 201503 0.24 5.67 0.27 5.40 4.51 0.89 0.36 0.53 0.53 21.96 10 S
Swastika Investmart 201406 2.96 3.80 1.32 3.44 1.65 3.33 0.30 0.23 2.81 0.90 1.91 1.91 6.46 10 S
Swastika Investmart 201409 2.96 3.77 1.98 4.05 0.17 1.86 0.40 0.23 1.23 0.36 0.88 0.88 2.96 10 S
Swastika Investmart 201412 2.96 3.58 1.71 4.19 0.08 1.18 0.39 0.25 0.54 0.17 0.37 0.37 1.26 10 S
Swastika Investmart 201503 2.96 4.41 1.19 5.89 0.19 -0.10 0.38 0.47 -0.96 -0.22 -0.74 -0.74 -2.50 10 S
Talbros Automotive Components 201406 12.35 92.26 82.28 1.43 11.41 4.56 2.71 4.14 1.23 2.91 2.91 2.35 12 C
Talbros Automotive Components 201409 12.35 98.15 87.62 1.07 11.60 4.40 2.56 4.64 1.44 3.20 3.20 2.59 12 C
Talbros Automotive Components 201412 12.35 100.81 89.31 1.63 13.13 4.62 2.78 5.72 1.97 3.76 3.76 3.04 12 C
Talbros Automotive Components 201503 12.35 97.59 89.47 5.48 13.60 5.08 1.93 4.71 0.45 4.26 4.26 3.45 12 C
Tamboli Capital 201406 9.92 10.29 7.75 2.54 0.28 1.07 1.19 0.31 0.88 0.88 0.88 6 C
Tamboli Capital 201409 9.92 15.26 11.19 0.00 4.07 0.27 0.50 3.31 1.12 2.19 2.19 2.21 6 C
Tamboli Capital 201412 9.92 12.89 10.53 0.00 2.37 0.34 0.81 1.21 0.40 0.81 0.81 0.82 6 C
Tamboli Capital 201503 9.92 13.61 11.75 0.00 1.86 0.21 0.83 0.83 0.30 0.52 0.52 0.53 6 C
Tamilnadu Jai Bharath Mills 201406 39.79 27.93 25.43 0.19 2.69 2.66 0.75 -0.73 -0.73 -0.73 -0.18 0 S
Tamilnadu Jai Bharath Mills 201409 23.59 21.22 19.66 0.23 1.80 1.15 0.76 -0.11 -0.11 -0.11 -0.02 0 S
Tamilnadu Jai Bharath Mills 201412 39.79 19.73 18.62 0.19 1.30 1.93 0.75 -1.39 -1.39 -1.39 -0.35 0 S
Tamilnadu Jai Bharath Mills 201503 39.79 23.14 21.54 0.16 1.76 1.74 0.75 -0.73 -0.58 -0.14 -0.14 -0.03 0 S
Tavernier Resources 201406 5.98 0.54 0.45 0.03 0.12 0.03 0.09 0.09 0.09 0.14 0 S
Tavernier Resources 201409 5.98 1.76 3.70 2.09 0.02 3.39 0.00 3.39 0.10 3.29 3.29 5.50 0 S
Tavernier Resources 201412 5.98 -0.55 0.33 0.02 -0.87 0.02 -0.89 -0.89 -0.89 -1.48 0 S
Tavernier Resources 201503 5.98 0.03 0.24 0.25 0.05 0.07 0.02 0.06 0.00 0.05 0.05 0.09 0 S

Co_Name Year Equity N.Sale O.O.I T. Exp O.I PBIDT Int. Dep. PBT T.Tax PAT A.PAT EPS Div (%)
Exp
ecte
d R
esu
lts
on
12
Au
gu
st 2
015
TCFC Finance 201406 10.48 6.91 0.01 4.75 2.18 0.01 2.16 0.39 1.77 1.77 1.69 15 S
TCFC Finance 201409 10.48 26.22 0.16 25.26 1.13 0.01 1.12 0.16 0.96 0.96 0.92 15 S
TCFC Finance 201412 10.48 28.20 0.01 26.55 1.66 0.01 1.64 0.29 1.35 1.35 1.29 15 S
TCFC Finance 201503 10.48 56.99 0.01 55.31 1.69 0.00 1.69 0.31 1.38 1.38 1.32 15 S
The Great Eastern Shipping Company 201406 150.78 803.82 4.38 437.48 97.85 468.57 75.36 146.98 250.61 27.68 222.93 222.93 14.79 110 C
The Great Eastern Shipping Company 201409 150.78 854.08 13.70 500.80 92.58 459.56 78.42 153.04 228.10 21.46 206.64 206.64 13.71 110 C
The Great Eastern Shipping Company 201412 150.78 873.85 3.96 537.41 66.44 406.84 71.25 158.12 177.47 -4.23 181.70 181.70 12.05 110 C
The Great Eastern Shipping Company 201503 150.78 876.22 8.02 565.75 55.28 373.77 75.55 156.27 141.95 4.98 136.97 136.97 9.08 110 C
The India Cements 201406 307.18 1226.24 2.17 1068.45 0.03 159.99 96.74 66.21 -2.96 -2.96 -2.96 -0.10 0 S
The India Cements 201409 307.18 1131.68 4.03 952.55 0.14 183.30 109.48 66.33 7.49 7.49 7.49 0.24 0 S
The India Cements 201412 307.18 1035.91 4.31 877.18 0.38 163.42 108.68 66.42 -11.68 -11.68 -11.68 -0.38 0 S
The India Cements 201503 307.18 1025.02 18.08 842.87 200.23 104.68 58.95 36.60 36.60 36.60 1.19 0 S
The Indian Hotels Company 201406 80.75 937.46 857.80 17.49 97.15 44.54 69.76 -23.24 1.09 -24.33 -34.82 -0.43 0 C
The Indian Hotels Company 201409 80.75 937.00 922.58 21.67 36.09 45.99 74.86 -91.64 -0.63 -91.01 -97.69 -1.21 0 C
The Indian Hotels Company 201412 80.75 1206.88 968.64 27.48 265.72 43.97 74.82 129.66 57.03 72.63 61.84 0.77 0 C
The Indian Hotels Company 201503 80.75 1107.30 0.00 951.04 32.07 188.33 41.07 71.85 -247.26 57.11 -304.37 -307.43 0 C
Thiru Arooran Sugars 201406 11.32 50.59 0.06 47.34 2.33 5.65 13.29 2.25 -9.89 -3.22 -6.68 -6.68 -5.90 0 S
Thiru Arooran Sugars 201409 11.32 102.17 1.26 100.23 0.24 3.45 13.18 2.47 -12.20 -3.97 -8.24 -8.24 -7.28 0 S
Thiru Arooran Sugars 201412 11.32 22.96 0.03 30.54 0.18 -7.38 10.56 2.36 -20.30 -6.60 -13.70 -13.70 -12.11 0 S
Thiru Arooran Sugars 201503 11.32 85.37 4.56 118.44 16.25 -12.26 15.62 0.77 -27.94 -9.32 -18.61 -18.61 -16.45 0 S
Tilak Finance 201406 12.85 1.01 0.25 0.55 0.70 0.00 0.70 0.70 0.70 0.05 0 S
Tilak Finance 201409 12.85 2.53 -0.73 1.52 0.28 0.00 0.28 0.28 0.28 0.02 0 S
Tilak Finance 201412 12.85 0.26 0.32 1.25 -0.67 0.00 -3.12 -3.12 -3.12 -0.24 0 S
Tilak Finance 201503 12.85 9.62 11.46 -1.84 0.00 -1.84 -1.84 -1.84 -0.14 0 S
Time Technoplast 201406 21.01 569.63 490.24 0.06 79.45 27.28 23.32 28.85 7.18 21.67 20.63 0.98 45 C
Time Technoplast 201409 21.01 605.05 518.79 0.10 86.37 28.50 23.77 34.10 7.58 26.52 25.51 1.21 45 C
Time Technoplast 201412 21.01 631.18 544.37 0.10 86.91 24.93 24.85 37.13 8.56 28.57 27.58 1.31 45 C
Time Technoplast 201503 21.01 670.26 584.16 3.32 89.42 23.59 15.52 50.30 13.90 36.40 35.89 1.71 45 C
Timken India 201406 67.99 226.21 1.96 186.14 1.39 43.42 0.15 4.26 39.01 13.06 25.95 25.95 3.82 30 S
Timken India 201409 67.99 231.65 2.34 200.74 2.09 35.34 0.12 4.15 31.07 10.32 20.75 20.75 3.05 30 S
Timken India 201412 67.99 226.22 1.91 201.52 2.78 29.39 0.15 4.10 25.14 8.38 16.76 16.76 2.47 30 S
Timken India 201503 67.99 231.89 6.31 207.10 0.39 31.49 0.15 4.25 27.09 9.88 17.21 17.21 2.53 30 S
Tinna Rubber & Infrastructure 201406 8.57 34.82 0.79 26.14 0.15 9.62 1.37 1.27 5.52 1.72 3.79 3.79 4.43 10 S
Tinna Rubber & Infrastructure 201409 8.57 16.28 0.46 13.45 1.31 4.60 1.26 1.18 2.16 0.50 1.66 1.66 1.94 10 S
Tinna Rubber & Infrastructure 201412 8.57 23.06 0.80 19.59 0.24 4.52 1.55 1.23 1.74 0.62 1.12 1.12 1.30 10 S
Tinna Rubber & Infrastructure 201503 8.57 17.48 0.64 15.08 0.41 3.44 1.65 1.49 0.31 -0.14 0.45 0.45 0.53 10 S
Tirupati Tyres 201412 3.44 0.12 0.10 0.01 0.00 0.01 0.01 0.01 0 S
Tirupati Tyres 201503 3.44 0.35 0.32 0.03 0.03 0.03 0.03 0.01 0 S
Titagarh Wagons 201406 20.06 70.16 0.49 67.58 4.15 7.23 1.59 2.31 3.33 1.18 2.15 2.15 1.07 40 S
Titagarh Wagons 201409 20.06 77.20 8.61 84.36 4.08 5.51 1.71 2.17 -15.46 -5.22 -10.25 -10.25 -5.11 40 S
Titagarh Wagons 201412 20.06 102.62 0.46 88.16 3.25 18.18 1.94 2.37 13.88 4.70 9.17 9.17 4.57 40 S
Titagarh Wagons 201503 20.06 118.04 0.42 106.53 4.69 16.62 1.08 2.25 13.29 4.51 8.78 8.78 4.38 40 S
Trinetra Cement 201406 4.49 146.48 118.90 0.81 28.39 9.18 8.84 10.38 10.38 10.38 22.60 0 S
Trinetra Cement 201409 4.49 105.53 95.28 0.07 10.32 8.98 8.85 -7.51 -7.51 -7.51 -17.38 0 S
Trinetra Cement 201412 4.49 114.16 112.27 0.34 2.23 10.66 8.85 -17.28 -17.28 -17.28 -39.21 0 S
Trinetra Cement 201503 4.49 126.44 120.03 1.12 7.53 8.36 8.93 -9.76 -9.76 -9.76 -22.40 0 S

Co_Name Year Equity N.Sale O.O.I T. Exp O.I PBIDT Int. Dep. PBT T.Tax PAT A.PAT EPS Div (%)
Exp
ecte
d R
esu
lts
on
12
Au
gu
st 2
015
Trinity Tradelink 201406 2.63 29.28 0.10 28.04 0.01 1.36 1.20 0.07 0.10 0.03 0.07 0.07 0.03 0 S
Trinity Tradelink 201409 26.26 17.55 0.07 16.83 0.78 0.63 0.07 0.09 0.03 0.06 0.06 0 S
Trinity Tradelink 201412 26.26 53.95 0.12 52.91 1.16 0.75 0.16 0.26 0.08 0.18 0.18 0.01 0 S
Trinity Tradelink 201503 26.26 49.54 0.02 48.89 0.67 0.85 0.14 -0.32 -0.32 -0.32 -0.01 0 S
TVS Srichakra 201406 7.66 447.05 3.95 410.97 0.09 40.12 9.98 6.50 23.64 6.38 17.26 17.26 22.54 160 S
TVS Srichakra 201409 7.66 487.23 3.41 439.97 0.63 51.30 8.46 7.17 35.67 9.63 26.04 26.04 34.01 160 S
TVS Srichakra 201412 7.66 486.30 3.07 438.66 0.26 50.97 7.32 7.41 36.24 9.78 26.46 26.46 34.56 160 S
TVS Srichakra 201503 7.66 2161.33 15.10 1959.33 4.08 221.18 31.09 41.83 137.00 39.19 97.81 99.63 130.11 160 C
United Textiles 201406 3.00 1.78 0.08 1.78 0.08 0.03 0.02 0.03 0.01 0.02 0.02 0.08 0 S
United Textiles 201409 3.00 3.79 0.11 3.77 0.13 0.03 0.06 0.04 0.01 0.03 0.03 0.10 0 S
United Textiles 201412 3.00 2.84 0.04 2.87 0.15 0.16 0.08 0.04 0.03 0.01 0.02 0.02 0.08 0 S
United Textiles 201503 3.00 2.61 0.04 2.24 -0.05 0.37 0.10 0.25 0.02 0.01 0.01 0.01 0.04 0 S
Unity Infraprojects 201406 14.82 260.33 2.15 242.19 2.82 23.11 65.45 6.66 -49.00 -49.00 -49.00 0 S
Unity Infraprojects 201409 14.82 218.91 232.07 34.57 21.40 61.46 7.13 -47.18 -1.44 -45.74 -45.74 -6.17 0 S
Unity Infraprojects 201412 14.82 210.64 3.01 210.14 12.03 15.54 87.76 7.68 -79.90 -1.38 -78.52 -78.52 -10.60 0 S
Unity Infraprojects 201503 14.82 73.45 2.57 164.07 -2.87 -90.93 62.37 4.95 -158.25 5.73 -163.98 -163.98 -22.13 0 S
Uniworth International 201406 14.90 0.02 -0.02 1.45 -1.48 -1.48 -1.48 -0.99 0 S
Uniworth International 201409 14.90 0.01 -0.01 1.45 -1.47 -1.47 -1.47 -0.98 0 S
Uniworth International 201412 14.90 0.03 -0.03 1.45 -1.48 -1.48 -1.48 -0.99 0 S
Uniworth International 201503 14.90 0.11 -0.11 1.45 -1.56 -1.56 -1.56 -1.05 0 S
Uniworth 201406 33.99 29.48 23.62 8.89 14.75 13.38 1.06 0.31 0.31 0.31 0.09 0 S
Uniworth 201409 33.99 34.88 44.58 2.66 -7.05 13.38 1.07 -21.50 -21.50 -21.50 -6.33 0 S
Uniworth 201412 33.99 36.24 32.44 1.98 5.78 15.49 1.07 -10.77 -10.77 -10.77 -3.17 0 S
Uniworth 201503 33.99 35.18 30.31 -10.14 -5.27 7.99 1.07 -14.49 -14.49 -14.49 -4.26 0 S
Uniworth Textiles 201406 22.83 6.44 0.31 7.62 0.00 -0.87 2.33 0.10 -3.30 -3.30 -3.30 -1.45 0 S
Uniworth Textiles 201409 22.83 7.69 1.27 9.76 0.02 -0.78 2.73 0.10 -3.61 -3.61 -3.61 -1.58 0 S
Uniworth Textiles 201412 22.83 8.55 0.57 10.48 0.02 -1.35 2.41 0.09 -3.84 -3.84 -3.84 -1.68 0 S
Uniworth Textiles 201503 22.83 6.03 -0.93 9.87 2.37 -2.41 2.21 0.17 -4.78 -4.78 -4.78 -2.10 0 S
Usher Agro 201406 38.06 389.91 338.77 -0.29 50.85 27.86 9.24 13.75 -10.54 24.29 24.29 6.38 0 S
Usher Agro 201409 38.06 398.94 343.46 0.22 55.69 24.56 9.06 22.07 4.41 17.65 17.65 4.64 0 S
Usher Agro 201412 38.06 452.98 392.28 0.43 61.14 26.54 9.15 25.45 4.38 21.07 21.07 5.54 0 S
Usher Agro 201503 38.06 424.83 374.08 0.27 51.02 31.21 13.15 6.66 3.53 3.13 3.13 0.82 0 S
Valiant Communications 201406 7.22 1.90 2.17 0.20 -0.07 0.31 -0.38 -0.16 -0.22 -0.22 -0.30 0 S
Valiant Communications 201409 7.22 2.72 2.92 0.32 0.11 0.32 -0.21 -0.10 -0.10 -0.10 -0.14 0 S
Valiant Communications 201412 7.22 4.15 3.70 0.28 0.73 0.33 0.40 0.12 0.27 0.27 0.38 0 S
Valiant Communications 201503 7.22 2.42 2.30 0.12 0.24 0.37 -0.13 -0.04 -0.09 -0.09 -0.13 0 S
Vallabh Poly-Plast International 201406 4.20 0.02 0.00 -0.02 -0.02 -0.02 -0.02 -0.04 0 S
Vallabh Poly-Plast International 201409 4.20 0.01 0.00 -0.01 -0.01 -0.01 -0.01 -0.02 0 S
Vallabh Poly-Plast International 201412 4.20 0.01 0.00 -0.01 -0.01 -0.01 -0.01 -0.02 0 S
Vallabh Poly-Plast International 201503 4.20 0.08 0.09 0.01 0.01 0.01 0.01 0.03 0 S
VBC Ferro Alloys 201406 4.40 0.23 0.06 -0.17 0.88 0.19 -4.32 -4.32 -4.32 -9.82 0 S
VBC Ferro Alloys 201409 4.40 1.01 1.89 0.88 1.40 1.00 -1.52 -1.52 -1.52 -3.45 0 S
VBC Ferro Alloys 201412 4.40 0.46 0.06 -0.40 2.08 0.19 -3.34 -3.34 -3.34 -7.61 0 S
VBC Ferro Alloys 201503 4.40 0.45 0.32 -0.13 0.57 0.19 0.54 -0.65 1.19 1.19 2.72 0 S
VCK Capital Market Services 201406 9.06 0.00 0.04 0.01 -0.02 0.00 -0.03 0.00 -0.03 -0.03 -0.03 0 S
VCK Capital Market Services 201409 9.06 0.00 0.05 0.01 -0.04 1.30 0.15 1.15 1.15 1.27 0 S
VCK Capital Market Services 201412 9.06 0.00 0.02 -0.02 -0.02 -0.02 -0.02 -0.02 0 S
VCK Capital Market Services 201503 9.06 0.01 -0.01 1.24 -1.24 0.00 -1.24 -0.24 -1.00 -1.00 -1.10 0 S

Co_Name Year Equity N.Sale O.O.I T. Exp O.I PBIDT Int. Dep. PBT T.Tax PAT A.PAT EPS Div (%)
Exp
ecte
d R
esu
lts
on
12
Au
gu
st 2
015
Vegepro Foods & Feeds 201406 21.28 0.02 0.00 -0.01 0.02 -0.04 -0.04 -0.04 -0.02 0 S
Vegepro Foods & Feeds 201409 21.28 0.03 -0.03 0.02 -0.05 -0.05 -0.05 -0.02 0 S
Vegepro Foods & Feeds 201412 21.28 0.11 0.03 -0.08 0.02 -0.10 -0.10 -0.10 -0.05 0 S
Vegepro Foods & Feeds 201503 21.28 0.06 0.00 -0.06 0.19 -0.25 -0.25 -0.25 -0.12 0 S
Venmax Drugs And Pharmaceuticals 201406 5.24 0.21 0.21 0.01 0.01 0.01 0.01 0 S
Venmax Drugs And Pharmaceuticals 201409 5.24 1.69 1.69 0.00 0.00 0.00 0.00 0 S
Venmax Drugs And Pharmaceuticals 201412 5.24 0.16 0.16 0.00 0.00 0.00 0 S
Venmax Drugs And Pharmaceuticals 201503 5.24 0.49 0.61 -0.12 0.00 -0.12 -0.04 -0.09 -0.09 0 S
Vidhi Dyestuffs Manufacturing 201406 5.00 40.26 0.50 35.70 0.25 5.31 1.32 0.35 3.65 1.21 2.44 2.44 0.49 20 S
Vidhi Dyestuffs Manufacturing 201409 5.00 46.30 2.74 43.41 0.35 5.98 1.54 0.36 4.08 1.30 2.78 2.78 0.56 20 S
Vidhi Dyestuffs Manufacturing 201412 5.00 47.53 1.24 41.23 0.06 7.60 1.45 0.48 5.25 1.70 3.55 3.55 0.71 20 S
Vidhi Dyestuffs Manufacturing 201503 5.00 48.91 1.29 41.74 0.14 8.61 1.80 0.44 6.36 2.64 3.72 3.72 0.74 20 S
Vijay Shanthi Builders 201406 26.19 13.30 0.01 12.14 0.12 1.29 0.02 0.18 1.09 0.36 0.73 0.73 0.28 0 S
Vijay Shanthi Builders 201409 26.19 13.26 0.03 12.52 0.22 0.99 0.08 0.18 0.73 0.25 0.48 0.48 0.18 0 S
Vijay Shanthi Builders 201412 26.19 9.93 0.03 9.43 0.37 0.89 0.03 0.18 0.68 0.24 0.44 0.44 0.17 0 S
Vijay Shanthi Builders 201503 26.19 11.32 0.00 10.61 0.71 0.37 -0.04 0.37 0.14 0.23 0.23 0.09 0 S
Vikas GlobalOne 201406 10.17 63.54 0.18 58.90 4.82 2.76 0.71 1.35 0.41 0.95 0.95 0.09 5 C
Vikas GlobalOne 201409 10.17 47.69 0.31 44.14 1.88 5.74 3.06 0.77 1.91 0.57 1.34 1.34 0.13 5 C
Vikas GlobalOne 201412 25.42 50.33 0.23 45.79 4.77 2.96 0.70 1.11 0.33 0.78 0.78 0.03 5 C
Vikas GlobalOne 201503 25.42 65.36 1.19 61.60 4.95 2.48 1.33 1.14 0.91 0.23 0.23 0.01 5 C
Vipul 201406 12.00 74.41 67.73 0.51 7.20 6.24 0.22 0.74 0.20 0.54 0.54 0.05 5 S
Vipul 201409 12.00 64.98 64.33 0.41 1.06 6.51 0.22 -5.67 -1.83 -3.84 -3.84 -0.32 5 S
Vipul 201412 12.00 54.93 52.18 0.31 3.06 6.52 0.21 -3.68 -1.19 -2.48 -2.48 -0.21 5 S
Vipul 201503 12.00 39.23 38.64 0.77 1.37 0.82 0.66 -0.11 0.68 -0.80 -0.80 5 S
Vivo Bio Tech 201406 9.35 3.67 3.51 0.23 0.39 0.10 0.42 -0.13 -0.13 -0.13 -0.14 0 S
Vivo Bio Tech 201409 9.35 3.49 3.05 0.20 0.64 0.11 0.40 0.13 0.03 0.11 0.11 0.11 0 S
Vivo Bio Tech 201412 9.35 4.64 4.15 0.20 0.70 0.11 0.48 0.11 0.03 0.08 0.08 0.08 0 S
Vivo Bio Tech 201503 9.35 5.98 4.28 0.32 2.02 0.19 1.75 0.08 -0.33 0.41 0.41 0.44 0 S
VJTF Eduservices 201406 17.60 3.41 0.04 2.72 0.74 0.54 0.41 -0.22 0.01 -0.22 -0.22 -0.13 0 S
VJTF Eduservices 201409 17.60 3.63 0.06 3.40 0.30 0.41 0.42 -0.53 -0.10 -0.44 -0.44 -0.25 0 S
VJTF Eduservices 201412 17.60 3.83 0.23 4.22 -0.16 0.46 0.42 -1.03 -0.26 -0.78 -0.78 -0.44 0 S
VJTF Eduservices 201503 17.60 4.93 0.05 3.93 1.05 0.40 0.43 0.22 -1.07 1.29 1.29 0.73 0 S
Voltas 201406 33.07 1752.31 5.03 1625.45 29.21 161.10 8.70 6.06 146.80 36.53 110.27 108.99 3.29 225 C
Voltas 201409 33.07 968.92 15.73 906.91 18.83 96.57 4.39 6.90 85.28 35.13 50.15 49.93 1.51 225 C
Voltas 201412 33.07 938.97 12.16 893.73 30.39 87.79 4.35 6.97 120.97 14.69 106.28 107.37 3.25 225 C
Voltas 201503 33.07 1484.09 5.88 1346.96 30.29 173.30 5.82 8.11 160.60 41.27 119.33 118.04 3.57 225 C
VST Industries 201406 15.44 212.76 1.35 144.69 3.03 72.45 7.46 64.99 21.78 43.21 43.21 27.99 700 S
VST Industries 201409 15.44 202.87 1.79 145.39 5.76 65.03 7.80 57.23 19.28 37.95 37.95 24.57 700 S
VST Industries 201412 15.44 196.39 1.75 149.30 4.24 53.08 7.58 45.50 15.14 30.36 30.36 19.67 700 S
VST Industries 201503 15.44 217.97 1.28 154.64 5.50 70.11 9.07 61.04 20.35 40.69 40.69 26.34 700 S
Vyapar Industries 201406 10.90 2.97 4.30 0.15 -1.18 0.01 -1.19 0.00 -1.19 -1.19 -1.09 0 S
Vyapar Industries 201409 10.90 2.09 3.25 0.53 -0.63 0.01 -0.64 0.00 -0.64 -0.64 -0.59 0 S
Vyapar Industries 201412 10.90 0.25 0.22 -0.03 0.01 -0.04 0.00 -0.04 -0.04 -0.04 0 S
Vyapar Industries 201503 10.90 0.40 0.72 0.76 0.43 0.05 0.38 -0.24 0.62 0.62 0.57 0 S
Waterbase 201406 38.60 85.75 0.10 74.89 0.12 11.08 0.63 0.35 10.10 2.61 7.49 7.49 1.94 0 S
Waterbase 201409 38.60 81.48 0.13 73.61 0.58 8.58 0.08 0.35 8.15 4.31 3.84 3.84 1.00 0 S
Waterbase 201412 38.60 61.66 0.04 54.23 0.24 7.72 0.25 0.38 7.09 2.87 4.22 4.22 1.09 0 S
Waterbase 201503 38.60 48.31 0.09 43.91 1.00 5.49 0.26 0.35 4.88 0.94 3.94 3.94 1.02 0 S
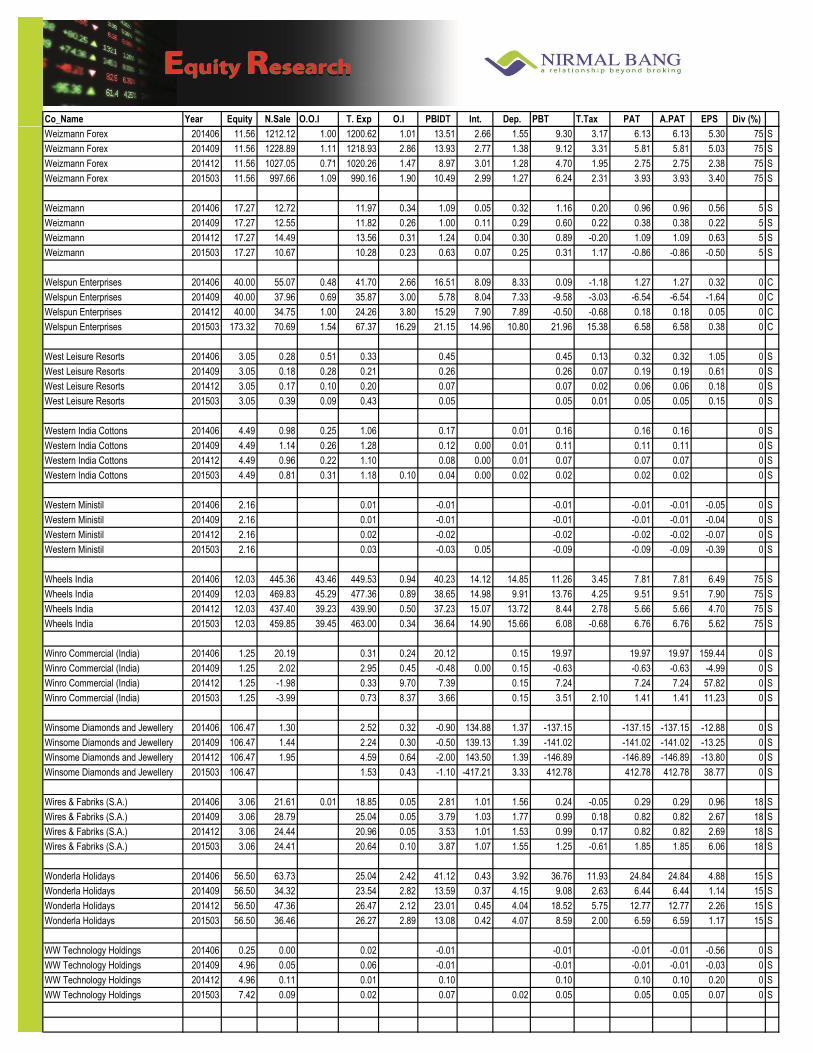
Co_Name Year Equity N.Sale O.O.I T. Exp O.I PBIDT Int. Dep. PBT T.Tax PAT A.PAT EPS Div (%)
Exp
ecte
d R
esu
lts
on
12
Au
gu
st 2
015
Weizmann Forex 201406 11.56 1212.12 1.00 1200.62 1.01 13.51 2.66 1.55 9.30 3.17 6.13 6.13 5.30 75 S
Weizmann Forex 201409 11.56 1228.89 1.11 1218.93 2.86 13.93 2.77 1.38 9.12 3.31 5.81 5.81 5.03 75 S
Weizmann Forex 201412 11.56 1027.05 0.71 1020.26 1.47 8.97 3.01 1.28 4.70 1.95 2.75 2.75 2.38 75 S
Weizmann Forex 201503 11.56 997.66 1.09 990.16 1.90 10.49 2.99 1.27 6.24 2.31 3.93 3.93 3.40 75 S
Weizmann 201406 17.27 12.72 11.97 0.34 1.09 0.05 0.32 1.16 0.20 0.96 0.96 0.56 5 S
Weizmann 201409 17.27 12.55 11.82 0.26 1.00 0.11 0.29 0.60 0.22 0.38 0.38 0.22 5 S
Weizmann 201412 17.27 14.49 13.56 0.31 1.24 0.04 0.30 0.89 -0.20 1.09 1.09 0.63 5 S
Weizmann 201503 17.27 10.67 10.28 0.23 0.63 0.07 0.25 0.31 1.17 -0.86 -0.86 -0.50 5 S
Welspun Enterprises 201406 40.00 55.07 0.48 41.70 2.66 16.51 8.09 8.33 0.09 -1.18 1.27 1.27 0.32 0 C
Welspun Enterprises 201409 40.00 37.96 0.69 35.87 3.00 5.78 8.04 7.33 -9.58 -3.03 -6.54 -6.54 -1.64 0 C
Welspun Enterprises 201412 40.00 34.75 1.00 24.26 3.80 15.29 7.90 7.89 -0.50 -0.68 0.18 0.18 0.05 0 C
Welspun Enterprises 201503 173.32 70.69 1.54 67.37 16.29 21.15 14.96 10.80 21.96 15.38 6.58 6.58 0.38 0 C
West Leisure Resorts 201406 3.05 0.28 0.51 0.33 0.45 0.45 0.13 0.32 0.32 1.05 0 S
West Leisure Resorts 201409 3.05 0.18 0.28 0.21 0.26 0.26 0.07 0.19 0.19 0.61 0 S
West Leisure Resorts 201412 3.05 0.17 0.10 0.20 0.07 0.07 0.02 0.06 0.06 0.18 0 S
West Leisure Resorts 201503 3.05 0.39 0.09 0.43 0.05 0.05 0.01 0.05 0.05 0.15 0 S
Western India Cottons 201406 4.49 0.98 0.25 1.06 0.17 0.01 0.16 0.16 0.16 0 S
Western India Cottons 201409 4.49 1.14 0.26 1.28 0.12 0.00 0.01 0.11 0.11 0.11 0 S
Western India Cottons 201412 4.49 0.96 0.22 1.10 0.08 0.00 0.01 0.07 0.07 0.07 0 S
Western India Cottons 201503 4.49 0.81 0.31 1.18 0.10 0.04 0.00 0.02 0.02 0.02 0.02 0 S
Western Ministil 201406 2.16 0.01 -0.01 -0.01 -0.01 -0.01 -0.05 0 S
Western Ministil 201409 2.16 0.01 -0.01 -0.01 -0.01 -0.01 -0.04 0 S
Western Ministil 201412 2.16 0.02 -0.02 -0.02 -0.02 -0.02 -0.07 0 S
Western Ministil 201503 2.16 0.03 -0.03 0.05 -0.09 -0.09 -0.09 -0.39 0 S
Wheels India 201406 12.03 445.36 43.46 449.53 0.94 40.23 14.12 14.85 11.26 3.45 7.81 7.81 6.49 75 S
Wheels India 201409 12.03 469.83 45.29 477.36 0.89 38.65 14.98 9.91 13.76 4.25 9.51 9.51 7.90 75 S
Wheels India 201412 12.03 437.40 39.23 439.90 0.50 37.23 15.07 13.72 8.44 2.78 5.66 5.66 4.70 75 S
Wheels India 201503 12.03 459.85 39.45 463.00 0.34 36.64 14.90 15.66 6.08 -0.68 6.76 6.76 5.62 75 S
Winro Commercial (India) 201406 1.25 20.19 0.31 0.24 20.12 0.15 19.97 19.97 19.97 159.44 0 S
Winro Commercial (India) 201409 1.25 2.02 2.95 0.45 -0.48 0.00 0.15 -0.63 -0.63 -0.63 -4.99 0 S
Winro Commercial (India) 201412 1.25 -1.98 0.33 9.70 7.39 0.15 7.24 7.24 7.24 57.82 0 S
Winro Commercial (India) 201503 1.25 -3.99 0.73 8.37 3.66 0.15 3.51 2.10 1.41 1.41 11.23 0 S
Winsome Diamonds and Jewellery 201406 106.47 1.30 2.52 0.32 -0.90 134.88 1.37 -137.15 -137.15 -137.15 -12.88 0 S
Winsome Diamonds and Jewellery 201409 106.47 1.44 2.24 0.30 -0.50 139.13 1.39 -141.02 -141.02 -141.02 -13.25 0 S
Winsome Diamonds and Jewellery 201412 106.47 1.95 4.59 0.64 -2.00 143.50 1.39 -146.89 -146.89 -146.89 -13.80 0 S
Winsome Diamonds and Jewellery 201503 106.47 1.53 0.43 -1.10 -417.21 3.33 412.78 412.78 412.78 38.77 0 S
Wires & Fabriks (S.A.) 201406 3.06 21.61 0.01 18.85 0.05 2.81 1.01 1.56 0.24 -0.05 0.29 0.29 0.96 18 S
Wires & Fabriks (S.A.) 201409 3.06 28.79 25.04 0.05 3.79 1.03 1.77 0.99 0.18 0.82 0.82 2.67 18 S
Wires & Fabriks (S.A.) 201412 3.06 24.44 20.96 0.05 3.53 1.01 1.53 0.99 0.17 0.82 0.82 2.69 18 S
Wires & Fabriks (S.A.) 201503 3.06 24.41 20.64 0.10 3.87 1.07 1.55 1.25 -0.61 1.85 1.85 6.06 18 S
Wonderla Holidays 201406 56.50 63.73 25.04 2.42 41.12 0.43 3.92 36.76 11.93 24.84 24.84 4.88 15 S
Wonderla Holidays 201409 56.50 34.32 23.54 2.82 13.59 0.37 4.15 9.08 2.63 6.44 6.44 1.14 15 S
Wonderla Holidays 201412 56.50 47.36 26.47 2.12 23.01 0.45 4.04 18.52 5.75 12.77 12.77 2.26 15 S
Wonderla Holidays 201503 56.50 36.46 26.27 2.89 13.08 0.42 4.07 8.59 2.00 6.59 6.59 1.17 15 S
WW Technology Holdings 201406 0.25 0.00 0.02 -0.01 -0.01 -0.01 -0.01 -0.56 0 S
WW Technology Holdings 201409 4.96 0.05 0.06 -0.01 -0.01 -0.01 -0.01 -0.03 0 S
WW Technology Holdings 201412 4.96 0.11 0.01 0.10 0.10 0.10 0.10 0.20 0 S
WW Technology Holdings 201503 7.42 0.09 0.02 0.07 0.02 0.05 0.05 0.05 0.07 0 S

Co_Name Year Equity N.Sale O.O.I T. Exp O.I PBIDT Int. Dep. PBT T.Tax PAT A.PAT EPS Div (%)
Exp
ecte
d R
esu
lts
on
12
Au
gu
st 2
015
Zicom Electronic Security Systems 201406 17.60 220.79 190.82 0.20 30.17 12.03 7.44 10.71 1.52 9.19 8.63 4.90 12 C
Zicom Electronic Security Systems 201409 17.60 261.37 228.97 0.31 32.71 9.59 7.68 15.44 1.86 13.58 12.92 7.34 12 C
Zicom Electronic Security Systems 201412 17.60 295.24 258.70 0.28 36.82 15.04 8.65 13.13 1.87 11.27 10.66 6.06 12 C
Zicom Electronic Security Systems 201503 20.20 330.72 289.68 3.94 44.98 17.21 7.00 20.77 1.28 19.49 18.37 9.96 12 C
Zodiac Clothing Company 201406 19.39 94.37 4.47 91.18 2.50 10.16 0.44 4.61 5.11 1.08 4.03 4.03 2.08 31 C
Zodiac Clothing Company 201409 19.41 91.34 4.42 91.88 -0.27 3.61 0.52 0.39 2.70 1.57 1.13 1.13 0.58 31 C
Zodiac Clothing Company 201412 19.44 88.63 6.09 89.07 0.75 6.40 0.79 2.88 2.73 0.53 2.20 2.20 1.13 31 C
Zodiac Clothing Company 201503 19.51 100.12 4.51 101.99 2.82 5.46 0.75 2.58 2.13 0.47 1.66 1.66 0.85 31 C
Zuari Agro Chemicals 201406 42.06 1029.46 4.45 1017.37 5.00 21.54 67.95 5.64 -52.05 -14.17 -37.88 -37.88 -9.01 30 S
Zuari Agro Chemicals 201409 42.06 1531.61 3.88 1454.21 6.29 87.57 56.70 2.94 27.93 5.98 21.95 21.95 5.22 30 S
Zuari Agro Chemicals 201412 42.06 1412.71 3.57 1343.33 6.24 79.19 48.05 4.29 26.85 9.72 17.13 17.13 4.07 30 S
Zuari Agro Chemicals 201503 42.06 1533.83 4.93 1470.00 14.34 83.10 60.11 5.00 17.99 6.83 11.16 11.16 2.65 30 S
Zuari Global 201406 29.44 39.52 1.32 42.76 5.18 3.26 2.97 0.06 0.23 0.19 0.04 0.04 0.01 10 S
Zuari Global 201409 29.44 0.77 -3.91 19.30 23.98 3.36 0.06 20.56 3.01 17.55 17.55 5.96 10 S
Zuari Global 201412 29.44 1.16 -1.60 5.26 8.02 2.38 0.06 5.58 1.48 4.10 4.10 1.39 10 S
Zuari Global 201503 29.44 0.50 -2.10 7.61 10.21 2.52 0.05 7.64 2.53 5.11 5.11 1.74 10 S
This Document has been prepared by Nirmal Bang Research (A Division of Nirmal Bang Securities Pvt. ). The information, analysis and estimates contained herein
are based on Nirmal Bang Research assessment and have been obtained from sources believed to be reliable. This document is meant for the use of the intended
recipient only. This document, at best, represents Nirmal Bang Research opinion and is meant for general information only. Nirmal Bang Research, its directors,
officers or employees shall not in anyway be responsible for the contents stated herein. Nirmal Bang Research expressly disclaims any and all liabilities that may arise
from information, errors or omissions in this connection. This document is not to be considered as an offer to sell or a solicitation to buy any securities. Nirmal Bang
Research, its affiliates and their employees may from time to time hold positions in securities referred to herein. Nirmal Bang Research or its affiliates may from time to
time solicit from or perform investment banking or other services for any company mentioned in this document.
Nirmal Bang Research (Division of Nirmal Bang Securities Pvt. )
B-2, 301/302, Marathon Innova,
Opp. Peninsula Corporate Park
Off. Ganpatrao Kadam Marg
Lower Parel (W), Mumbai-400013
Board No. : 91 22 3926 8000/8001
Fax. : 022 3926 8010
Disclaimer: