experience the highest level of confidence › cs › library › brochures › 5991-4541en.pdf ·...
TRANSCRIPT

Experience the Highest Level of ConfidenceAgilent 6495C Triple Quadrupole LC/MS system

3
Your samples are precious and turnaround time is critical to the success of your organization. A sensitive, yet rugged instrument that provides day-in, day-out performance is the cornerstone of your workflow. The Agilent 6495C Triple Quadrupole LC/MS system is at the forefront of robustness, reliability, and accuracy, which makes it a perfect option for many applications, including peptide quantitation, food safety, environmental testing, clinical research, and forensics.
The Highest Level of Confidence
iFunnel technologyProvides unprecedented analytical sensitivity and precision at low intensities, featuring a third‑generation proprietary design.
VacShieldEnables quick and seamless capillary maintenance without venting the instrument, minimizing instrument maintenance downtime.
Q1 ion opticsReduces contamination and enables lower limits of detection by increasing ion transmission efficiency to the Q1 mass filter.
Ion detector Increases analytical sensitivity and quantitation across a wide mass range using a high energy conversion dynode with low noise characteristics.
Curved collision cell Facilitates efficient collection and transmission of fragment ions while eliminating cross‑talk.

4
Peptide identification and quantification
High m/z peptide ions are extremely descriptive and provide important biological information concerning size and location of post-translational modifications (PTMs) such as glycosylation or phosphorylation.
The Agilent 6495C Triple Quadrupole LC/MS system has a mass range that extends to m/z 3,000, which is beneficial in detecting large peptide fragments. Here we demonstrate the utility of the 6495C for detecting fragment-ion signals arising from a peptide in a targeted protein of interest. This approach is extremely sensitive, highly reproducible, and quantitatively precise.
Targeted Proteomics
Analytical Confidence
Quantification for G1F glycopeptide EEQYN[+1606.6]STYR
EEQYN(+1606.586706)STYR
Concentration (ng of mAb digest on-column)
-1 0 1 2 3 4 5 6 7 8 9 10 11 12 13 14 15 16 17 18 19 20 21 22 23 24 25
0
0.2
0.4
0.6
0.8
1.0
1.2
1.4
1.6
1.8
2.0y = 943.671754x – 5.093398
R2 = 0.99814103
Re
spo
nse
Blank
0.0197 ng
0.0394 ng
0.0591 ng
0.0098 ng
Zoom
×104
×102
×102
×102
×102
×102
×102
Re
spo
nse
0 0.06 0.12 0.18 0.24
-0.20.20.61.01.41.82.22.63.0
0.90 0.95 1.00 1.05 1.10
Co
un
ts
2.6
Co
un
ts
2.6
Co
un
ts
2.5
Co
un
ts
2.46
2.48
Co
un
ts
2.46
2.48
Acquisition time (min)
5
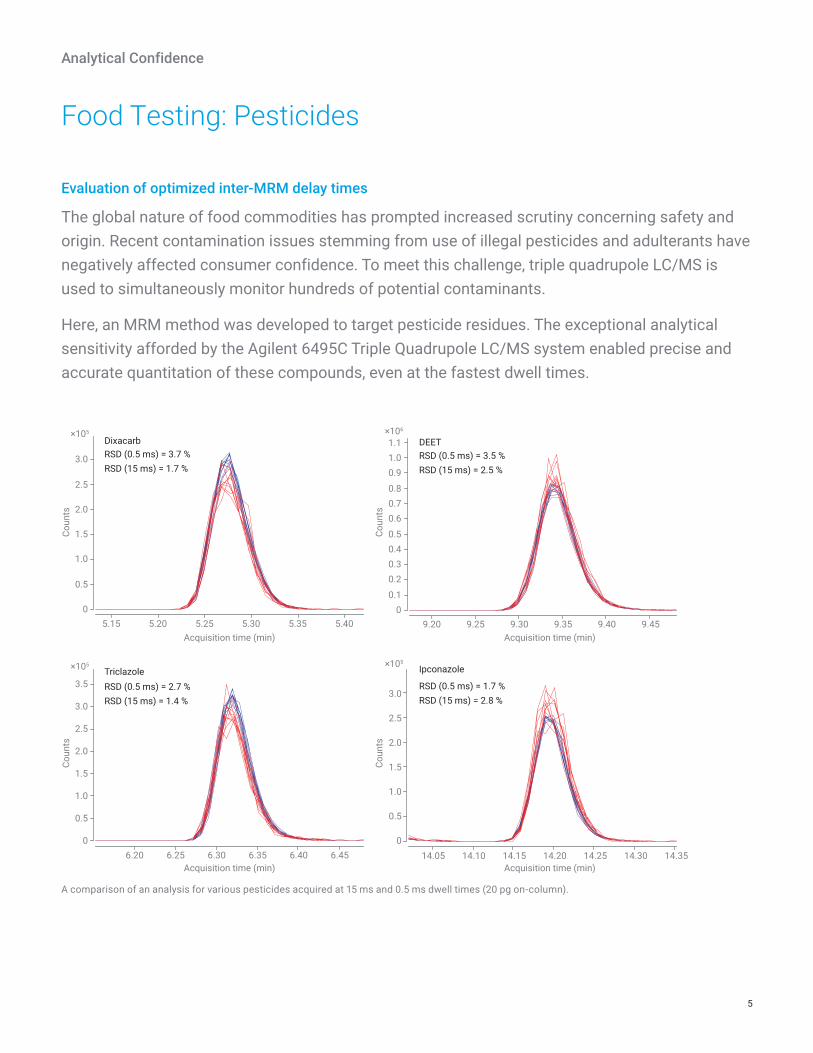
Evaluation of optimized inter-MRM delay times
The global nature of food commodities has prompted increased scrutiny concerning safety and origin. Recent contamination issues stemming from use of illegal pesticides and adulterants have negatively affected consumer confidence. To meet this challenge, triple quadrupole LC/MS is used to simultaneously monitor hundreds of potential contaminants.
Here, an MRM method was developed to target pesticide residues. The exceptional analytical sensitivity afforded by the Agilent 6495C Triple Quadrupole LC/MS system enabled precise and accurate quantitation of these compounds, even at the fastest dwell times.
Food Testing: Pesticides
Analytical Confidence
A comparison of an analysis for various pesticides acquired at 15 ms and 0.5 ms dwell times (20 pg on-column).
0
0.1
0.2
0.3
0.4
0.5
0.6
0.7
0.8
0.9
1.0
1.1
0
0.5
1.0
1.5
2.0
2.5
0.5
1.5
2.5
3.5
3.0
5.15 5.20 5.25 5.30 5.35 5.40 9.20
6.20 6.25 6.30 6.35 6.40 6.45 14.05 14.10 14.15 14.20 14.25 14.30 14.35
9.25 9.30 9.35 9.40 9.45
Dixacarb
RSD (0.5 ms) = 3.7 %
RSD (15 ms) = 1.7 %
RSD (0.5 ms) = 3.5 %
RSD (15 ms) = 2.5 %
0
1.0
2.0
3.0
0.5
1.5
2.5
0
1.0
2.0
3.0RSD (0.5 ms) = 2.7 %
RSD (15 ms) = 1.4 %
RSD (0.5 ms) = 1.7 %
RSD (15 ms) = 2.8 %
DEET
Triclazole Ipconazole
×105 ×106
×105 ×105
Acquisition time (min)
Acquisition time (min)
Acquisition time (min)
Acquisition time (min)
Co
un
tsC
ou
nts
Co
un
tsC
ou
nts

6
Accuracy and precision for analysis of PPCPs in water
Worldwide, scientists are monitoring trace amounts of compounds from pharmaceuticals and personal care products (PPCPs) in our drinking water. PPCPs are extremely diverse and are often unique to a geographical region. These compounds (active ingredients, byproducts, and metabolites) are often not completely removed during the water-treatment process. That means that contaminants can leech into ground and surface water, collectively the major source of drinking water for a wide variety of species.
The 6495C Triple Quadrupole LC/MS system enables direct injection of water samples without sample pre-concentration. The results show screening and quantitation of PPCPs in surface water samples at levels that extend to 0.5 ng/L and below.
Environmental Water Analysis
Analytical Confidence
Calibration plots for diclofenac (negative mode) and venlafaxine (positive mode) in water evaluated for quantitation accuracy and peak area RSD.
A
Re
sp
on
se
0 100 200 300 400 500 600 700 900 1,000
Concentration (ng/L)
800
-0.5
00.5
1.0
1.52.0
2.5
3.03.5
4.0
4.5
5.05.5
y = 546.946323x – 34.491767Diclofenac
R2 = 0.99954397
OHCl
Cl
O
NH
B
0 50 100 150 200 250 300 350 400 450 500 550
-0.2
0
0.2
0.4
0.6
0.8
1.0
1.2
1.4
1.6
1.8y = 36438.173667x – 15563.567037
R2 = 0.99762610
Re
sp
on
se
Concentration (ng/L)
Venlafaxine
O
N
OH
×105 ×107
Overlaid MRM chromatograms for two example PPCPs evaluated in this study at 0.5 ng/L. Reproducible responses (RSD% <10 %) were observed for both quantifier and qualifier ions of atrazine (A) and diltiazem (B) at sub-ng/L concentrations.
A B×103
×102 ×102
00.20.40.60.81.01.21.41.61.82.02.22.4
Acquisition time (min) Acquisition time (min)
Co
un
ts
Co
un
ts
3.3 3.4 3.5 3.6 3.7 3.8 3.9 4.0
10 replicate injectionsAtrazine
0.5 ng/LRSD = 6.5 % (Quant)IDL = 0.10 ng/L
10 replicate injectionsDiltiazem
0.5 ng/LRSD = 8.1 % (Quant)IDL = 0.12 ng/L
0
2
4
6
3.4 3.6 3.8 4.0
0.1 ng/L 0.1 ng/L
0
0.2
0.4
0.6
0.8
1.0
1.2
2.35 2.45 2.55 2.65 2.75 2.85 2.95
2.4 2.6 2.8 3.0
0
2
4
6
Quant.: 216.1 174.1Qual.: 216.1 146.0
Quant.: 415.2 178.1Qual.: 415.2 150.0
7
8
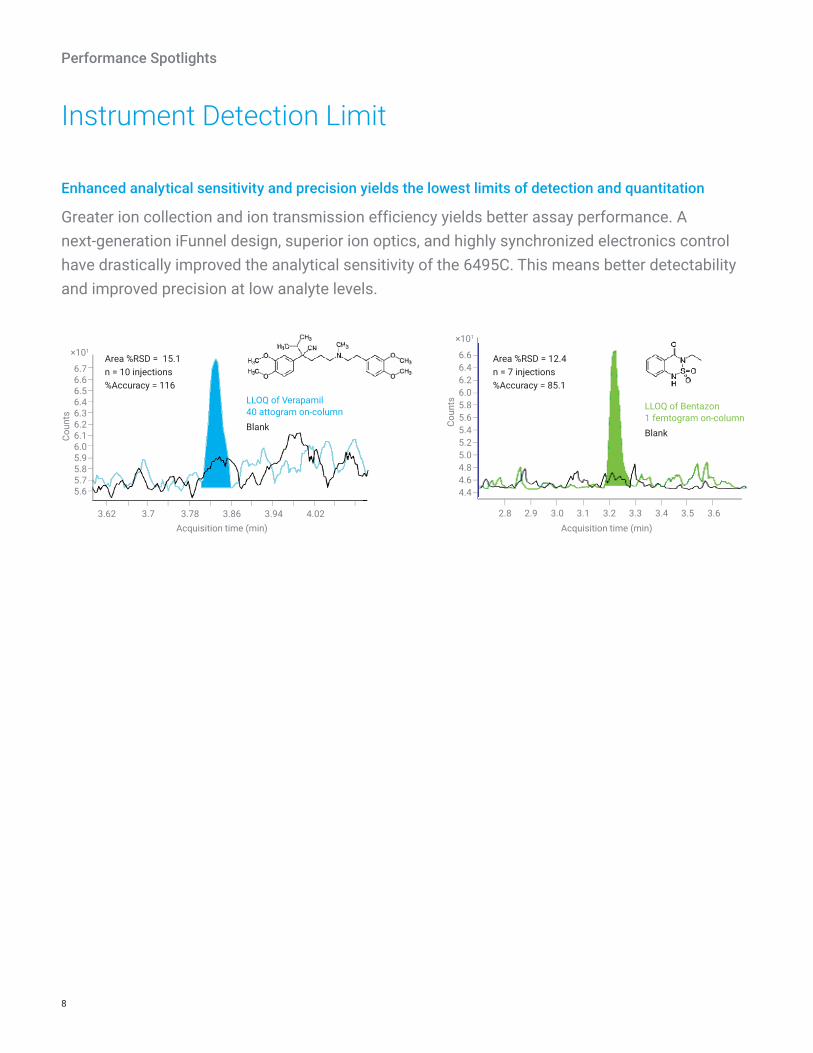
Enhanced analytical sensitivity and precision yields the lowest limits of detection and quantitation
Greater ion collection and ion transmission efficiency yields better assay performance. A next-generation iFunnel design, superior ion optics, and highly synchronized electronics control have drastically improved the analytical sensitivity of the 6495C. This means better detectability and improved precision at low analyte levels.
Instrument Detection Limit
Performance Spotlights
6.76.66.56.46.36.26.16.05.95.85.75.6
Area %RSD = 15.1
n = 10 injections
%Accuracy = 116
LLOQ of Verapamil40 attogram on-column
Blank
3.62
Acquisition time (min)
Co
un
ts
3.7 3.78 3.86 3.94 4.02
×1016.6
6.4
6.2
6.0
5.8
5.6
5.4
5.2
5.0
4.8
4.6
4.4
Area %RSD = 12.4
n = 7 injections
%Accuracy = 85.1
LLOQ of Bentazon1 femtogram on-column
Blank
Acquisition time (min)
Co
un
ts
2.8 3.0 3.2 3.42.9 3.1 3.3 3.5 3.6
×101
9
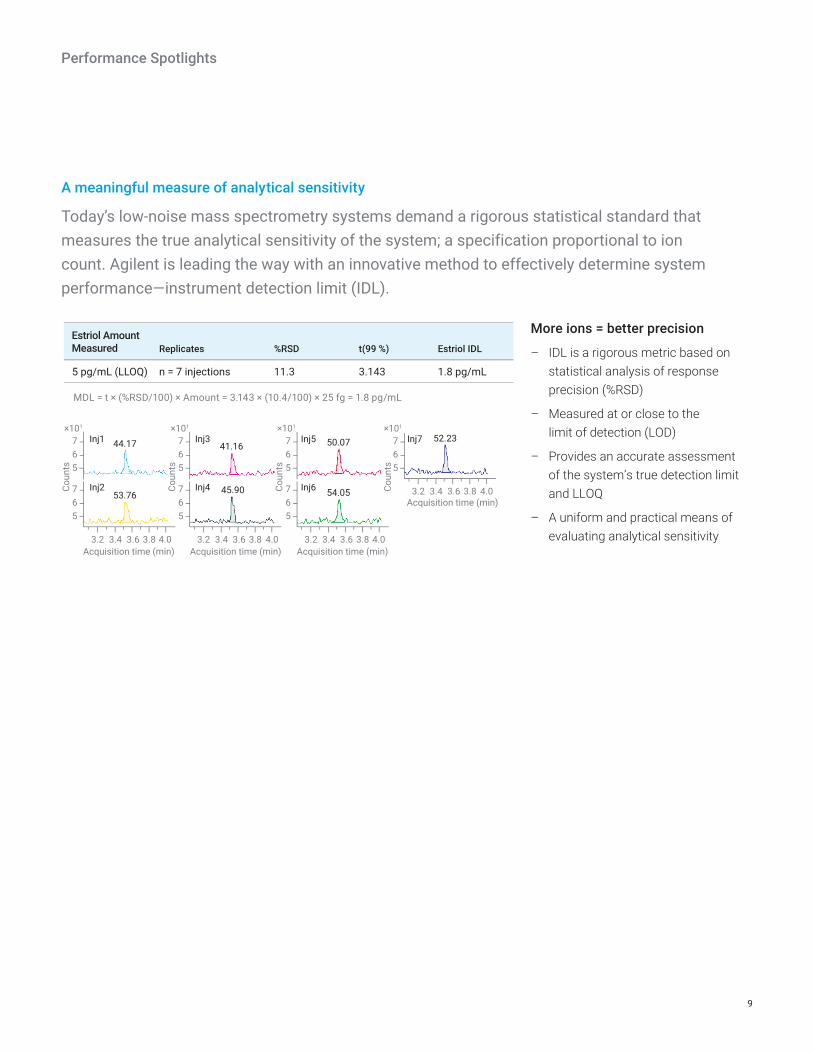
A meaningful measure of analytical sensitivity
Today’s low-noise mass spectrometry systems demand a rigorous statistical standard that measures the true analytical sensitivity of the system; a specification proportional to ion count. Agilent is leading the way with an innovative method to effectively determine system performance—instrument detection limit (IDL).
Performance Spotlights
Estriol Amount Measured Replicates
%RSD
t(99 %)
Estriol IDL
5 pg/mL (LLOQ) n = 7 injections 11.3 3.143 1.8 pg/mL
MDL = t × (%RSD/100) × Amount = 3.143 × (10.4/100) × 25 fg = 1.8 pg/mL
More ions = better precision
– IDL is a rigorous metric based onstatistical analysis of responseprecision (%RSD)
– Measured at or close to thelimit of detection (LOD)
– Provides an accurate assessmentof the system’s true detection limitand LLOQ
– A uniform and practical means ofevaluating analytical sensitivity
7
6
5
3.2 3.4 3.6 3.8
7
6
5
7
6
5
3.2 3.4 3.6 3.8
7
6
5
7
6
5
3.2 3.4 3.6 3.8
7
6
5
3.2 3.4 3.6 3.8 4.0
4.04.04.0
7
6
5
44.17 41.16 50.07 52.23
53.7645.90 54.05
Inj1 Inj3 Inj5 Inj7
Inj2 Inj4 Inj6
×101 ×101 ×101 ×101
Acquisition time (min) Acquisition time (min) Acquisition time (min)
Acquisition time (min)
Co
un
ts
Co
un
ts
Co
un
ts
Co
un
ts
10
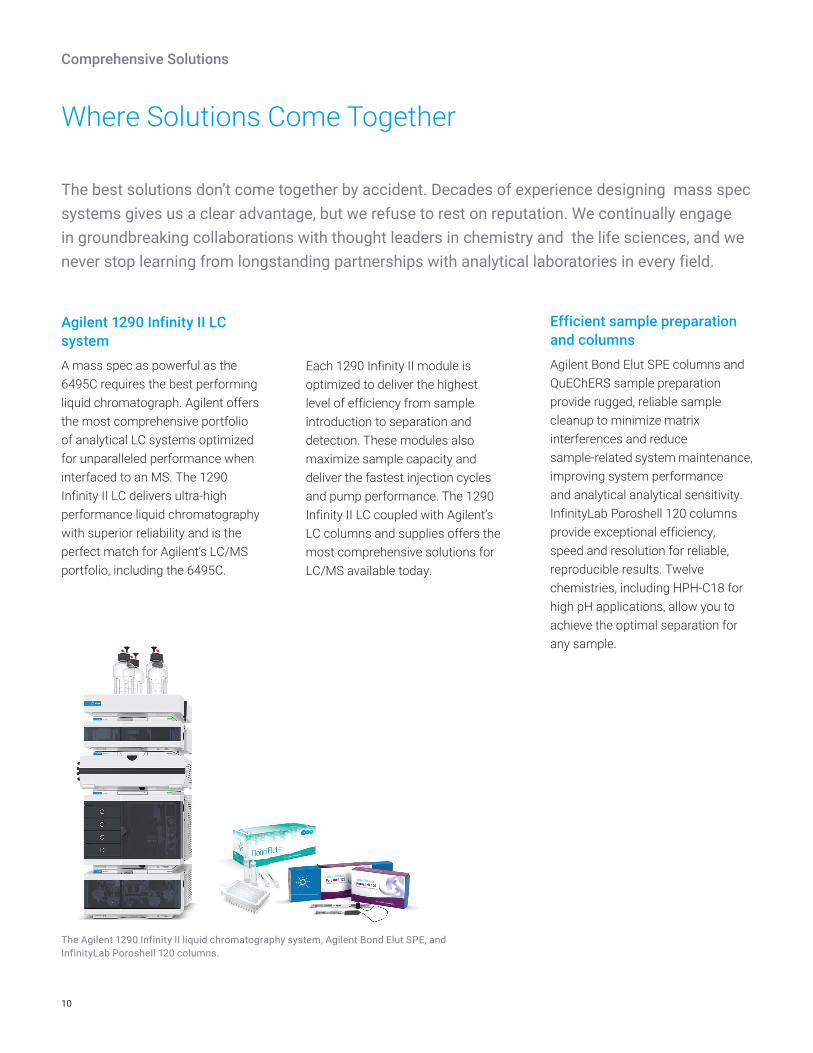
The best solutions don’t come together by accident. Decades of experience designing mass spec systems gives us a clear advantage, but we refuse to rest on reputation. We continually engage in groundbreaking collaborations with thought leaders in chemistry and the life sciences, and we never stop learning from longstanding partnerships with analytical laboratories in every field.
Where Solutions Come Together
Comprehensive Solutions
Agilent 1290 Infinity II LC systemA mass spec as powerful as the 6495C requires the best performing liquid chromatograph. Agilent offers the most comprehensive portfolio of analytical LC systems optimized for unparalleled performance when interfaced to an MS. The 1290 Infinity II LC delivers ultra‑high performance liquid chromatography with superior reliability and is the perfect match for Agilent’s LC/MS portfolio, including the 6495C.
Each 1290 Infinity II module is optimized to deliver the highest level of efficiency from sample introduction to separation and detection. These modules also maximize sample capacity and deliver the fastest injection cycles and pump performance. The 1290 Infinity II LC coupled with Agilent’s LC columns and supplies offers the most comprehensive solutions for LC/MS available today.
Efficient sample preparation and columnsAgilent Bond Elut SPE columns and QuEChERS sample preparation provide rugged, reliable sample cleanup to minimize matrix interferences and reduce sample‑related system maintenance, improving system performance and analytical analytical sensitivity. InfinityLab Poroshell 120 columns provide exceptional efficiency, speed and resolution for reliable, reproducible results. Twelve chemistries, including HPH‑C18 for high pH applications, allow you to achieve the optimal separation for any sample.
The Agilent 1290 Infinity II liquid chromatography system, Agilent Bond Elut SPE, and InfinityLab Poroshell 120 columns.
11
MassHunter softwareAgilent MassHunter software simplifies sample management, MS method optimization, data processing, and data reporting for quantitative analyses. An impressive suite of tools facilitates sample analysis, particularly for routine quantitation.
These tools include:
– Optimizer software delivers automated determination of MRM transitions for quantitation and optimized collision energies for each analyte
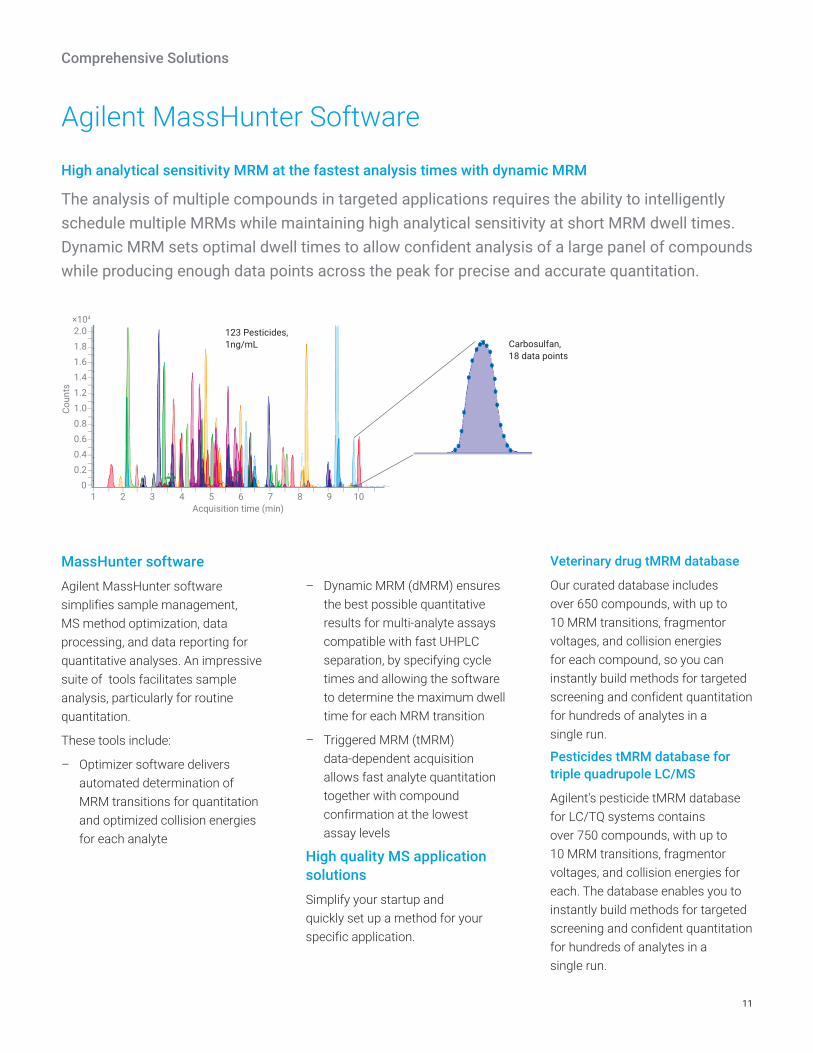
High analytical sensitivity MRM at the fastest analysis times with dynamic MRM
The analysis of multiple compounds in targeted applications requires the ability to intelligently schedule multiple MRMs while maintaining high analytical sensitivity at short MRM dwell times. Dynamic MRM sets optimal dwell times to allow confident analysis of a large panel of compounds while producing enough data points across the peak for precise and accurate quantitation.
Agilent MassHunter Software
×104
2.0
1.8
1.6
1.4
1.2
1.0
0.8
0.6
0.4
0.2
01 2 3 4 5 6 7 8 9 10
123 Pesticides, 1ng/mL Carbosulfan,
18 data points
Acquisition time (min)
Co
un
ts
– Dynamic MRM (dMRM) ensures the best possible quantitative results for multi‑analyte assays compatible with fast UHPLC separation, by specifying cycle times and allowing the software to determine the maximum dwell time for each MRM transition
– Triggered MRM (tMRM) data‑dependent acquisition allows fast analyte quantitation together with compound confirmation at the lowest assay levels
High quality MS application solutionsSimplify your startup and quickly set up a method for your specific application.
Comprehensive Solutions
Veterinary drug tMRM database
Our curated database includes over 650 compounds, with up to 10 MRM transitions, fragmentor voltages, and collision energies for each compound, so you can instantly build methods for targeted screening and confident quantitation for hundreds of analytes in a single run.
Pesticides tMRM database for triple quadrupole LC/MS
Agilent's pesticide tMRM database for LC/TQ systems contains over 750 compounds, with up to 10 MRM transitions, fragmentor voltages, and collision energies for each. The database enables you to instantly build methods for targeted screening and confident quantitation for hundreds of analytes in a single run.

For Research Use Only. Not for use in diagnostic procedures.
This information is subject to change without notice.
© Agilent Technologies, Inc. 2019 Published in the USA, May 28, 2019 5991-4541EN
Learn more: www.agilent.com/chem/6495C
Buy online: www.agilent.com/chem/store
U.S. and Canada 1-800-227-9770 [email protected]
Europe [email protected]
Asia Pacific [email protected]
Agilent CrossLabYou can trust Agilent CrossLab service experts to deliver valuable insights and keep your instruments running at top performance. Our industry‑leading services—tailored to meet your needs—include instrument transition, application consulting, repairs, preventive maintenance, compliance verification, and education. Ask us how we can support your laboratory today.
Promising 10 years of valueThe Agilent Value Promise reflects utmost confidence in our unrivaled industry standards for quality system design and manufacturing. From the date you purchase select instruments from our leading chromatography, spectrometry, and spectroscopy product lines, we guarantee at least 10 years use or residual‑value credit towards a replacement model upgrade. Because we stand behind our systems, our guarantee maximizes your return on investment by assuring your purchase is safe.