experiences in long-term evaluation of mercury emission
TRANSCRIPT

Experiences in Long-Term Evaluation of Mercury EmissionMonitoring Systems
Chin-Min Cheng,* Hung-Ta Lin, Qiang Wang, Chien-Wei Chen, Chia-Wei Wang,†Ming-Chung Liu,† Chi-Kuan Chen,† and Wei-Ping Pan
Institute for Combustion Science and EnVironmental Technology, Department of Chemistry, WesternKentucky UniVersity, 2413 NashVille Road, Bowling Green, Kentucky 42101
ReceiVed NoVember 10, 2007. ReVised Manuscript ReceiVed May 5, 2008
Six mercury continuous emission monitoring (CEM) systems provided by two leading mercury (Hg) CEMsystem manufacturers were tested at five coal combustion utilities. The linearity, response time, day-to-daystability, efficiency of the Hg speciation modules, and ease of use were evaluated by following proceduresspecified in the Code of Federal Regulation Title 40 Part 75 (40 CFR Part 75). Mercury monitoring resultsfrom Hg CEM systems were compared to an EPA-recognized reference method. A sorbent trap samplingsystem was also evaluated in this study to compare the relative accuracy to the reference method as well asto Hg CEM systems. A conceptual protocol proposed by U.S. EPA (Method 30A) for using an Hg CEMsystem as the reference method for the Hg relative accuracy (RA) test was also followed to evaluate theworkability of the protocol. This paper discusses the operational experience obtained from these field studiesand the remaining challenges to overcome while using Hg CEM systems and the sorbent trap method forcontinuous Hg emission monitoring.
Introduction
Mercury (Hg) is one of the 189 hazardous air pollutants listedin the 1990 Amendments to the Clean Air Act. Coal-fired powergeneration is the largest anthropogenic source of Hg in the U.S.and is responsible for the annual release of approximately 50tons of Hg into the atmosphere.1,2 The U.S. EnvironmentalProtection Agency (EPA) announced the Clean Air MercuryRule (CAMR) in 2005, which capped mercury emissions fromcoal-fired power utilities and established a mercury cap-and-trade program. Although the rule was vacated by the Districtof Columbia Circuit in February 2008, a more restrictive Hgemission regulation is expected to be implemented by the EPAusing Maximum Achievable Control Technology (MACT)standards.
To ensure the Hg emission reduction goals can be met, theimplemented mercury emission regulation will also requireaffected electric utility units to continuously monitor mercury(Hg) mass emissions using available monitoring techniques [e.g.,Hg continuous emission monitoring (CEM) system and sorbenttrap method]. Any applied monitoring system will be subjectto restrictive certification and quality assurance/quality control(QA/QC) procedures, which are currently described in the 40CFR Part 75.
The Institute for Combustion Science and EnvironmentalTechnology (ICSET) at Western Kentucky University (WKU),
in conjunction with Electric Power Research Institute (EPRI)and Illinois Clean Coal Institute (ICCI), conducted six fieldstudies to evaluate using the Hg CEM systems and sorbent trapmethod for measuring Hg emissions.
The study was carried out under a wide variety of coal-firedpower generation operation conditions. Two types of pulverizedcoal (PC) boilers (i.e., wall-fired and cyclone) and a circulatingfluidized bed (CFB) combustion system were studied. Bitumi-nous, powder river basin (PRB) sub-bituminous, and lignitecoals were burned by these tested facilities. Combinations ofvarious air pollution control devices were also included in thestudy to provide comprehensive evaluation results.
In these field studies, the initial certification and data qualityassurance and quality control (QA/QC) procedures specified inthe 40 CFR Part 75 were carried out to evaluate the capabilityof the tested Hg CEM systems to pass compliance requirements,as well as the data integrity and system stability duringoperation.
Relative accuracy (RA) of the test Hg CEM systems wasdetermined using the Ontario Hydro (OH) method. A sorbenttrap method for monitoring the Hg emission was also testedfollowing the procedures and data QA/QC criteria specified inthe Appendix K of 40 CFR Part 75. In addition, a conceptualprotocol (Method 30A) proposed by EPA for using Hg CEMsystems as a reference test method for conducting RA testingwas also carried out to evaluate the workability of the protocol.During the field study 1 (FS-1), stratification tests, using NOx,SO2, and O2 as substitutes for Hg, were also performed.
This paper discusses the results obtained from instrumentcertification and data QA/QC verification tests, relative accuracytests, and emission monitoring. This paper also discusses the
* To whom correspondence should be addressed. E-mail: [email protected].
† Current address: Department of Chemical Engineering, Ming-ChiUniversity, Taipei, Taiwan.
(1) U.S. Environmental Protection Agency. Mercury study report toCongress. Volume II: An inventory of anthropogenic mercury emissionsin the United States. Technical Report, EPA-452/R-96-001b, Office of AirQuality Planning and Standards, Washington, D.C., 1996.
(2) Brown, T. D.; Smith, D. N.; Hargis, R. A., Jr.; O’Dowd, W. J. J.Air Waste Manag. Assoc. 1999, 49, 628–640.
Energy & Fuels XXXX, xxx, A
10.1021/ef7006744 CCC: $40.75 XXXX American Chemical Society
Published on Web 07/22/2008

operational experience obtained from these field studies and theremaining challenges to be overcome.
Experimental Section
Testing Site. Evaluation studies were conducted at five coalcombustion facilities. The configurations of each test unit aresummarized in Table 1. As shown in the table, the five units testedin this study represented a wide range of operational configurationsin terms of fuels, boiler types, and combinations of air pollutioncontrol devices (APCDs).
The Hg concentrations in the coal used by the test boilers rangedfrom 0.067 to 0.2 µg/g. The averages of Hg concentration in theflue gases of the test units during the evaluation period ranged from0.19 to 14 µg/dscm. The results were determined by the OH method,which is one of the EPA reference methods for flue gas Hgmeasurement.
Hg Continuous Emission Monitoring (CEM) Systems. Six HgCEM systems were tested. Three of the systems were provided bymanufacturer A and are referred to as A1, A2, and A3 in the Resultsand Discussion. The other three systems were provided bymanufacturer B and are referred to as B1, B2, and B3 in thefollowing section. Table 1 illustrates what Hg CEM system wasused in each field evaluation.
For a given Hg CEM system, the configuration includes anatomic fluorescence spectroscopy Hg analyzer, a calibration unitfor providing elemental Hg gases, a sampling probe, a heatedumbilical line for transporting flue gas samples and samplingparameters, and a gas conditioner for converting ionic Hg toelemental Hg in the flue gas and for removing acidic gascomponents.
All Hg CEM systems used fast loop, inertial type samplingprobes allowing for ash-free flue gas to be extracted from the stack.This type of probe extracts the flue gas by a stream of compressedair passing through an eductor installed at the exit end of the fluegas sampling loop. The movement of the compressed air creates apressure differential across the eductor, which generates an axial
flue gas flow in the sampling loop with high velocity. After beingextracted, flue gas containing fly ash particles continue to travel ina straight direction. A sample stream is withdrawn from the mainflue gas flow by a vacuum created by a second eductor at a verylow filter face velocity, which separates the sample stream fromfly ash. High velocity axial gas flow and low radial velocity preventparticles entrained in the flue gas from depositing on or penetratinginto the porous filter wall. The sample stream was diluted withzero air before it was transported to the analyzer. The dilution ratiosof the participating Hg CEM systems ranged from 28-41, whichwere adjusted on the basis of calibration results.
For Hg CEM systems from manufacturer A, the diluted gassample was transported through a heated umbilical line (180 °C)to a conditioner located more than 100 m away from the samplingprobe. In the conditioner, the gas sample was separated into twostreams: i.e., Hg(0) and Hg(T). The Hg(0) stream delivered a gassample containing only elemental Hg and other insoluble compo-nents to the analyzer after passing through a scrubber, in whichionic Hg and acidic components in the gas were removed. TheHg(T) stream passed a catalyst tube where ionic Hg was reducedto elemental Hg at a temperature of 700 °C. After removing acidiccomponents in another scrubber, the Hg(T) stream was sent to theanalyzer. A chiller (5 °C) was used to remove excess moisture inthe conditioned sample gas. For Hg CEM systems from manufac-turer B, the sample conditioning unit was located in the probeassembly. The flue gas sample was immediately treated after beingdiluted. Instead of using deionized water, the system used sorbentmaterial to remove acidic components from the sample stream.
Both A and B Hg CEM systems used atomic fluorescencespectroscopy as the Hg detector. The difference between the twotypes of analyzers was the application of gold traps. Two parallelgold traps were used by the analyzers in the Hg CEM systems frommanufacturer A to selectively capture the elemental mercury in thesample gas prior to the detector. Elemental mercury in the samplegas formed an amalgam with the gold surface. Once loaded, thetrap was heated and flushed to the detector with ultra pure argon.One complete adsorption and desorption cycle took approximately150 s. In the case of Hg CEM systems from manufacturer B, fluegas was continually delivered into the detector without passingthrough gold traps and, therefore, generated continuous Hg readings.The B Hg CEM systems were set to provide a 5 min averagereading every 1 min.
Only compressed air was required to operate the Hg CEMsystems from manufacturer B. In the case of the A Hg CEMsystems, in addition to compressed air, supplies of ultra high purityargon and deionized water were also required.
Sorbent Trap Mercury Sampling System. A sorbent trapsampling system provided by Apex Instruments, Inc. (Fuquay-Varina, NC) was used in this study. A known volume of dry fluegas was extracted from the stack through paired sorbent traps witha constant flow rate of 0.2-0.6 L/min. Each trap consisted of threesections of activated carbon. The first section was designed tocapture Hg in the flue gas. The second and third sections were usedfor sampling and analytical QA/QC purposes. After sampling, eachsection of the trap was analyzed for Hg using an RP-M324 mercuryanalyzer (Ohio Lumex, OH). The analyzer decomposes the sorbentwith a known mass at a temperature between 600 and 800 °C. The
Table 1. Configurations of Test Sites
field testnumber facility boiler fuel types
capacity(MWe)
boilertypes
APCDconfigurations
Hg incoala (µg/g)
Hg in stackgas (µg/dscm)
CEMparticipatedb
FS-1 T unit 4 lignite 650 PCc ESPd + FGDe 0.20 ( 0.04 14 ( 3f,g A2 and B2FS-2 S unit 123 bituminous 115 CFBh SNCRi + FFj 0.067 ( 0.009 0.19 ( 0.15f B1FS-3 C unit 31/32 bituminous 90 Cyclone SCRk + ESP + FGD 0.072 ( 0.016 1.9 ( 0.3f A1
2.3 ( 1.6g
FS-4 S unit 4 bituminous 173 Cyclone SCR + ESP + FGD 0.087 ( 0.007 0.70 ( 0.16g A1FS-5 C unit 33 bituminous 205 PC SCR + ESP + FGD 0.068 ( 0.015 1.41 ( 0.18g B1FS-6 M unit 2 PRBl 140 PC ESP NA NA A3 and B3
a Dry based. b CEM A1 and B1 were provided by ICSET, and the others were provided by the facilities. c Pulverized coal. d Electrostatic precipitator.e Flue gas desulfurization. f Non-ozone season. g Ozone season. h Circulation fluidized bed. i Selective noncatalytic reduction. j Fabric filter. k Selectivecatalytic reduction. l Powder river basin.
Table 2. Concentration of Hg Gases Generated by CEM A1Verified by OH and Sorbent Trap Methods
Hg concentration (µg/N m3)
Ontario Hydro sorbent trap
Ctargeted ) 10.2 µg/N m3 9.3 ( 0.2 10.1 ( 0.8RD (%) 91.2 99.0
Table 3. Evaluation of Hg Calibration Gases
Hg calibrationsource
responseCEM
targetedconcentration
(µg/dscm)
responseconcentration
(µg/dscm) RD (%)
CEM A-1 CEM A-2 14.78 15.1 ( 0.8 102CEM A-1 CEM B-2 14.78 19.8 ( 0.4 134cylinder CEM A-2 9.5 8.06 ( 0.16 85cylinder CEM B-2 9.5 9.12 ( 0.05 96CEM B-3 CEM A-3 10.0 8.02 ( 0.07 80CEM A-3 CEM B-3 10.0 12.7 ( 0.5 127
B Energy & Fuels, Vol. xxx, No. xx, XXXX Cheng et al.
Hg concentration was determined by measuring the mercury vaporreleased during the decomposition using a Zeeman atomic adsorp-tion spectroscopy.
Sampling Location. For a given test, the sampling location forthe Hg CEM system was above the nearest flow restriction by adistance of greater than 10 duct diameters and away from the fluegas outlet by at least 22 duct diameters. The gas sample (treated oruntreated depending upon the CEM systems) was transported tothe analyzer through a heated umbilical line (100-125 m in length).
While carrying out OH method sampling, the stack gas wascollected at either 90° or 180° from the Hg CEM sampling probewith the exception of field test 5 (FS-5). In the FS-5 test, the fluegases were extracted from the two flue gas desulfurization (FGD)unit outlet ducts for OH method sampling.
Certification Tests. A series of inertial certification testsdescribed in the Appendix A of 40 CFR Part 75 were carried out(with the exception of FS-6), which included a 7 day dailycalibration error check, linearity check, system integrity check, andcycle time test. The relative accuracy of a given evaluated Hg CEMsystem (except for FS-6) with respect to the OH method resultswas also determined. A total of 12 runs of paired OH methodsampling were carried out for the relative accuracy test. The dataQA/QC procedures provided in Appendix B of Part 75 were alsofollowed to evaluate the stability of the CEM systems.
Inertial Certification Test. Detailed procedures for each test canbe seen in Appendix A of 40 CFR Part 75. In summary, the 7 daycalibration error test was to evaluate the accuracy and stability ofthe calibration of the Hg gas monitor over an extended period ofoperation. For the linearity check test, three concentration levelsof elemental Hg gases, which were chosen based on the fuel burnedby the coal combustion utility, were measured by an Hg CEMsystem to determine whether the response of a gas monitor is linearacross its range. Instead of using elemental Hg, three levels of ionicHg gases were used in the system integrity check to verify theeffectiveness of the sample gas conditioning unit. The cycle timetest was to measure whether a gas monitoring system is capable ofcompleting at least one cycle of sampling, analyzing, and datarecording every 15 min.
RelatiVe Accuracy Test. The relative accuracy (RA) test wasperformed using the OH reference method. Detailed RA testprocedures are described in Appendix A of 40 CFR Part 75. Inshort, while an RA test was conducted in this study, 12 runs ofOH method samplings were carried out within a period of 96consecutive unit operating hours. The evaluated Hg continuousmonitoring system remained operating during the OH methodsampling. No system adjustment was performed during the RA test.After the RA test, at least 9 sets of the OH method data were chosenbased on the criteria specified in the procedures and those data wereused as the reference values. A total of 9-12 sets of Hg monitoringresults from the test CEM system, which were the mean values ofthe Hg readings collected from perspective OH method samplingperiods, were compared to the reference values. If the instrumentpassed the RA test, the bias test was performed to determine whether
the monitoring system was biased low with respect to the OHreference method.
Data QA/QC Procedures. Three types of tests (i.e., dailycalibration error check, weekly one point system integrity check,and linearity check) were performed on the test CEM after the firstRA test was completed. Testing procedures were very similar tothe tests described in the initial certification tests.
Instrumental Reference Method (EPA Method 30A). The proce-dures described in the conceptual method using the Hg CEM systemas a reference method for conducting relative accuracy testing wereevaluated in field study 1 (FS-1). Both CEM A2 and B2 were usedas the IRM systems.
Results and Discussion
Calibration Gas Evaluation. The National Institute ofStandards and Technology (NIST)-traceable gas standards andprotocols for mercury gas generators and cylinders were notavailable when the studies were conducted. To evaluate the Hggas provided by the calibration units of the CEM A and Bsystems, a series of comparison tests were performed. Twoconcentration levels of Hg gas cylinders provided by SpectrumGases, Inc. (West Branchburg, NJ) were also used. First, theHg gas from the CEM A2 calibration unit was evaluated bythree runs of the OH method test. The concentration was alsoevaluated by the sorbent trap method. The results are sum-marized in Table 2, where the relative deviation (RD, %) iscalculated by the following equation:
RD (%))Cmeasured
Ctargeted× 100% (1)
The results shown in the table have been corrected to 20 °C.As can be seen in the table, the target values of the evaluatedHg gas was 9.7 and 0.9% higher than the averages of the threeOH method and sorbent trap method measurements, respec-tively. The relative standard deviations of the three OH methodand sorbent trap method results were 2.2 and 7.9%, respectively.The test illustrated that the Hg gas generated from the calibrationunit of the A1 Hg CEM system was somehow close to thereference value.
The second test of the series consisted of measuring the Hggas from the A1 calibration unit using the A2 and B2 systems.While doing measurements, the A1 Hg gas was deliveredthrough the calibration gas line, inertial filter, sample condi-tioner, heated sample delivery line, and the analyzer of the twomeasuring Hg CEM systems. In addition, a Hg cylinder gas(9.5 µg/N m3) provide by Spectra Gases (West Branchburg, NJ)was also used. Results obtained from the study are listed inTable 3.
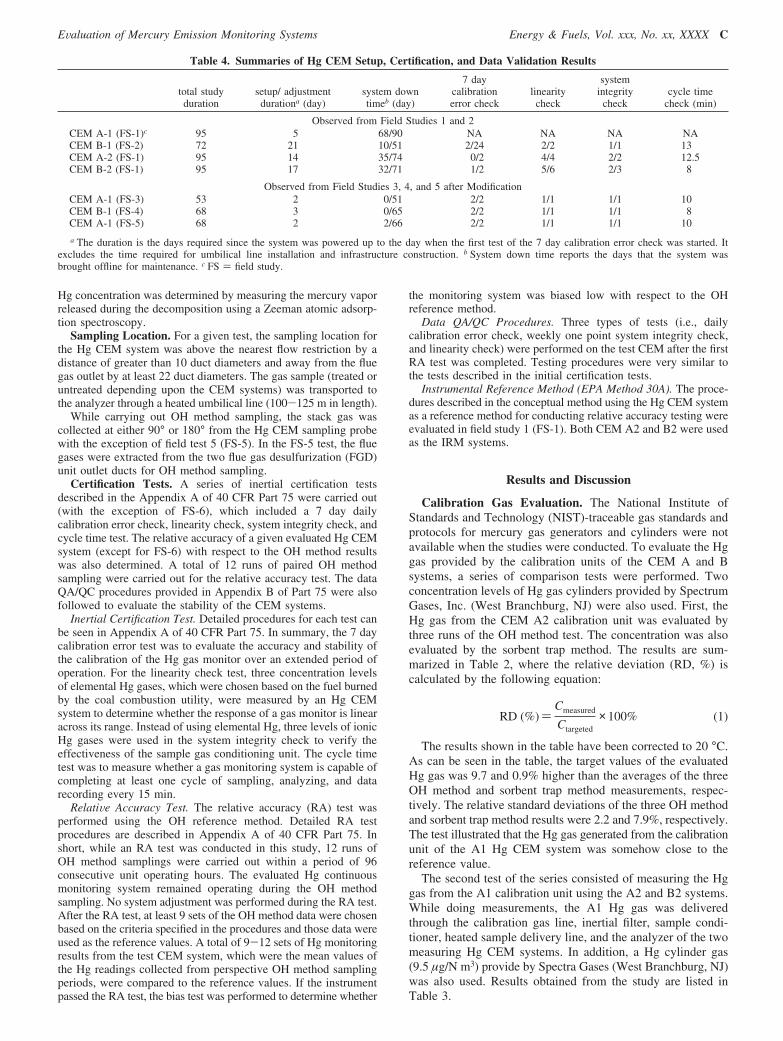
Table 4. Summaries of Hg CEM Setup, Certification, and Data Validation Results
total studyduration
setup/ adjustmentdurationa (day)
system downtimeb (day)
7 daycalibrationerror check
linearitycheck
systemintegrity
checkcycle time
check (min)
Observed from Field Studies 1 and 2CEM A-1 (FS-1)c 95 5 68/90 NA NA NA NACEM B-1 (FS-2) 72 21 10/51 2/24 2/2 1/1 13CEM A-2 (FS-1) 95 14 35/74 0/2 4/4 2/2 12.5CEM B-2 (FS-1) 95 17 32/71 1/2 5/6 2/3 8
Observed from Field Studies 3, 4, and 5 after ModificationCEM A-1 (FS-3) 53 2 0/51 2/2 1/1 1/1 10CEM B-1 (FS-4) 68 3 0/65 2/2 1/1 1/1 8CEM A-1 (FS-5) 68 2 2/66 2/2 1/1 1/1 10
a The duration is the days required since the system was powered up to the day when the first test of the 7 day calibration error check was started. Itexcludes the time required for umbilical line installation and infrastructure construction. b System down time reports the days that the system wasbrought offline for maintenance. c FS ) field study.
EValuation of Mercury Emission Monitoring Systems Energy & Fuels, Vol. xxx, No. xx, XXXX C
It was found that the response of the A2 system to the A1Hg gas was within 2% of standard deviation. The response ofthe B2 system to the A1 Hg gas was 34% higher than the targetvalue. Using the Hg gas cylinder, the response of the B2 systemwas closer than the response from the A2 system. Accordingto the test results, in general, the response from Hg CEMsystems provided by manufacturer B were systematically higherthan the results from the A systems.
The observed discrepancy was due to the concentrationbias between the Hg calibration gases generated from thetwo units. At a specified concentration, the calibration gasgenerated from the A calibration units was higher than theHg gas provided by the B units. The conclusion is illustratedby field study 6 (FS-6), in which Hg gases from thecalibration units of A3 and B3 were measured against eachother. As can be seen in Table 3, an approximate 20% ofdisagreement was observed between the tag value and theresponse of the measuring Hg CEM.
Mercury CEM System Setup, Certification, and Opera-tion. The observations during the system setup and initialcertification period are discussed. Table 4 provides an overviewof the evaluation results from four Hg CEM systems (A1, A2,B1, and B2). It was found that during the FS-1 and FS-2 studies,except for CEM A1, the systems required at least 2 weeks forsetup and performance adjustment before the first day of the 7day calibration error check began. The setup and adjustmentduration did not include the time spent on umbilical lineinstallation and infrastructure construction (e.g., compressed and/or argon gas lines, deionized water supply, power supply, and/or instrument shelter).
Although the A1 system started the inertial certification testafter 5 days of setup and adjustment, a combination of multipleoperational difficulties, including heated umbilical line malfunc-
tion and probe blockage, prevented the A1 system fromparticipating in the test after approximately 2 weeks of operation.The probe blockage was later found because of a reversedconnection of the sampling loop and calibration gas loop at theheated probe tip.
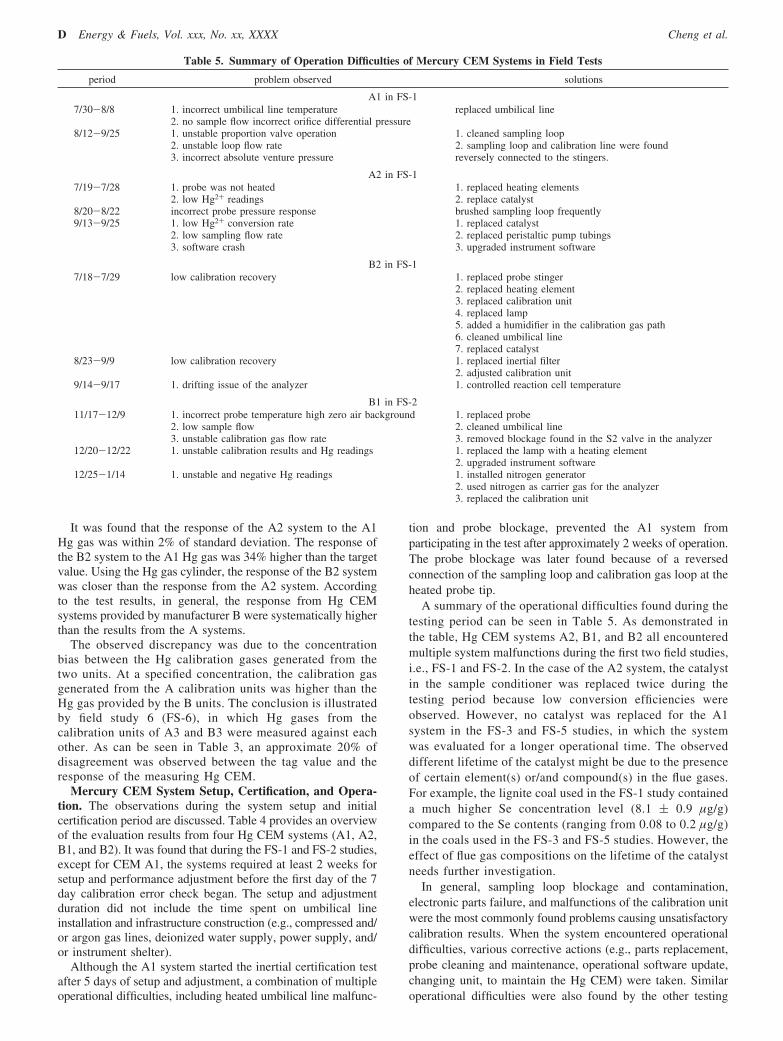
A summary of the operational difficulties found during thetesting period can be seen in Table 5. As demonstrated inthe table, Hg CEM systems A2, B1, and B2 all encounteredmultiple system malfunctions during the first two field studies,i.e., FS-1 and FS-2. In the case of the A2 system, the catalystin the sample conditioner was replaced twice during thetesting period because low conversion efficiencies wereobserved. However, no catalyst was replaced for the A1system in the FS-3 and FS-5 studies, in which the systemwas evaluated for a longer operational time. The observeddifferent lifetime of the catalyst might be due to the presenceof certain element(s) or/and compound(s) in the flue gases.For example, the lignite coal used in the FS-1 study containeda much higher Se concentration level (8.1 ( 0.9 µg/g)compared to the Se contents (ranging from 0.08 to 0.2 µg/g)in the coals used in the FS-3 and FS-5 studies. However, theeffect of flue gas compositions on the lifetime of the catalystneeds further investigation.
In general, sampling loop blockage and contamination,electronic parts failure, and malfunctions of the calibration unitwere the most commonly found problems causing unsatisfactorycalibration results. When the system encountered operationaldifficulties, various corrective actions (e.g., parts replacement,probe cleaning and maintenance, operational software update,changing unit, to maintain the Hg CEM) were taken. Similaroperational difficulties were also found by the other testing
Table 5. Summary of Operation Difficulties of Mercury CEM Systems in Field Tests
period problem observed solutions
A1 in FS-17/30-8/8 1. incorrect umbilical line temperature
2. no sample flow incorrect orifice differential pressurereplaced umbilical line
8/12-9/25 1. unstable proportion valve operation2. unstable loop flow rate3. incorrect absolute venture pressure
1. cleaned sampling loop2. sampling loop and calibration line were foundreversely connected to the stingers.
A2 in FS-17/19-7/28 1. probe was not heated
2. low Hg2+ readings1. replaced heating elements2. replace catalyst
8/20-8/22 incorrect probe pressure response brushed sampling loop frequently9/13-9/25 1. low Hg2+ conversion rate
2. low sampling flow rate3. software crash
1. replaced catalyst2. replaced peristaltic pump tubings3. upgraded instrument software
B2 in FS-17/18-7/29 low calibration recovery 1. replaced probe stinger
2. replaced heating element3. replaced calibration unit4. replaced lamp5. added a humidifier in the calibration gas path6. cleaned umbilical line7. replaced catalyst
8/23-9/9 low calibration recovery 1. replaced inertial filter2. adjusted calibration unit
9/14-9/17 1. drifting issue of the analyzer 1. controlled reaction cell temperature
B1 in FS-211/17-12/9 1. incorrect probe temperature high zero air background
2. low sample flow3. unstable calibration gas flow rate
1. replaced probe2. cleaned umbilical line3. removed blockage found in the S2 valve in the analyzer
12/20-12/22 1. unstable calibration results and Hg readings 1. replaced the lamp with a heating element2. upgraded instrument software
12/25-1/14 1. unstable and negative Hg readings 1. installed nitrogen generator2. used nitrogen as carrier gas for the analyzer3. replaced the calibration unit
D Energy & Fuels, Vol. xxx, No. xx, XXXX Cheng et al.

group. In a 10 month long-term field evaluation conducted byEPA,3 similar operational problems were also reported.
In addition, significant drifting was observed on the B1 systemtested in the FS-2 study (Figure 1), where the average stack Hgconcentration was 0.35 µg/dscm. As shown in Figure 1, thestack Hg readings fluctuate between 1.8 and -1.2 µg/dscmwithin a 10 h period. The drifting and high background noiseproblems were found to be correlated to the variation of lamptemperature and inappropriate carrier gas for the Hg analyzer,which both affected the intensity stability of the Hg lamp. Theproblems were improved by using N2 as the carrier gas andcontrolling the lamp temperature at 35 °C. The monitoringresults after the modification remained relatively constant at alevel of 0.4 µg/dscm (Figure 1), which was very close to theOH method measurement results.
Before the modification, the system used purified compressedair as the carrier gas, which might reduce the sensibility of theanalyzer because of a quenching effect. Using an atomicfluorescence spectroscopy detector for Hg analysis is based onthe measurement of fluorescence emanating from excitedmercury atoms contained in the gas sample. However, fluores-cence can be quenched quickly through the collision of excitedmercury atoms with other components of the sample gas,especially oxygen, which affected the monitoring readings.
After modifications and maintenances in the FS-1 and FS-2studies, the CEM A1 and B1 systems later participated in threeother field studies (FS-3, FS-4, and FS-5). Different from theoperational experiences of the FS-1 and FS-2 studies, bothsystems required much less time (less than 3 days) to setupand perform adjustments before precertification tests began.During approximately 2 months of operation, no downtime wasrequired for system maintenance.
The operational stability of Hg CEM systems A1 and B1 aftermodification are demonstrated by the daily calibration errorcheck results from the FS-3, FS-4, and FS-5 studies (Figure 2).As shown in the figure, both A1 and B1 passed every dailycalibration error check performed in the FS-3 and FS-4 studies.
In the FS-5 study, two problems (i.e., probe blockage and DIwater overflow) occurred during the 68 day operation, whichresulted in eight unsatisfactory daily calibration error checks.
The operational experiences obtained from these studies showthat the Hg systems provided by the two manufacturers werestill in the development stage during the testing period. Manyinstrument parts had not yet been standardized or quality-controlled. The systems required a long time to install andperform adjustments because both manufacturers needed tosearch for suitable setups. The stability study demonstrates thatthe Hg CEM systems were able to run without major mainte-nance for a period of time after the necessary modifications weremade.
Relative Accuracy and Bias Tests. During each field test,two series of relative accuracy (RA) tests were performed onevery evaluated CEM system with the exception of the FS-5and FS-6 studies. Only one series of RA tests was carried outat the middle of the FS-5 study, and no test was performed onthe FS-6 study. For the other four field studies, the first seriesof RA tests was conducted after the initial certification testswere completed. The second series was carried out during thelast week of each field study. Results obtained from the RAtests conducted in the four field tests are summarized in Table6. The bias test results were also calculated and listed in thetable.
As shown in Table 6, the RA results of A2 and B2 were lessthan 20%. In the other field studies, although the RA valueswere greater than 20%, the evaluated Hg CEM systems alsopassed the RA test because the differences between the meanvalues of the CEM measurements and the OH method meanvalues did not exceed 1.0 µg/dscm. According to the criteriaspecified in the procedure, the results were acceptable whenthe average of the Hg concentration measured by the OH methodduring the RA test was less than 5.0 µg/dscm.
By comparing the CEM readings to the OH method results,it was found that the two CEM systems provided by manufac-turer A (i.e., A1 and A2) responded to lower Hg values, exceptfor the readings from the first series of the RA tests in the FS-3study. In the five RA tests carried out at the CEM A1 system,three sets of the results show the system was bias low. In thecase of the Hg CEM systems provided by manufacturer B, thereadings were consistently higher than the results from the OHmethod.
The lower responses observed in the A Hg CEM systemsand higher responses observed in the B Hg CEM systems werelikely due to the bias caused by the Hg calibration gasesprovided by the two systems. As discussed in the previoussection, the A Hg CEM systems were calibrated with a higherconcentration of Hg gas compared to the Hg gas provided bythe B systems with the same tag value. As a result, the A HgCEM systems responded with lower stack Hg monitoring results.
EPA Method 30A (IRM) Evaluation. An Hg CEM systemis required to meet a series of certification and data qualityassurance tests (specified in the EPA Method 30A) when it isused as an instrument reference method for an RA test. Detailedprocedures for performing the tests are described in a draftversion of EPA Method 30A. Two Hg CEM systems, A2 andB2, were used to evaluate how the two Hg CEM systemsrespond to the tests specified in the method. The time requiredto perform the IRM protocol was evaluated.
Table 7 summarizes the results obtained from the Hg0 andHg2+ calibration error check tests. As shown in the table, thetwo evaluated CEM systems passed the two precertification tests.The CEM B2 passed the Hg2+ system calibration error check
(3) U.S. Environmental Protection Agency. Long-term field evaluationof mercury continuous emission monitoring systems: Coal-fired power plantburning eastern bituminous coal and equipped with selective catalyticreduction (SCR), electrostatic precipitator (ESP), and wet scrubber: Fieldactivities from November 2004 to September 2005. Final Report of EPAContract GS-10F-0127J, Office of Air Quality Planning and Standards AirQuality Assessment Division, Research Triangle Park, NC, 2006.
Figure 1. Effect of lamp temperature on the stability of the B1 HgCEM system observed in the FS-2 study.
EValuation of Mercury Emission Monitoring Systems Energy & Fuels, Vol. xxx, No. xx, XXXX E

on the second attempt after the system was recalibrated usingionic Hg gases.
The system response time was determined by measuring thetime required for an evaluated system to respond 95% of thestable value after the calibration gas was changed from a lowlevel to a high level. The results can be seen in Figure 2. Theresponse time for the CEM A2 and B2 was determined to be 5and 4 min, respectively. Also shown in the figure is the timerequired for each Hg CEM system to give a stable response ateach testing concentration level. It was found that the A2 system
responded to the elemental Hg gas approximately 2 times fasterthan to the Hg2+ vapor. In the case of B2, no significantdifference was found.
The dynamic spiking (DS) test was performed on the testedCEM systems after the systems passed both system calibrationerror checks. The spiking Hg gas was delivered into thesampling loop at a flow rate approximately 1/10 of the loop flowrate. Two spiking levels were required. At the high-level spike,the Hg concentration in the spiking ionic Hg vapor wascalculated so that the Hg concentrations in the spiked flue gases
Figure 2. Daily calibration results of Hg CEM systems during operation: (a) B-1 at field study 2, (b) A-1 at field study 3, (c) A-1 at field study 4,and (d) B-1 at field study 5.
Table 6. Results of RA and Bias Tests
field study 1 2 3 4 5
unit A2 B2 B1 A1 B1 A1
series 1 2 1 2 1 2 1 2 1 2 1
Hg CEM SystemOH method available runs 9 9 9 9 10 12 12 11 12 12 12OHaverage
a 11.89 15.24 11.89 17.38 0.12 0.10 1.88 1.93 1.41 1.30 0.70CEMaverage
a 10.65 13.67 11.88 18.29 NA 0.34 2.44 1.64 1.74 1.88 0.49RAb (%) 20.0 18.1 14.1 17.6 NA 311.5 71.1 33.9 38.5 60.5 40.6djc 1.23 1.57 0.01 -0.91 NA -0.25 -0.56 0.29 -0.33 -0.58 0.21|cc|d 1.14 1.18 1.67 2.14 NA 0.06 0.16 0.36 0.15 0.21 0.08conclusion pass pass pass pass NA pass pass pass pass pass passbias teste fail fail pass pass NA pass pass pass pass pass fail
Sorbent Trap MethodSTaverage
f 12.92 17.93 12.92 17.93 NA 0.04 2.20 2.21 1.59 1.35 0.67RA (%) 23.7 16.0 23.7 16.0 NA 143.4 35.1 16.8 38.5 60.55 19.5dj -0.81 -2.69 -0.81 -0.55 NA 0.12 -0.32 0.04 -0.18 -0.05 0.03|cc| 2.06 1.39 2.06 1.39 NA 0.11 0.29 0.34 0.27 0.44 0.10conclusion fail pass failed pass NA pass pass pass pass pass passbias test pass pass NA fail pass pass pass pass passdCEMS
g -2.27 -4.26 -1.04 0.36 NA 0.30 0.16 -0.46 0.15 0.47 -0.18
a Units of µg/dscm. b Relative accuracy ) ([difference arithmetic mean] + [confidence coefficient])/RM arithmetic mean × 100. c Differencearithmetic mean. d Confidence coefficient. e Difference arithmetic mean should be less than the confidence coefficient to pass the bias test. f Average ofHg monitoring results from the sorbent trap method. g CEMSaverage - STaverage.
F Energy & Fuels, Vol. xxx, No. xx, XXXX Cheng et al.

were 1.8-2.0 times higher than the native concentrations.During the low-level spike, the Hg concentration in the fluegas was elevated to a level that was 1.4-1.6 times higher thanthe native concentration.
Figure 3 shows the temporal trends of the responses fromthe A2 and B2 systems during the dynamic spiking tests. As
shown in the figure, the time required for a stable response byeach spike was after about 10 min for A2 and 5-7 min in thecase of B2. Results obtained from the test are summarized inTable 8. In the table, the Css and Cnative values were the averagesof the three readings after the responses of the systems werestable. As shown in the table, the spike recoveries of the A2system ranged from 69 to 76%. In the case of the B2 system,it was approximately 120% at the high span and 104% at thelow span.
Neither test system passed the dynamic spiking test basedon the resulting recoveries, which all exceeded the 5% criterionwith the exception of the low span at the B2 system. It issuspected that the observed low recoveries for the A2 systemwere due to an incorrect dilution factor, which is the ratio ofsampling loop flow rate to the flow rate of the spiking gas. Theloop flow rate was one of the probe operational parameterscalculated on the basis of the temperature and pressure dif-ferential across a venture. Unlike the B2 system, the venture ofthe A2 system was not calibrated before conducting the dynamicspiking experiment. It is necessary to consider the effect of thehumidity on the flow rate while performing venture calibration.
For the B2 system, the higher than target response was likelydue to analyzer drifting. It was found that the B2 system tendedto respond high at a higher concentration level even aftercalibration. Because the oxidized Hg vapor was prepared froma 1.06 × 10⁻⁶ M HgCl2 solution, the moisture content of theHg vapor increased as the spiking concentration increased.
A series of experiments were conducted to evaluate the effectof moisture content in the calibration gas generated by aHovaCal system on the response of the B2 system. The systemwas first calibrated by performing filter zero to correct Hg(T)
Table 7. Summaries of the Results Obtained from 3-pt Hg0 and Hg2+ System Calibration Error Checks
calibration gas levelcertification
concentrationAsystem
responsebabsolute
difference|a - b|calibration error
[|a - b|]/CS × 100 conclusion Tcomplete (min)
3-pt Hg0 System Calibration Error Check
A2low 3.7 4.05 0.35 1.8 pass 5mid 11.09 11.4 0.31 1.6 pass 5high 18.47 18.2 0.27 1.4 pass 5
B2low 4.00 3.67 0.33 1.7 pass 3mid 10.00 9.65 0.35 1.8 pass 3high 18.00 17.6 0.4 2.0 pass 3
3-pt Hg2+ System Calibration Error Check
A2low 3.9 4.18 0.28 1.4 pass 10mid 10.4 10.74 0.34 1.7 pass 10high 15.3 15 0.3 1.5 pass 10
B2low 4.25 4.34 0.09 0.4 pass 4mid 9.6 9.46 0.14 0.7 pass 3high 16.87 17.38 0.51 2.5 pass 3
Figure 3. Temporal responses of Hg CEM systems on the 3-pt Hg0
and Hg2+ error checks.
Table 8. Results Obtained from Dynamic Spiking Tests Performed on A2 and B2
Cnative (mg/m3)
target levelQprobe
(lpm)Qspike
(lpm)actual Cspike value
(µg/dscm)expected Css
(µg/dscm)actual Css
(µg/dscm) pre post averagepercent spike
recoveryya
CEM A2
high49.996 4.90 93.12 18.2 16.71 10.91 10.72 10.82 76.1549.994 4.91 94.12 18.4 16.9 10.72 11.22 10.97 75.8150.001 4.89 91.60 18.5 16.83 11.22 11.42 11.32 73.86
low49.991 4.85 60.79 15.7 14.40 11.02 11.67 11.34 70.5850.01 4.80 60.29 15.8 14.64 11.67 11.47 11.57 72.3350.006 4.90 56.66 15.0 13.66 11.47 10.32 10.90 69.07
CEM B2
high31.22 3.22 113.50 24.4 27.54 13.8 14.6 14.20 126.4731.22 3.22 115.20 25.2 26.80 14.6 15.1 14.85 113.4531.22 3.22 119.29 25.4 28.18 14.5 14.8 14.65 122.25
low31.22 3.80 113.5 26.3 27.54 13.8 14.6 14.20 109.0731.22 3.80 115.20 27.1 26.80 14.6 15.1 14.85 98.1231.22 3.80 119.29 27.4 28.18 14.5 14.8 14.65 105.47
a y has to be within 95-105% to meet spike recovery criteria.
EValuation of Mercury Emission Monitoring Systems Energy & Fuels, Vol. xxx, No. xx, XXXX G

background and filter span to adjust the dilution factor usingits own calibration unit. After calibration, three levels of oxidizedHg vapor were prepared from HgCl2 solutions with 4 HgCl2
concentrations, i.e., 2.12 × 10⁻⁶, 1.06 × 10⁻⁶, 5.03 × 10⁻⁷,and 2.40 × 10⁻⁷ M. The moisture content in the generated Hgvapor ranged from 2.9 to 36.04%. Figure 6shows the studyresults. As can be seen, the response of the test CEM systemincreased as the moisture content in the calibration gas increased.
Substitutes for Hg in Stratification Tests. To test for Hgstratification, we must use the CEM system to measure the Hgconcentration at the 12 or fewer traverse points located asspecified in the EPA Method. However, the current probe designdoes not allow easy movement of the sampling probe 12 timeswithin the required time. Therefore, a stratification test wascarried out in the first field test to investigate the potential ofusing other gas components, e.g., SO2, NOx, O2, and CO2, orCO, as a substitute.
The Hg concentration was measured by a CEM systemprovided by PS Analytical (PSA) (Deerfield Beech, FL). Othergas components (i.e., NOx, O2, CO2, SO2, and CO) weremeasured by an integrated continuous, multi-emission monitor-ing system provided by Teledyne Instruments (San Diego, CA).One 15 ft Apex Instrument Method 5 probe setup was used tocollect flue gas from the stack for both Hg and gas analyses.Flue gas was transported to a wet-chemistry speciation moduleimmediately after being extracted from the stack using a 2 ftinsulated Teflon tube. The speciation modules sit on a four-wheel cart, which travels along with the probe. A 100 m heatedumbilical line (130 °C) was used to transport gas samples tothe analyzer after the speciation module.
Figure 4 shows the correlation between Hg(T) and five othergas components (i.e., SO2, NOx, CO2, O2, and CO) in the stackgas. Each data point represents the averages of the readingscollected from one traverse point. Readings were collected atleast 20 min before the move to the next traverse point. Thecorrelation coefficients are summarized in Table 9. As can beseen, there is no significant correlation between Hg and othergas components. The highest correlation coefficient was foundto be 0.72 for CO2 followed by O2 and SO2 (0.69 and 0.63,respectively). None of the concentrations of the selected fluegas components were found to be well-correlated (with acorrelation coefficient greater than 0.8) with the Hg concentra-tion in flue gas (Figure 5).
Sorbent Trap for Hg Monitoring. Using a sorbent trapmethod as an alternative to the Hg CEMS was also evaluated.Both short (1-2 h) and long (5-16 days) term studies werecarried out. In the short-term study, paired sorbent trap samplingwas simultaneously conducted with the OH method sampling.
Comparisons of Hg monitoring results from short-termsorbent trap sampling to the OH method and CEM system canbe seen in Table 6. Except for the FS-1 study, the sorbent trapmethod passed all of the RA tests. In the 11 RA tests, theaverages of sorbent trap sampling results were all greater thanthe results from the OH method, except the second series fromthe FS-3 study. The average of 12 1-h runs sorbent trap sampling
Figure 4. Temporal responses of Hg CEM systems during dynamicspiking.
Figure 5. Correlation between the concentrations of Hg and other flue gas components.
Figure 6. Effect of moisture content in oxidized mercury vapor on theresponse of the Hg CEM system.
Table 9. Correlation Coefficients of Hg(T) as a Function ofOther Flue Gas Componentsa
SO2 CO2 NOx O2 CO
Hg concentration 0.63 0.72 0.49 0.69 0.42
a Unit of µg/dscm.
H Energy & Fuels, Vol. xxx, No. xx, XXXX Cheng et al.

was 0.04 µg/dscm, which is much less than the OH method(0.1 µg/dscm) and Hg CEM results (0.34 µg/dscm). It was likelydue to a low Hg concentration level in the flue gas. Shortsampling duration resulted in the amount of Hg adsorbed inthe sorbent trap being very close to the analytical detection limit.
The detection limit of the sorbent trap method during the RAtests can be estimated by conducting the method detection limit(MDL) measurement for the RP-M324 (Ohio Lumex, OH)analyzer, which was used for sorbent trap Hg analysis in thetests. MDL is defined as the minimum concentration of asubstance that can be measured and reported with 99%confidence that the Hg concentration is greater than zero and isdetermined from analysis of a sample in a given matrixcontaining Hg.
To calculate MDL, the RP-M324 analyzer measured sevenprespiked sorbent traps, which all had an Hg concentration level5 times higher than the estimated MDL. The estimated MDL,which was 4 ng in the test, was 5 times that of the instrumentnoise. The instrument MDL was then determined by multiplyingthe standard deviation of the seven measurement results by a ttest value, which was 3.141, with a sample size of seven. TheMDL of the analyzer was determined to be 4 ng (Table 10).
For a given 1 h sorbent trap sampling run, approximately0.025 m3 of dry flue gas was collected. As the result, thedetection limit of the sorbent trap method for a 1 h run was 0.2µg/dscm, which was higher than the results obtained from theOH method.
Long-term (5-16 days) sampling was carried out to evaluatethe operational feasibility of using the sorbent trap method.Results from the sorbent trap method were compared to the
averages of the Hg data from Hg CEM systems collected duringthe same sorbent trap sampling period. Detailed samplingduration and results can be seen in Table 11. For a givensampling event, two sorbent traps were installed at the tip ofthe sampling probe. Two types of sampling devices [i.e., regular-and inertial-type probe (modified by ICSET)] were used toinvestigate the effect of moisture and fly ash on samplingoperations.
As shown in Table 11, the results from the sorbent trap wereconsistently about 1 order of magnitude lower than the CEMaverage readings in the FS-2 study. Results from the sorbenttrap method seem to be more reliable compared to the resultsfrom the Hg CEM system. In a 7 day sampling, the sorbenttrap collected approximately 4 dscm of stack gas. More than100 ng of Hg was collected in a sorbent trap after each sampling,which is well above the detection limit of the RP-M234 analyzer.In the case of the Hg CEM B1, after dilution, the Hgconcentration in the sample gas delivered to the analyzer waslower than 20 ng/dscm, which is very close to the backgroundnoise of the instrument (about 4 ng/dscm).
Using a regular probe in FS-3, it was found that the sorbenttrap results were consistently higher than the Hg CEM results.Unlike the FS-2 study, deposition of ash at the sorbent tip wasfound. The deposition caused high vacuum during sampling andinterrupted the sampling several times. To eliminate the potentialash effect, an inertial-type probe was used in the FS-4. Thesorbent trap results were found to be either slightly less (<0.3µg/dscm) or slightly higher (<0.02 µg/dscm) than the Hg CEMresults. No deposition or operation difficulty was found.
A side-by-side comparison of the results from regular- andinertial-type sampling setups was carried out at the FS-5 study.No significant difference was found between the results fromthe sorbent trap and the A1 Hg CEM system, with the exceptionof the first series. One of the two sorbent traps showed a muchhigher value, resulting in a higher relative deviation (>21%).In the other two series, the sorbent trap results were greaterthan the results from the A1 Hg CEM system (<0.32 µg/dscm).No ash deposition was found in any of the traps after a week-long sampling.
The relative deviation (RD, %) was calculated by dividingthe absolute value of the difference between the results from
Table 10. MDL of RP-M324 Hg Analyzer
run number IR (ng)
1 18.02 19.03 21.04 19.05 19.06 18.07 20.4standard deviation, S 1.12MDL ) 3.143S 3.5
MDL ) t(n - 1, 1 - R ) 0.99) (S)
Table 11. Comparison of Long-Term Hg Monitoring Results from the Sorbent Trap Method and Hg CEM Systems
field study 2a,b 3a,b 4a,c
Hg CEM unit B1 A1 B1
series 1 2 3 1 2 3 4 5 1 2 3
sampling duration (days) 6 6 7 7 7 8 10 7 7 11 16sorbent trap 0.02 0.03 0.03 2.73 2.43 2.84 3.66 2.83 1.71 1.69 2.07RDd (%) 3.5 (pass) 0.3 (pass) 5.0 (pass) 1.2 (pass) 5.0 (pass) 1.1 (pass) 5.8 (pass) 12 (pass) 6.6 (pass) 11.9 (pass) 35.9 (passe)spike recovery6 (%) 48.4 (fail) 4.0 (fail) 19.2 (fail) 93.7 (pass) 93 (pass) 86.8 (pass) 93.7 (pass) 84.8 (fail) NAf NAf NAf
CEMS datag 0.79 0.18 0.46 1.95 1.95 1.57 1.98 1.59 1.93 1.99 2.05dCEMS
h 0.77 0.15 0.43 -0.78 -0.48 -1.27 -1.68 -1.24 0.22 0.3 -0.02
field study 5a-c
Hg CEM unit A1
series 1 2 3
sampling duration (days) 7 7 7CEMS datae 0.23 0.25 0.37sampling device regular inertial probe regular inertial probe regular inertial probesorbent trap 0.28 (passe) 1.85 (pass) 0.53 (pass) 0.67 (pass) 0.51 (pass) 0.65 (pass)RDd (%) 21.6 10 0.1 1.7 12.1spike recovery (%) 86.8 (pass) 87.3 (pass) 98.7 (pass) 97.9 (pass) 96.0 (pass) 100.5 (pass)dCEMS
f -0.05 -1.52 -0.28 -0.32 -0.18 -0.28
a Unit of µg/dscm. b Regular sorbent trap probe was used for sampling. c Ash-free inertial probe was used. d RD (%) ) [(|Ctrap 1 - Ctrap 2|)/(Ctrap 1 +Ctrap 2)] × 100%. e The difference between the results from OH and sorbent trap methods was less than 1.0 µg/dscm. 6 Spike recovery ) [Cmeasured/Cspiked] × 100%. f A spike test was not performed. g Averages of monitoring results during sorbent trap sampling. h CEMSaverage - STaverage.
EValuation of Mercury Emission Monitoring Systems Energy & Fuels, Vol. xxx, No. xx, XXXX I

the two traps by the sum of the results from the two traps. Onthe basis of the criteria, the RD should be less than 10% tovalidate the sampling results. As can be seen in Table 10, in atotal of 14 sampling runs, 5 did not pass the criteria. Anotherdata QA/QC parameter specified in the Appendix K proceduresis spike recovery. For field sample analyses, the recovery isrequired to be within 25% of the spiked concentration. It wasfound that the recovery was far below the satisfactory criteriawith the exception of the FS-4 study. No spike test wasperformed.
Conclusions
Results from a series of calibration gas comparison testsshowed that, with the same tag values, the elemental Hg gasesprovided by the calibration units of the Hg CEM systems frommanufacturer A were approximately 20% higher than theelemental Hg gases from the calibration units of manufacturerB. The discrepancy of calibration gases resulted in the disagree-ments observed between the Hg monitoring results from theHg CEM systems of the two leading manufacturers when bothmeasured the same Hg source.
The observations from the FS-1 and FS-2 studies indicatethat the evaluated Hg systems provided by the two manufactur-ers were still in the development stage during the testing period.Many parts had not yet been standardized or well-quality-controlled, which resulted in many part replacements and systemmodifications. After replacing broken parts and performingneeded services, the Hg CEM systems provided by the twomanufacturers were able to be operated without serious main-tenance (FS-3, FS-4, and FS-5).
The most challenging procedure in certifying an Hg CEMsystem was conducting a system integrity check. During thefive field studies, a HovaCal system was used to provideoxidized Hg vapors. The oxidized Hg gas setup was notavailable for the tested Hg CEM systems provided by the twomanufacturers. Because the HovaCal system was not integratedinto the testing systems, extra cautions were taken whileperforming the test. For example, the whole oxidized Hg vaporline was kept above 180 °C to prevent the formation of “coldspots”. Glass-coated connection unions were used for gas lineconnections. The concentrations of the HgCl2 solutions usedfor producing oxidized Hg vapors were verified by cold vaporatomic adsorption spectroscopy before use. The delivering Hgconcentrations were corrected for temperature before beingcompared to the CEM responses.
In summary, the Hg CEM system from manufacturer Aneeded more attention and supplies to carry out the monitoringtask (e.g., supplies of ultra high purity argon and DI water,peristaltic pump tubings, cleaning and replacement of gold traps,and frequent lamp voltage adjustments). In the case of the HgCEM system of manufacturer B, the analyzer encountered anoticeable drifting problem. It also had a less stable calibrationunit and user-friendly interface to operate the system.
When using a Hg CEM system as an instrumental referencemethod for a RA test, dynamic spiking was the most crucialand difficult step to certify the system. Factors such as dilution
factor measurement, variation of native concentration, loop flowmeasurement, and stability of the instrument can greatly affectthe recovery of the dynamic spiking.
The criteria of passing the IRM depend upon the selectionof the calibration span, which depends upon the stack gas Hgconcentration (i.e., the native concentration). The higher thecalibration span, the larger the error allowed. In the case of theFS-1 study, concentrations up to 40 µg/N m3 can be selectedas the calibration span, which allows 0.8 and 2 µg/dscm of errorfor the 3-pt system Hg0 calibration error and 3-pt system Hg2+
calibration error checks, respectively. For utilities in the otherfour field studies, which all had native concentrations less than5 µg/N m3, the differences between the reference and measuredvalues were be less than 0.2 or 0.5 µg/N m3 for the 3-pt systemHg0 calibration error and 3-pt system Hg2+ calibration errorchecks, respectively.
Using SO2, CO, CO2, or NOx as the substitute for in the Hgstratification test was not feasible. There was no strongcorrelation between the concentrations of Hg and the other fourselected gas components in the duct.
Results from sorbent trap studies showed promise for usingthis technique as an alternative to the Hg CEM for coalcombustion utilities. However, deposition of ash at the tip ofthe sorbent traps was found in the FS-3 study, which interferedwith the sampling operation and possibly resulted in the biasresults. Further systematic investigation is desired to furtherexplore the feasibility of using this sorbent trap method withrespect to different sample digestion and analytical methods,sampling devices, long-term operations, and comparison of long-term monitoring results with Hg CEM.
Acknowledgment. This report was prepared by Chin-Min Chengand ICSET of Western Kentucky University with support, in part,by grants made possible by the Illinois Department of Commerceand Economic Opportunity through the Office of Coal Developmentand the Illinois Clean Coal Institute. Neither Chin-Min Chen andICSET of Western Kentucky University, nor any of its subcontrac-tors, nor the Illinois Department of Commerce and EconomicsOpportunity, Office of Coal Development, the Illinois Clen CoalInstitute, nor any person acting on behalf of either (A) makes anywarranty of representation, express or implied, with respect to theaccuracy, completeness, or usefulness of the information containedin this report, or that the use of any information, apparatus, methods,or process desclosed in this report may not infringe privately ownedrights; or (B) assumes any liabilities with respect to the use of, orfor damages resulting from the use of, any information, apparatus,method or process disclosed in this report. Reference herein to anyspecific commercial product, process, or service by trade name,trademark, manufacturer, or otherwise does not nesessarily con-stitute or imply its endorsement, recommendation, or favoring; nordo the views and opinions of authors expressed herein necessarilystate or reflect those of the Illinois Department of Commerce andEconomic Opportunity, Office of Coal Development, or the IllonoisClean Coal Institute. The authors acknowledge valued assistancefrom Mr. Martin Cohron during the field studies. The authors thankSpectrum Gases for providing Hg calibration gas cylinders.
EF7006744
J Energy & Fuels, Vol. xxx, No. xx, XXXX Cheng et al.