experiences in testing lubricants used in wind gearboxes...
TRANSCRIPT

© Herguth Laboratories, Inc. Oct. 2009 Slide, 1
Experiences in Testing Lubricants Used in Wind Gearboxes
NREL 2009
© Herguth Laboratories, Inc. Oct. 2009 Slide, 2
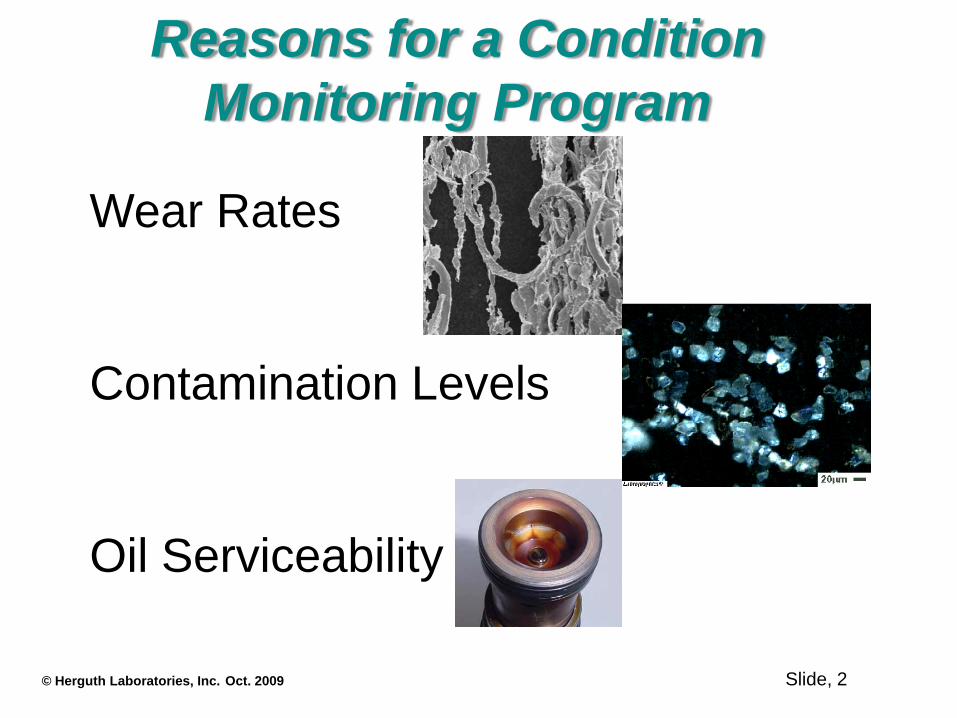
Reasons for a Condition Monitoring Program
Wear Rates
Contamination Levels
Oil Serviceability

© Herguth Laboratories, Inc. Oct. 2009 Slide, 3
KEY Considerations 1. Proper Gearbox Make and Model
2. Accurate Oil Type & Service Time
3. Appropriate Test Methods & Alarm Limits
4. Reasonable Corrective Action

© Herguth Laboratories, Inc. Oct. 2009 Slide, 4
Gearbox Make & Model – Oil Type… What’s the Big Deal?
Oil Life, Wear Rates, Contamination Levels are influenced by:
• System and Oil Stress• Oil Volume• Oil Cleanliness• System Design• Filtration System• Sample Points

© Herguth Laboratories, Inc. Oct. 2009 Slide, 5
So Much More Data Should be AvailableIn the Normal Program
Single Gearbox Data &Trend
Overall Farm Gearbox Data &Trends
Account (all Farms) Gearbox Trends
Industry Wide Gearbox Data &Trends

© Herguth Laboratories, Inc. Oct. 2009 Slide, 6
Setting AlarmsMinimum or Maximum (Both?)
Absolute ValuesPercent Change
2x or 3x Standard DeviationPlus Average
Consider Population SizeRemove Flyers?

© Herguth Laboratories, Inc. Oct. 2009 Slide, 7
Atomic Emission Spectroscopy

© Herguth Laboratories, Inc. Oct. 2009 Slide, 8
FACTS ABOUT EMISSION SPECTROSCOPY
o 15µ Wear particles are considered severeo Up to about ~8µ quantitativeo > Than ~8µ becomes semi-quantitativeEstimations ….Number and size % Recovery100 ppm of 8µ particles ~100%100 ppm of 25µ particles ~ 75%100 ppm of 50µ particles ~25%100 ppm of 100µ particles ~10%

© Herguth Laboratories, Inc. Oct. 2009 Slide, 9
Limitations of Methods
Acid Digestion Applies to ALL Metals of a Given Size
Direct Reading Ferrography ONLY Measures Iron (fibers cause errors)
Particle Quantifier ONLY Measures Iron(reliable)

© Herguth Laboratories, Inc. Oct. 2009 Slide, 10
Understand The Relevance of The Data
100 ppm FeSmall Wear Debris
100 ppm FeLarge Severe Wear
© Herguth Laboratories, Inc. Oct. 2009 Slide, 11
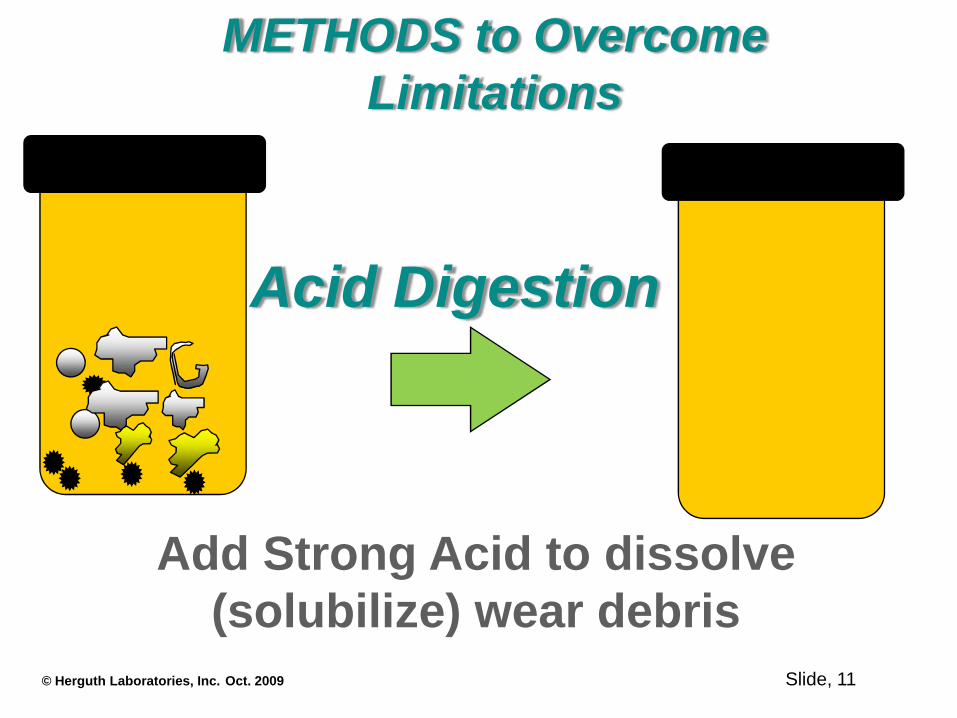
Add Strong Acid to dissolve (solubilize) wear debris
METHODS to Overcome Limitations
Acid Digestion

© Herguth Laboratories, Inc. Oct. 2009 Slide, 12
Wear Particle Concentration Techniques
Direct Reading Ferrogram Particle Quantifier

© Herguth Laboratories, Inc. Oct. 2009 Slide, 13
Wear Particle AnalysisWEAR RATES AND MECHANISMS

© Herguth Laboratories, Inc. Oct. 2009 Slide, 14
WEAR PARTICLE ANALYSIS

© Herguth Laboratories, Inc. Oct. 2009 Slide, 15
CHANGE
LUBRICANT LIFE
SLUDGE
VISCOSITY
ACIDITY
ANTIOXIDANTS RELATIONSHIP OF PROPERTIESEND OF LIFE

© Herguth Laboratories, Inc. Oct. 2009 Slide, 16
% Additives vs. Viscosity @ 40 C cSt D-445
R&O Mineral Oil
0.010.020.030.040.050.060.070.080.090.0
100.0
0 36 72 108 138
Days Aged in TOST D-943
Perc
ent o
f New
Oil
Add
itive
3070110150190230270310350390430470510 Viscosity @
40 C cSt
48.27 cSt
% Electrooxidizable Additives
Viscosity @ 40 C
New Oil Vis. = 46.70
© Herguth Laboratories, Inc. Oct. 2009 Slide, 17
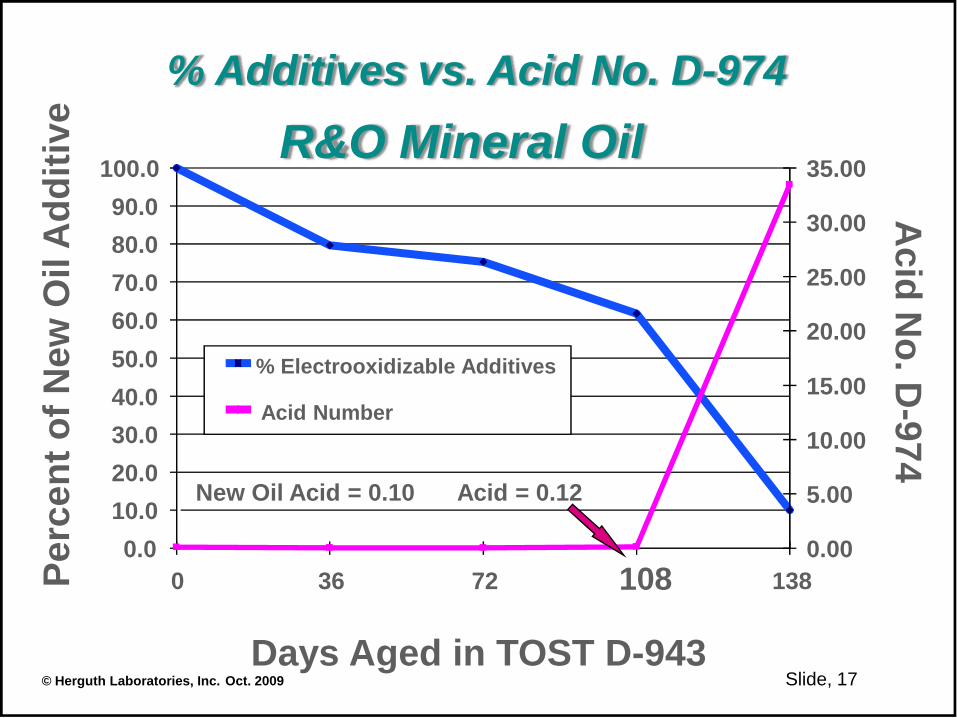
% Additives vs. Acid No. D-974R&O Mineral Oil
0.010.020.030.040.050.060.070.080.090.0
100.0
0 36 72 108 138
Days Aged in TOST D-943
Perc
ent o
f New
Oil
Add
itive
0.00
5.00
10.00
15.00
20.00
25.00
30.00
35.00
Acid N
o. D-974
% Electrooxidizable Additives
Acid Number
New Oil Acid = 0.10 Acid = 0.12

© Herguth Laboratories, Inc. Oct. 2009 Slide, 18
RULEROxidation Inhibitors
Cur
rent
mill
i-am
ps
Voltage increases with time
Compound “A”
ZDDPC(CH3)3
OH(CH3)3 C
CH3
BHT
Compound “B”
Solution Blank
Compound “C”
NH
Phenyl -a -naphthylamine

© Herguth Laboratories, Inc. Oct. 2009 Slide, 19
RULEROxidation Inhibitors

© Herguth Laboratories, Inc. Oct. 2009 Slide, 20
Particle Counting, Particle Characterization and Failure Analysis
Scanning Electron Microscopy (SEM)Utilizing Automated Electron Beam and
Automated Feature Analysis (AFA) Software

© Herguth Laboratories, Inc. Oct. 2009 Slide, 21
First Serious Look at Particles in Oil.Circa 1995
National Institute of Standards and Technology
Determined: Particles counted using the new automatic particle counters were slightly different than what was being counted by SEM
Differences in ISO Code
>2 um was really >4 um>5 um was really >6 um
>15 um was really >14 um

© Herguth Laboratories, Inc. Oct. 2009 Slide, 22
ISO CLEANLINESS CODES

© Herguth Laboratories, Inc. Oct. 2009 Slide, 23
Need for Innovation in Particle Counting & Characterization
What are these particles?Precisely what size are they? This is 52100 Steel
DMAX = 6.25 microns in Size

© Herguth Laboratories, Inc. Oct. 2009 Slide, 24
Size Group SEM/AFA %DMAX
AutomaticParticleCount
<4 um 6.5 No Data4 – 6 um 11.0 88.06 – 10 um 21.4 10.310 – 14 um 13.1 0.914 – 25 um 28.6 0.0325 – 50 um 18.9 0.02
50 – 100 um 40.0 0.003>100 um 0.0 0.0
Reasons to Rethink Conventional Particle Counting

© Herguth Laboratories, Inc. Oct. 2009 Slide, 25
Particle Detection Efficiency Greater than 99%Particle Sizing Precision 0.25 microns or betterParticle Sizing Accuracy 0.50 microns or betterOccurrence of False Positives Less than 1 per mm2
Particles Sized per Hour Up to 33,000Particles Characterized per Hour Up to 1,800
Performance Characteristics

© Herguth Laboratories, Inc. Oct. 2009 Slide, 26
Name Unit Description
Dave µmThe average length of the sixteen chords through the feature centroid
Dmax µmThe length of the longest of the sixteen chords through the feature centroid (Image #1)
Dmin µmThe length of the shortest of the sixteen chords through the feature centroid (Image #2)
Dperp µmThe length of the chord perpendicular to the longest chord (Image #3)
ASPECT RATIO 1 The ratio of DMAX/DPERP AREA µm2 The area of the feature
PERIMETER µmThe perimeter of the feature as measured from one chord end to the next (Image #4)
ORIENTATION DegreesThe orientation of the longest chord. Zero is at and the angle increases clockwise
DaveThe average length of the sixteen chords through the feature centroid
© Herguth Laboratories, Inc. Oct. 2009 Slide, 27
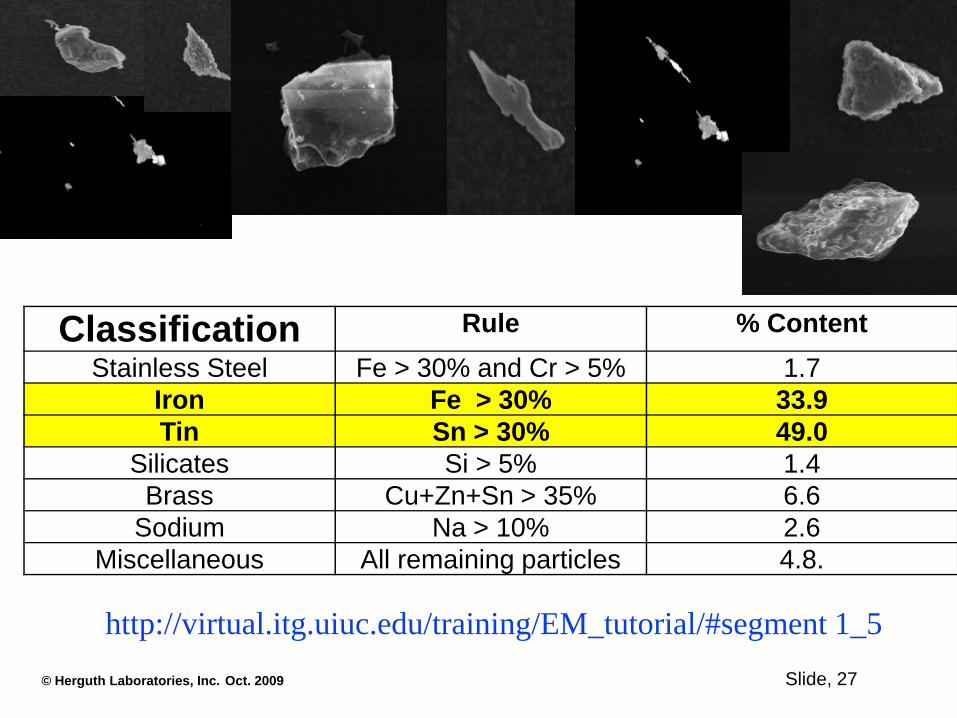
http://virtual.itg.uiuc.edu/training/EM_tutorial/#segment 1_5
Classification Rule % ContentStainless Steel Fe > 30% and Cr > 5% 1.7
Iron Fe > 30% 33.9Tin Sn > 30% 49.0
Silicates Si > 5% 1.4Brass Cu+Zn+Sn > 35% 6.6
Sodium Na > 10% 2.6Miscellaneous All remaining particles 4.8.

© Herguth Laboratories, Inc. Oct. 2009 Slide, 28
Class Total <4um 4-6um 6-10um 10-14um 14-25um 25-50um 50-100um
>100um
SS 97 7 8 21 11 32 18 0 0Fe 1902 121 198 484 282 517 295 5 0Sn 2752 212 374 619 360 677 501 9 0Silicates 81 0 0 4 6 34 33 4 0Brass 369 23 33 59 52 131 69 2 0Na 148 0 2 7 9 77 53 0 0Misc 269 4 1 10 18 140 95 1 0Total 5618 367 616 1204 738 1608 1064 21 0

© Herguth Laboratories, Inc. Oct. 2009 Slide, 29
Thank You!Questions Comments?