experiences with subsurface flow …courses.washington.edu/onsite/assignment 5 wetland paper.pdf ·...
TRANSCRIPT

EXPERIENCES WITH SUBSURFACE FLOW WETLANDS IN WISCONSIN A CASE STUDY
by
David A. Flowers, P.E., BCEE Natural Water Solutions, LLC
PO Box 65 Cedarburg, WI 53012-0065
ABSTRACT What started as a one time public education project in 1995 grew to building and operating several subsurface flow wetlands treating domestic wastewater in Wisconsin for: single residences, multiple (clustered) residences, and for commercial/ institutional concerns. This paper shares experiences gathered during five plus years of operating six wetland systems in central and southeastern Wisconsin. Three of these case studies are included herein. Public education inspired building the first subsurface flow wetland at a nature center that averages three (3) busloads of school children per day and with seasonal peak usage as well. The children have an extensive curriculum of activities, some feature:
• Sustainable development • The value of wetlands in cleaning water, and • The water cycle (counteracting the out-of-sight, out-of-mind situation after flushing the
toilet) Subsurface flow wetlands show excellent removal qualities for nitrogen when compared to other passive treatment technologies. Five case studies are included in the paper, encompassing six wetland complexes. All include: varying methods of wastewater collection from small diameter to large diameter collectors, septic tanks from clustered to individual residential, and lined subsurface flow wetland cells followed by dispersal wetland cells (unlined). All five of these wetland systems were built under a State of Wisconsin, Department of Commerce (COMM 83) statute that allows experimentation with on-site systems. One requirement is quarterly testing of wastewater characteristics by a certified laboratory. These and other results are displayed in the paper.
A number of challenges were overcome, including freezing of some components during harsh winter months. These experiences will be shared. KEYWORDS Subsurface flow wetlands, Wisconsin, case studies, cold weather
INTRODUCTION In 1995 I was inspired to do a pro bono public education project featuring the need to clean our wastewater before placing it back into the environment. While trying to convince my
4625
WEFTEC®.06
Copyright 2006 Water Environment Foundation. All Rights Reserved©

neighboring communities to purchase a site for a future regional wastewater treatment plant, I noticed that the children placed in front of me (by numerous angry parents) were actually quite interested in how our treatment plants were returning very clean water to the Milwaukee River watershed. I realized that I needed to find a way to give children visibility to the water cycle in an engaging way. I approached a local nature center- the Riveredge Nature Center (RNC) and offered the concept of integrating a subsurface flow wetland into the teaching curriculum. By 1998 the State of Wisconsin Department of Commerce (DECOMM) and the RNC board had signed off, numerous donors (Wisconsin Section CSWEA included) offered the funds for construction, and volunteers had completely built the system. We are now in our 7th year of operation and the resulting impact on the children (and parents) has been inspiring. This paper will include case history material that is part of the DECOMM annual submittals, along with narrative comments. Private homeowners have remained anonymous in this paper. The RNC was going to be a one time project, but after successful operation, homeowners, communities, and institutions requested to have wetland systems. All told there are 6 wetland complexes in operation-owned by five (5) entities. Several of these case histories include:
• Riveredge Nature Center, Ozaukee County, Newburg, WI • Town of Oakfield, Fond du Lac County, Oakfield, WI • Private Corporation (two homes), Ozaukee County, Port Washington, WI
RIVEREDGE NATURE CENTER, TOWN OF NEWBURG, OZAUKEE COUNTY Purpose The RNC board of directors was presented, and approved the following “mission” for the wetland project: “Riveredge Nature Center, Inc. (RNC) proposes to develop a wetland wastewater treatment facility (WWTF) as a demonstration of the importance of wetlands in rendering clean water and as an alternate and environmentally compatible method of wastewater treatment for select projects. Although RNC is currently serviced by an excellent new (’91) septic field it is the desire of RNC to develop a WWTF as a fully functional teaching tool with the septic filter bed as a standby system. This would complement a geothermal heating system which demonstrates another aspect of an environmentally compatible, alternate technology.”
The original septic drain fields have not been used since the wetland was valved on-line in the fall of 1998.
Figure 1, Riveredge Nature Center, Newburg, WI
4626
WEFTEC®.06
Copyright 2006 Water Environment Foundation. All Rights Reserved©

Background The Riveredge Nature Center was the first subsurface flow wetland project and started under a “special” DECOMM program with the University of Wisconsin. Wastewater originates from several bathrooms, two kitchens, and classroom sinks. The collector sewer flows to three septic tanks in series for preliminary/primary treatment, then to a pump chamber. Septic tank effluent is pumped in doses to two lined (30 mil PVC) wetland cells in series (see figure 2, RNC Schematic).
Each wetland is 1 foot deep in pea-gravel covered by several inches of organic topsoil. Level structures allow adjustment of the water within the peagravel. Two subsurface flow wetlands are in series (see figure 3) with the dispersal componenta being a #1 stone trench following a ground contour upgradient of a natural sedge meadow (wetland) a Where treated water is returned to the soil layer for further polishing and groundwater recharge
Figure 2, RNC Schematic
Figure 3, RNC Lined Wetland Cells in series wo/topsoil
4627
WEFTEC®.06
Copyright 2006 Water Environment Foundation. All Rights Reserved©

Design Criteria The following is a summary of design criteria for RNC: Criteria Description Units Average visits/day 150 Gallons per day (gpd) 1,995 Gallons per person (capita) per day (gal/cap/d)
13.3b
Peak visits/dayc 3,000 Gallons per day (gpd) 9,300 Gallons per visit per day 3.1 Wetland Cells: # of Units 2 in series Width (ft) 38 Length (ft) 55 Area total (ft2) 4,180 Depth (ft) 1 Volume total (ft3) 4,180 Media pea gravel Percent voids 30 Septic Tanks 3 in series Size (gal) 1,200 Sampling Sampling methods conformed to the Water Environment Federation’s Manuals of Practice SM-1 and Standard Methods for The Examination of Water and Wastewater, current additions. Composite samples were obtained from the influent (No. 1) and effluent (No. 3) while a grab sample was obtained from the intermediate manhole (No. 2). RNC took samples once per quarter. Samples were analyzed by two certified laboratories: The City of Port Washington's Wastewater Plant laboratory and the Milwaukee Metropolitan Sewerage District Laboratory. Sample Points No. 1: Raw Influent (from the pump discharge after the septic tanks) No. 2: Wetland Cell No. 1 Effluent (intermediate manhole)
b Measured July, 1996 with timer and pump curve. c During Peak events at Riveredge, toilet facilities in a barn and porta-johns handle 30 - 35% of the visitors and (gal/cap/d) drops to less than a third of normal. Peaks are one day events with only two per year, one in June, and the other in October.
4628
WEFTEC®.06
Copyright 2006 Water Environment Foundation. All Rights Reserved©

No. 3: Wetland Cell No. 2 (Final) Effluent Analysis Influent Flow (estimate from pump timer)
PH & Temperature (deg C) CBOD5 TSS Total Organic Carbon (TOC) Orthophosphate- P Total Phosphorus- P Fecal Coliform Total Kjeldahl Nitrogen (TKN) Ammonia–N Nitrate–N Results See following pages (3) Special Test Results: Spring 2004 The Department of Commerce made a special request to obtain at least three samples of the final effluent (sample point No. 3) and have them analyzed for fecal coliform (cfu/100 ml) during the wet season. The spring of 2004 was especially wet in the area; in fact all of southeastern Wisconsin received unusually wet weather. The sampling objective was to assure the effluent would be at or below 200 CFU/100 ml. This would demonstrate that the effluent is no longer considered sewage as defined in Wisconsin State Statute Comm. 81.01 (216). Results were as follows: Date Fecal Coliform (CFU/100ml) 4/6/04 <20 4/12/04 <20 4/20/04 108 4/27/04 68 5/4/04 38 5/11/04 62
4629
WEFTEC®.06
Copyright 2006 Water Environment Foundation. All Rights Reserved©
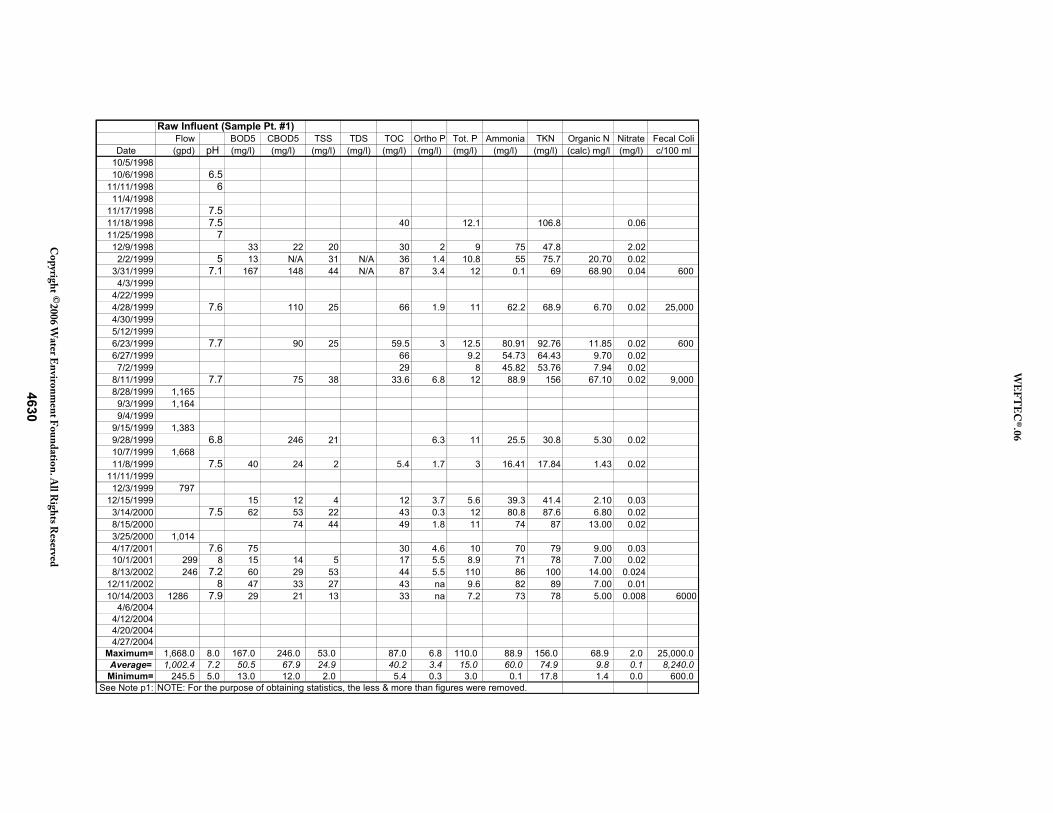
Raw Influent (Sample Pt. #1)Flow BOD5 CBOD5 TSS TDS TOC Ortho P Tot. P Ammonia TKN Organic N Nitrate Fecal Coli
Date (gpd) pH (mg/l) (mg/l) (mg/l) (mg/l) (mg/l) (mg/l) (mg/l) (mg/l) (mg/l) (calc) mg/l (mg/l) c/100 ml10/5/199810/6/1998 6.5
11/11/1998 611/4/1998
11/17/1998 7.511/18/1998 7.5 40 12.1 106.8 0.0611/25/1998 7
12/9/1998 33 22 20 30 2 9 75 47.8 2.022/2/1999 5 13 N/A 31 N/A 36 1.4 10.8 55 75.7 20.70 0.02
3/31/1999 7.1 167 148 44 N/A 87 3.4 12 0.1 69 68.90 0.04 600 4/3/1999
4/22/19994/28/1999 7.6 110 25 66 1.9 11 62.2 68.9 6.70 0.02 25,000 4/30/19995/12/19996/23/1999 7.7 90 25 59.5 3 12.5 80.91 92.76 11.85 0.02 600 6/27/1999 66 9.2 54.73 64.43 9.70 0.02
7/2/1999 29 8 45.82 53.76 7.94 0.028/11/1999 7.7 75 38 33.6 6.8 12 88.9 156 67.10 0.02 9,000 8/28/1999 1,165
9/3/1999 1,164 9/4/1999
9/15/1999 1,383 9/28/1999 6.8 246 21 6.3 11 25.5 30.8 5.30 0.0210/7/1999 1,668 11/8/1999 7.5 40 24 2 5.4 1.7 3 16.41 17.84 1.43 0.02
11/11/199912/3/1999 797
12/15/1999 15 12 4 12 3.7 5.6 39.3 41.4 2.10 0.033/14/2000 7.5 62 53 22 43 0.3 12 80.8 87.6 6.80 0.028/15/2000 74 44 49 1.8 11 74 87 13.00 0.023/25/2000 1,014 4/17/2001 7.6 75 30 4.6 10 70 79 9.00 0.0310/1/2001 299 8 15 14 5 17 5.5 8.9 71 78 7.00 0.028/13/2002 246 7.2 60 29 53 44 5.5 110 86 100 14.00 0.024
12/11/2002 8 47 33 27 43 na 9.6 82 89 7.00 0.0110/14/2003 1286 7.9 29 21 13 33 na 7.2 73 78 5.00 0.008 6000
4/6/20044/12/20044/20/20044/27/2004
Maximum= 1,668.0 8.0 167.0 246.0 53.0 87.0 6.8 110.0 88.9 156.0 68.9 2.0 25,000.0 Average= 1,002.4 7.2 50.5 67.9 24.9 40.2 3.4 15.0 60.0 74.9 9.8 0.1 8,240.0 Minimum= 245.5 5.0 13.0 12.0 2.0 5.4 0.3 3.0 0.1 17.8 1.4 0.0 600.0
See Note p1: NOTE: For the purpose of obtaining statistics, the less & more than figures were removed.
4630
WEFT
EC®.06
Copyright 2006 W
ater Environment Foundation. A
ll Rights R
eserved©

Intermediate Manhole (Sample Pt. #2)DO Turb. ORP Temp. Alk. BOD5 CBOD5 TSS TDS TOC Ortho P Tot. P Ammonia TKN Organic N Nitrate Fecal Coli
Date pH (mg/l) (NTU) mV (°C) (mg/l) (mg/l) (mg/l) (mg/l) (mg/l) (mg/l) (mg/l) (mg/l) (mg/l) (mg/l) (calc) mg/l (mg/l) c/100 ml10/5/1998 6 11 0.2 1.310/6/1998
11/11/199811/4/1998 15 13 0.02 0.09 90
11/17/199811/18/199811/25/1998
12/9/1998 4 4 8 20 0.04 0.64 0.1 19.9 19.80 0.16 72/2/1999 N/A 6 6 16 0.02 1.1 0.05 34.7 34.65 6.45 120
3/31/1999 7.1 0.30 N/A 5.0 17 13 10 23 1.9 7.3 0.1 49 48.90 2.7 1204/3/1999 0.25 8.8 8.0
4/22/1999 7.1 2.52 N/A 26.00 7.0 4/28/1999 7.2 24 14 32 1.7 8.4 24.6 28.5 3.90 0.024/30/1999 7.2 3.30 n/a -174.00 9.0 5/12/1999 6.8 2.15 0.00 19.0 06/23/1999 7.2 40 74 37.8 0.17 4.1 9.53 14.67 5.14 0.02 146/27/1999 29 5.3 25.55 31.14 5.59 0.02
7/2/1999 35 5 14.71 20.24 5.53 0.028/11/1999 6.8 24 61 25.6 0.24 5 19.4 31 11.60 0.028/28/1999 6.9 10.2 -60.00 17.3 10
9/3/1999 2.11 16.0 9/4/1999 0.61 16.0
9/15/19999/28/1999 7 71 5.3 46 2.7 6.8 9.77 13.8 4.03 0.02 12010/7/1999 1.45 9.0 11/8/1999 6.8 12 12 5 4.7 0.4 0.24 11.07 12.8 1.73 0.03 140
11/11/1999 6.9 2.29 6.3 136.00 8.0 420 10 na12/3/1999
12/15/1999 8 5.5 4 9.5 1 3 33.7 35.8 2.10 0.64 4303/14/2000 7 10 6 15 13 1.2 3.6 31.6 34 2.40 0.07 4808/15/2000 6.8 12 37 20 1.6 10 50 55 5.00 0.02 203/25/20004/17/2001 7.3 6 16 5 5.4 53 56 3.00 0.26 6710/1/2001 6.9 6 6 5 18 3.9 5.2 25 30 5.00 0.02 208/13/2002 7.2 71 10 9 55 0.04 130 19 25 6.00 4.2 44
12/11/2002 7.3 12 3 na 15 na 7 61 65 4.00 0.075 60010/14/2003 7 10 6 3.3 12 na 2.6 36 37 1.00 0.36
4/6/20044/12/20044/20/20044/27/2004
Maximum= 7.3 3.3 10.2 136.0 19.0 420.0 71.0 71.0 74.0 55.0 5.0 130.0 61.0 65.0 48.9 6.5 600.0 Average= 7.0 1.7 8.4 (14.4) 11.4 420.0 14.8 16.0 17.8 23.8 1.3 11.7 20.3 33.0 6.8 0.8 162.3 Minimum= 6.8 0.3 6.3 (174.0) 5.0 420.0 4.0 3.0 3.3 4.7 0.0 0.2 0.1 12.8 - - 7.0
See Note p1:
4631
WEFT
EC®.06
Copyright 2006 W
ater Environment Foundation. A
ll Rights R
eserved©

Final Effluent (Sample Pt. #3)DO Turb. ORP Temp. BOD5 CBOD5 TSS TDS TOC Ortho P Tot. P Ammonia TKN Organic N Nitrate Fecal Coli
Date pH (mg/l) (NTU) mV (°C) (mg/l) (mg/l) (mg/l) (mg/l) (mg/l) (mg/l) (mg/l) (mg/l) (mg/l) (calc) mg/l (mg/l) c/100 ml10/5/1998 2 4 0.2 0.0910/6/1998 7
11/11/1998 6.611/4/1998 2 2 0.07 0.09 37
11/17/1998 711/18/1998 6.8 34 0.33 6.3 0.0211/25/1998 6.5
12/9/1998 2 3 5 30 0.06 0.26 0.05 5.95 5.90 0.02 102/2/1999 6 6 N/A 6 N/A 26 0.27 0.64 0.05 27.9 27.85 2.54 72
3/31/1999 6.9 0.45 N/A 5.0 4 4 3 N/A 24 0.3 1 0.1 33.9 33.80 1.8 264/3/1999 0.23 6.1 8.0
4/22/1999 7.1 3.31 N/A 121 8.0 4/28/1999 7.3 6 20 19 2.4 5.5 16.2 19.7 3.50 0.02 424/30/1999 6.8 1.84 n/a -100 10.0 5/12/1999 6.9 1.17 -48 18.0 06/23/1999 7.5 4 36 30.9 0.02 1.7 4.24 8.88 4.64 0.02 266/27/1999 37 1.8 5.68 10.08 4.40 0.02
7/2/1999 32 1.7 2.59 8.32 5.73 0.028/11/1999 7.1 3 29 33.3 0.02 0.88 0.34 4.37 4.03 0.06 2008/28/1999 6.9 9.1 -112 17.4 5 0
9/3/1999 1.41 16.0 9/4/1999 0.73 17.0
9/15/19999/28/1999 7.2 9 16 24 1 3 2.7 9.16 6.46 0.02 12010/7/1999 1.57 10.0 11/8/1999 7 3 3 18 5.8 0.05 1.8 5.12 6.75 1.63 0.09 20
11/11/1999 7 1.94 11.6 130 9.0 10 na12/3/1999
12/15/1999 3 3 4 14 0.03 1.1 7.13 9.18 2.05 0.1 313/14/2000 7.3 6 4 17 13 0.7 1.6 31.2 33.9 2.70 0.02 1008/15/2000 6.7 6 77 32 0.7 8.7 6.1 12 5.90 0.02 93/25/20004/17/2001 7.6 14 11 3.5 11 26 31 5.00 6.2 510/1/2001 6.9 8.3 2 20 34 4.6 7.9 11 16 5.00 0.02 588/13/2002 8 42 6 15 20 9.3 1.3 27 31 4.00 6.3 120
12/11/2002 7.5 3 2 2.5 15 na 1.4 29 32 3.00 9.5 110/14/2003 7.5 4 2 3.3 20 na 2 3.2 5.4 2.20 0.15 40
4/6/2004 Three samples to be taken this spring for fecal coli only, then final acceptance will be applied for with the DECOMM. 204/12/2004 204/20/2004 1084/27/2004 68
Maximum= 8.0 3.3 11.6 130.0 18.0 42.0 9.0 77.0 37.0 9.3 11.0 31.2 33.9 33.8 9.5 200.0 Average= 7.0 1.4 8.9 (1.8) 11.8 7.9 3.7 17.2 23.9 1.5 2.8 8.8 16.4 4.9 1.3 54.0 Minimum= 6.0 0.2 6.1 (112.0) 5.0 2.0 2.0 2.5 5.8 0.0 0.3 0.1 4.4 - - 1.0
See Note p1:
4632
WEFT
EC®.06
Copyright 2006 W
ater Environment Foundation. A
ll Rights R
eserved©

Discussion We learned that subsurface flow wetlands could treat wastewater quite effectively throughout the year (see figure 4). Treatment efficiency is seasonal however average overall treatment exceeds other forms of passive privately owned wastewater treatment systems (POWTS). In particular, the average TKN removal is 78%. Fecal coliform die-off is striking without the use of additional treatment (this is unusually good in comparison with the other five wetland POWTS herein). We have enjoyed an abundance of wildlife visiting the wetland. In particular: various birds, deer, butterflies, bees, and hummingbirds. A summary table of average results follows: Analyte Raw- Sample Pt 1 Eff.- Sample Pt 3 Percent (%) Remvd. TKN-N 74.9 16.4 78 NH3-N 60 8.8 85 NO3-N 0.1 1.3 na CBOD5 67.9 3.7 94.6 TSS 24.9 17.2 30.9 Fecal Coli 8,240 54 99 Observations have been made during major rainfall and drought periods. Surface water has not been observed on the wetlands during any events and the water level has gone from 12 inch, down to 1 inch depth during the driest time of the year. The key mechanism causing this low level is evapotranspiration and we believe this is nature’s mechanism to encourage deep root growth. Lessons Learned The following is a summary of the lessons learned at Riveredge on the wetland since the start of the system in the fall of 1998 until the summer of 2004 (~ six years): We learned that using non sterile manure mixed with organic top soil brought in many unwanted plant seeds. Although not an overwhelming problem, reed canary grass is present and not desired. The level/sampling manholes used were two foot diameter concrete. The top was a custom fabricated wooden lid. Boards were double layered at 90 degrees. We learned that air leaked through the seal causing excessive heat loss in the dead of winter. We had some freezing of the weir tube during the first winter (see figure 5). We solved this by using a small electric heater and placing black plastic over the wooden cover. The plastic stops the air leakage and absorbs the sun's rays. Future designs did not use this manhole configuration. A smaller more effective
Figure 4, Effluent from 1st and 2nd lined cell (L to R)
4633
WEFTEC®.06
Copyright 2006 Water Environment Foundation. All Rights Reserved©

and less costly leveling structure is now used and no freezing has occurred. DECOMM no longer requires 110 volt outlets adjacent to these level structures. Most of the original plant species have enjoyed the wastewater. We used plants placed at about one foot intervals. Big blue stem (grass) has not survived. Blue Flag Iris has thrived in the front end of the first Cell and the Sedge has thrived at the end of the second cell. RNC does not discourage the growth of giant ragweed because of the bird habitat it creates, however owners of other systems normally remove it before the seeds are viable in the fall. The original plant list is as follows: Angelica--Angelica atropurpurea Big blue stem-- Andropogon gerardia Blue flag--Irus versicolor Blue vervain--Verbena hastata Bonset--Eupatorium perfoliatum Broadleaf Arrowhead--Sagittaria latifolia Joe-Pye-Weed-Eupatorium maculatum Meadow-rue--Thalictrum ploygamum Pickeralweed--Pontederia cordata Prairie cordgrass-- Spartina pectinata Rice cutgrass-- Leersia oryzoides River bullrush-- Scripus fluviatilis Sedge--Carex stricta Smartweed-- Polygoum spp Swamp milkweed--Asclepius incarnata Turtlehead--Chelone glabra Waterparsnip--Sium suave Every other year the wetland receives a spring burn. Timing is when the buds of maple trees emerge. In the Spring when no burns are conducted the wetlands are mowed leaving about four inches of plant stubble. Severe drought has brought water levels in the second wetland down to where the depth was not measurable. The plants were visibly stressed to the point of dormancy. This drought occurred in 2002 and the plants recovered in 2003. Under these circumstances it would have been preferable to add supplemental water, but experience demonstrated plant recovery and no reduction in treatment.
Figure 5, MH#2--Intermediate MH
4634
WEFTEC®.06
Copyright 2006 Water Environment Foundation. All Rights Reserved©

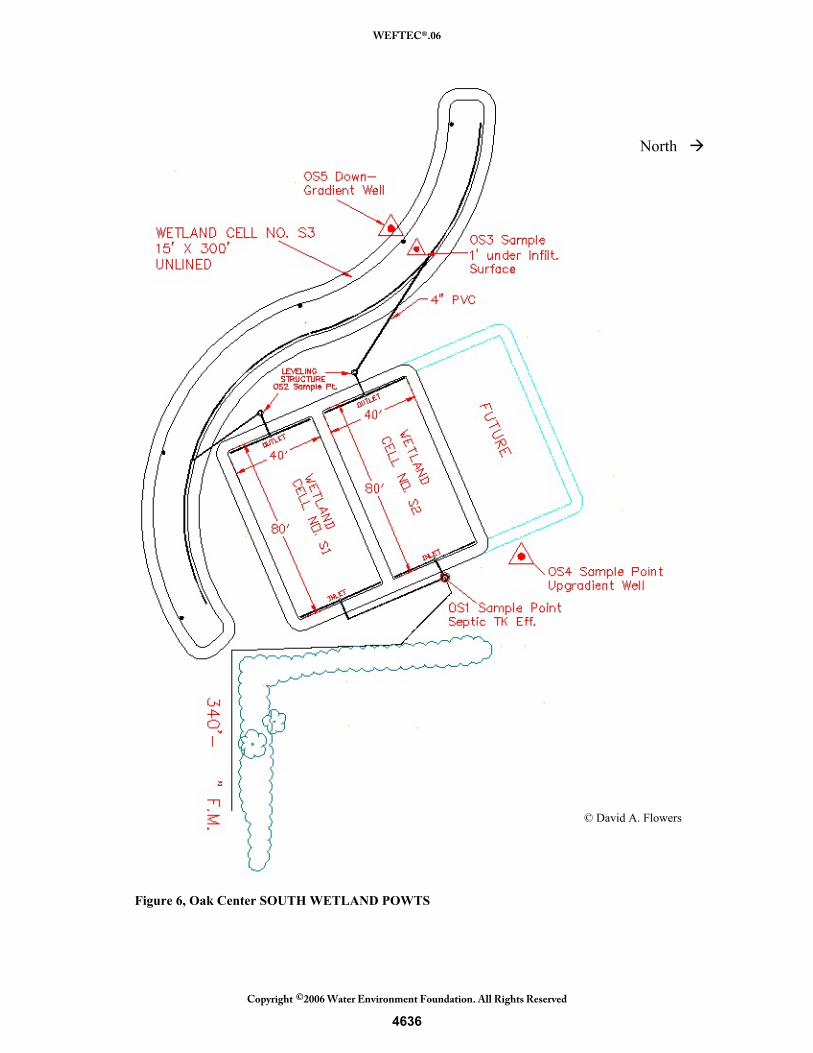
Conclusions The wetland wastewater treatment system exceeds RNC’s expectations, and clearly satisfied the purpose. All performance criteria set forth by the State of Wisconsin Department of Commerce was met. Riveredge Nature Center, Inc. received final approval of this report as satisfying all testing criteria. RNC concluded the test program and continues with maintenance activities. OAK CENTER, OAKFIELD, WISCONSIN Purpose/Status The Town of Oakfield (Oak Center) has a crossroads area where fourteen homes and a lumber yard had failing septic fields. This is an area near Horicon Marsh where soils are high in clay content and groundwater levels are high. A portion of this rural community (about 8 additional homes) had already completed the installation of an aerated treatment unit (ATU). They disliked the higher electrical and O&M costs and sought a more natural system with a lower O&M cost. Land was available for a wetland and the project proceeded with partial funding by the State of Wisconsin DECOMM. Background Oak Center was the first commercial sized subsurface flow wetland project and started under the experimental program with the Department of Commerce (No. 0004). Planning started in 1998 and construction was completed in December 2000. Two wetland systems are installed, one on the south and the other on the north end of town (See Figures 6 and 7). A sewer was installed conveying wastewater to community (clustered) septic tanks with duplex pump chambers. Both the North and South systems have two lined subsurface flow wetlands in parallel with dispersal (unlined) wetland(s) following. The North system has four connections while the South has eleven. Design Criteria The following is a summary of the design criteria for Oak Center’s Wetland Systems: Criteria Description South (Phase II) North (Phase III) Influent: Average (gpd) 2,900 1,500 Peak (gpd) 4,350 2,250 BOD5 (mg/l) 240 240
4635
WEFTEC®.06
Copyright 2006 Water Environment Foundation. All Rights Reserved©
North
© David A. Flowers
Figure 6, Oak Center SOUTH WETLAND POWTS
4636
WEFTEC®.06
Copyright 2006 Water Environment Foundation. All Rights Reserved©

North
ON1 Sample Pt.
ON2 Sample Pts.
© David A. Flowers 2006
Figure 7, Oak Center NORTH WETLAND POWTS
4637
WEFT
EC®.06
Copyright 2006 W
ater Environment Foundation. A
ll Rights R
eserved©

(cont) Criteria Description South (Phase II) North (Phase III) Lined Wetland Cells: # of Units 2 in parallel 2 in parallel Width (ft) 40 30 Length (ft) 80 60 Area total (ft2) 6,400 3,600 Areax sec (ft2) 120 90 Depth (ft) Percent Voids (%)
1.5 30
1.5 30
Unlined Cells # of Units 1 2 Width (ft) 15 10 Length (ft) 300 110 Area total (ft2) 4,500 2,200 Depth (ft) 1.5 1.5 Percent Voids (%) 30 30 All Wetland Cells Area (ft2) 10,900 5,800 Criteria: ft2/g/d (pk) 2.5 2.7 TVAd recomd ft2/g/d min 1.3 1.3 Media gravel/sand gravel/sand Septic Tank BOD5 % Rem. 50 50 lb BOD5/ft2
x sec = 0.04 0.03 Septic Tanks: 2 in series 2 in series Size (gal) 6,000 3,000 Appurtenances 2 eff. filters 2 eff. filters Influent Pumps: # of Units 2 2 Hp 1/2 1 Volt 115 230 TDH (ft) 35 60 Discharge ID (in) 2 2 Q (gpm) 50 50 Sampling
d Tennessee Valley Authority, General Design, Construction, and Operation Guidelines, Constructed Wetlands,…., 1991
4638
WEFTEC®.06
Copyright 2006 Water Environment Foundation. All Rights Reserved©

Sampling methods conform to the Water Environment Federation’s Manuals of Practice SM-1 and Standard Methods for The Examination of Water and Wastewater, current editions. Analysis is completed by certified laboratories. Grab samples are obtained on a quarterly basis for all points except the six sample wells. The six sample wells are sampled twice per year and coincide with the wet spring and early summer season. Sample Points ON1: Oak Center North-Influent to wetland cells (N1 & N2). ON2: Effluent from both wetland cells N1 & N2 (combined 50:50). ON3: Unlined cell sample well (one foot under the infiltrative surface) located in Cell N3. ON4: Upgradient well (shallow well used during wet Spring/summer) ON5: Downgradient well located 5 feet downgradient from toe of cell N3 and sample ON3
above. OS1: Oak Center South-Influent to wetland cells S1 & S2. OS2: Effluent from both wetland cells S1 & S2 (combined). OS3: Unlined cell sample well or one foot under the infiltrative surface, located in Cell S3. OS4: Upgradient well (shallow well used during wet Spring/summer) OS5: Downgradient well located 5 feet downgradient from toe of cell S3 and sample OS3
above. Analysis Influent Flow (estimate from pump timers)
pH Temp (deg C) e-coli Coliform Total Kjeldahl Nitrogen (TKN) Ammonia–N Nitrate–N Results See following pages (12) Definitions: n/o: is not obtained n/r: is not required n/a: is not applicable OT: is observation tube
4639
WEFTEC®.06
Copyright 2006 Water Environment Foundation. All Rights Reserved©

Oak Center: North Wetland (ON)
Sample Point: ON1, Influent (Septic/Pump tank Eff.)Flow Temp. TKN-N NH3-N NO3-N e-coli
Date (gpd) pH (ºC) (mg/l) (mg/l) (mg/l) (cnt/100ml)3/20/2001 6.8 3.5 12.6 11.1 0.3 64,000 5/10/2001 Samples this day were for the wells that were frozen on the 20th of march,7/18/2001 7.5 17.3 55.8 46 0.3 300,000
10/23/2001 1,450 7.1 11.8 40.2 33 0.3 51,000 12/26/2001 1,368 7.6 7.7 56.7 48.6 0.3 70,000,000
4/16/2002 1,781 7.7 7.2 30.2 24 0.3 400,000 7/1/2002 1,818 6.8 n/t 57.4 51 0.3 1,733
10/21/2002 1,646 7.5 11.5 59.9 48.5 0.3 24,200 1/6/2003 1,553 7.2 7.5 59.8 41.2 0.3 24,200
4/29/2003 3,201 7.5 7.8 26.7 20.9 0.568 24,200 7/1/2003 3,458 7.2 15.2 53 39 0.3 687,000
9/29/2003 1,722 6.9 16.2 44.4 39.9 0.3 461,000 12/23/2003 1,822 7.6 8.2 56.4 41.2 0.3 579,400
4/13/2004 2,212 7.5 6.9 49.7 81 0.3 488,000 7/5/2004 1,557 7.5 15.4 52.9 46.4 0.3 770,000
10/13/2004 1,390 7.2 14.8 59.8 52.1 0.3 816,000 12/28/2004 1,292 6.8 7.2 56.2 52.9 0.3 649,000
5/26/2005 1,447 7.1 9.6 62.3 48.2 0.3 727,000 7/6/2005 959 6.6 14.7 60.4 49.9 0.3 2,419,000
9/27/2005 1,034 7.2 17 52 47.8 0.3 400,000 12/27/2005 1,005 7.6 4.5 62.7 56.8 0.3 579,000
Maximum = 3,458 7.7 17.3 62.7 81.0 0.6 70,000,000 Average = 1,706 7.2 10.7 50.5 44.0 0.3 3,973,237 Minimum = 959 6.6 3.5 12.6 11.1 0.3 1,733
Five Years Sampling Program Complete
For the purpose of averaging, less than (<) figures were removed.for example: < 0.1 was changed to 0.1, < 10 was changed to 10.
Definitions:
n/o: is not obtainedn/r: is not requiredn/a: is not applicableOT: Observation Tube
4640
WEFTEC®.06
Copyright 2006 Water Environment Foundation. All Rights Reserved©

Oak Center: North Wetland (ON)
Sample Point:ON2, Lined Wetland Cell Effluents (Cell#N1&2)Temp. TKN-N NH3-N NO3-N e-coli
Date pH (ºC) (mg/l) (mg/l) (mg/l) (cnt/100ml)3/20/2001 7.8 3 8.56 8.3 0.78 1,300 5/10/2001 Samples this day were for the wells that were frozen on the 20th of march,7/18/2001 7.5 21.5 37.8 36.1 0.3 26
10/23/2001 7.1 12.7 42.6 41.5 0.3 1,414 12/26/2001 7.6 4.2 39.1 41 0.3 5,000
4/16/2002 7.2 6.7 33.5 31.6 0.3 1 7/1/2002 7.1 18 33.1 29.5 0.3 161
10/21/2002 7.4 11.4 37.6 34.2 0.3 74 1/6/2003 7.3 2.8 38 29.8 0.3 190
4/29/2003 7.2 7.4 19.2 16.7 0.3 960 7/1/2003 7.1 15.7 45.2 37.3 0.1 9
9/29/2003 6.8 15.6 27 25.5 0.1 10 12/23/2003 7.2 6.2 32.7 32.8 0.1 336
4/13/2004 7.5 5.5 20.5 19.2 0.1 310 7/5/2004 7 15.6 8.29 6.32 0.1 58
10/13/2004 6.9 13.7 28.6 26.2 0.1 100 12/28/2004 7.2 4.5 38.5 41.4 0.1 31
5/26/2005 7.3 8.2 45.8 39.9 0.1 220 7/6/2005 6.8 14.2 60.8 59.5 0.1 10
9/27/2005 7.1 15.8 14.3 14.5 0.1 41 12/27/2005 7.2 5.8 35.6 36 0.1 6
Maximum = 7.8 21.5 60.8 59.5 0.8 5,000 Average = 7.2 10.4 32.3 30.4 0.2 513
Minimum = 6.8 2.8 8.3 6.3 0.1 1
Definitions:
n/o: is not obtainedn/r: is not requiredn/a: is not applicableOT: Observation Tube
4641
WEFTEC®.06
Copyright 2006 Water Environment Foundation. All Rights Reserved©

Oak Center: North Wetland (ON)
Sample Point: ON3, Unlined Cell Sample Well (1 foot under the infiltrative surface)Temp. TKN-N NH3-N NO3-N e-coli
Date pH (ºC) (mg/l) (mg/l) (mg/l) (cnt/100ml)3/20/2001 7.8 3 5.22 4.88 0.3 230 5/10/2001 Samples this day were for the wells that were frozen on the 20th of march,7/18/2001 6.9 17.9 4.57 3.47 29.5 1
10/23/2001 Sample Not Required until Spring12/26/2001 Sample Not Required until Spring
4/16/2002 7.2 6.5 10.8 9.54 0.3 1 7/1/2002 6.9 14.8 4.55 4.07 3.64 1
10/21/2002 Sample Not Required until Spring1/6/2003 6.8 4.4 1.08 0.61 28.7 10
4/29/2003 7.1 5.4 9.6 7.99 4.38 10 7/1/2003 6.9 12.3 7.9 4.8 0.1 41
9/29/2003 Sample Not Required until Spring12/23/2003 Sample Not Required until Spring
4/13/2004 7.1 4.9 5.39 4.55 2.17 1 7/5/2004 6.9 13.8 1.86 1.11 1.19 1
10/13/2004 Sample Not Required until Spring12/28/2004 Sample Not Required until Spring
5/26/2005 7.1 8.7 10.7 9.39 0.1 15 7/6/2005 6.9 12.8 2.46 0.77 6.8 1
9/27/2005 Sample Not Required until Spring12/27/2005 Sample Not Required until Spring
Maximum = 7.8 17.9 10.80 9.54 29.50 230 Average = 7.1 9.5 5.83 4.65 7.02 28
Minimum = 6.8 3.0 1.08 0.61 0.10 1
Definitions:
n/o: is not obtainedn/r: is not requiredn/a: is not applicableOT: Observation Tube
4642
WEFTEC®.06
Copyright 2006 Water Environment Foundation. All Rights Reserved©

Oak Center: North Wetland (ON)
Sample Point: ON4, Upgradient WellTemp. TKN-N NH3-N NO3-N e-coli
Date pH (ºC) (mg/l) (mg/l) (mg/l) (cnt/100ml)3/20/2001 Frozen5/10/2001 0.16 0.03 1.74 17/18/2001 6.5 19.3 0.54 0.031 0.48 1
10/23/2001 Sample Not Required until Spring12/26/2001 Sample Not Required until Spring
4/16/2002 7.6 11.5 0.79 0.04 0.3 17/1/2002 7.2 16 0.54 0.04 0.443 1
10/21/2002 Sample Not Required until Spring1/6/2003 Dry Dry Dry Dry Dry Dry
4/29/2003 7.1 6.6 0.98 0.04 0.496 107/1/2003 Dry Dry Dry Dry Dry Dry
9/29/2003 Sample Not Required until Spring12/23/2003 Sample Not Required until Spring
4/13/2004 7.2 5.3 0.55 0.04 0.1 17/5/2004 6.9 15.3 0.94 0.04 0.1 1
10/13/2004 Sample Not Required until Spring12/28/2004 Sample Not Required until Spring
5/26/2005 7.4 10.4 0.61 0.25 0.1 17/6/2005 Dry
9/27/2005 Sample Not Required until Spring12/27/2005 Sample Not Required until Spring
Maximum = 7.6 19.3 0.98 0.25 1.74 10 Average = 7.1 12.1 0.64 0.06 0.47 2
Minimum = 6.5 5.3 0.16 0.03 0.10 1
Sample Point: ON5, Downgradient WellTemp. TKN-N NH3-N NO3-N e-coli
Date pH (ºC) (mg/l) (mg/l) (mg/l) (cnt/100ml)3/20/2001 Frozen5/10/2001 0.29 0.04 8.94 17/18/2001 Dry
10/23/2001 Sample Not Required until Spring12/26/2001 Sample Not Required until Spring
4/16/2002 7.1 7.2 0.26 0.045 0.3 17/1/2002 6.9 15.3 0.27 0.04 0.3 1
10/21/2002 Sample Not Required until Spring1/6/2003 7.1 3.2 0.24 0.04 0.17 10
4/29/2003 7 6.2 0.24 0.04 0.852 107/1/2003 7.1 missed 0.71 0.04 0.77 1
9/29/2003 Sample Not Required until Spring12/23/2003 Sample Not Required until Spring
4/13/2004 7.2 4.7 0.24 0.04 0.1 17/5/2004 7 15.4 0.49 0.04 0.1 1
10/13/2004 Sample Not Required until Spring12/28/2004 Sample Not Required until Spring
5/26/2005 7.3 10.1 0.4 0.04 0.18 17/6/2005 Dry
9/27/2005 Sample Not Required until Spring12/27/2005 Sample Not Required until Spring
Maximum = 7.3 15.4 0.71 0.05 8.94 10 Average = 7.1 8.9 0.35 0.04 1.30 3
Minimum = 6.9 3.2 0.24 0.04 0.10 1
4643
WEFTEC®.06
Copyright 2006 Water Environment Foundation. All Rights Reserved©

Oak Center: South Wetland (OS)
Sample Point: OS1, Influent (Septic/Pump tank Eff.)Flow Temp. TKN-N NH3-N NO3-N e-coli
Date (gpd) pH (ºC) (mg/l) (mg/l) (mg/l) (cnt/100ml)3/20/2001 7.8 6.5 31.6 27.9 0.3 26,000 5/10/2001 Samples this day were for the wells that were frozen on the 20th of march,7/18/2001 7.7 18 116 36 0.3 600,000
10/23/2001 1,709 7.2 15.8 54.9 46.1 0.3 28,000 12/26/2001 1,053 7.7 7.7 21.5 20.2 0.3 1,200,000
4/16/2002 1,102 8.1 9 35.8 26.7 0.3 500,000 7/1/2002 1,108 7.5 13.1 47 40.7 0.3 961
10/21/2002 869 7 16.6 62.9 47 0.3 >24,2001/6/2003 1,588 7.2 11.3 44.3 34.9 0.3 >24,200
4/29/2003 906 7.1 9.1 59 45.3 0.3 >24,1907/1/2003 1,137 6.9 13.5 56.5 40.4 0.2 1,733,000
9/29/2003 948 6.5 17.1 51 44.1 0.1 >2,419,00012/23/2003 1,102 7.2 11.1 48.3 35.3 0.1 >24,192,000
4/13/2004 1,075 7.4 8.7 45.4 36.8 0.1 6,130,000 7/5/2004 1,821 6.9 n/a 59.3 50.1 0.1 1,520,000
10/13/2004 862 6.6 16.2 70 59.1 0.1 6,870,000 12/28/2004 792 6.9 10.9 62.9 57.1 0.1 15,530,000
5/26/2005 916 7.1 10.7 62 49 0.1 2,480,000 7/6/2005 800 6.6 14.7 68.7 56.2 0.1 4,110,000
9/27/2005 790 6.9 16.9 62.9 56.2 0.1 3,100,000 12/27/2005 856 7.1 8.2 72.6 65.9 0.1 3,100,000
Maximum = 1,821 8.1 18.0 116.0 65.9 0.3 15,530,000 Average = 1,080 7.2 12.4 56.6 43.8 0.2 3,128,531
Minimum = 790 6.5 7.7 21.5 20.2 0.1 961
Five Year Sampling Program Complete
For the purpose of averaging, less than (<) figures were removed.for example: < 0.1 was changed to 0.1, < 10 was changed to 10.
Definitions:
n/o: is not obtainedn/r: is not requiredn/a: is not applicableOT: Observation Tube
4644
WEFTEC®.06
Copyright 2006 Water Environment Foundation. All Rights Reserved©

Oak Center: South Wetland (OS)
Sample Point:OS2, Lined Wetland Cell Effluents (Cell#S1&2)Temp. BOD5 TSS TKN-N NH3-N NO3-N e-coli
Date pH (ºC) (mg/l) (mg/l) (mg/l) (mg/l) (mg/l) (cnt/100ml)3/20/2001 7.6 3 n/r n/r 26.8 26.2 0.54 920 5/10/2001 Samples this day were for the wells that were frozen on the 20th of march,7/18/2001 7.5 23 n/r n/r 14.6 12.2 0.3 102
10/23/2001 7.3 10.6 8 5 32.3 29.9 0.3 3,200 12/26/2001 7.5 6.5 n/r n/r 33.7 33.7 0.3 4,000
4/16/2002 7.5 10.5 n/r n/r 31.9 28.7 0.3 13,000 7/1/2002 7.1 19 n/r n/r 28.1 27.8 0.3 201
10/21/2002 7.2 9.2 n/r n/r 34.5 30.7 0.3 250 1/6/2003 7.3 1.3 n/r n/r 22.2 19.5 0.3 120
4/29/2003 7.4 9.75 n/r n/r 48.1 40.4 0.3 2,010 7/1/2003 7.1 17.4 n/r n/r 35.5 29.1 0.1 2,140
9/29/2003 6.7 13.4 n/r n/r 26.1 24.9 0.1 3,450 12/23/2003 7.4 3.3 n/r n/r 29.9 29.2 0.1 18,600
4/13/2004 7.4 5.3 n/r n/r 28 25.6 0.1 9,210 7/5/2004 7.2 16.5 n/r n/r 26 23.8 0.1 3,870
10/13/2004 6.8 13.7 n/r n/r 30.6 27.4 0.1 10 12/28/2004 6.8 3.2 n/r n/r 33.7 35.1 0.1 12,030
5/26/2005 7.2 10.6 n/r n/r 47.9 41.8 0.1 20 7/6/2005 6.8 17 n/r n/r 43.7 41.6 0.1 30
9/27/2005 7.1 17.6 n/r n/r 29.7 29.2 0.1 3,400 12/27/2005 7.4 3.5 n/r n/r 36.3 34.5 0.1 5,170
Maximum = 7.6 23.0 See See 48.1 41.8 0.5 18,600 Average = 7.2 10.7 Above Above 32.0 29.6 0.2 4,087
Minimum = 6.7 1.3 22.2 19.5 0.1 10
Definitions:
n/o: is not obtainedn/r: is not requiredn/a: is not applicableOT: Observation Tube
4645
WEFTEC®.06
Copyright 2006 Water Environment Foundation. All Rights Reserved©

Oak Center: South Wetland (OS)
Sample Point: OS3, Unlined Cell Sample Well (1 foot under the infiltrative surface)Temp. TKN-N NH3-N NO3-N e-coli
Date pH (ºC) (mg/l) (mg/l) (mg/l) (cnt/100ml)3/20/2001 7.2 5.5 8.41 6.61 0.3 15/10/2001 Samples this day were for the wells that were frozen on the 20th of march,7/18/2001 7.2 17.8 8.41 5.64 0.3 1
10/23/2001 Sample Not Required until Spring12/26/2001 Sample Not Required until Spring4/16/2002 7 7.2 13.8 11.8 0.3 1
7/1/2002 6.8 15.1 12.3 11.2 0.3 110/21/2002 Sample Not Required until Spring
1/6/2003 7.1 3.9 20.6 19.1 0.3 8104/29/2003 6.9 7.4 25.6 20 0.3 50
7/1/2003 6.9 15.6 25.1 20.1 0.1 119/29/2003 Sample Not Required until Spring
12/23/2003 Sample Not Required until Spring4/13/2004 7.2 5.8 12.2 29 0.1 2,419
7/5/2004 7 14 22.2 20.3 0.1 45010/13/2004 Sample Not Required until Spring12/28/2004 Sample Not Required until Spring5/26/2005 7.2 9.9 34.9 31.6 0.1 179
7/6/2005 6.9 16.9 35.1 32.3 0.1 419/27/2005 Sample Not Required until Spring
12/27/2005 Sample Not Required until SpringMaximum = 7.2 17.8 35.1 32.3 0.3 2,419 Average = 7.0 10.8 19.9 18.9 0.2 360 Minimum = 6.8 3.9 12.2 11.2 0.1 1
Definitions:
n/o: is not obtainedn/r: is not requiredn/a: is not applicableOT: Observation Tube
4646
WEFTEC®.06
Copyright 2006 Water Environment Foundation. All Rights Reserved©

Oak Center: South Wetland (OS) Sample Point: OS4, Upgradient Well
Temp. TKN-N NH3-N NO3-N e-coli Date pH (ºC) (mg/l) (mg/l) (mg/l) (cnt/100ml)
3/20/2001 FROZEN5/10/2001 0.33 0.05 12.5 17/18/2001 7.3 18.4 0.77 0.03 4.68 1
10/23/2001 Sample Not Required until Spring12/26/2001 Sample Not Required until Spring
4/16/2002 6.9 7.2 0.74 0.04 0.3 17/1/2002 6.9 15.3 0.24 0.04 0.3 1
10/21/2002 Sample Not Required until Spring1/6/2003 Dry Dry Dry Dry Dry Dry
4/29/2003 7.1 6.9 0.27 0.04 4.5 107/1/2003 Dry Dry Dry Dry Dry Dry
9/29/2003 Sample Not Required until Spring12/23/2003 Sample Not Required until Spring
4/13/2004 7.2 6.7 0.24 0.04 0.1 17/5/2004 7.1 16.2 0.41 0.06 0.1 1
10/13/2004 Sample Not Required until Spring12/28/2004 Sample Not Required until Spring
5/26/2005 6.9 10.4 0.83 0.31 0.1 17/6/2005 Dry
9/27/2005 Sample Not Required until Spring12/27/2005 Sample Not Required until Spring
Maximum = 7.3 18.4 0.83 0.31 12.5 10 Average = 7.1 11.6 0.48 0.08 2.8 2
Minimum = 6.9 6.7 0.24 0.04 0.1 1
Sample Point: OS5, Downgradient WellTemp. TKN-N NH3-N NO3-N e-coli
Date pH (ºC) (mg/l) (mg/l) (mg/l) (cnt/100ml)3/20/2001 FROZEN5/10/2001 0.83 0.12 1.13 9.77/18/2001 7.2 18.4 0.77 0.032 0.3 4
10/23/2001 Sample Not Required until Spring12/26/2001 Sample Not Required until Spring
4/16/2002 6.8 7.1 0.8 0.04 0.3 17/1/2002 6.7 15.8 0.38 0.04 0.3 7
10/21/2002 Sample Not Required until Spring1/6/2003 6.6 4.7 <0.24 0.04 0.1 10
4/29/2003 6.9 6.9 0.31 0.04 0.3 107/1/2003 6.9 14 0.82 0.04 0.3 261
9/29/2003 Sample Not Required until Spring12/23/2003 Sample Not Required until Spring
4/13/2004 6.9 6.4 0.6 0.04 0.1 17/5/2004 6.8 14.7 0.54 0.04 0.1 7
10/13/2004 Sample Not Required until Spring12/28/2004 Sample Not Required until Spring
5/26/2005 6.9 9.6 0.71 0.15 0.1 17/6/2005 6.7 14.4 0.82 0.04 0.1 1
9/27/2005 Sample Not Required until Spring12/27/2005 Sample Not Required until Spring
Maximum = 7.2 18.4 0.83 0.15 1.1 261 Average = 6.8 11.2 0.66 0.06 0.3 28
Minimum = 6.6 4.7 0.31 0.04 0.1 1
4647
WEFTEC®.06
Copyright 2006 Water Environment Foundation. All Rights Reserved©

Discussion Overall the performance of the wetlands has been very good. The following tables show the average performance for nitrogen and e-coli removal:
Average Results at Sample Points:
Description Sample TKN-N NH3-N NO3-N e-coliID (mg/l) (mg/l) (mg/l) (col/100mg)
Upgradient well (shallow) ON4 0.64 0.06 0.47 2 Septic Tank Effluent ON1 50.5 44 0.3 3,973,237 Lined Cell Effluent ON2 32.3 30.4 0.2 513 1 ft under infiltrative surface (soil) ON3 5.83 4.65 7.02 28 Downgradient well (berm toe) ON5 0.35 0.04 1.3 3
Percent Reduction:OS1 to 2; Lined Cell only 36.04% 30.91% 33.33% 99.99%OS 1 to 3; Line Cell and 1' soil 88.46% 89.43% -2240% 99.999%OS1 to 5; Lined & unlined cell, and soil 99.31% 99.91% -333% 99.9999%
OAK CENTER NORTHPERCENT REDUCTION OF ANALYTESAcross Wetland at three Sample Points
3/20/2001 to 12/27/2005
Average Results at Sample Points:
Description Sample TKN-N NH3-N NO3-N e-coliID (mg/l) (mg/l) (mg/l) (col/100mg)
Upgradient well (shallow) OS4 0.64 0.06 0.47 2 Septic Tank Effluent OS1 56.6 43.8 0.2 3,128,531 Lined Cell Effluent OS2 32 29.6 0.2 4,087 1 ft under infiltrative surface (soil) OS3 19.9 18.9 0.2 360 Downgradient well (berm toe) OS5 0.7 0.1 0.3 28
Percent Reduction:OS1 to 2; Lined Cell only 43.46% 32.42% 0.00% 99.87%OS 1 to 3; Line Cell and 1' soil 64.84% 56.85% 0.00% 99.99%OS1 to 5; Lined & unlined cell, and soil 98.76% 99.77% -50.00% 99.999%
PERCENT REDUCTION OF ANALYTESAcross Wetland at three Sample Points
OAK CENTER SOUTH
3/20/2001 to 12/27/2005
Considering that the wells are shallow (~4 feet deep) and the ground’s permeability is near 0 at 2 to 3 feet under the surface, you will note very little change in the groundwater quality from the upgradient to the downgradient wells.
4648
WEFTEC®.06
Copyright 2006 Water Environment Foundation. All Rights Reserved©

Lessons Learned (since start-up) • Leaks in the berm of the unlined wetland cell (No. S3) on the south system–We learned that
when constructing the berm of the dispersal wetland, one must place the dirt as if building a causeway. Dirt is placed on the ground where the berm is located, and then the equipment drives up on the dirt as more is placed. This compresses the dirt without excessive topsoil compaction. When we originally placed the dirt on the South system we used a large shovel from the upgradient side only and did not move any equipment across the berm. In the Spring we had several leaks throughout the berm. We have since placed additional dirt using the causeway method and no leaks are evident. Water is flowing into the groundwater as designed.
• Sand bib— the unlined wetland cells had a sand bib surrounding the berm. The objective was to evenly distribute water that may pass through the berm. This sand bib coupled with the uncompacted berm, caused uneven water flow. We removed the sand bib and the problem went away.
• The low bid is not the only criteria for choosing a contractor.
• The sample well construction for this project is working quite well. This is most likely due to the tight soils. More recent projects now use pan Lysimeters (see figure 8).
• We learned that cutting the wetlands down in the spring to an approximate height of three inches or burning, helps encourage the wetland plants to grow (increased sunlight). There are still many invasive weed species; however burning every third year seems to help by stressing the cold weather plants while the warmer weather prairie plants are still dormant and undamaged from the fire.
• Water levels in the unlined cells on the North System have been consistently low, while the water level in the unlined cell on the South end has ranged from dry to 18 inches (just below the surface). We suspect that this is caused by the hydrology in the Spring and not from soil clogging. Level monitoring continued throughout the first five (5) years and the level never exceeded 18 inches.
• Placing a permanent pile of woodchip mulch onto each level structure and the inlet tees to the unlined cells (all wetlands) prevents any freezing from occurring during winters with little to no snow cover. This has worked very well for the past three winters. Careful inspection during the cold weather of the 2004/05 winter demonstrated success.
Figure 8, Pan Lysimeter
4649
WEFTEC®.06
Copyright 2006 Water Environment Foundation. All Rights Reserved©

• Lined Wetland Cells should be constructed with a level top surface throughout. The current installation has the top surface parallel to the floor slope. In the future this will work well once media “clogging” occurs, however the intervening years create dry conditions that do not favor wetland plant species. The solution is to build the top surface-level, while sloping the floor toward the outlet. The level structure can allow the water surface to be placed just under the top soil, allowing water to wick into the soil layer.
PRIVATE CORPORATION., PORT WASHINGTON, WISCONSIN Purpose/Status This owner had failing septic systems and for environmental reasons desired to have a clustered wetland system. The property has numerous wetland/prairie complexes, so this system fit well aesthetically and environmentally. Three years of sampling was completed on March 23, 2004. The last sampling event will be completed in July of 2006. After the final sampling is completed a report will be submitted to DECOMM for final approval. Background This facility has two homes connected to one lined wetland cell followed by one unlined wetland cell. The larger of the two homes has six bedrooms and is occasionally used and the smaller home is used year around and has three bedrooms. Each home has it own septic tank with effluent filter and simplex pump system. The lined wetland was undersized for the flow and the unlined cell was sized for the peak flow. This strategy has worked very well. Design Criteria The following is a summary of the design criteria for The Private Corporation Wetland System: Criteria Description Wetland Criteria Influent: # of Bedrooms
9
Average (gpd) 350e Peak (gpd) 1,350 BOD5 (mg/l) 240 Lined Wetland Cells: # of Units 1 Width (ft) 25 Length (ft) 40 Area total (ft2) 1,000 Areax sec (ft2) 37.5
e The Main House is only occupied for two weeks out of the year and an occasional weekend. The Barn apartment is occupied.
4650
WEFTEC®.06
Copyright 2006 Water Environment Foundation. All Rights Reserved©
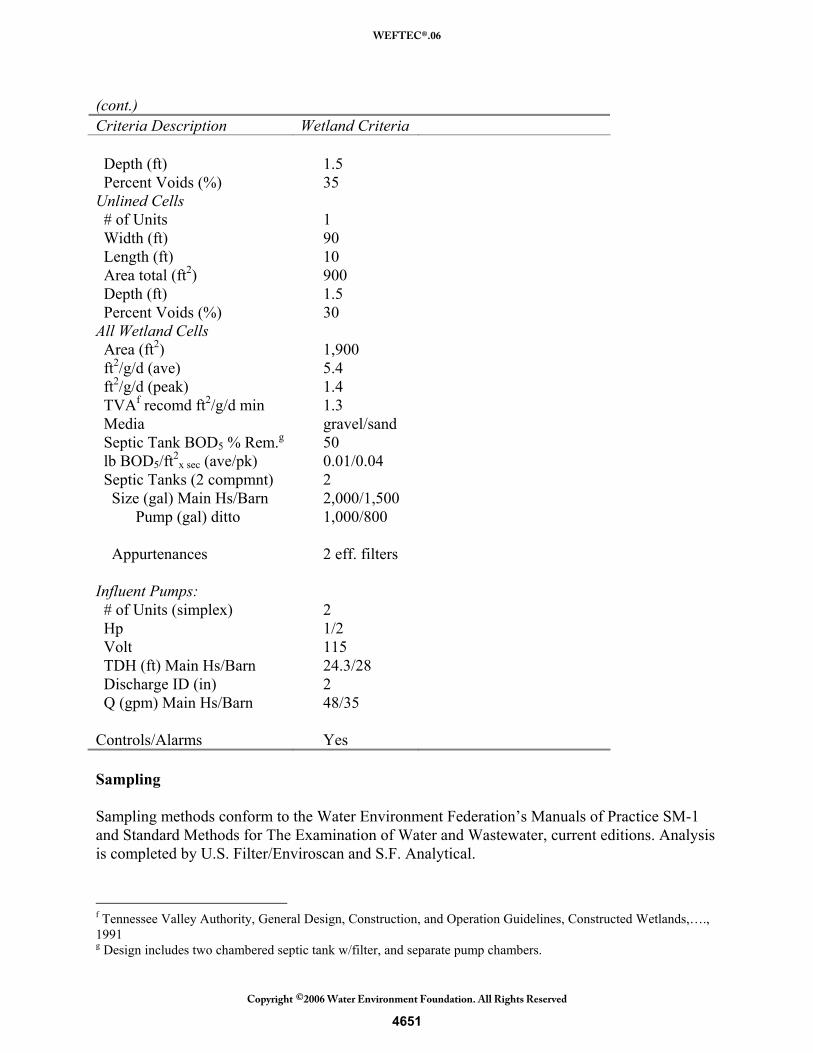
(cont.) Criteria Description Wetland Criteria Depth (ft) Percent Voids (%)
1.5 35
Unlined Cells # of Units 1 Width (ft) 90 Length (ft) 10 Area total (ft2) 900 Depth (ft) 1.5 Percent Voids (%) 30 All Wetland Cells Area (ft2) 1,900 ft2/g/d (ave) 5.4 ft2/g/d (peak) 1.4 TVAf recomd ft2/g/d min 1.3 Media gravel/sand Septic Tank BOD5 % Rem.g 50 lb BOD5/ft2
x sec (ave/pk) 0.01/0.04 Septic Tanks (2 compmnt) 2 Size (gal) Main Hs/Barn Pump (gal) ditto
2,000/1,500 1,000/800
Appurtenances 2 eff. filters Influent Pumps: # of Units (simplex) 2 Hp 1/2 Volt 115 TDH (ft) Main Hs/Barn 24.3/28 Discharge ID (in) 2 Q (gpm) Main Hs/Barn 48/35 Controls/Alarms Yes Sampling Sampling methods conform to the Water Environment Federation’s Manuals of Practice SM-1 and Standard Methods for The Examination of Water and Wastewater, current editions. Analysis is completed by U.S. Filter/Enviroscan and S.F. Analytical.
f Tennessee Valley Authority, General Design, Construction, and Operation Guidelines, Constructed Wetlands,…., 1991 g Design includes two chambered septic tank w/filter, and separate pump chambers.
4651
WEFTEC®.06
Copyright 2006 Water Environment Foundation. All Rights Reserved©

Grab samples are obtained on a quarterly basis for all points. Sample Points G2: Lined Cell Effluent G3: Lysimeter located one foot under the infiltrative surface of the unlined wetland cell. Analysis Influent Flow (run timer totalizer and pumping rate) (gpd) Lined Cell Effluent: pH Temperature (ºC) E- Coli Coliform (cts/100ml) Ammonia–N (mg/l) Total Kjeldahl Nitrogen (TKN) (mg/l) Nitrate–N (mg/l) 1 foot under the infiltrative surface: pH Temperature (ºC) E- Coli Coliform (cts/100ml) Results Private Corporation (G): Analytical Results
Sample Point: G2, Lined Wetland Cell Effluent (Cell#1)Flow Temp. BOD5 TSS TKN-N NH3-N NO3-N e-coli
Date Barn Main House (gpd) pH (ºC) (mg/l) (mg/l) (mg/l) (mg/l) (mg/l) (cnt/100ml)7/19/2001 4.16 3.26 7 21.7 10 3.8 8.3 4.44 0.3 8
10/25/2001 10.08 4.26 147 7 13.4 42 20.8 26.6 24.3 0.3 867 12/27/2001 14.3 4.4 142 7.1 7.5 n/r n/r 35.7 36 0.3 400
4/17/2002 22.38 4.85 158 7.7 5.6 n/r n/r 45.7 39.4 0.3 15,000 7/8/2002 28.28 5.37 162 6.9 14.2 n/r n/r 18.7 17.5 0.3 49
10/21/2002 49.6 6.42 437 7.2 13.8 n/r n/r 40.3 35.3 0.3 190 1/8/2003 55.22 8.31 201 7.1 4.7 n/r n/r 45 34.3 0.3 1,790
4/23/2003 63.27 8.55 162 7.4 4.6 n/r n/r 47.9 44.1 0.3 11,200 7/22/2003 69.3 9.38 158 6.9 13.8 n/r n/r 25.5 24 0.1 60 9/30/2003 72.54 9.8 108 6.7 14 n/r n/r 29.2 28.6 0.1 110
12/29/2003 78.66 10.24 150 7.1 6.9 n/r n/r 28.7 30.1 0.1 110 3/23/2004 80.84 10.46 58 7.3 4.3 n/r n/r 19.4 18.1 0.17 1,610
Maximum= 437 7.7 21.7 42.0 20.8 47.9 44.1 0.3 15,000.0 Average= 171 7.1 10.4 26.0 12.3 30.9 28.0 0.2 2,616.2
Minimum= 58 6.7 4.3 10.0 3.8 8.3 4.4 0.1 8.0
First three years of sampling complete. Next sample will be 07/2006
Totalizer (hrs)
4652
WEFTEC®.06
Copyright 2006 Water Environment Foundation. All Rights Reserved©

Private Corporation (G): Analytical Results
Sample Point: G3, Lysimeter (Cell#2)Temp. BOD5 TKN-N NH3-N NO3-N e-coli
Date pH (ºC) (mg/l) (mg/l) (mg/l) (mg/l) (cnt/100ml)7/19/2001 7 22.2 9 4.82 0.91 1.74 2
10/25/2001 6.9 13 n/r n/r n/r n/r 15312/27/2001 7.1 7.1 n/r n/r n/r n/r 1
4/17/2002 6.9 6.7 n/r n/r n/r n/r 1007/8/2002 Sample Point Dry (evapotranspiration exceeds input)
10/21/2002 6.9 12.4 n/r n/r n/r n/r 101/8/2003 6.8 4.3 n/r n/r n/r n/r 10
4/23/2003 7.1 5.6 n/r n/r n/r n/r 607/22/2003 6.8 16.3 n/r n/r n/r n/r 19/30/2003 6.5 13.8 n/r n/r n/r n/r 1
12/29/2003 7.1 5.3 n/r n/r n/r n/r 33/23/2004 7.4 3.7 n/r n/r n/r n/r 1
Maximum= 7.4 22.2 9 4.82 0.91 1.74 153 Average= 7.0 10.0 9 4.82 0.91 1.74 31
Minimum= 6.5 3.7 9 4.82 0.91 1.74 1
Definitions:
n/o: is not obtainedn/r: is not requiredn/a: is not applicableOT: Observation TubeFigure 9, G3, SPt. (Lysimeter) taken May 2, 2006
4653
WEFTEC®.06
Copyright 2006 Water Environment Foundation. All Rights Reserved©

Discussion This project was completed as a turn-key installation and resulted in excellent quality control. Using experienced contractors with a negotiated price worked very well. Project performance has been excellent. Compost from the site was used for topsoil and turned out to be quite sterile of weed seeds. We presume this is because of the temperatures reached during decomposition. Plants were obtained from various wetland areas on the property and placed into the wetlands. Wetland seeds were also planted. Lessons Learned (since start-up) Good compost or sterile soil helps tremendously with weed suppression in the first year. If the budget is available or if natural plant cuttings are on-site, this is the best way to establish a viable plant population. Supplemental seeding is also very helpful. The wetland POWT systems can handle occasional peak loads. As mentioned earlier the lined wetland cell is undersized for the peak, but has performed very well. If the budget is available, placing straw matting (erosion control) over the berms after seeding WITHOUT the use of a cover crop worked very well in allowing prairie grasses to get established in the first season. We placed cuttings of prairie cord grass in the lined cell and they flourished and went to seed by fall. These propagate via rhizomes and seed. Burning every third year (spring only) helps suppress cold weather invasive species and encourage species diversification. We have also observed an improved “jump start” to spring growth. We think this is primarily due to the warmth gained from the sun hitting the black ashes of the burned prairie plants
Figure 10, Private Corp., lined cell, 9/2002
4654
WEFTEC®.06
Copyright 2006 Water Environment Foundation. All Rights Reserved©