experiment 1 part 2.pptxcls 231new
TRANSCRIPT
8/13/2019 Experiment 1 Part 2.Pptxcls 231new
http://slidepdf.com/reader/full/experiment-1-part-2pptxcls-231new 1/24
Continued on acid-base
titration
Part-2Standardization of Hydrochloric
Acid Solution
Done by: Samyah Alanazi

8/13/2019 Experiment 1 Part 2.Pptxcls 231new
http://slidepdf.com/reader/full/experiment-1-part-2pptxcls-231new 2/24
Terms used in titration
• - pH
•- Pka
• - Equivalent point
• - Indicator
• - End point.• - Concentration unit.

8/13/2019 Experiment 1 Part 2.Pptxcls 231new
http://slidepdf.com/reader/full/experiment-1-part-2pptxcls-231new 3/24
pH
• pH is a measure of hydrogen ionconcentration; a measure of the acidity oralkalinity of a solution. Aqueous solutions
at 25°C with a pH less than seven areacidic, while those with a pH greater thanseven are basic or alkaline. A pH level of is7.0 at 25°C is defined as 'neutral' because
the concentration of H3O+ equals theconcentration of OH− in pure water.
8/13/2019 Experiment 1 Part 2.Pptxcls 231new
http://slidepdf.com/reader/full/experiment-1-part-2pptxcls-231new 4/24
pKa and Ka
• The Ka value is a value used to describe thetendency of compounds or ions to dissociate.The Ka value is also called the dissociation
constant, the ionization constant, and theacid constant.
• The definition of Ka is: [H+].[B] / [HB], where Bis the conjugate base of the acid HB.
• The pKa value is defined from Ka, and can becalculated from the Ka value from theequation pKa = -Log10(Ka)

8/13/2019 Experiment 1 Part 2.Pptxcls 231new
http://slidepdf.com/reader/full/experiment-1-part-2pptxcls-231new 5/24
The equivalence point
• Or stoichiometric point, of a chemicalreaction is the point at which an added titrantis stoichiometrically equal to the number of
moles of substance (known as analyte)present in the sample: the smallest amount oftitrant that is sufficient to fully neutralize orreact with the analyte. In some cases there
are multiple equivalence points which aremultiples of the first equivalent point, such asin the titration of a diprotic acid.

8/13/2019 Experiment 1 Part 2.Pptxcls 231new
http://slidepdf.com/reader/full/experiment-1-part-2pptxcls-231new 6/24
The endpoint /pH indicator:
• (related to, but not the same as the equivalence point)
refers to the point at which the indicator changes color in
a colorimetric titration.
• This is a substance that changes color in response to a
chemical change. An acid-base indicator (e.g.,
phenolphthalein) changes color depending on the pH.
Redox indicators are also frequently used. A drop of
indicator solution is added to the titration at the start;
when the color changes the endpoint has been reached,this is an approximation of the equivalence point.

8/13/2019 Experiment 1 Part 2.Pptxcls 231new
http://slidepdf.com/reader/full/experiment-1-part-2pptxcls-231new 7/24
Normality
• Normality is another way of expressing theconcentration of a solution. It is based on analternate chemical unit of mass called theequivalent weight. The normality of a solution is
the concentration expressed as the number ofequivalent weights (equivalents) of solute per literof solution. A 1 normal (1 N) solution contains 1equivalent weight of solute per liter of solution.
• HCl(aq) + NaOH(aq) NaCl(aq) + H2O• 1 mole 1 mole• (36.5 grams) (40.0 grams)

8/13/2019 Experiment 1 Part 2.Pptxcls 231new
http://slidepdf.com/reader/full/experiment-1-part-2pptxcls-231new 8/24

8/13/2019 Experiment 1 Part 2.Pptxcls 231new
http://slidepdf.com/reader/full/experiment-1-part-2pptxcls-231new 9/24
Types of Acid-Base titration
• A) Strong acid / base against strong base / acidtitrations:
• In this titration, the solution has a low pH and climbsas the strong base is added. As the solution nears the
point where all of the H+ are neutralized, the pH risessharply and then levels out again as the solutionbecomes more basic as more OH- ions are added.(Note that the strong base-strong acid titration curve isidentical to the strong acid-strong base titration, butflipped vertically.)
• Phenolphthalein / methyl orange and methyl red fallwith in the range of the inflection of this group.

8/13/2019 Experiment 1 Part 2.Pptxcls 231new
http://slidepdf.com/reader/full/experiment-1-part-2pptxcls-231new 10/24
Titration curve

8/13/2019 Experiment 1 Part 2.Pptxcls 231new
http://slidepdf.com/reader/full/experiment-1-part-2pptxcls-231new 11/24
• The curve shows a strong acid being titratedby a strong base. There is the initial slowrise in pH until the reaction nears the point
where just enough base is added toneutralize all the initial acid. This point iscalled the equivalence point. For a strongacid/base reaction, this occurs at pH = 7. As
the solution passes the equivalence point,the pH slows its increase where the solutionapproaches the pH of the titration solution.

8/13/2019 Experiment 1 Part 2.Pptxcls 231new
http://slidepdf.com/reader/full/experiment-1-part-2pptxcls-231new 12/24
• B) Weak acid and strong base titration:
• In this titration, a weak acid only partiallydissociates from its salt. The pH will rise normallyat first, but as it reaches a zone where the solution
seems to be buffered, the slope levels out. Afterthis zone, the pH rises sharply through itsequivalence point and levels out again like thestrong acid/strong base reaction.
• phenolphthalein is a suitable indicator as its pHrange is 8-9.8. However, methyl orange is notsuitable as its pH range is 3.1 to 4.5.
•
8/13/2019 Experiment 1 Part 2.Pptxcls 231new
http://slidepdf.com/reader/full/experiment-1-part-2pptxcls-231new 13/24
8/13/2019 Experiment 1 Part 2.Pptxcls 231new
http://slidepdf.com/reader/full/experiment-1-part-2pptxcls-231new 14/24
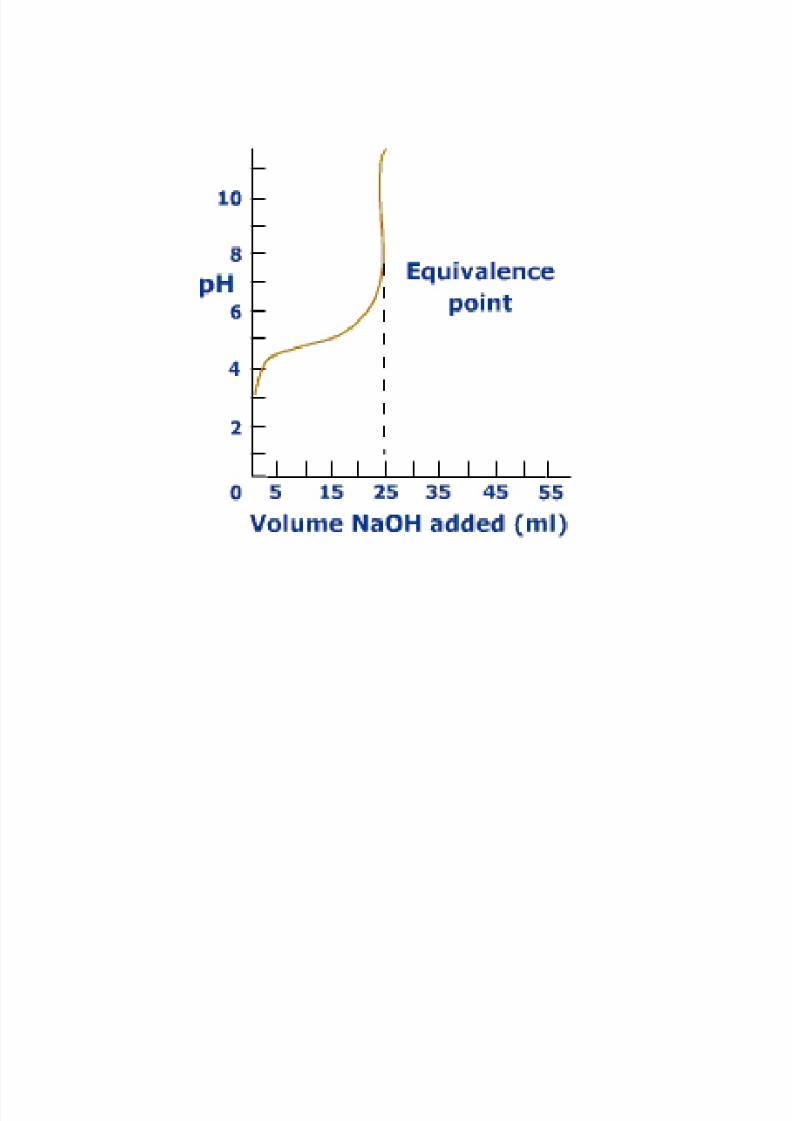
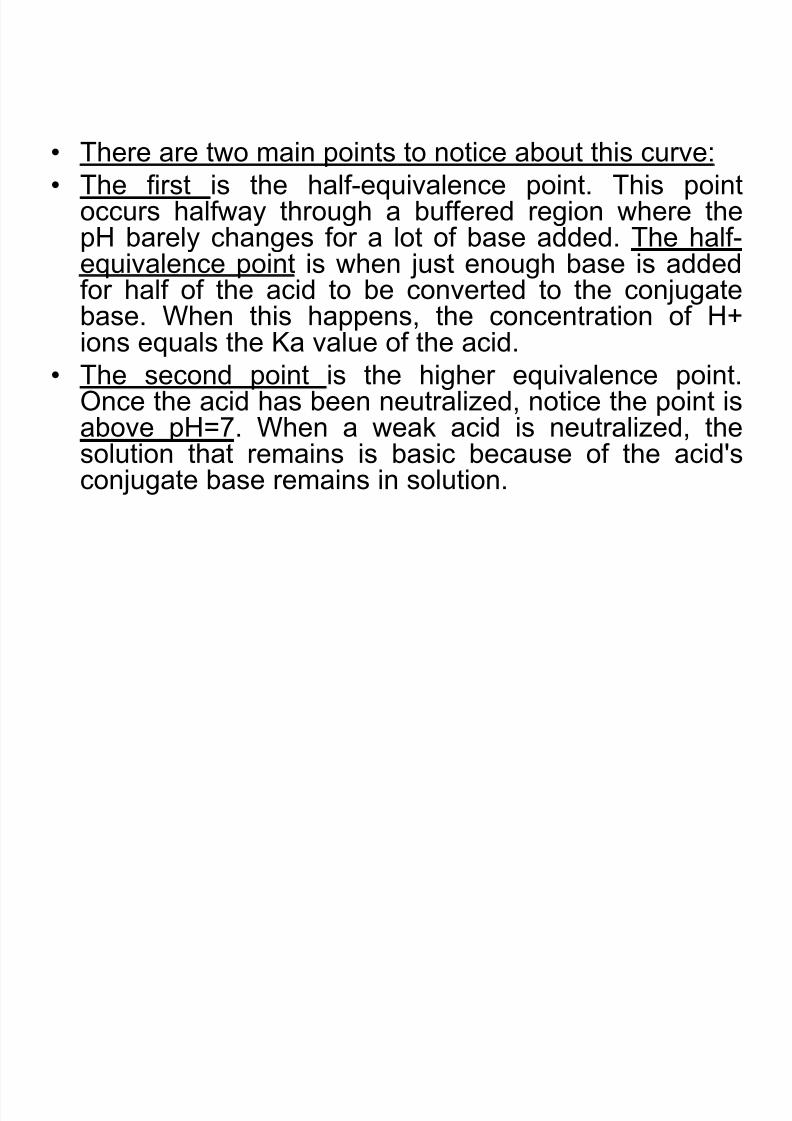
• There are two main points to notice about this curve:
• The first is the half-equivalence point. This pointoccurs halfway through a buffered region where thepH barely changes for a lot of base added. The half-
equivalence point is when just enough base is addedfor half of the acid to be converted to the conjugatebase. When this happens, the concentration of H+ions equals the Ka value of the acid.
• The second point is the higher equivalence point.
Once the acid has been neutralized, notice the point isabove pH=7. When a weak acid is neutralized, thesolution that remains is basic because of the acid'sconjugate base remains in solution.
8/13/2019 Experiment 1 Part 2.Pptxcls 231new
http://slidepdf.com/reader/full/experiment-1-part-2pptxcls-231new 15/24
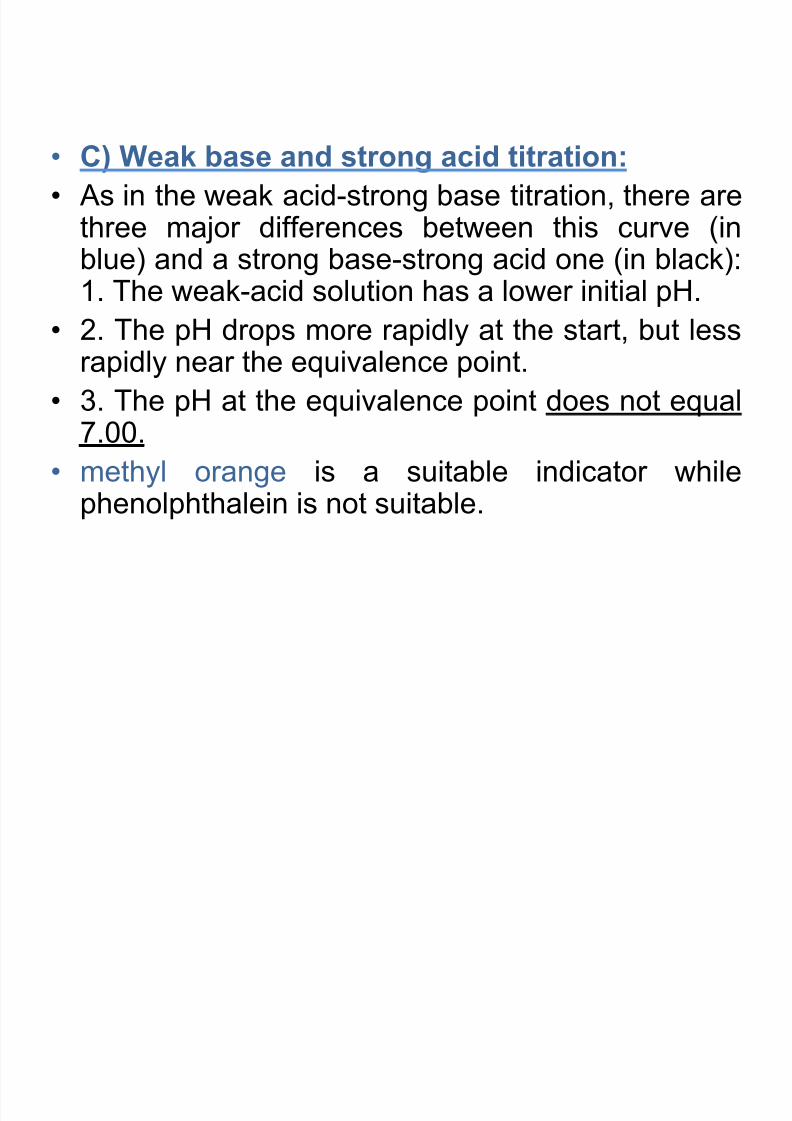
• C) Weak base and strong acid titration:
• As in the weak acid-strong base titration, there arethree major differences between this curve (inblue) and a strong base-strong acid one (in black):1. The weak-acid solution has a lower initial pH.
• 2. The pH drops more rapidly at the start, but lessrapidly near the equivalence point.
•3. The pH at the equivalence point does not equal7.00.
• methyl orange is a suitable indicator whilephenolphthalein is not suitable.

8/13/2019 Experiment 1 Part 2.Pptxcls 231new
http://slidepdf.com/reader/full/experiment-1-part-2pptxcls-231new 16/24
8/13/2019 Experiment 1 Part 2.Pptxcls 231new
http://slidepdf.com/reader/full/experiment-1-part-2pptxcls-231new 17/24
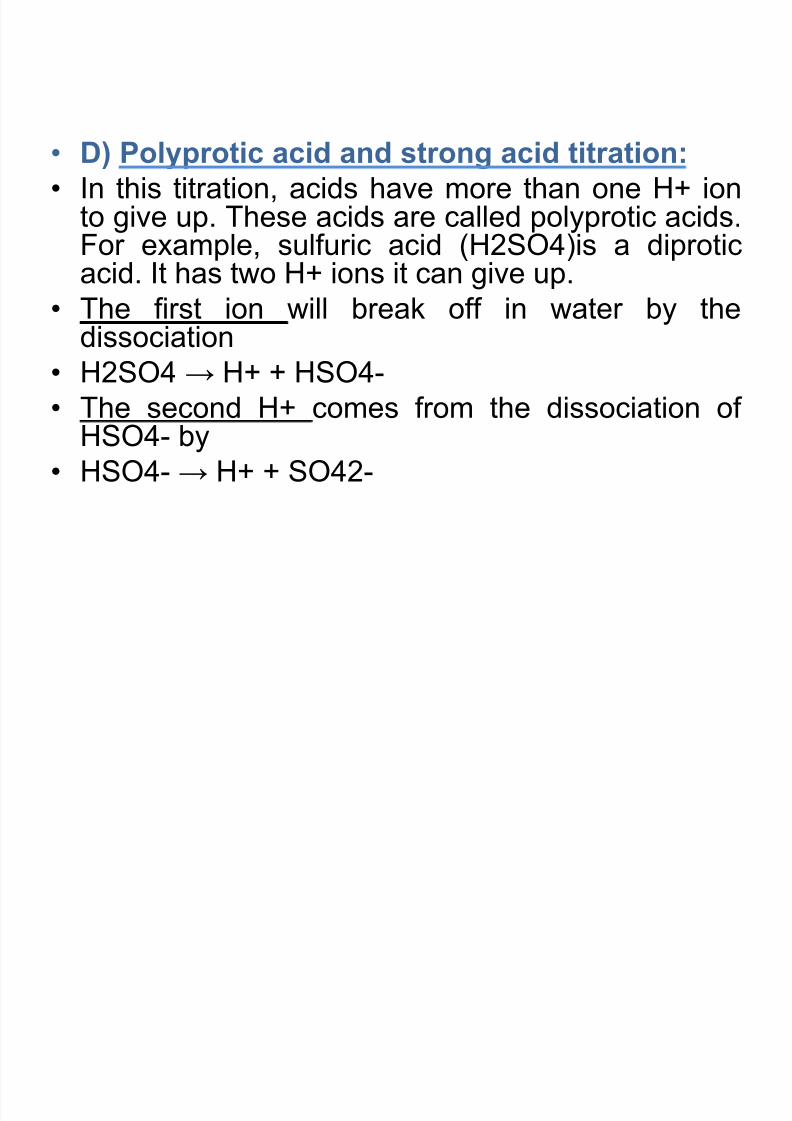
• D) Polyprotic acid and strong acid titration:
• In this titration, acids have more than one H+ ionto give up. These acids are called polyprotic acids.For example, sulfuric acid (H2SO4)is a diprotic
acid. It has two H+ ions it can give up.• The first ion will break off in water by the
dissociation
• H2SO4 → H+ + HSO4-
• The second H+ comes from the dissociation ofHSO4- by
• HSO4- → H+ + SO42-
8/13/2019 Experiment 1 Part 2.Pptxcls 231new
http://slidepdf.com/reader/full/experiment-1-part-2pptxcls-231new 18/24
8/13/2019 Experiment 1 Part 2.Pptxcls 231new
http://slidepdf.com/reader/full/experiment-1-part-2pptxcls-231new 19/24
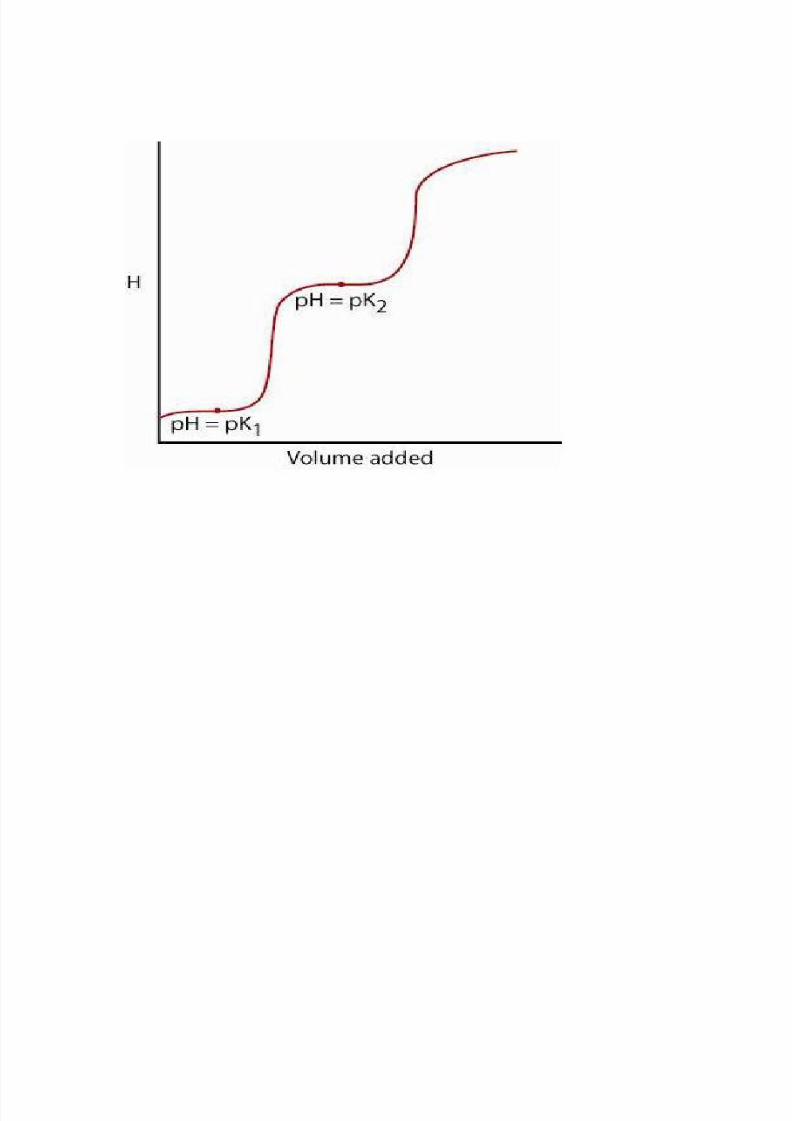
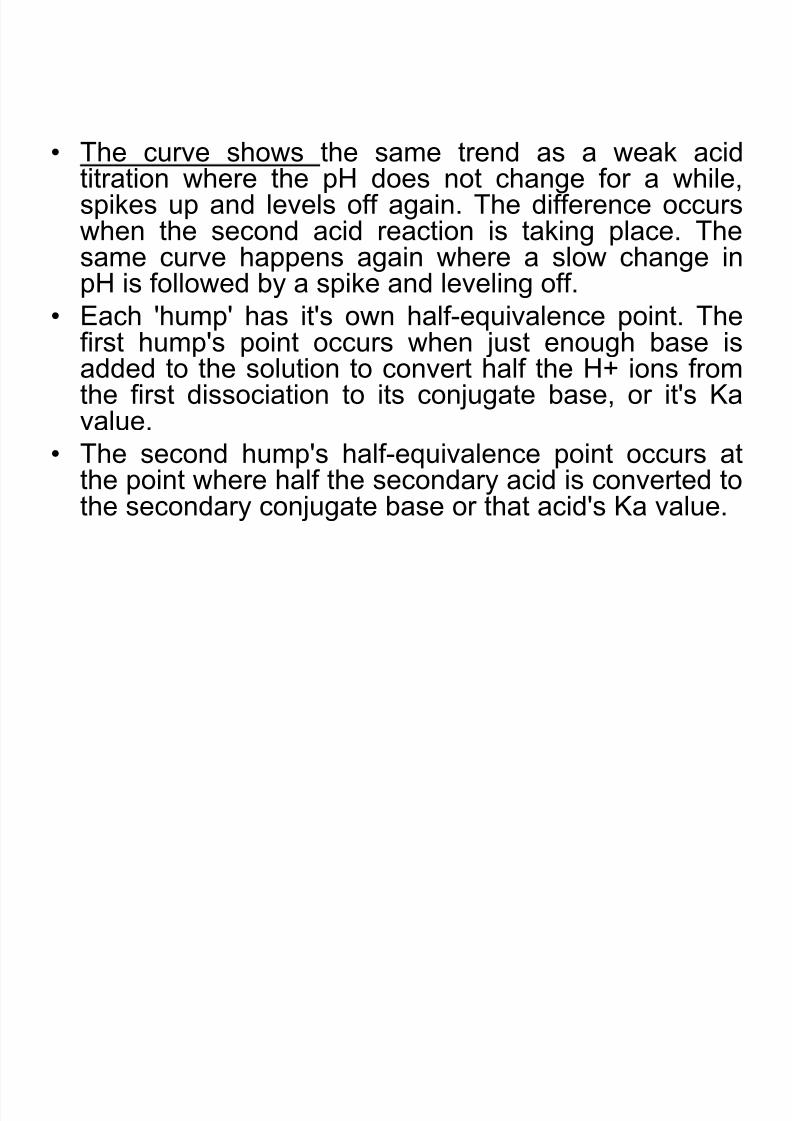
• The curve shows the same trend as a weak acidtitration where the pH does not change for a while,spikes up and levels off again. The difference occurswhen the second acid reaction is taking place. Thesame curve happens again where a slow change in
pH is followed by a spike and leveling off.• Each 'hump' has it's own half-equivalence point. The
first hump's point occurs when just enough base isadded to the solution to convert half the H+ ions fromthe first dissociation to its conjugate base, or it's Ka
value.• The second hump's half-equivalence point occurs at
the point where half the secondary acid is converted tothe secondary conjugate base or that acid's Ka value.

8/13/2019 Experiment 1 Part 2.Pptxcls 231new
http://slidepdf.com/reader/full/experiment-1-part-2pptxcls-231new 20/24
Indicators table

8/13/2019 Experiment 1 Part 2.Pptxcls 231new
http://slidepdf.com/reader/full/experiment-1-part-2pptxcls-231new 21/24
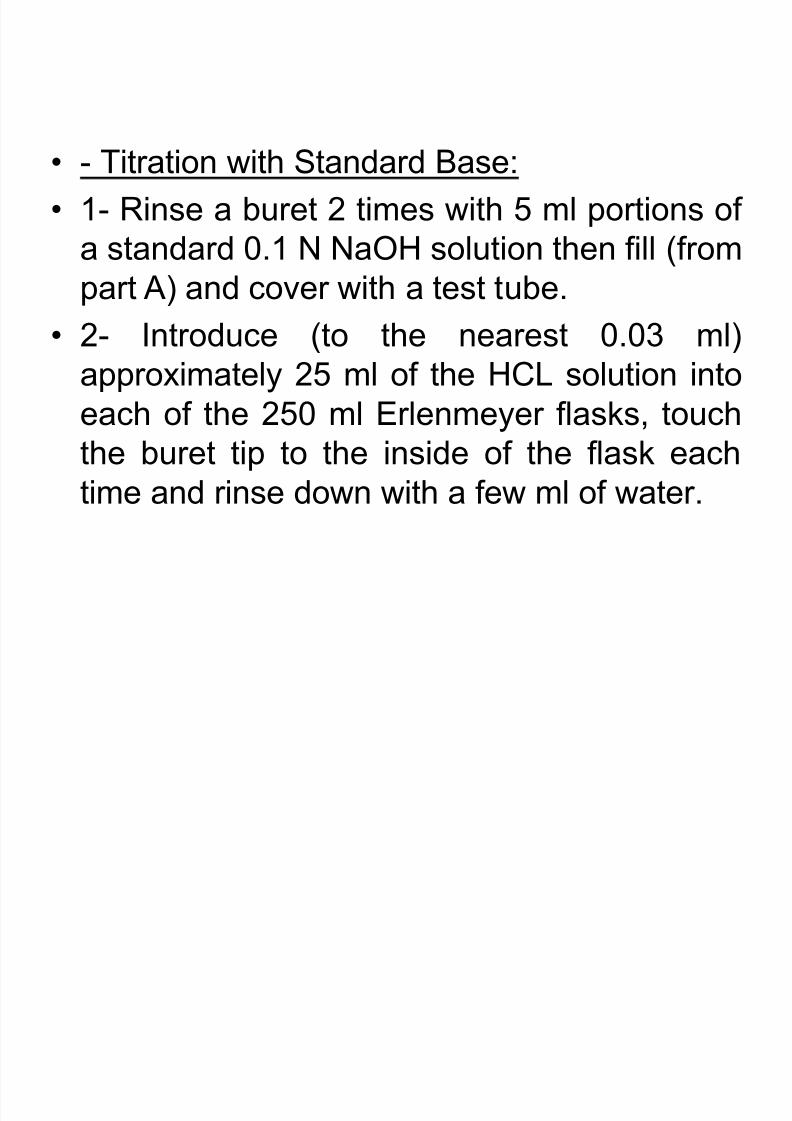
Procedure
• Reagents:
• 1- 0.1 N Hydrochloric Acid (Reagent
Grade).
• 2- Phenolphthalein Indicator (0.5 g in 50
ml ETOH +50 ml H2O).
•
3- Standard NaOH Solution (0.1 N).
8/13/2019 Experiment 1 Part 2.Pptxcls 231new
http://slidepdf.com/reader/full/experiment-1-part-2pptxcls-231new 22/24
8/13/2019 Experiment 1 Part 2.Pptxcls 231new
http://slidepdf.com/reader/full/experiment-1-part-2pptxcls-231new 23/24
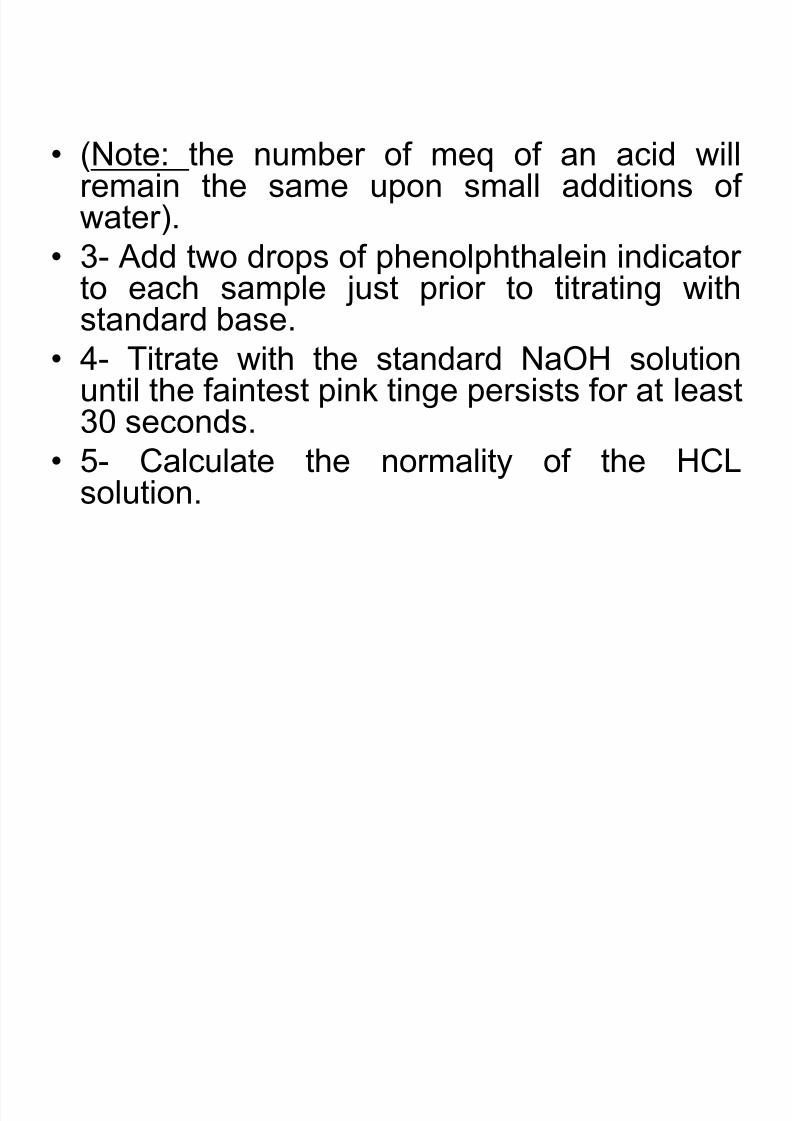
• (Note: the number of meq of an acid willremain the same upon small additions ofwater).
• 3- Add two drops of phenolphthalein indicatorto each sample just prior to titrating withstandard base.
• 4- Titrate with the standard NaOH solutionuntil the faintest pink tinge persists for at least
30 seconds.• 5- Calculate the normality of the HCL
solution.

8/13/2019 Experiment 1 Part 2.Pptxcls 231new
http://slidepdf.com/reader/full/experiment-1-part-2pptxcls-231new 24/24
Calculation
• HCl(aq) + NaOH(aq) NaCl(aq) + H2O
• 1 mole 1 mole
• (36.5 grams) (40.0 grams)
• Meq HCL = Meq NaOH
• V (ml) HCL * N HCL = V (ml) NaOH * N NaOH
• N HCL = V (ml) NaOH * N NaOH /V (ml) HCL