experiment 7 - university of texas at...
TRANSCRIPT

Experiment 7 Synthesis and Analysis uff
those Same Green Crystals what we made two weeks ago
Part 3: Spectrophotometric Determination of Iron Content
CH 204 Fall 2009 Dr. Brian Anderson

Last week Redox Chemistry
Oxidation – loss of electrons Reduction – gain of electrons Balancing redox reactions Titration with KMnO 4 and reaction stoichiometry

Experiment 7 in a nutshell Convert our green crystals into an orange solution, Fe(phen) 3
2+ , then use a spectrophotometer to measure how much light this
solution absorbs at 510 nm.
Then compare the absorbance of our sample to the absorbances of some solutions that we know the concentration of to determine
how much Fe(phen) 3 2+ is in our solution.

The Plan for Today It’s a long experiment, but you can finish faster
by doing the procedure out of order:
Part 1 (free up Fe 2+ from sample) Part 2 (make up standard solution) Finish Part 1, start Part 4 (make up sample solution) Do Part 3 (measure absorbance of standards) Finish Part 4 (measure absorbance of sample)

Lab Procedure, Part 1 1. Weigh out 0.15 g of green crystals and dissolve in deionized
H 2 O. Transfer the dissolved sample to a 25 mL volumetric flask. Dissolve it right there in the weighing boat!
2. Add 8 mL of 6 M H 2 SO 4 , and fill to the line with deionized water using a disposable pipette.
Your sample is now dissolved in 25 mL of solution.

Part 1, continued... 3-4. Pipet 5 mL into a 30 mL beaker, add about 10 mL
deionized water, start heating.
5. Add KMnO 4 dropwise until the solution turns light pink. This might take about 50-60 drops.
6-8. Transfer the solution to a clean 25 mL volumetric flask. (When you top off the flask in step 9, you will have done a 1 to 5 dilution.)
Go to Part 2 while the warm sample cools off.
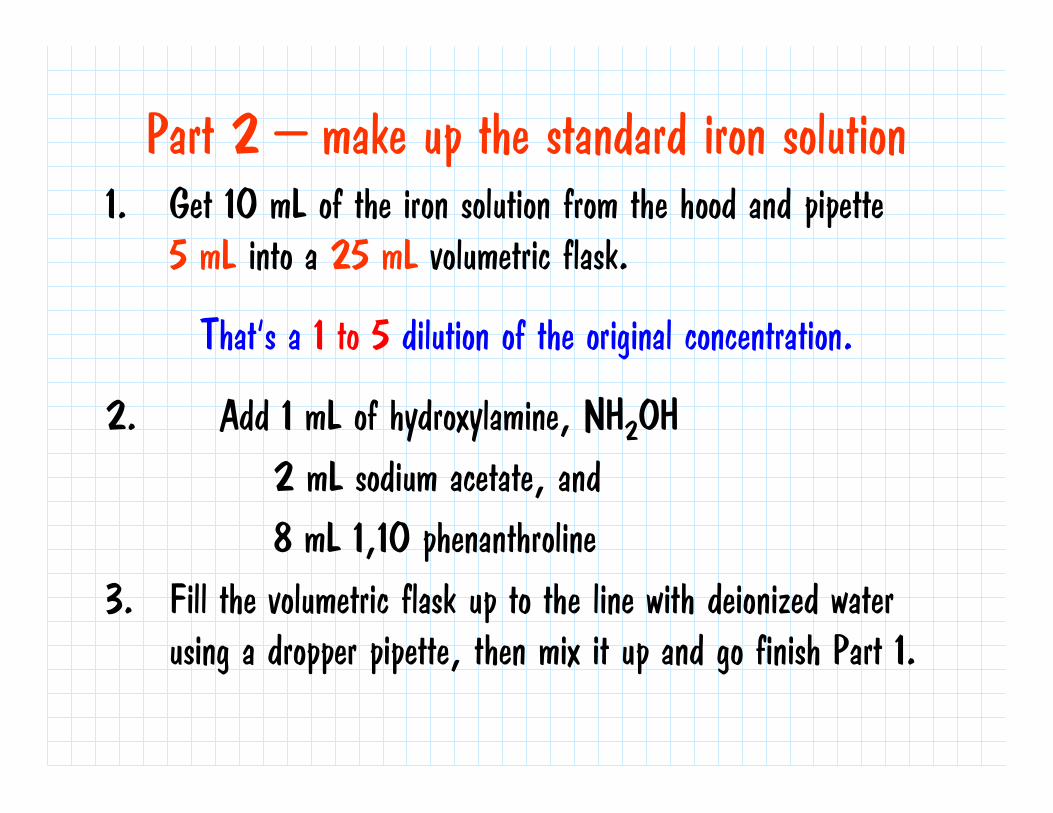
Part 2 – make up the standard iron solution 1. Get 10 mL of the iron solution from the hood and pipette
5 mL into a 25 mL volumetric flask.
That’s a 1 to 5 dilution of the original concentration.
2. Add 1 mL of hydroxylamine, NH 2 OH 2 mL sodium acetate, and 8 mL 1,10 phenanthroline
3. Fill the volumetric flask up to the line with deionized water using a dropper pipette, then mix it up and go finish Part 1.

The Iron Solution in the Hood
Is 0.0187 grams of Fe per liter
Convert that to moles/liter before doing any calculations with it.

Finish Part 1 9. The sample has cooled off in a 25 ml volumetric
flask, and needs to be filled to the mark.
Remember, the sample has now been diluted 1 to 5 from the original concentration.
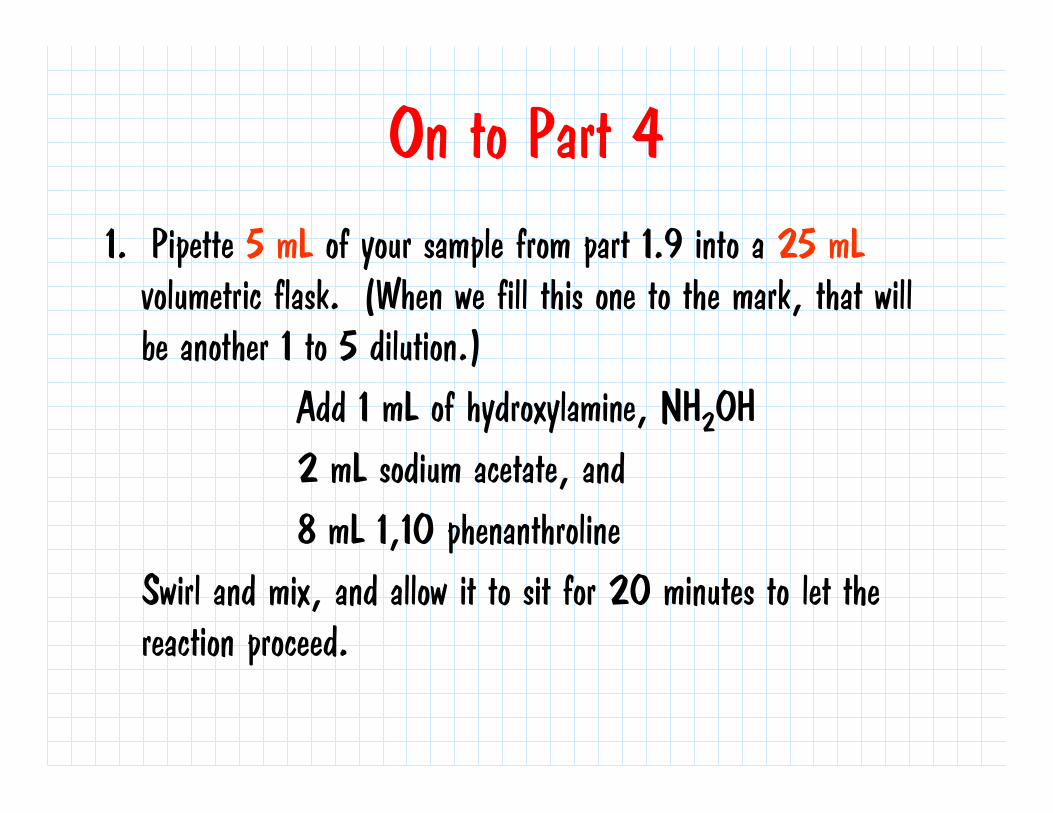
On to Part 4 1. Pipette 5 mL of your sample from part 1.9 into a 25 mL
volumetric flask. (When we fill this one to the mark, that will be another 1 to 5 dilution.)
Add 1 mL of hydroxylamine, NH 2 OH 2 mL sodium acetate, and 8 mL 1,10 phenanthroline
Swirl and mix, and allow it to sit for 20 minutes to let the reaction proceed.

After 20 minutes is up...
...FILL THE SAMPLE FLASK TO THE MARK WITH PHENANTHROLINE!!!
In Part 2 (making the standard) you used water. In Part 4 (working with your sample) use phenanthroline
to fill up the 25 ml volumetric flask.

Part 3 – Make Individual Standards
1. Get five test tubes and label them 1, 2, 3, 4, 5. Write directly on the glass with your marker.
Using a plastic syringe, add that many milliliters of the orange solution that you prepared in Part 2 to each test tube.
Using a plastic syringe again, fill each test tube to 5 mL total by adding 4, 3, 2, 1, and 0 mL of deionized water to test tubes 1-5 respectively.
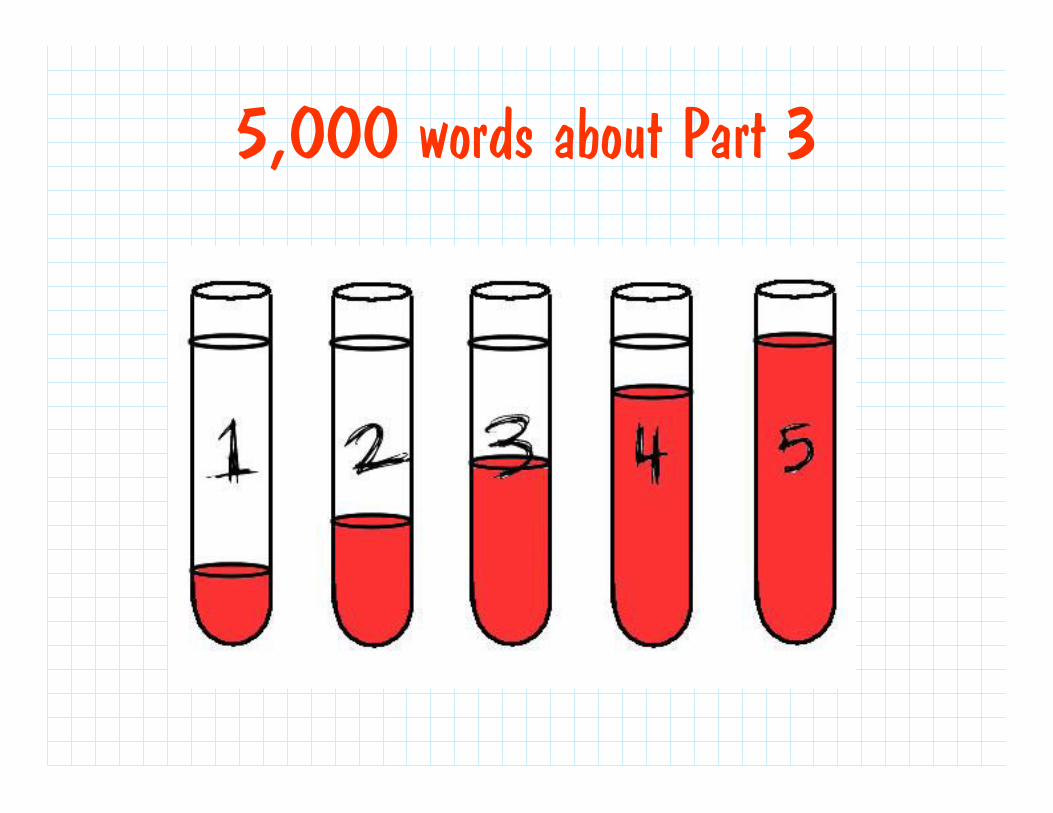
5,000 words about Part 3
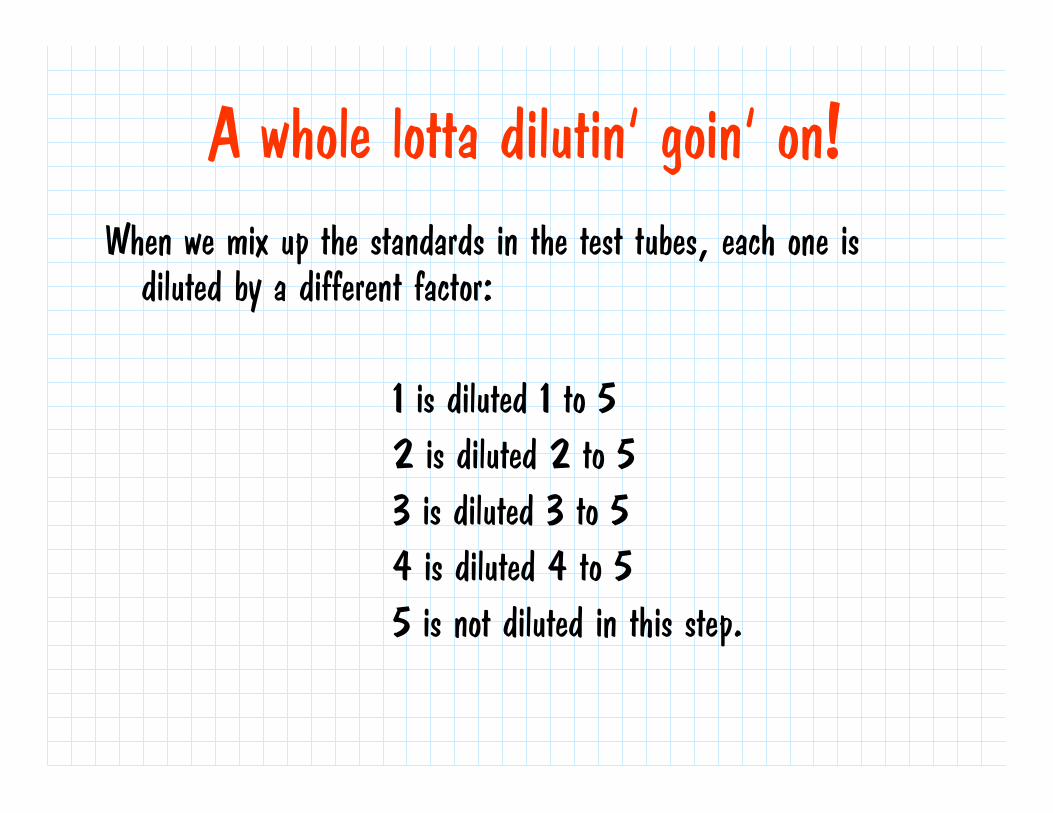
A whole lotta dilutin’ goin’ on! When we mix up the standards in the test tubes, each one is
diluted by a different factor:
1 is diluted 1 to 5 2 is diluted 2 to 5 3 is diluted 3 to 5 4 is diluted 4 to 5 5 is not diluted in this step.
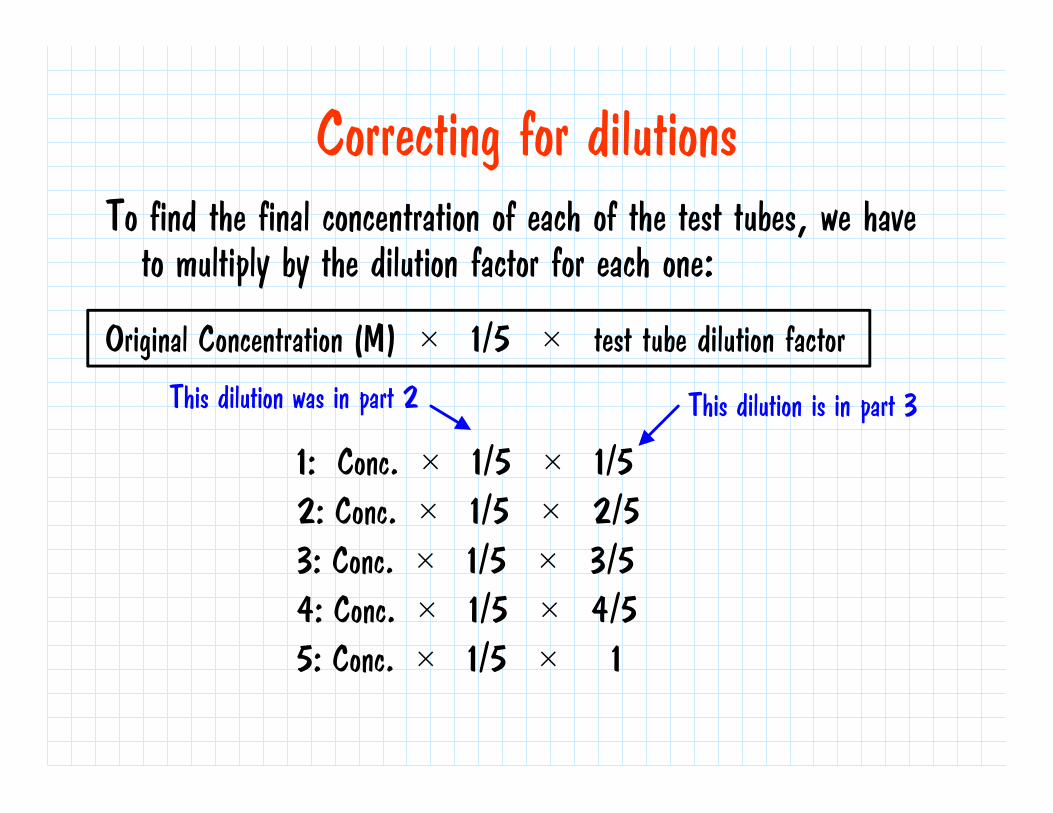
Correcting for dilutions To find the final concentration of each of the test tubes, we have
to multiply by the dilution factor for each one:
Original Concentration (M) × 1/5 × test tube dilution factor
1: Conc. × 1/5 × 1/5 2: Conc. × 1/5 × 2/5 3: Conc. × 1/5 × 3/5 4: Conc. × 1/5 × 4/5 5: Conc. × 1/5 × 1
This dilution was in part 2 This dilution is in part 3

Spectrophotometry! Spectrophotometers are the most widely used analytical instruments in the world except for the analytical balance, and they’re about as easy to use as an analytical balance.
“But what does a spectrophotometer look like?” you are wondering, “Und how does it work?”
I’m glad you asked!

Looks like this

Works like this
Anything that is colored has color because it absorbs some wavelength (or wavelengths) of visible light.
absorbance units

Using the spectrophotometer Place a cuvette full of deionized water into the instrument.
This is your blank. Press the button that says 0 ABS.
Remove the blank and put in a cuvette containing your first standard. The display will automatically read out the absorbance. Record this value.

Lather, Rinse, Repeat Repeat this procedure for each of your standards and your
sample. Insert the blank before each measurement to make sure the
blank reads 0 absorbance units, then insert the next sample.
2 cuvettes to a customer! Reuse the sample cuvette!

How not to screw up this part 1) Rinse the cuvette twice with the sample you are about to
measure before you put it in the instrument 2) Wipe the outside of the cuvette clean using Kim-Wipes. No
fingerprints, no wetness on the outside. 3) No bubbles in the solution. 4) Fill the cuvettes at least 3/4 of the way up.
But what do these absorbance values tell us?
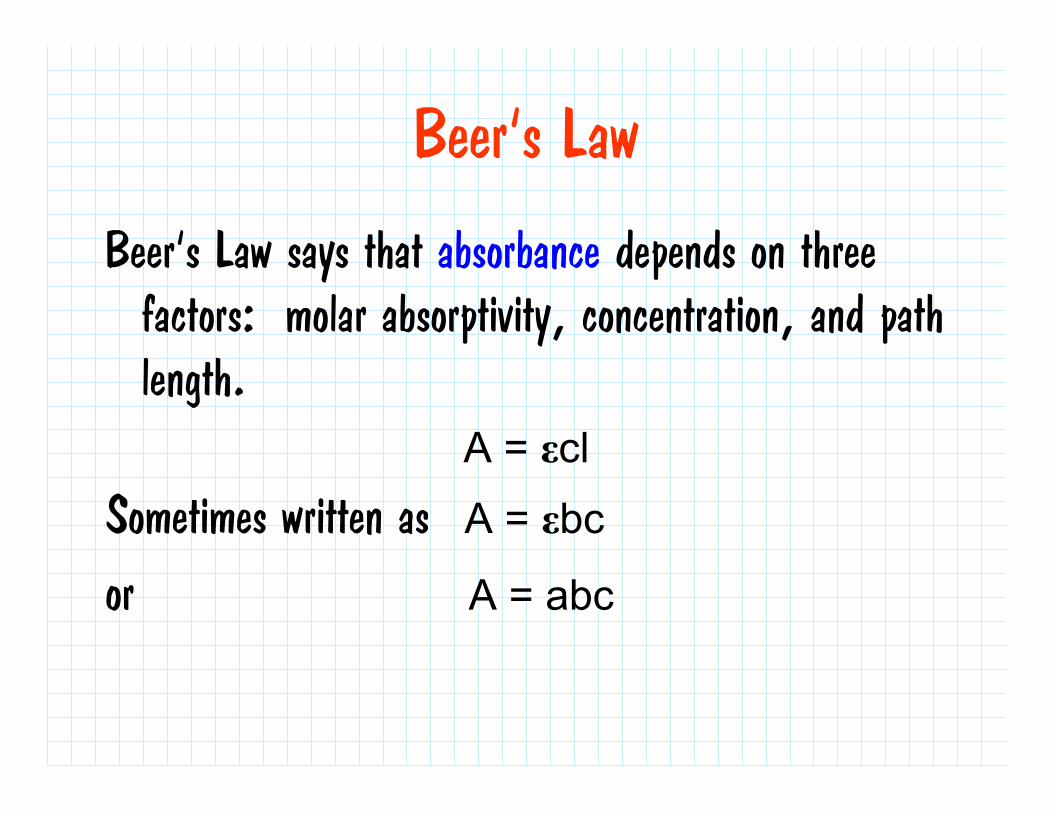
Beer’s Law
Beer’s Law says that absorbance depends on three factors: molar absorptivity, concentration, and path length.
A = εcl
Sometimes written as A = εbc or A = abc

Beer’s Law plots When we plot Absorbance versus Concentration, the slope of
the line is equal to εl. In our case l = 1, so the slope of the line is equal to the molar absorptivity for Fe(phen) 3 2+ .

After you have your data Enter the absorbance and concentration values into Excel.
Plot Absorbance (y-axis) versus concentration (x-axis). Include 0,0 as a data point – that is your blank – and set the intercept equal to zero.
You should get a straight line, and the slope of the line is your molar absorptivity, ε, in units of M -1 cm -1 . Have Excel display the equation for the line on the graph.

Determining Sample Concentration When you have your sample absorbance, use A = εcl to calculate concentration.
Then back-calculate through all the dilutions you made in order to figure out the original concentration in the first 25 ml flask you started with.

Zwei Important Warnings! 1) Make all sample dilutions 5 to 25 ml, and every time you make a
dilution write it down in your notebook. Every single time! * Part 1, step 9 * Part 4, step 1
Plus as many dilutions as necessary in Part 4 step 2
2) Record every absorbance measurement you get, even if it is out of range. Record every single one!

Looking ahead • The final three labs (Thermochemistry, Kinetics, Acid-
Base Equilibria) will be done in pairs. • Experiment 8 is NOT the one in the lab manual. Take a
handout today in class.
• Pre-Lab 8 is longer than previous pre-labs. • Start on this EARLY! Be finished by Friday if possible.

Final Exam – Part 6 of 9
Two-thirds done with the final exam!
Next week’s quiz covers dilutions, spectrophotometry, and Beer’s Law. Nothing about percent transmittance.