experimental analysis of the vibrational characteristics ... · pdf filejournal of sound and...
TRANSCRIPT

Journal of Sound and Vibration (1979) 63(3), 351-376
EXPERIMENTAL ANALYSIS OF THE VIBRATIONAL CHARACTERISTICS OF THE HUMAN SKULL
T. B. KHALIL ANL> D. C.VIANO
Biomedical Science Department
AND
D. L. SMITH
Fluid Dynamics Research Department, General Motors Research Laboratories, Warren, Michigan 48090, U.S.A.
(Received 26 July 1978, and in revisedform 24 October 1978)
Analytical models of the human skull structure have generally been constructed so as to characterize the gross geometric features and material properties; however, a model should also have accurate frequency response characteristics since these are essential for collision and head injury analyses. An experimental investigation was conducted to identify the dynamic characteristics of freely vibrating human skulls. Resonant frequencies and associ- ated mode shapes in the frequency band from 20 Hz to 5000 Hz were dehneated for two dry human skulls. Osteometrically, one skull corresponds to a 50th percentile male (skull 1) and the second is representative of a 5th percentile female skull (skull 2). Digital Fourier analysis techniques were used to identify the resonant frequencies and corresponding mode shapes of each skull. Eleven resonant frequencies were identified for skull 1, with the lowest being 1385 Hz. In contrast, skull 2 exhibited only 6 resonant frequencies with the first being 1641 Hz. Nine mode shapes were identified for skull I, but only 5 modes were recognized for skull 2. The vibrational pattern of the human skull, as indicated by its mode shapes in this limited study, seems to be a unique property of a particular skull. Skull satures did not appear to influence the modal pattern.
1. INTRODUCTION
Mathematical modeling of the physical processes leading to head injuries has received considerable attention in recent years. This is evidenced by the number of publications at various levels of sophistication concerned with different facets of head injury. Basically, all head models are constructed for the purpose of attempting to determine the dynamic response of a head-like structure subjected to an external blow. Eventually, the mechanical response is correlated with histopathological findings obtained from experiments with animals and cadavers, and/or from accident investigations in order to determine possible head trauma mechanisms. Various injury mechanisms have been hypothesized for the different head tissues. For a brief account of injury mechanisms and mathematical modeling of head response due to impact loading the reader may wish to refer to the work of Khalil and Hubbard [I].
The complexity of the human skull structure with its many ridges, sutures and irregulari- ties presents an extremely difficult task to one wishing to make a detailed head injury simulation by mathematical modeling. Therefore, geometrical approximations (e.g., spherical shells) are typically used for analytical investigations. While it is true that a model does not necessarily have to encompass all of the details of the human head, it should
351 0022-460X/79/070351 +26 $02/00/O 0 1979 Academic Press Inc. (London) Limlted

352 T. B. KHALIL, D. C. VIANO AND 1). L. SMITH
exhibit the main features. To date, analytical models [1] have represented the human head to the extent of including gross geometric and material characteristics. An equally important property of a credible model is that it must have a frequency response similar to an actual head. This is especially important because head injury cases typically result from the collision of the head with another object. Forces resulting from the application of external blows to the head are, in general, of short duration (1 to 20 ms) and most probably give rise to a vibrational response superimposed on a rigid body motion of the whole head.
Various investigators [2-51 have performed vibrational experiments on human volun- teers, cadaver heads, and sub-human primates in addition to dry human skull prepara- tions (empty and gelatin filled). All of these investigations centered around evaluating the mechanical impedance characteristics of the head and the lowest two resonant frequencies. No attempts were made to characterize higher frequencies and associated mode shapes. The techniques by which these experimental driving point motions were applied to the skull and the arbitrary boundary conditions which were applied to support the head raise some doubts about the accuracy and validity of the results in relation to the results for a freely supported head.
BCkCsy in 1948 [2] t investigated the vibrational response of a human head in sound fields in an attempt to understand the mechanisms of sound conduction in skull bones. The skull motion was monitored at two locations in the frontal and occipital regions by means of two transducers. l3ektsy noted a change in phase between movements of the front and back of the head at 1800 Hz and thereby reasoned this to be the first resonant frequency of the skull. Later, in 1951 [3], based on head vibration experiments resulting from head contact with a vibrating piston, I%k:ktsy reported two resonant frequencies for the skull, 800 and 1600 Hz. No explanation is provided for the difference in resonant frequency. It is conceivable that the resonant frequency reported in the first paper is actually the second resonant frequency.
Franke [4], utilizing a vibrating piston which was maintained in firm contact with the frontal bone of a dry human skull while the occipital bone was mounted against a small rigid support, determined that the lowest resonant frequency is approximately 800 Hz. When the same experiment was repeated with the skull filled with gelatin the lowest resonant frequency was reduced to 500 Hz. In a similar manner cadaver heads were tested after removing the skin. Two resonant frequencies were noted: a highly damped resonant frequency at 600 Hz and another resonant frequency at approximately 900 Hz. In addition the author reported that the phase velocity of the bending wave over the dry skull surface is approximately 125 m/s.
Hodgson et al. [S] conducted a mechanical impedance analysis of vibration data obtained from a cadaver head when it was driven freely by clamping a vibrating piston directly to the skull. Two resonant frequencies were reported, 360 Hz and 950 Hz. Gurdjian et al. [6] tested cadaver heads and human volunteers utilizing mechanical impedance tech- niques. Three resonant frequencies were reported for the cadaver head: 3 13,600 and 880 Hz. The human volunteer’s head-skull resonant frequencies were slightly different from those of the cadaver with the difference not exceeding 7 %. Also, the lowest resonant frequency of an empty cadaver skull was reported to be 400 Hz.
Stalnaker et al. [7] utilized an electromagnetic shaker to determine the resonant fre- quencies of a fresh unembalmed cadaver head. The shaker was rigidly attached to the parietal bone and the response was monitored by a miniature accelerometer attached to the opposite parietal bone. Two resonant frequencies, 166 and 820 Hz, were estimated from the mechanical impedance analysis of the data. Removal of the scalp and cranium con- tents did not significantly affect the resonant frequencies. However, the amount of damping, estimated from a mathematical analysis of the data, was reduced by a factor of two.
VIBRATIONAL CHARACTERISTICS 01 THE SKULL 353
A determination of resonances in the human head has also been made by using mathe- matical models. Two spherical models of interest are those of Engin [8] and of Hickling and Wenner [9]. Engin’s model consists of an elastic spherical shell either empty or tilled with an inviscid liquid. Hickling and Wenner’s model includes viscoelastic properties of the bone and brain material and has a three-dimensional treatment of the skull that allows boundary conditions to be applied independently on both the inner and outer surfaces. The first and second resonant frequencies predicted by this latter model for a shell of outer radius 7.9 cm and inner radius 7.4 cm were 1535 Hz and 1990 Hz, respectively.
In a different vein, Nickel1 and Marcal in 1974 [IO] used a finite element model to determine the resonant frequencies and mode shapes of a human skull. The analysis was conducted for three different boundary conditions: frontal support, occipital support, and support at the skull base. Four resonant frequencies and associated mode shapes were identified for each of the boundary conditions. The resonant frequencies obtained for the frontal support boundary condition are 86,231,458, and 864 Hz. For the occipital support condition the resonant frequencies were found to be close to those frequencies obtained when the skull was supported at the frontal region with the difference being not more than 2075. Resonant frequencies obtained when the skull was supported at the base were found to be higher by over a factor of two.
In the present investigation a new experimental method was used to identify the dynamic characteristics (resonant frequencies and mode shapes) of the human skull. The advent of minicomputer-based laboratory equipment such as the Hewlett-Packard Fourier Analyzer Model 5453B has provided a powerful tool for the modal analysis of structures. This technique appears to be well suited for biomechanical research. An impulsive excitation covering a range of frequencies is employed and the resulting response of the structure can usually be analyzed to determine the first several vibrational modes at one time. In addition to finding the resonant frequencies, the minicomputer-based system can present an animated display of individual mode shapes so that an immediate understanding is pro- vided of the characteristics of each mode.
It is believed that the results of the current study will contribute to (i) better understand- mg of head injury mechanisms and their relationship to the structural dynamics of the human skull, (ii) development of improved analytical head models that are more capable of predicting head trauma, (iii) understanding of hearing mechanisms by conduction of sound in skull bones and (iv) an increase in knowledge of the dynamic characteristics of skeletal bone.
2. DIGITAL FOURIER ANALYSIS TECHNIQUES FOR MODAL ANALYSIS
Modal analysis is a process by which the dynamic characteristics of an elastic medium such as the resonant frequencies and mode shapes are determined from measurements of the transfer function. Digital post-processing of the identified transfer function to delineate modal parameters of discrete systems is will documented [ 111.
To determine experimentally the dynamic characteristics of a structure over a defined frequency spectrum, a digital Fourier analysis system can be utilized. The structure can be excited by applying a localized impact at a single point. All vibrational modes in the bandwidth of the input impulse will be simultaneously excited. The output at another point x on the structure can be monitored by an accelerometer. From the input and output signals, the frequency response function is obtained. In theory, the frequency response function is obtained by dividing the Fourier transform of the acceleration signal (output) by the Fourier transform of the force signal (input). In practice. the Fourier transfer func-

354 T. B. KHALIL, II. C. VIANO AND 0. L. SMITH
tion is calculated from the quotient of the force-acceleration cross power spectrum and the force auto power spectrum. Having determined the frequency response function in the complex frequency domain, the resonant frequencies (eigenvalues) can be obtained from the relative maxima of the imaginary component of the transfer function. Following that. by invoking Betti’s reciprocal theorem, the corresponding mode shapes (eigenvectors) can be obtained by applying impulse loads at a selected number of points of the structure.
3. EXPERIMENT
Two dry skull preparations were utilized in this study. Osteometric measurements of the first skull (skull 1) were found to correspond approximately to those of the 50th percentile adult male. Dimensions of the second skull (skull 2) were noted to be similar to those of the 5th percentile adult female. Prior to testing, the skulls were coated with India ink and a grid was inscribed on the calvarium surface of each skull (see Figure 1). A curvilinear co- ordinate system was established (see Figure 1) on the skull surface with its origin at the nasion.
Figure 1. Skull grid points.
VIBRATIONAL CHARACTERISTICS OF THE SKULL 355
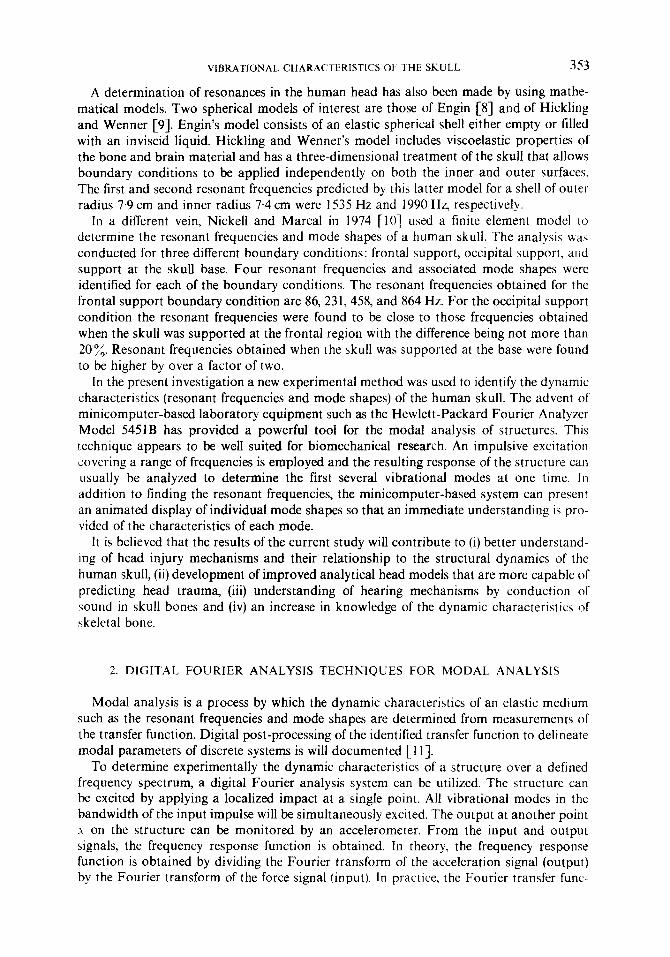
A schematic of the experimental setup is shown in Figure 2. During testing, the skull was supported on a 5 cm thick soft rubber foam slab to provide for a free support condition. Also, the mandible was removed because of its loose coupling to the skull. To measure the transfer function of the skull by digital Fourier analysis it was necessary to monitor an input and the subsequent response signal in the time domain. Fourier transform of the signals and then conceptually dividing the complex valued transform of the output by the transform of the input yield the transfer function.
Figure 2. Schematic of experimental set-up.
The skull was excited by a transient force which was applied normal to the calvarium surface by a hand-held hammer. The impact force F(t) was monitored by a load cell (Brtiel and Kjaer No. 8200) attached to the hammer head. The frequency response of the load cell is in the range of 20 Hz to 70 kHz. During testing the power spectrum of the input was checked to ensure that enough energy was available to excite the skull in the frequency range of 20 to 5000 Hz. The power spectrum of the input signal depends upon the shape.
356 T. B. RHALIL, D. C. VIANO AND 1). L. SMITH
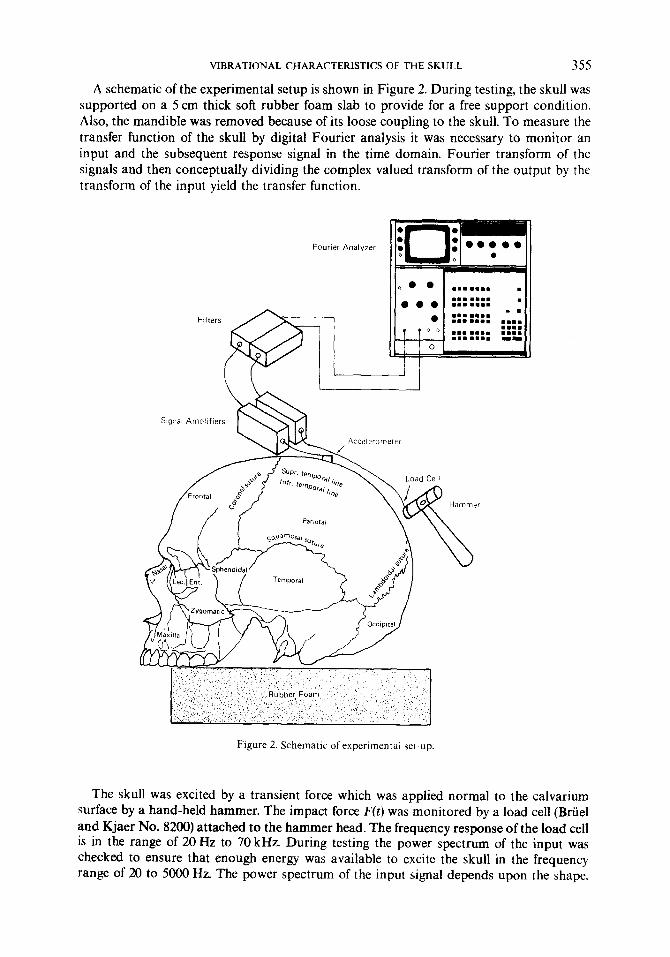
material, and diameter of the impacting hammer. In this study the hammer head used is 1.25 cm diameter (steel) with a flat surface. A typical force input and its power spectrum is presented in Figure 3.
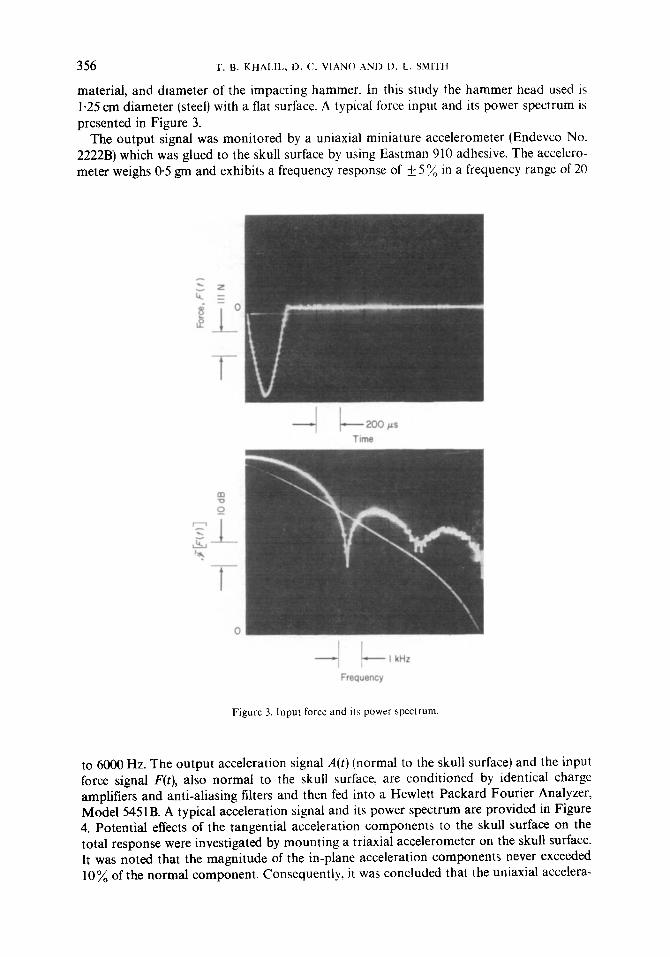
The output signal was monitored by a uniaxial miniature accelerometer (Endevco No. 2222B) which was glued to the skull surface by using Eastman 910 adhesive. The accelero- meter weighs 05 gm and exhibits a frequency response of + 5 % in a frequency range of 20
Frequency
Figure 3. Input force and its power spectrum.
to 6000 Hz. The output acceleratton signal A(t) (normal to the skull surface) and the input force signal F(t), also normal to the skull surface, are conditioned by identical charge amplifiers and anti-aliasing filters and then fed into a Hewlett Packard Fourier Analyzer, Model 5451B. A typical acceleration signal and its power spectrum are provided in Figure 4. Potential effects of the tangential acceleration components to the skull surface on the total response were investigated by mounting a triaxial accelerometer on the skull surface. It was noted that the magnitude of the in-plane acceleration components never exceeded 10% of the normal component. Consequently, it was concluded that the uniaxial accelera-
VIBRATIONAL CHARACTERISTICS OF THE SKULL 357
tion signal in the direction normal to the skull surface was sufftcient to represent the skull response for the purposes of this research.
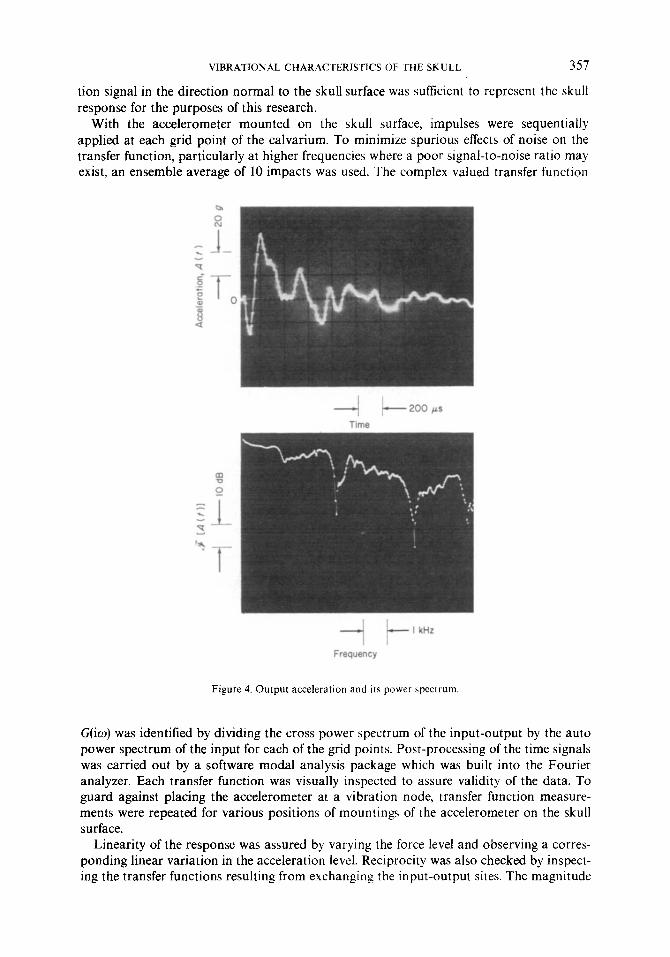
With the accelerometer mounted on the skull surface, impulses were sequentially applied at each grid point of the calvarium. To minimize spurious effects of noise on the transfer function, particularly at higher frequencies where a poor signal-to-noise ratio may exist, an ensemble average of 10 impacts was used. The complex valued transfer function
/-- 200 ps
Time
4 / I kHz
Frequency
Figure 4. Output acceleration and I& power spectrum
G(io) was identified by dividing the cross power spectrum of the input-output by the auto power spectrum of the input for each of the grid points. Post-processing of the time signals was carried out by a software modal analysis package which was built into the Fourier analyzer. Each transfer function was visually inspected to assure validity of the data. To guard against placing the accelerometer at a vibration node, transfer function measure- ments were repeated for various positions of mountings of the accelerometer on the skull surface.
Linearity of the response was assured by varying the force level and observing a corres- ponding linear variation in the acceleration level. Reciprocity was also checked by inspect- ing the transfer functions resulting from exchanging the input-output sites. The magnitude
358 r. B. KHALIL, D. C. VIANO AND D. L. SMITH
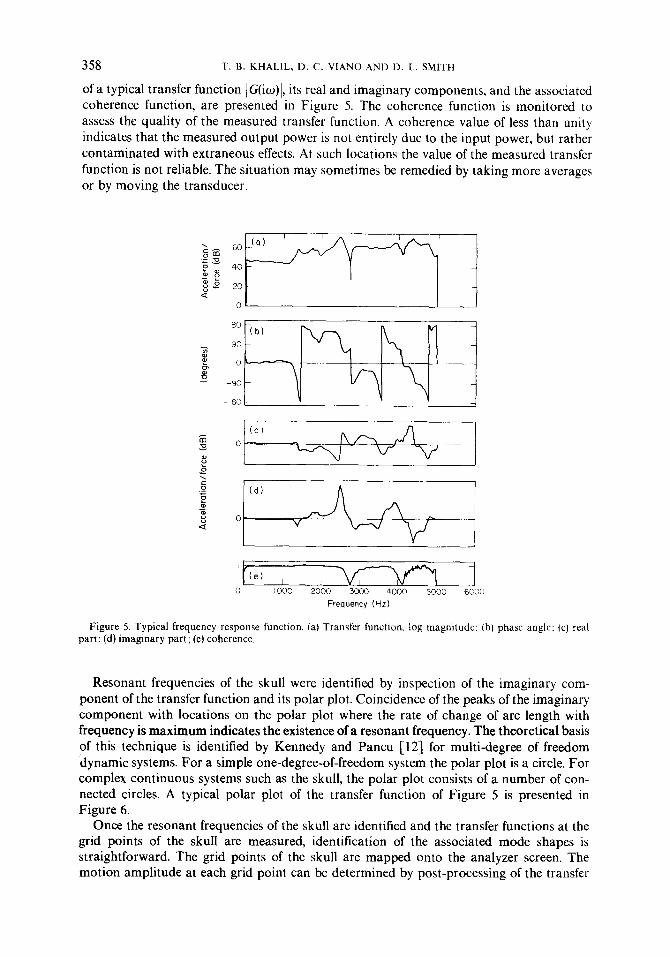
of a typical transfer function 1 G(io)I, its real and imaginary components, and the associated coherence function, are presented in Figure 5. The coherence function is monitored to assess the quality of the measured transfer function. A coherence value of less than unity indicates that the measured output power is not entirely due to the input power, but rather contaminated with extraneous effects. At such locations the value of the measured transfer function is not reliable. The situation may sometimes be remedied by taking more averages or by moving the transducer.
“’ (b) 90 - OL --
I
(e) I 1
0 IO00 2000 3030 4000 5000 6000
Frequency (Hz)
Figure 5. Typical frequency response function. (a) Transfer function, log magnitude: (b) phase angle: (c) real part: (d) imaginary part: (e) coherence.
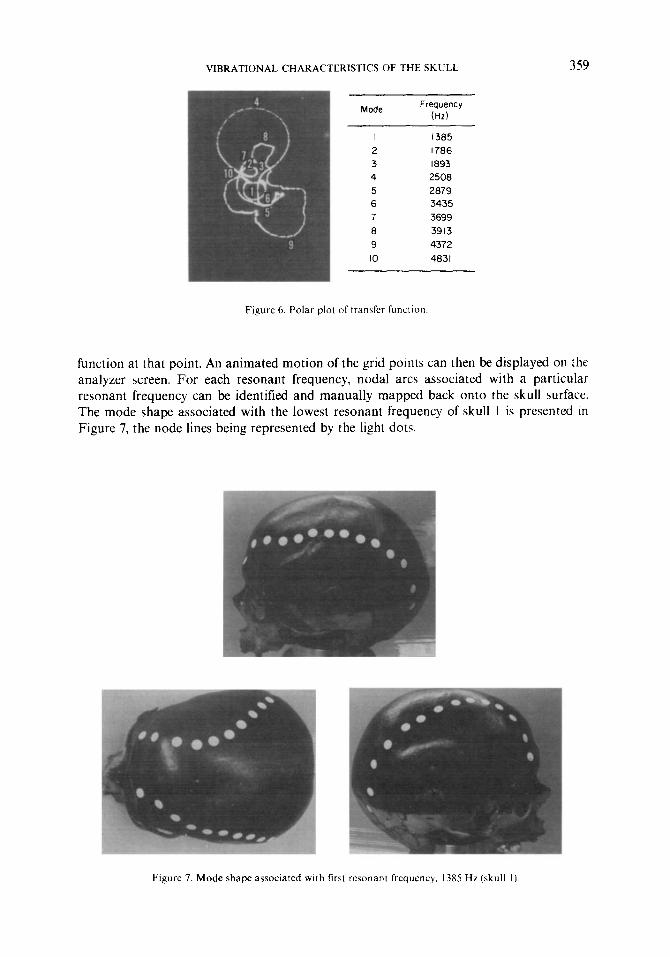
Resonant frequencies of the skull were identified by inspection of the imaginary com- ponent of the transfer function and its polar plot. Coincidence of the peaks of the imaginary component with locations on the polar plot where the rate of change of arc length with frequency is maximum indicates the existence of a resonant frequency. The theoretical basis of this technique is identified by Kennedy and Pancu [12] for multi-degree of freedom dynamic systems. For a simple one-degree-of-freedom system the polar plot is a circle. For complex continuous systems such as the skull, the polar plot consists of a number of con- nected circles. A typical polar plot of the transfer function of Figure 5 is presented in Figure 6.
Once the resonant frequencies of the skull are identified and the transfer functions at the grid points of the skull are measured, identification of the associated mode shapes is straightforward. The grid points of the skull are mapped onto the analyzer screen. The motion amplitude at each grid point can be determined by post-processing of the transfer
VIBRATIONAL CHARACTERISTICS OF THE SKULL 359
Frequency (Hz)
2
3 4
5 6 7
8
9
IO
1385
1786 1893
2508
2879 3435
3699
3913
4372
4831
Figure 6. Polar plot of transfer function
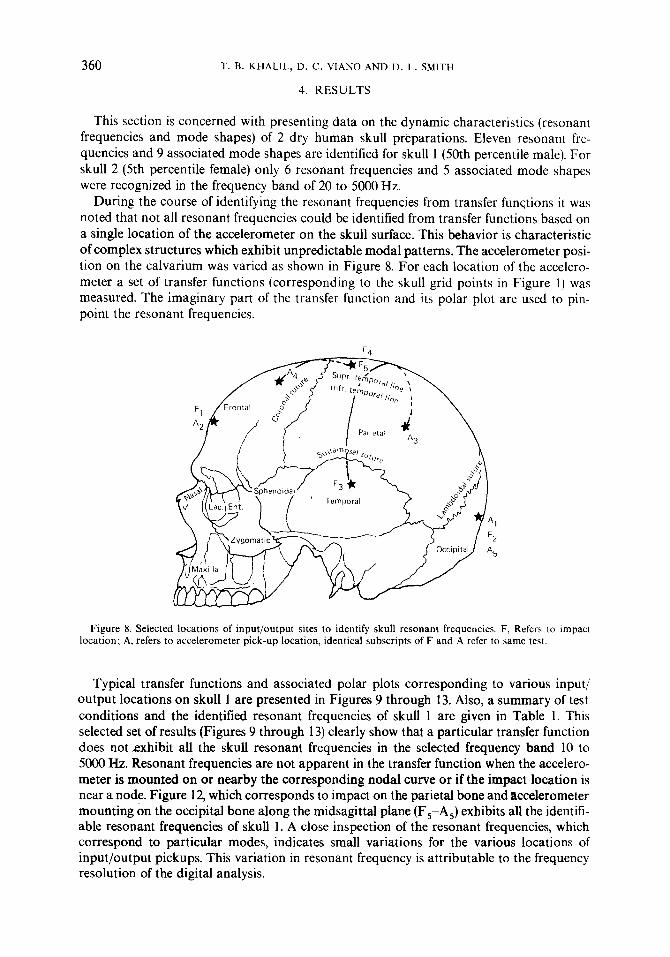
function at that point. An animated motion of the grid points can then be displayed on the analyzer screen. For each resonant frequency, nodal arcs associated with a particular resonant frequency can be identified and manually mapped back onto the skull surface. The mode shape associated with the lowest resonant frequency of skull I is presented in Figure 7, the node lines being represented by the light dots.
Figure 7. Mode shape associated with first resonant frequency. 1385 Hz (skull 1).
360 T. B. KHALL 1). c. VIANO ANI> D. L. SMITH
4. RESULTS
This section is concerned with presenting data on the dynamic characteristics (resonant frequencies and mode shapes) of 2 dry human skull preparations. Eleven resonant fre- quencies and 9 associated mode shapes are identified for skull 1 (50th percentile male). For skull 2 (5th percentile female) only 6 resonant frequencies and 5 associated mode shapes were recognized in the frequency band of 20 to 5000 Hz.
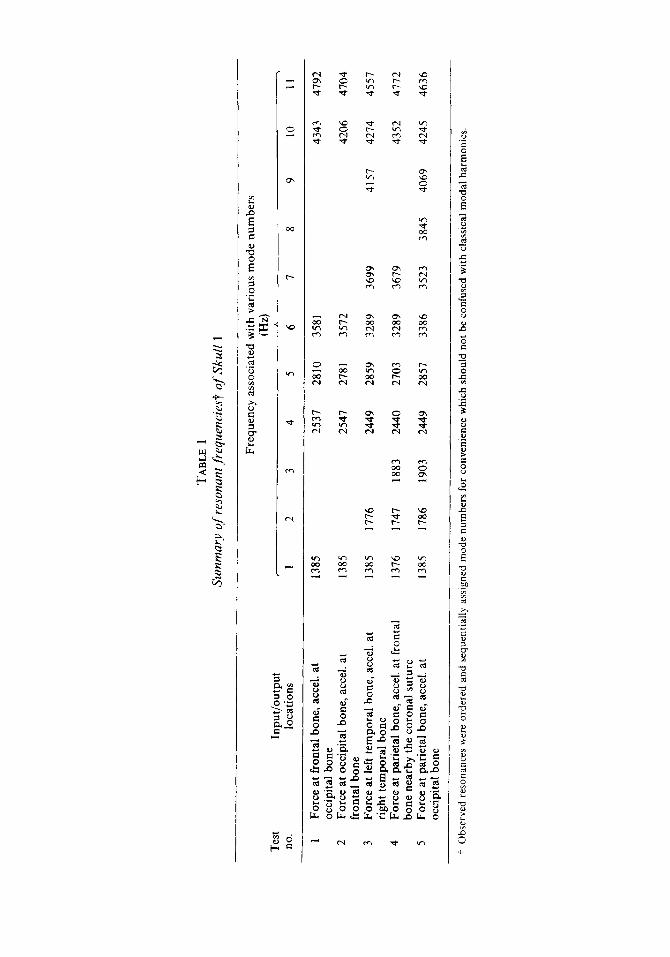
During the course of identifying the resonant frequencies from transfer functions it was noted that not all resonant frequencies could be identified from transfer functions based on a single location of the accelerometer on the skull surface. This behavior is characteristic of complex structures which exhibit unpredictable modal patterns. The accelerometer posi- tion on the calvarium was varied as shown in Figure 8. For each location of the accelero- meter a set of transfer functions (corresponding to the skull grid points in Figure 1) was measured. The imaginary part of the transfer function and its polar plot are used to pin- point the resonant frequencies.
Figure 8. Selected locations of input/output sites to identify skull resonant frequencies. F, Refers to impact location; A, refers to accelerometer pick-up location, identical subscripts of F and A refer to same test.
Typical transfer functions and associated polar plots corresponding to various input/ output locations on skull 1 are presented in Figures 9 through 13. Also, a summary of test conditions and the identified resonant frequencies of skull 1 are given in Table 1. This selected set of results (Figures 9 through 13) clearly show that a particular transfer function does not exhibit all the skull resonant frequencies in the selected frequency band 10 to 5000 Hz. Resonant frequencies are not apparent in the transfer function when the accelero- meter is mounted on or nearby the corresponding nodal curve or if the impact location is near a node. Figure 12, which corresponds to impact on the parietal bone and accelerometer mounting on the occipital bone along the midsagittaf plane (F,-A,) exhibits all the identiti- able resonant frequencies of skull 1. A close inspection of the resonant frequencies, which correspond to particular modes, indicates small variations for the various locations of input/output pickups. This variation in resonant frequency is attributable to the frequency resolution of the digital analysis.

VIBRATIONAL CHARACTERISTICS OF THE SKULL 361
1000 2000 3000 4000 5000 6000
Frequency (Hz)
Mode Frequency
(Hz)
I I395 2 2537 3 2810 4 3580 5 4343 6 4790
Figure 9. Frontal impact-occipital acceleration (skull I).
-T--T--v- -z u P -2 s
.P
B 0
E ._ L_~___i
,000 2000 3000 4000 5000 6000 Frequency (Hz)
Mode Frequency
(Hz)
I I385 2 2547 3 278 I 4 3572 5 4206 6 4704
Figure 10. Occipital impact-frontal acceleration (skull I).

362 T. B. KHALIL, D. C. VIANO AND D. L. SMITH
5000 6000
Mode Frequency
(Hz)
I 1385 2 1776 3 2449 4 2859 5 3289 6 3699 7 4157 8 4274 9 4557
Figure 11 Left temporal impact-right temporal acceleration (skull 1). s---, Five times magnified.
Frequency (Hz)
Mode Frequency
(Hz)
I 1376 2 I747 3 1883 4 2440 5 2703 6 3289 7 3679 a 4352 9 4772
Figure 12. Parietal impact-frontal acceleration (skull I)
TAB
LE
1 Su
mm
ary
of r
eson
ant f
requ
enci
est
of S
kull
1
Freq
uenc
y as
soci
ated
w
ith
vario
us
mod
e nu
mbe
rs
(Hz)
Te
st
Inpu
t/out
put
,
no.
loca
tions
I
2 3
4 5
6 1
8 9
10
II
1 Fo
rce
at f
ront
al
bone
, ac
cel.
at
1385
25
37
2810
35
81
4343
47
92
occi
pita
l bo
ne
2 Fo
rce
at o
ccip
ital
bone
, ac
cel.
at
1385
25
47
2781
35
72
4206
47
04
fron
tal
bone
3
Forc
e at
lef
t te
mpo
ral
bone
, ac
cel.
at
1385
I7
76
2449
28
59
3289
36
99
4157
42
14
4557
rig
ht
tem
pora
l bo
ne
4 Fo
rce
at p
arie
tal
bone
, ac
cel.
at f
ront
al
I376
17
47
1883
24
40
2703
32
89
3679
43
52
4112
bo
ne
near
by
the
coro
nal
sutu
re
5 Fo
rce
at p
arie
tal
bone
, ac
cel.
at
1385
17
86
1903
24
49
2851
33
86
3523
38
45
4069
42
45
4636
oc
cipi
tal
bone
-_
__
: O
bser
ved
reso
nanc
es
wer
e or
dere
d an
d se
quen
tially
as
signe
d m
ode
num
bers
fo
r co
nven
ienc
e w
hich
sh
ould
no
t be
con
fuse
d w
ith
clas
sica
l m
odal
ha
rmon
ics.

364 T. B. KHALIL, D. C. VIANO AND D. L. SMITH
The frequency response data presented above are restricted to an upper bound frequency of 5000 Hz. No data are collected beyond 5000 Hz as the coherence function decayed rapidly for higher frequencies. It is possible, at least conceptually, to excite the higher modes by increasing the amount of input energy at these higher frequencies. This may be achieved by varying the hammer size and increasing the force amplitude. However, it is believed that a frequency cut-off of 5000 Hz is suffrcrent for this study as most head impact loads occur over durations which exceed 2 ms (i.e., with a fundamental frequency of excitation of 250 Hz so that an upper frequency analysis cut-off of 5000 Hz is well in excess of the highest expected vibratory frequencies encountered in a typical head impact exposure).
Frequency (Hz)
Figure 13. Parietal impact-occipital acceleration (skull 1)
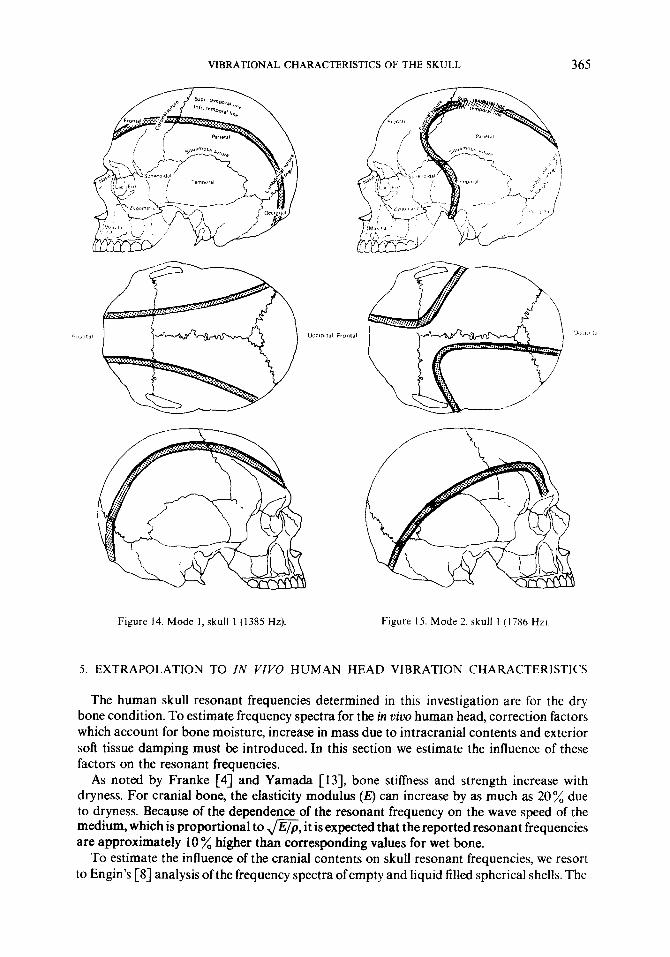
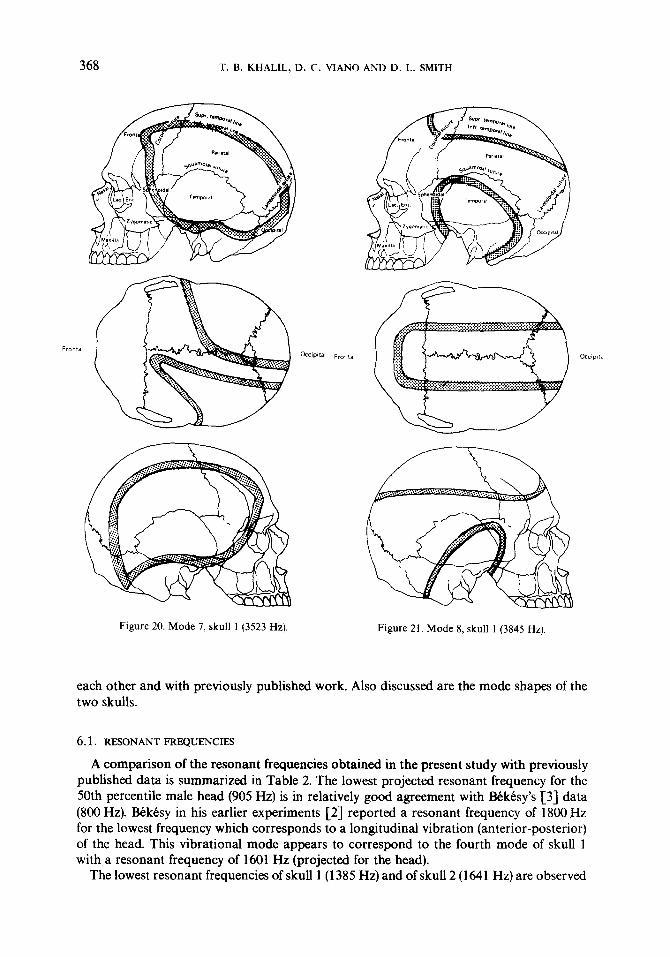
The 9 mode shapes of skull 1, associated with the resonant frequencies 1385, 1786, 1903, 2449,2857, 3386, 3523, 3845 and 4069 Hz, are presented in Figures 14 through 22, respec- tively. Each mode line is determined by observing the animated motion of the calvarium grid points, at a particular resonant frequency, and noting the stationary grid points (nodes). The location of the nodes is mapped back and marked on the skull surface and the identified mode shape is then photographed. For uniformity of presentation, mode shapes are shown traced on the skull viewed from three directions: two lateral aspects of the skull (left and right) and when the skull is viewed from above.
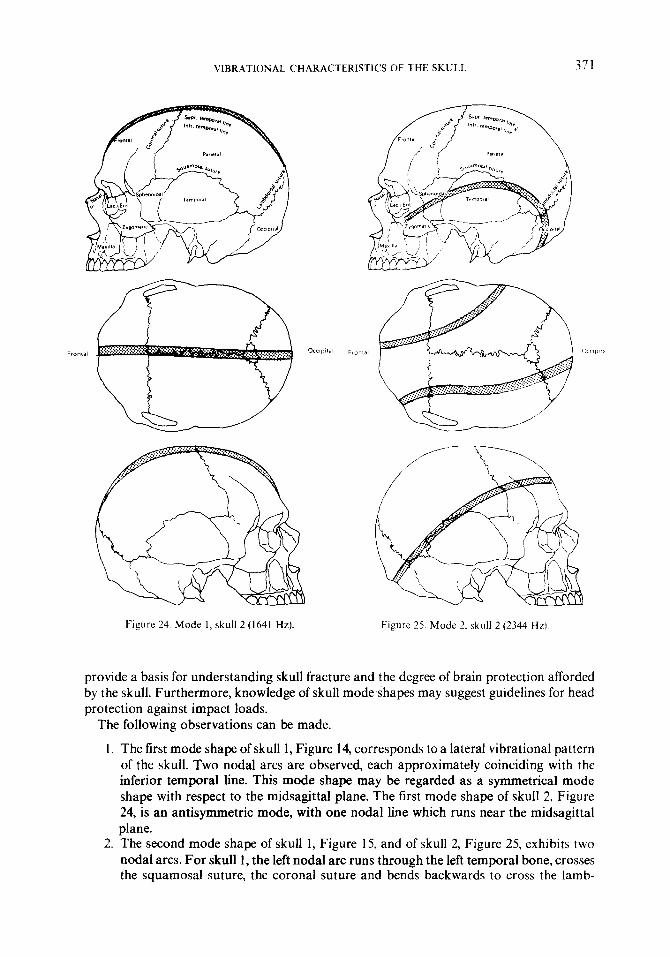
Skull 2 was tested in a similar manner to that for skull 1. For the sake of brevity only the transfer function and its associated polar plot are presented in Figure 23. This transfer function, which is based on impact on the parietal bone and accelerometer response of the occipital bone (which we infer will provide information on all of the lowest resonances of the skull), encompassed the 6 recognizable resonant frequencies of skull 2 (1641,2344,2969, 3477,4453 and 5000 Hz). The 5 associated mode shapes (Figures 24 through 28) of skull 2 are determined by following the same procedure as that for skull 1.
VIBRATIONAL CHARACTERISTICS OF THE SKULL 365
Figure 14. Mode 1, skull 1 (1385 Hz). Figure 15. Mode 2, skull 1 ( 17x6 Hz).
5. EXTRAPOLATION TO IN VW0 HUMAN HEAD VIBRATION CHARACTERISTICS
The human skull resonant frequencies determined in this investigation are for the dry bone condition. To estimate frequency spectra for the in uiuo human head, correction factors which account for bone moisture, increase in mass due to intracranial contents and exterior soft tissue damping must be introduced. In this section we estimate the influence of these factors on the resonant frequencies.
As noted by Franke [4] and Yamada [13), bone stiffness and strength increase with dryness. For cranial bone, the elasticity modulus (JZ) can increase by as much as 20% due to dryness. Because of the dependence of the resonant frequency on the wave speed of the medium, which is proportional to m, it is expected that the reported resonant frequencies are approximately 10 oA higher than corresponding values for wet bone.
To estimate the influence of the cranial contents on skull resonant frequencies, we resort to Engin’s [S] analysis of the frequency spectra of empty and liquid tilled spherical shells. The

366 T. B. KHALIL, D. C. VIANO AND II. L. SMITH
Figure 16. Mode 3, skull 1 (1909 Hz). Figure 17. Mode 4, skull 1 (2449 Hz).
ratio of the first resonant frequency of a fluid tilled spherical shell, which simulates an average head size, to the corresponding frequency for the empty shell is 064: that is, filling the cranial cavity with liquid would reduce the fundamental resonant frequency of the skull by approximately 36%. This is consistent with Franke’s [4] experiments to evaluate the resonant frequency of an empty and gelatin-filled skull. He observed that the resonant frequency of a dry empty skull of 820 Hz is reduced to 500 Hz (i.e., by 34%) when the skull was tilled with gelatin.
Skin damping influences the resonant frequencies by shifting their locations in the frequency domain. For a simple one-degree-of-freedom system, the ratio of the damped frequency to the undamped case may be calculated from the equation [ 141 f,/f, = ,/ 1 - CL, where fd is the damped frequency, f, is the non-damped frequency, and 5 is the ratio of the amount of damping to that of the critical damping for the material.
An estimate of the value of [ (assuming viscous damping) for human heads can be found

VIBRATIONAL CHARACTERISTICS OF THE SKULL 367
Figure 18. Mode 5, skull 1 (2857 Hz). Figure 19. Mode 6, skull 1 (3386 Hz)
from experimental mechanical impedance measurements on cadaver heads. The procedure of evaluating (I is given in reference [14]. From Hodgson and Patrick’s [15] midsagittal mechanical impedance data the value of [ is estimated to be 025. Stalnaker’s experimental data [7] on the side of the head allows an estimate of @48 for 5. An average value of 037 is believed to represent the viscous damping effects of skin on resonant frequencies. This value will result in a 7% reduction in resonant frequencies.
Summing up all the above effects, one thus expects that the resonant frequencies of the human head will be 53% less than the corresponding values of the dry skull.
6. DISCUSSION OF RESULTS
In this section the results of the modal analysis of the two human dry skull preparations are discussed. The resonant frequencies of both skulls are discussed and compared with
368 T. B. KHALIL, D. C. VIANO ANll D. L. SMITH
Figure 20. Mode 7, skull 1 (3523 Hz). Figure 21. Mode 8, skull 1 (3845 Hz).
each other and with previously published work. Also discussed are the mode shapes of the two skulls.
6.1. RESONANT FREQUENCIES
A comparison of the resonant frequencies obtained in the present study with previously published data is summarized in Table 2. The lowest projected resonant frequency for the 50th percentile male head (905 Hz) is in relatively good agreement with Bektsy’s ‘[3] data (800 Hz). Sk&y in his earlier experiments [2] reported a resonant frequency of 1800 Hz for the lowest frequency which corresponds to a longitudinal vibration (anterior-posterior) of the head. This vibrational mode appears to correspond to the fourth mode of skull 1 with a resonant frequency of 1601 Hz (projected for the head).
The lowest resonant frequencies of skull 1 (1385 Hz) and of skull 2 (1641 Hz) are observed

VIBRATIONAL CHARACTERISTICS OF THE SKULL 369
Figure 22. Mode 9, skull 1 (4067 HZI.
to be higher than those reported by Franke [4] (820 Hz). It is believed that the discrepancy is attributable to the added mass due to the support condition imposed on the skull.
The first resonant frequency of cadaver heads is approximately 300 Hz according to the experiments of Hodgson et al. [5], Hodgson and Patrick [lS], and Gurdjian et al. [6]. A similar value was obtained by Gurdjian [6] with a human volunteer. From the current study the estimated value of the first resonant frequency (905 Hz) is about 3 times that of previously published data. The primary reason for this difference is conceivably attributable to added mass from thevarious support conditions which were imposed on the vibrating head and also due to head excitation methods.
Effects of support location on human skull resonant frequencies is clearly evident from the work of Nickell and Marcal [IO]. In spite of the theoretical nature of the study and the relatively underestimated resonant frequencies the investigation provides a quantitative insight into the influence of the boundary conditions on the dynamic response of the human

370 T. B. KHALIL, D. C. VIANO AND D. L. SMITH
I
1
3 i 2 P \-
0 1000 2000 3000 Frequency (Hz)
4000 5000 6000
Mode Frequency (Hz)
I 1641 2 2344 3 2969 4 3477 5 4453 6 5000
Figure 23. Parietal impact-occipital acceleration (skull 2). ----, Five times magnified
skull. The Stalnaker and Fogle [7] resonant frequency data of a cadaver head is further evidence of the effects of the test conditions on the frequency response data.
6.2. MODE SHAPES
All identified mode shapes pertain to vibrations of the calvarium (uniform shell-like part of the skull). Because of the extremely non-uniform geometry of the base of the skull and the facial region, no attempts were made to extend the nodal arcs into these areas.
Nine mode shapes were obtained for skull 1 (Figures 14 through 22). In contrast only 5 mode shapes were obtained for skull 2 (Figures 24 through 28). The character of the skull motion at various resonant frequencies is apparent from the figures of the mode shapes. From the vibrational pattern of two human skulls it is evident that skull mode shapes are unique. Also, they are not quite similar to those of a homogeneous closed spherical shell [16]. However, a study of the general patterns of skull vibrations provides a simple visualiza- tion of skull deformation modes in dynamic environments. These deformation patterns
VIBRATIONAL CHARACTERISTICS OF THE SKULL
Figure 24. Mode I, skull 2 (1641 Hz). Figure 25. Mode 2. skull 2 (2344 H?l
provide a basis for understanding skull fracture and the degree of brain protection afforded by the skull. Furthermore, knowledge of skull modeshapes may suggest guidelines for head protection against impact loads.
The following observations can be made.
1. The first mode shape of skull 1, Figure 14, corresponds to a lateral vibrational pattern of the skull. Two nodal arcs are observed, each approximately coinciding with the inferior temporal line. This mode shape may be regarded as a symmetrical mode shape with respect to the midsagittal plane. The first mode shape of skull 2, Figure 24, is an antisymmetric mode, with one nodal line which runs near the midsagittal plane.
2. The second mode shape of skull 1, Figure 15, and of skull 2, Figure 25, exhibits two nodal arcs. For skull 1, the left nodal arc runs through the left temporal bone, crosses the squamosal suture, the coronal suture and bends backwards to cross the lamb-

372 T. B. KHALIL, D. C. VIANO AND D. L. SMITH
Figure 26. Mode 3, skull 2 (2969 Hz). Figure 27. Mode 4. skull 2 (3477 Hz)
doidal suture. The right nodal arc runs from the frontal bone across the coronal suture and the lambdoidal suture. Neither of the nodal arcs crosses the midsagittal plane. Mode 2 of skull 2 exhibits roughly the same features. Mode 3 of skull 1, Figure 16, was not observed for skull 2. On the left side of skull 1 the nodal arc is a closed loop. On the right side of the skull the nodal arc runs from the frontal bone to the occipital bone. Mode 4 of skull 1, Figure 17, is a transverse bending mode, exhibiting two nodal arcs. This mode shape was not found for skull 2. Mode 5 of skull 1, Figure 18, was not exhibited by skull 2. This mode shows two nodal arcs originating at the frontal bone and following the skull around the spheno- idal and temporal bone. A third nodal line originates approximately at the porion and runs close to the occipital bone. Mode 6 of skull 1, Figure 18, was exhibited by skull 2 as mode 5, Figure 28. This

VIBRATIONAL CHARACTERISTICS OF THE SKULL 373
Figure 28. Mode 5. skull 2 (5(W) HL).
mode shape is antisymmetric, portraying three longitudinal arcs, with one arc running approximately nearby the midsagittal suture and the other two extending along each side of the skull parallel to the midsagittal plane.
7. Mode 7 of skull 1, Figure 20, is a symmetrical vibration mode. It portrays two closed nodal arcs, one on each side of the skull. This mode shape was not seen for skull 2.
8. Mode 8 of skull 1, Figure 21, is a symmetrical mode with respect to the midsagittal plane. This vibrational pattern showed up as two loops on the left and right temporal bones. In addition, another open loop extends longitudinally towards the rear of the skull. A nearly similar mode shape was seen for skull 2 (mode 4), Figure 27.
9. Mode 9 of skull 1, Figure 22, is a complex vibrational pattern which was not seen for skull 2. The skull motion corresponding to this mode shape is symmetrical with respect to the midsagittal plane.
10. Mode 3 of skull 2, Figure 26, is similar to mode 1 of skull 1.

TAB
LE 2
Su
mm
ary
of h
uman
hea
d re
sona
nt f
requ
enci
es
Inve
stig
ator
Id
entif
ied
reso
nant
fr
eque
ncy
(Hz)
Sp
ecim
en
Test
co
nditi
on
Bek
esy,
19
48 [
2]
Bek
Csy
, 19
51 [
3]
Fran
ke,
1956
[4]
Hod
gson
et
al.,
19
67 [
S]
Hod
gson
an
d Pa
trick
, 19
68
Cl5
1 G
urdj
ian
et a
l.,
1970
[6]
Stal
nake
r an
d Fo
gle
1971
[7]
Nic
kel1
and
M
arca
l, 19
74
Cl0
1
Pres
ent
stud
y
1800
800
and
1600
H
uman
su
bjec
t 82
0 D
ry
skul
l 50
0 G
elat
in
fille
d sk
ull
600
and
900
Cad
aver
he
ad
360
and
950
Cad
aver
he
ad
300
and
900
I 30
0,60
0 an
d 90
0 31
3,60
0 an
d 88
0
300,
560
and
920
166,
820
68,
253,
450,
807
86,2
3 1,
458,
864
194,
465,
635,
13
27
1385
, 17
86,
1903
,244
9,
2857
,338
6,
3523
,384
5,
4069
,424
5 an
d 46
36
1641
,234
4,29
69,
3477
, 44
53 a
nd
5000
90
5,11
67,1
244,
1601
, 18
67,2
213,
2302
,251
3,
2659
,277
5,30
30
1073
, 15
32,
1941
,227
3,
2910
, 32
68
Hum
an
subj
ect
Hea
d w
as
subj
ecte
d to
a s
ound
fie
ld.
Fron
tal
and
occi
pita
l re
gion
m
otio
ns
wer
e m
onito
red
by t
wo
mic
roph
ones
. H
ead
was
exc
ited
by a
vib
ratin
g pi
ston
. M
echa
nica
l im
peda
nce
test
. Fr
onta
l bo
ne
was
ex
cite
d by
a
vibr
atin
g pi
ston
. O
ccip
ital
bone
w
as
mou
nted
ag
ains
t a
rigid
su
ppor
t.
Cad
aver
he
ad
with
cr
ania
l ca
vity
fil
led
with
si
licon
ge
l H
uman
vo
lunt
eer
Cad
aver
he
ad
fille
d w
ith
gela
tin
Vol
unte
er
Cad
aver
Occ
ipita
l su
ppor
t Fr
onta
l su
ppor
t B
ase
supp
ort
50 %
mal
e sk
ull
5 %
fem
ale
skul
l
50 %
mal
e he
ad
(pro
ject
ed)
5 %
fem
ale
head
(p
roje
cted
)
Mec
hani
cal
impe
danc
e te
st.
Mid
fr
onta
l bo
ne
was
dr
iven
by
a
vibr
atin
g pi
ston
.
Mec
hani
cal
impe
danc
e te
st.
Vib
ratin
g pi
ston
w
as
atta
ched
to
fr
onta
l bo
ne.
Mec
hani
cal
impe
danc
e te
st.
Elec
trom
agne
tic
shak
er
was
at
tach
ed
to p
arie
tal
bone
an
d th
e re
spon
se
was
m
onito
red
by a
m
inia
ture
ac
cele
rom
eter
at
tach
ed
to t
he
oppo
site
si
de.
Fini
te
elem
ent
mod
el
of a
hum
an
skul
l (m
athe
mat
ical
m
odel
).
Tran
sien
t re
spon
se
anal
ysis
ut
ilizi
ng
Hew
lett
Pack
ard
Four
ier
Ana
lyze
r.

VIBRATIONAL CHARACTERISTICS OF THE SKULL 375
11. A pausible explanation for the possibility of exciting non-symmetric mode shapes about the midsagittal plane (mode 6 of skull 1 and modes 1 and 5 of skull 2) is pro- vided by calvarium vibrations with respect to the base of the skull: i.e., the calvarium is vibrating similar to a hemispherical shell with an immobile boundary. This may be justified in view of the rather stiff joint between the calvarium and the base of the skull provided by the thick bony ridge. Another factor that may enhance the relative motion is the frictional forces provided by the supporting foam rubber pad. Also. it is conceivable that the 3 nodal lines exhibited in both mode 6 of skull 1 and mode 5 of skull 2 may extend beyond the calvarium to encircle the whole skull.
7. CONCLUSIONS
1. In a frequency band of 20 Hz to 5000 Hz the lowest resonant frequency of a 50th percentile dry male skull (skull 1) was identified to be 1385 Hz. For a smaller skull which corresponds to a 5th percentile female (skull 2), the lowest resonant frequency was found to be 1641 Hz. The ratio of the lowest resonant frequency of skull 1 to that of skull 2 (O-84) approximately corresponds to the inverse of their respective spherical shell diameters (0.90) which is representative of the overall skull dimensions.
2. The frequency spectrum of a human skull appears to be a unique property of that skull. Eleven resonant frequencies were identified for skull 1 (1385, 1786, 1903, 2449, 2857, 3386, 3523, 3845, 4069, 4245 and 4636 Hz), in contrast to only six frequencies for skull 2 (1641, 2344, 2969, 3477, 4453 and 5OCQ Hz). Interestingly, the modal characteristics of the lowest observed frequencies for the skulls are quite different (i.e., skull 1 exhibited two nodal lines offset but parallel to the midsagittal line, whereas skull 2 exhibited a single nodal line nearly coincident with the midsagittal line).
3. Mode shapes of one skull may not be generalized to another skull: that is, mode shapes appear to be a unique characteristic of a particular skull. The relative dimensions of the calvarium plates and positions of sutures vary among skulls because of different factors affecting suture calcification during skull growth. Bone thickness, material properties and geometric configurations of various plates of the skull are other factors which may contribute to the non-uniqueness of mode shapes.
4. Locations of node lines which specify vibrational modes on the skull surface did not seem to be related to suture sites on the skull.
5. Nodal patterns of the skull may provide guidelines for understanding skull fracture mechanisms.
6. The resonant frequencies determined in this investigation are noted to be higher than previously published data by a factor of 2 to 3. The primary -reasons for this large difference are believed to be attributable to added mass due to the various support conditions which were imposed on the vibrating head and also to differing head excitation methods which incorporated varying degrees of rigid attachment to the skull.
7. The uniqueness of each skull’s vibrational characteristics suggests that additional skulls should be studied before proceeding with the development of an analytical model which incorporates frequency response characteristics.
ACKNOWLEDGEMENTS
The authors would like to thank Dr Robert Hickling of the Fluid Dynamics Research Department, General Motors Research Laboratories for suggesting the use of the Fourier

376 T. B. KHALIL, D. C. VIANO AND D. L. SMITH
Analyzer for this study. Thanks are also due to Dr Voigt R. Hodgson of the Department of Neurosurgery, Wayne State University, Detroit, Michigan for providing a dry human skull (skull 1).
REFERENCES
1. T. B. KHALIL and R. P. HUBBARD 1977 Journal of Biomechanics 10, 119-132. Parametric study of head response by finite element modeling.
2. G. V. BI%SY 1948 Journal of the Acoustical Society of America 20, 749-760. Vibration of the head in a sound field and its role in hearing by bone conduction.
3. G. V. BBK&Y 1951 in Handbook of Experimental Psychology, (edited by S. S. Stevens). New York: John Wiley. Response of the human skull to mechanical vibrations.
4. K. E. FRANKE 1956 Journal of the Acoustical Society of America 28, 1277-1284. Response of the human skull to mechanical vibrations.
5. V. R. HODGSON, E. S. GURDJIAN and L. M. THOMAS 1967 Eleventh Stapp Car Crash Conference Proceedings. New York: Society of Automotive Engineers, Inc., pp. 125-138. The determina- tion of response characteristics of the head with emphasis on mechanical impedance tech- niques.
6. E. S. GURDJIAN, V. R. HODGSON and L. M. THOMAS 1970 Journal of Biomechanics 3, 239-247. Studies on mechanical impedance of the human skull : preliminary report.
7. R. L. STALNAKER and J. L. FOGLE 1971 Journal of Biomechanics 4,127-139. Driving point imped- ance characteristics of the head.
8. A. E. ENGIN 1968 Ph.D. Dissertation, University of Michigan. The axisymmetric response of a fluid-filled spherical shell.
9. R. HICKLING and M. L. WENNER 1973 Journal ofBiomechanics 6, 115-132. Mathematical model of a head subjected to an axisymmetric impact.
10. R. E. NICKELL and P. V. MARCAL 1974 Journal of Engineering for Industry, Transactions of the American Society of Mechanical Engineers 3,490494. In-vacua modal dynamic response of the human skull.
11. M. RICHARDSON 1975 Shock and Vibration Information Center Publication, Seminar on Under- standing Digital Control Analysis in Vibration Test Systems, Muy 43-64. Modal analysis using digital test systems.
12. C. C. KENNEDY and C. D. P. PANCU 1947 Journal of the Aeronautical Sciences 14,603-625. Use of vectors in vibration measurement and analysis.
13. H. YAMAVA 1970 Strength of Biological Materials (edited by F. G. Evans). Baltimore: The Williams and Wilkins Company.
14. W. T. THOMSON 1964 Vibration Theory and Applications. Englewood Cliffs, New Jersey: Prentice- Hall, Inc.
15. V. R. HOVGSON and L. M. PATRICK 1968 Proceedings of the Twelfth Stapp Car Crash Conference Society of Automotive Engineers, Inc., 280-301. Dynamic response of the human cadaver head compared to a simple mathematical model.
16. E. W. BAKER 1961 Journal of the Acoustical Society of America 33, 1749-1758. Axisymmetric modes of vibration of thin spherical shells.