experimental and computational creep characterization of...
TRANSCRIPT
Philosophical Magazine, 11 December 2003Vol. 83, No. 35, 3959–3976
Experimental and computational creep characterizationof Al–Mg solid-solution alloy through
instrumented indentation
Hidenari Takagi
Department of Mechanical Engineering, College of Engineering,Nihon University, Tamuramachi, Koriyama, Fukushima 963-8642, Japan
Ming Dao{
Department of Materials Science and Engineering, Massachusetts Instituteof Technology, Cambridge, Massachusetts 02139, USA
Masami Fujiwara{
Department of Applied Physics, College of Engineering, Nihon University,Tamuramachi, Koriyama, Fukushima 963-8642, Japan
and Masahisa Otsuka
Department of Materials Science and Engineering, Faculty of Engineering,Shibaura Institute of Technology, Tokyo 108-8548, Japan
[Received 30 May 2003 and accepted in revised form 20 August 2003]
Abstract
Carefully designed indentation creep experiments and detailed finite-elementcomputations were carried out in order to establish a robust and systematicmethod to extract creep properties accurately during indentation creep tests.Samples made from an Al–5.3mol%Mg solid-solution alloy were tested attemperatures ranging from 573 to 773K. Finite-element simulations confirmedthat, for a power-law creep material, the indentation creep strain field is indeedself-similar in a constant-load indentation creep test, except during short transientperiods at the initial loading stage and when there is a deformation mechanismchange. Self-similar indentation creep leads to a constitutive equation from whichthe power-law creep exponent n, the activation energy Qc for creep, the back orinternal stress and so on can be evaluated robustly. The creep stress exponent nwas found to change distinctively from 4.8 to 3.2 below a critical stress level, whilethis critical stress decreases rapidly with increasing temperature. The activationenergy for creep in the stress range of n¼ 3.2 was evaluated to be 123 kJmol�1,close to the activation energy for mutual diffusion of this alloy, 130 kJmol�1.Experimental results suggest that, within the n¼ 3.2 regime, the creep is ratecontrolled by viscous glide of dislocations which drag solute atmosphere andthe back or internal stress is proportional to the average applied stress. Theseresults are in good agreement with those obtained from conventional uniaxial
Philosophical Magazine ISSN 1478–6435 print/ISSN 1478–6443 online # 2003 Taylor & Francis Ltd
http://www.tandf.co.uk/journals
DOI: 10.1080/14786430310001616045
{Author for correspondence. Email: [email protected].{Author for correspondence. Email: [email protected].

creep tests in the dislocation creep regime. It is thus confirmed that indentationcreep tests of Al–5.3mol%Mg solid-solution alloy at temperatures ranging from573 to 773K can be effectively used to extract material parameters equivalent tothose obtained from conventional uniaxial creep tests in the dislocation creepregime.
} 1. Introduction
With new materials being invented daily in research and development, they areoften available only in minute quantities or as small volume samples or structures.It is very important to establish a robust and convenient mechanical testing methodthat can accurately extract mechanical properties at both ambient and high tempera-tures from these small-volume materials. Instrumented indentation has been widelyused to extract elastic and elastoplastic mechanical properties at low temperaturesand to estimate creep properties at high temperatures.
Considerable efforts and significant progresses have been made in extractingambient temperature elastic and elastoplastic properties (Tabor 1951, Oliver andPharr 1992, Field and Swain 1995, Gerberich et al. 1996, Dao et al. 2001). Manypioneering studies have been conducted on indentation creep as well. One of theearliest studies regarding indentation hardness versus loading time was carried outby Tabor and his co-workers (Mulhearn and Tabor 1960, Atkins et al. 1966). Li et al.(1991) tried to analyse all deformation mechanisms which may contribute to inden-tation creep. Sargent and Ashby (1992) demonstrated that the hot-hardness testprovides information concerning the time-dependent flow, or creep, of the materialbeneath the self-similar indenter. Prakash (1996) proposed a conceptual model foranalysing self-similar indentation creep data in terms of the back or internal stressesresulting from the interaction of mobile dislocations with microstructural inhomo-geneities. Lucas and Oliver (1999) investigated the dependence of hardness on inden-tation strain rate and temperature and discussed steady-state deformation behaviourin nanoindentation. Mackerle (2001) summarized a bibliography of recent paperson computer simulations for indentation problems. Assuming self-similarity undera constant load, Fujiwara and Otsuka (1999, 2001) derived a set of constitutiveequations for self-similar indentation creep and performed experiments on pure Snand Sn-based eutectic alloy. Excluding elasticity effects, Cheng and Cheng (2001)proposed several scaling relationships using dimensional analysis. Creep studiesusing a cylindrical indenter were also carried out (Li 2002), and those experimentswere often called ‘impression tests’.
However, an indentation stress or strain field is a highly non-uniform field thatdepends on the prior plastic deformation history, and an indentation creep test ofteninvolves transient periods (including the initial loading period as well as the transi-tion period when there is a deformation mechanism change at different applied stresslevels). Therefore, a number of important questions remain that require furtherinvestigation:
(i) whether or not the initial transient response, which is apparently notself-similar, will result in the loss of self-similarity throughout the entireindentation creep process;
(ii) if the self-similar indentation creep is eventually reached, how long it takesto reach that stage;
3960 H. Takagi et al.

(iii) whether or not one can accurately extract creep properties during indenta-tion creep tests.
Considering the complications related to these issues, they can only be properlyresolved via carefully designed experiments together with corresponding detailednumerical analyses.
In the present study, constant-load indentation creep tests of an Al–5.3mol%Mgsolid-solution alloy are performed at temperatures ranging from 573K to 773K(from 0:63Tm to 0:85Tm, where Tm is the absolute melting temperature), computa-tional and experimental verifications are carried out to examine the self-similarityassumption during constant-load indentation creep tests, and analytical equationsare given for systematically extracting the creep exponent n, the creep activationenergy Qc and the critical stress sc for breakaway of dislocations from their soluteatmosphere. High-temperature deformation mechanisms of Al–Mg solid-solutionalloy are discussed in connection with all our experimental results. Comparisonwith available experimental results in the literature is also given.
} 2. Experimental, theoretical and computational considerations
2.1. Experimental proceduresIngots of Al–5.3mol%Mg alloy were homogenized by keeping in Ar gas for
86.4 ks at 773K (0.85Tm). They were cut into approximately 10mm� 5mm� 5mmpieces with a metal saw and carefully shaped into parallelepipeds using special jigsand emery papers. All specimens were subjected to annealing in Ar gas for 3.6 ksat 773K. After that, they were electropolished and acid cleaned to remove thesurface layer of up to about 40 mm in thickness and immediately placed in the testingmachine in order to minimize atmospheric tarnish. The chemical composition of thespecimens is shown in table 1.
Several specimens were treated in a suitable etchant with a current densityof 400 kAm�2 for 90 s at 273K and observed under a metallurgical microscope.The etching solution consists of 10ml of perchloric acid, 20ml of ethylene glycoland 400ml of ethanol. The microstructure images were processed with grain-sizeanalysis software. No significant changes were observed in grain size before and afterindentation creep tests, and the average grain diameter was around 410 mm. Thegrain size did not change even in the region just below the indentation contactimpression. Therefore, the grain size is treated as constant at a given temperature.
Figure 1 (a) schematically shows the instrumented microindenter used in thisstudy. This indentation tester was built in collaboration with ULVAC-RIKO inJapan (Fujiwara and Otsuka 1999). The quartz indenter column moves downwardsfrom its equilibrium position by an electromagnetic force, and the diamond indentertip is then pressed perpendicularly into a 10mm� 5mm surface area of the heatedspecimen in an Ar gas atmosphere. The indentation depth can be obtained by
Creep characterization of Al–Mg solid-solution alloy 3961
Table 1. Chemical composition of tested materials.
Test material
Analysed composition (mol%)
Mg Si Fe Cu Al
Al–5.3mol%Mg alloy 5.3 0.004 0.004 0.0002 Balance

measuring the displacement of the indenter column with a linear variable-differentialtransformer (LVDT). Since the LVDT is placed more than 30 cm away from theheater, the thermal drift error is carefully controlled to be negligible compared withthe micron-scale indenter displacement. During an indentation creep test, data forload and indenter displacement are recorded versus indentation time. It is oftenseen that indentation creep curves vary a little in shape as well as magnitude atdifferent sampling points even on the same specimen. Similar dispersions can alsobe observed during hardness tests. Nevertheless, after training in operating themicroindenter for 1 week, indentation creep curves are repeatable in three out ofseven trials according to our experience.
Indentation creep tests for Al–5.3mol% Mg alloy were carried out under suchconditions that dynamic recrystallization does not occur. The test conditions appliedare as follows: test temperatures, 573–773K (0.63Tm–0.85Tm); indentation load,0.39N; total indentation time, 1200 s.
The indenter tip is conical in shape up to a height of 120 mm (the included half-apex-angle �¼ 68�). The temperature variation during indentation creep test waswithin �1K. The applied load could reach the desired value within less than 0.1 s.
2.2. Constitutive equation of indentation creepWhen a sharp indenter is pressed into the surface of a heated specimen,
it penetrates with the rate-dependent and temperature-dependent yielding andcreeping of the indented sample. The time-dependent flow, or creep, of the mate-rial below the indenter is called indentation creep (Li et al. 1991, Sargent and
3962 H. Takagi et al.
ConicalIndenter
12
6
7
89
1011
3
4
5
3
4
5
(b)
(c)(a)
Rigid Indenter
r
u
material
Figure 1. (a) Schematic diagrams of the microindenter (maximum load, 4.9N; maximumtemperature, 1073K; displacement resolution, 0.05� 10�6m): 1, solenoid; 2, LVDT; 3,lines; 4, oil bath; 5, float; 6, thermocouple; 7, quartz tube; 8, indenter tip; 9, quartzindenter column; 10, heater; 11, specimen. (b) Schematic drawing of the conicalindenter penetrating the test material. (c) Mesh design for the finite-elementcalculations.

Ashby 1992, Prakash 1996). Using a self-similar sharp indenter (e.g. cone orpyramid), it is often assumed that the plastic region just below the indenter extendswhile maintaining its geometrical self-similarity as indentation creep proceeds; thatis the contours of plastic strain change only in scale, and not in shape (Hill 1983).Assuming that the material’s creep behaviour obeys the well-known creep law foruniaxial steady-state creep (Mukherjee et al. 1969, Cadek 1988) given by
_""c ¼ A1
�
E
� �n b
d
� �q
exp �Qc
RT
� �, ð1 aÞ
a constitutive equation was given for the self-similar indentation creep (Fujiwara andOtsuka 1999):
_uu ¼ A2uF
Eu2
� �nb
d
� �q
exp �Qc
RT
� �, ð1 bÞ
where _""c is the effective creep strain rate of the indented material, _uu is the indentervelocity, A1 and A2 are constants with the dimension of the reciprocal of time, � isthe von Mises flow stress, u is the indenter displacement, F is the indentation load,E is Young’s modulus at the test temperature, b is the magnitude of the Burgersvector, d is the grain size, R is the gas constant and T is the test temperature.The power-law creep exponent n, the grain-size exponent q and the activation energyQc for creep are constants that are uniquely determined by the predominant rate-controlling process of creep deformation. Many uniaxial creep tests showed thatdislocation creep rate is only slightly influenced by grain size; therefore q¼ 0 isusually set in equations (1 a) and (1 b).
When T and d are constant during indentation creep under a given F, the stressexponent n in equation (1 b) is given by
n ¼1
21�
oðln _uuÞ
oðln uÞ
� �T , d
: ð2Þ
Setting K ¼ _uu ðEu2=FÞn=u, equation (1 b) is rewritten as
K ¼ A2
b
d
� �q
exp �Qc
RT
� �: ð3Þ
The K parameter has the dimension of the reciprocal of time. When d is keptconstant regardless of the temperature employed, the activation energy Qc forcreep is obtained by
Qc ¼ �RoðlnKÞ
oð1=T Þ
� �d
: ð4Þ
Equations (2)–(4) were proposed by Fujiwara and Otsuka (1999, 2001) and appliedto study pure Sn and Sn-based eutectic alloy.
The load on the indenter is carried by a projected contact area A of animpression. The contact area is proportional to u2 for a self-similar indentation,that is A / u2. For equilibrium, the indentation pressure p is expressed byp¼F/A, which is called the Meyer hardness. When the friction between the indenterand the material being tested is negligibly small, the representative flow stress � in the
Creep characterization of Al–Mg solid-solution alloy 3963

plastic region below the indenter can be approximately written as (Tabor 1951,Johnson 1970, Bolshakov and Pharr 1998)
� �p
3/
F
u2: ð5Þ
Here � is a measurement of the average equivalent (von Mises) stress in the plasticzone. When the plastic zone extends in such a way that its configuration remainsgeometrically self-similar as indentation creep proceeds, the indentation strain rate_""ind is defined as (Atkins et al. 1966, Mayo and Nix 1988, Asif and Pethica 1997)
_""ind ¼_uu
u¼
dðln uÞ
dt: ð6Þ
Substituting equations (5) and (6) into equation (1 b) gives
_""ind ¼ A3
�
E
� �nb
d
� �q
exp �Qc
RT
� �: ð7Þ
The above equation is in the same form as equation (1 a) in appearance. Here A3 isa constant that has the dimension of the reciprocal of time. From equation (7),the stress exponent n for creep can now be obtained by
n ¼oðln _""indÞ
o½lnð�=E Þ�
� �T , d
: ð8Þ
This expression shows that the n value measures the stress sensitivity of theindentation strain rate _""ind.
2.3. Computational model set-upTo compute the indentation creep behaviour, the uniaxial formulation of creep
in equation (1 a) has to be extended to the spatial tensor formulation. A briefdescription is given below.
The total strain tensor e is decomposed into the elastic part ee and creep (plastic)part ec:
e ¼ ee þ ec: ð9Þ
Replacing the uniaxial stress and uniaxial strain measures to be effective values inequation (1), that is
� ¼3
2
� �1=2 X3i¼1
X3j¼1
sij sij
!1=2
, "c ¼2
3
� �1=2 X3i¼1
X3j¼1
"cij"cij
!1=2
, ð10Þ
where sij are the deviatoric stress components, the computational model assumesthat the multidimensional material creep behaviour still obeys the power-lawfunction given in equation (1 a). Therefore the extended tensor formulation ofequation (1 a) is now simply given as
"c ¼ Bσ n, ð11Þ
where
B ¼ A1
1
E
� �nb
d
� �q
exp �Qc
RT
� �� A1
1
E
� �n
exp �Qc
RT
� �:
3964 H. Takagi et al.

The plastic creep deformation is considered to be incompressible, that is "c11þ"c22 þ "c33 ¼ 0, and the elasticity is considered isotropic.
Axisymmetric finite-element models were constructed to simulate the indentationresponse of elasto-plastic solids. Figure 1 (b) schematically shows the conical inden-ter, where �¼ 68� is the included half-angle of the conical indenter. Figure 1 (c)shows the mesh design for axisymmetric finite-element calculations. The semi-infinitesubstrate of the indented solid was modeled using 12 000 four-noded bilinearaxisymmetric quadrilateral elements, where a fine mesh near the contact regionand a gradually coarser mesh further from the contact region were designed toensure numerical accuracy. Finite deformation and, consequently, pile-up orsink-in effect during indentation creep were rigorously accounted for in thecomputations. More details of the computational model set-up can be foundelsewhere (Dao et al. 2001).
The load was linearly increased from 0 to the maximum value within a shortperiod of 0.1 s and kept constant afterwards. When the maximum load was reachedat t¼ 0.1 s, the minimum number of contact elements in the contact zone was nofewer than seven in each finite-element method (FEM) computation. The mesh waswell tested for convergence and was determined to be insensitive to far-field bound-ary conditions. A commercial general-purpose finite-element package ABAQUS(ABAQUS Inc. 2002) was used. A user subroutine was constructed in order tointegrate the power-law creep material behaviour.
} 3. Results
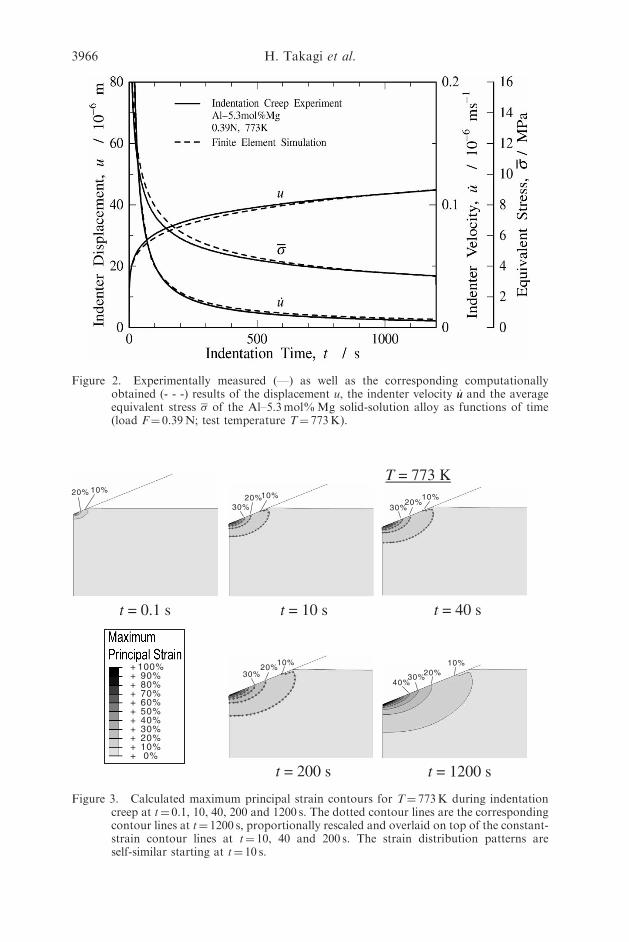
3.1. Self-similar indentation creep under a constant loadFigure 2 (solid curves) shows the experimentally measured displacement u,
the indenter velocity _uu and the average equivalent stress � of the Al–5.3mol%Mgsolid-solution alloy as functions of time; the load is F¼ 0.39N and the test tempera-ture T¼ 773K. It is clear from figure 2 that the stress is a decreasing function ofindentation time, and consequently the indenter velocity also decreases mono-tonically with time. The ratio _uu=u, that is the indentation strain rate, is again adecreasing function of indentation time. An indentation creep test corresponds toa stress dip test that can be continuously performed during a conventional uniaxialcreep test. The dashed curves in figure 2 show the corresponding computationalresults, calculated with Young’s modulus E¼ 37.8GPa, Poisson’s ratio �¼ 0.33,stress exponent n¼ 3.2 and the creep constant B¼ 7.76� 10�7MPa�3.2 s�1 inequation (11). The computational results of u, _uu and � are essentially overlappingwith their corresponding experimental curves. The excellent agreement betweencomputational results and the experiments indicates that the rate-dependent powerlaw of equation (11) describes the indented material’s constitutive behaviour fairlywell. It is worth noting that the elastic deformation in equations (9)–(11) also needsto be accurately taken into account in order to obtain such a good match as shownin figure 2.
One of the central assumptions in deriving the constitutive relation (1 b) is thatthe indentation creep under a constant-load is self-similar. Figure 3 shows thecalculated maximum principal strain developed during the indentation creep att¼ 0.1, 10, 40, 200 and 1200 s. It is evident that the strain distribution patterns areself-similar starting from t¼ 10 s, although some very minor differences can be foundin details at t¼ 10 s. At t¼ 0.1 s, where the maximum load was just achieved,
Creep characterization of Al–Mg solid-solution alloy 3965
3966 H. Takagi et al.
t = 0.1 s t = 10 s t = 40 s
t = 200 s t = 1200 s
T = 773 K
+ 100%+ 90%+ 80%+ 70%+ 60%+ 50%+ 40%+ 30%+ 20%+ 10%+ 0%
10%20%
30%10%
20%30%40%
10%20%
30%
10%20%30%
10%20%
Figure 3. Calculated maximum principal strain contours for T¼ 773K during indentationcreep at t¼ 0.1, 10, 40, 200 and 1200 s. The dotted contour lines are the correspondingcontour lines at t¼ 1200 s, proportionally rescaled and overlaid on top of the constant-strain contour lines at t¼ 10, 40 and 200 s. The strain distribution patterns areself-similar starting at t¼ 10 s.
Figure 2. Experimentally measured (—) as well as the corresponding computationallyobtained (- - -) results of the displacement u, the indenter velocity _uu and the averageequivalent stress � of the Al–5.3mol%Mg solid-solution alloy as functions of time(load F¼ 0.39N; test temperature T¼ 773K).
the strain distribution is roughly similar, but not exactly self-similar, to that observedin later stages after the initial transient period.
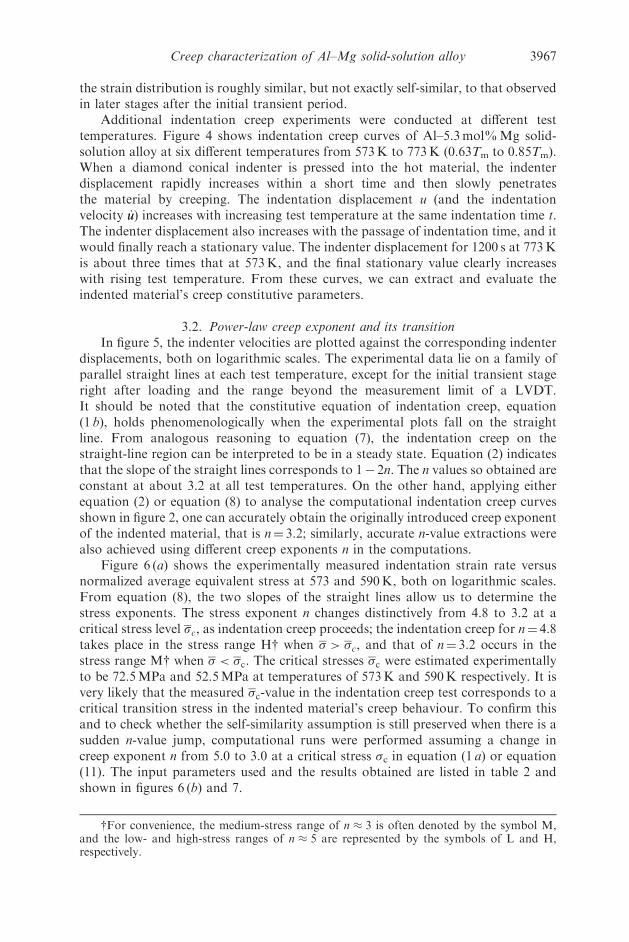
Additional indentation creep experiments were conducted at different testtemperatures. Figure 4 shows indentation creep curves of Al–5.3mol%Mg solid-solution alloy at six different temperatures from 573K to 773K (0.63Tm to 0.85Tm).When a diamond conical indenter is pressed into the hot material, the indenterdisplacement rapidly increases within a short time and then slowly penetratesthe material by creeping. The indentation displacement u (and the indentationvelocity _uu) increases with increasing test temperature at the same indentation time t.The indenter displacement also increases with the passage of indentation time, and itwould finally reach a stationary value. The indenter displacement for 1200 s at 773Kis about three times that at 573K, and the final stationary value clearly increaseswith rising test temperature. From these curves, we can extract and evaluate theindented material’s creep constitutive parameters.
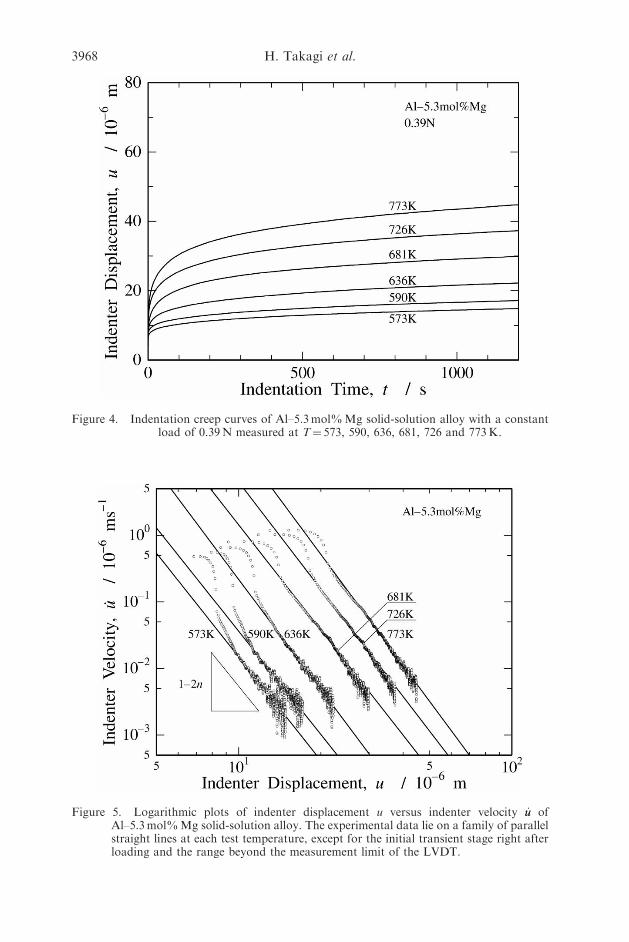
3.2. Power-law creep exponent and its transitionIn figure 5, the indenter velocities are plotted against the corresponding indenter
displacements, both on logarithmic scales. The experimental data lie on a family ofparallel straight lines at each test temperature, except for the initial transient stageright after loading and the range beyond the measurement limit of a LVDT.It should be noted that the constitutive equation of indentation creep, equation(1 b), holds phenomenologically when the experimental plots fall on the straightline. From analogous reasoning to equation (7), the indentation creep on thestraight-line region can be interpreted to be in a steady state. Equation (2) indicatesthat the slope of the straight lines corresponds to 1� 2n. The n values so obtained areconstant at about 3.2 at all test temperatures. On the other hand, applying eitherequation (2) or equation (8) to analyse the computational indentation creep curvesshown in figure 2, one can accurately obtain the originally introduced creep exponentof the indented material, that is n¼ 3.2; similarly, accurate n-value extractions werealso achieved using different creep exponents n in the computations.
Figure 6 (a) shows the experimentally measured indentation strain rate versusnormalized average equivalent stress at 573 and 590K, both on logarithmic scales.From equation (8), the two slopes of the straight lines allow us to determine thestress exponents. The stress exponent n changes distinctively from 4.8 to 3.2 at acritical stress level sc, as indentation creep proceeds; the indentation creep for n¼ 4.8takes place in the stress range H{ when � > �c, and that of n¼ 3.2 occurs in thestress range M{ when � < �c. The critical stresses �c were estimated experimentallyto be 72.5MPa and 52.5MPa at temperatures of 573K and 590K respectively. It isvery likely that the measured �c-value in the indentation creep test corresponds to acritical transition stress in the indented material’s creep behaviour. To confirm thisand to check whether the self-similarity assumption is still preserved when there is asudden n-value jump, computational runs were performed assuming a change increep exponent n from 5.0 to 3.0 at a critical stress �c in equation (1 a) or equation(11). The input parameters used and the results obtained are listed in table 2 andshown in figures 6 (b) and 7.
Creep characterization of Al–Mg solid-solution alloy 3967
{For convenience, the medium-stress range of n � 3 is often denoted by the symbol M,and the low- and high-stress ranges of n � 5 are represented by the symbols of L and H,respectively.
3968 H. Takagi et al.
Figure 4. Indentation creep curves of Al–5.3mol%Mg solid-solution alloy with a constantload of 0.39N measured at T¼ 573, 590, 636, 681, 726 and 773K.
Figure 5. Logarithmic plots of indenter displacement u versus indenter velocity _uu ofAl–5.3mol%Mg solid-solution alloy. The experimental data lie on a family of parallelstraight lines at each test temperature, except for the initial transient stage right afterloading and the range beyond the measurement limit of the LVDT.

Creep characterization of Al–Mg solid-solution alloy 3969
Figure 6. (a) Experimentally measured indentation strain rate versus normalized averageequivalent stress at 573 and 590K, both on logarithmic scales. The n value changesdistinctively from 4.8 to 3.2 at a critical stress level �c. (b) Corresponding computa-tional results of indentation strain rate versus normalized average equivalent stress.

A commonly observed phenomenon of indentation experiments is that thematerial around the indentation impression tends to deform upwards (pile-up) ordownwards (sink-in) with respect to the original surface. Note that pile-up or sink-inbehaviour is closely related to both the plastic and the elastic properties duringindentation creep experiments. To account for the pile-up or sink-in phenomenon,nonlinear large strains, finite rigid-body displacements and finite rigid-bodyrotations in addition to both the plastic strain-rate hardening and the elasticity areall carefully considered in the computational model. For the typical parametersused in the current study, pile-up was found in all cases, as observed in figure 7.When the pile-up effect is carefully taken into account by the FEM simulations, it isevident that the �c value extracted from an indentation creep curve correspondsclosely to, and is a good estimation of, the indented material’s �c value. Figure 7shows the computed maximum principal strain contours at T¼ 573K. At t¼ 100 s,the indentation is still in the high-stress range of n � 5 and, at t ¼ 1200 s, the inden-tation is well within the steady-state range of n � 3. The strain contours at t ¼ 100 sand t¼ 1200 s are roughly self-similar; they only differ in certain minor details.Comparing figure 7 with figure 3, the strain distribution patterns at t¼ 1200 sare very much similar, showing again that the earlier transient behaviour near thetransition stress �c are diminishing with longer indentation times.
3970 H. Takagi et al.
t = 100 s t = 1200 s
T = 573 K
+ 100%+ 90%+ 80%+ 70%+ 60%+ 50%+ 40%+ 30%+ 20%+ 10%+ 0%
10%
20%30%
40%
10%
20%30%40%
Figure 7. Calculated maximum principal strain contours for T¼ 573K during indentationcreep at t¼ 100 and 1200 s. The dotted contour lines are the corresponding contourlines at t¼ 1200 s, proportionally rescaled and overlaid on top of the constant straincontour lines at t¼ 100 s. The strain contours at t¼ 100 s and t¼ 1200 s are roughlyself-similar; they only differ in certain minor details.
Table 2. FEM simulations of the creep exponent change. Input parameters and resultsare tabulated.
Input parameters FEM results
T
(K)
E
(GPa) �
� > �c � < �c
�c(MPa)
�c
(MPa)
(pile-up
considered)
�c
(MPa)
(pile-up
not
considered)
n
n
B
(MPa�5 s�1) n
B
(MPa�3 s�1) � > �c � < �c
573 58.0 0.33 5.0 2.25� 10�13 3.0 1.18� 10�9 72.5 69.3 77.7 4.9 2.9
590 57.1 0.33 5.0 1.13� 10�12 3.0 3.11� 10�9 52.5 51.9 60.8 4.9 2.9

3.3. Activation energy for indentation creepFigure 8 shows the Arrhenius plot of K values obtained from analysing the data
lying on the parallel straight lines in figure 5. As mentioned earlier, the K parameter,given by K ¼ "indðEu
2=FÞn, represents an indentation strain rate in which the stressdependence is compensated, so that the K value is uniquely determined at a giventemperature and the dependence of K value upon temperature can be expressed by astraight line in the Arrhenius plot diagram. According to equation (4), the slope ofthe straight line corresponds to �Qc=2:3RTm. The activation energy for creep soobtained is Qc ¼ 123 kJmol�1, which agrees well with the value of 130 kJmol�1
obtained for the mutual diffusion of an Al–Mg solid-solution alloy (Brandes et al.1998). It follows that the indentation strain rate in the range M of n¼ 3.2 isproportional to a diffusion coefficient of the solid-solution alloy. The findingsuggests that the indentation creep is rate controlled by the viscous glide of disloca-tions, which depends on dragging resistance that arises from the interaction ofsolute atmosphere with gliding dislocations.
3.4. Back stress acting on moving dislocationsTaking into account the back stress �b acting on moving dislocations (Cadek
1988), equation (7) can be rewritten as
"ind ¼ A4
� � �bE
� �nb
d
� �q
exp �Qc
RT
� �, ð12Þ
where A4 is a constant. When the back stress is the athermal resistance due tolong-range interaction of other dislocations, the resistance is often called an internal
Creep characterization of Al–Mg solid-solution alloy 3971
Figure 8. Arrhenius plot of the K parameter, K ¼ "indðEu2=FÞn.

stress si, which is generally expressed by (Taylor 1938, Carrington et al. 1960,Yoshinaga et al. 1985)
�i ¼ ��bM�1=2, ð13Þ
where � is a constant depending on dislocation arrangement, � is the shear modulus,M is the Taylor factor (M � 3:06 for fcc polycrystals (Taylor 1938)) and � is thedensity of free dislocations. For the region of n � 3 in an Al–Mg solid-solution alloy,it is known that dislocations are distributed homogeneously without forming cellstructures at high temperatures (Horiuchi and Otsuka 1972, Vagarali and Langdon1982) and the free-dislocation density during steady-state creep depends on theapplied stress as
� /1
b2�
�
� �m
, ð14Þ
where m is a constant of about 2. Connecting equation (14) to equation (13),the internal stress is approximately proportional to the applied stress, so thatequation (12) can be expressed as the same "1=nind / �=E dependence as in equation (7)at a given temperature. If the relation "1=nind / �=E describes the data completely, theexperimental curves should be a family of straight lines passing though the origin ofthe coordinate axes, which is indeed the case as shown in figure 9. These curvesare plotted with the data that lie on the straight lines with n¼ 3.2 in figure 5. Whenthe data points at each test temperature in figure 9 are linearly extrapolated, thecorresponding extrapolation lines all pass through the origin of the coordinate axes.The finding suggests that the back stress in the range M (n¼ 3.2) is the internal stress,which is connected to long-range interaction of dislocations.
3.5. Comparison with results obtained from conventional uniaxial creep testsConventional uniaxial creep test results (Pahutova and Cadek 1979, Sato and
Oikawa 1988) on Al–Mg solid-solution alloy showed that the stress exponent at a
3972 H. Takagi et al.
Figure 9. Relationship of "1=nind versus s=E. When the data points at each test temperaturein the figure are linearly extrapolated, the corresponding extrapolation lines all passthrough the origin of the coordinate axes.

given temperature typically takes a constant either of 3 or 5 depending on the appliedstress. For convenience, the medium-stress range of n � 3 is denoted by M, and thelow- and high-stress ranges of n � 5 are represented by L and H respectively. Thiskind of deformation characteristics can be explained by considering changes in theinteraction between moving dislocations and the solute atmosphere. At hightemperatures and low stresses where the diffusion rate of solute atoms is sufficientlyhigh in comparison with dislocation velocity, the dragging resistance falls off withrising temperature or decreasing stress. In the range L, the solute atoms cancompletely follow moving dislocations by diffusional migration, so that the presenceof solute atmosphere exhibits little influence on the dislocations in motion. In therange H, the dislocation velocity is considerably higher than the diffusion rate ofsolute atoms, so that mobile dislocations can break away from their solute atmos-phere at a critical stress level or higher. Experimental results (Cadek 1988) showedthat creep in the ranges L and H is rate controlled by a recovery process that dependson climb motion of dislocations, similar to creep deformation of pure metals withn � 5. In contrast, creep in the range M is rate controlled by the glide motionof dislocations which drag the solute atmosphere, and the activation energy forcreep is almost equal to that for mutual diffusion of solid-solution alloy.
Table 3 lists the results of our indentation creep test and tensile creep tests foundin the literature (Horiuchi and Otsuka 1972, Kucharov et al. 1974, Pahutova andCadek 1979) within the n � 3 region. Under similar conditions, the two testingmethods give almost the same stress exponents and activation energies for creep.These results demonstrate that indentation creep test results are equivalent toconventional uniaxial creep test results in the dislocation creep regime.
} 4. Discussion
At T¼ 573 and 590K, the n transition from 4.8 to 3.2 shows that the creeprate-controlling process changes from the climb motion to the glide motion ofdislocations at a certain stress level as indentation creep proceeds. Solid-solutionalloys at high temperatures may deform plastically by five different deformationmechanisms, so that the predominant, and thus rate-controlling, mechanismdepends decisively on the precise conditions of applied stress, temperature and
Creep characterization of Al–Mg solid-solution alloy 3973
Table 3. Comparison of indentation creep test results and conventional creep test resultsin the range M (n� 3).
Creep test method Test materialsT
(K)Stress range �
(MPa) n
Activationenergy
for creep(kJmol�1)
Indentation(current study)
Al–5.3mol%Mg alloy 573–773 3.6–72.5 3.2 123
Tension(Horiuchi and
Otsuka 1972)Al–5.1mol%Mg alloy 601–734 2.0–68.6 2.8–3.0 135–144
Tension(Kucharov et al.
1974,Pahutova and
Cadek 1979)
Al–5.5mol%Mg alloy 623 6.7–70.0 3.2 139–141

microstructure. The possible deformation mechanisms include dislocation climbrate-controlling creep (mechanism 1), dislocation glide rate-controlling creep (mech-anism 2), Harper–Dorn creep (mechanism 3), Nabarro–Herring creep (mechanism 4)and Coble creep (mechanism 5). The two mechanisms 1 and 2 interact in a sequentialmanner, but the other mechanisms 3, 4 and 5 operate independently of each other.Therefore, with all these mechanisms operating, the measured indentation strainrate "ind can be expressed as
"ind ¼"1"2
"1 þ "2þ "3 þ "4 þ "5, ð15Þ
where "i is the creep rate for the ith deformation mechanism. Under the experimentalconditions of �=E ¼ 10�4
� 10�3, d=b � 106 and T=Tm ¼ 0:63–0:85, the values of"3, "4 and "5 are negligibly small (Mohamed and Langdon 1975). Thus, equation (15)can be reduced to
"ind ¼"1"2
"1 þ "2: ð16Þ
When an applied stress is greater than the critical stress �c necessary for breakawayof dislocations from their solute atmosphere, it is anticipated that the solute atmo-sphere no longer hinders the motion of dislocations. When "1 � "2 under highapplied stresses � > �c, we have "ind � "1. This means that creep in the high-stressregime is rate controlled by some recovery process dependent on the climb motionof dislocations. In this case, it is known that the steady-state creep rate is typicallyproportional to the fifth power of applied stress, that is "ind / ð�=E Þ
5. On the otherhand, when the glide velocity of dislocations is of the order of the climb velocitydue to atmosphere drag, it follows that "ind � "2. Accordingly, the creep in low-stressrange where � < �c is rate controlled by viscous glide of dislocations, and "ind /
ð�=E Þ3 is typical (Poirier 1985).
According to Friedel (1964), the critical stress for breakaway of dislocationsfrom their solute atmosphere is inversely proportional to temperature. Similarly,the experimental result indicates that the critical stress level for the n-value transitionsignificantly decreases as temperature increases; the values of �c=E for 573K and590K are 1.24� 10�3 and 9.19� 10�4 respectively.
For the case of T¼ 773K in figure 5, the average equivalent stress � decreasesfrom 13.5 to 3.6MPa as indentation steady-state creep proceeds. If the critical stress�c at 773K is higher than 13.5MPa, one cannot detect the existence of the stressrange H (n¼ 4.8) through the instrumented microindentation technique. In fact,the stress range of n¼ 4.8 disappears when T 5 636K and only the stress range ofn¼ 3.2 can be detected during indentation creep tests.
} 5. Conclusions
Instrumented indentation is a convenient technique that enables us to explore themechanical properties of small-volume materials at high temperatures. We haveperformed indentation creep tests, where a self-similar indenter is pressed into adepth of 100 mm or less from the material surface. The current experimental setupfor indentation creep test has a number of advantages.
(i) Specimens can be small in size and simple in shape.(ii) Mechanical properties can be explored for a selected local region.
3974 H. Takagi et al.

(iii) The testing time required is relatively short.(iv) Response to a load application mechanism is satisfactory.(v) High-temperature and high-stress conditions can be easily realized.(vi) A vacuum or inert-gas test atmosphere can be prepared without difficulty.
Carefully designed indentation creep experiments together with correspondingfinite-element computations were carried out in order to establish a robust andsystematic method to extract creep properties accurately during indentation creeptests. It was confirmed that indentation creep tests of Al–5.3mol%Mg solid-solutionalloy at temperatures ranging from 573 to 773K can be effectively used to extractmaterial parameters equivalent to those obtained from conventional uniaxial creeptests in the dislocation creep regime. The key results of this study can be summarizedas follows.
(1) If the indented material is a power-law creep material (i.e. obeys equation(11)), the indentation creep strain field is self-similar during a constant-loadcreep test, except during a short transient period on initial loading or whenthere is a deformation mechanism change.
(2) When the temperature and grain size are kept constant, the creep exponent ncan be robustly extracted using
n ¼oðln "indÞ
o ln ð�=EÞ
or
n ¼1
21�
oðln _uuÞ
oðln uÞ
� �:
(3) For the Al–5.3mol%Mg solid-solution alloy used in this study, the creepstress exponent n varies distinctively from 4.8 to 3.2 at a critical stress level asindentation creep proceeds. This n-value transition indicates that the creeprate-controlling process changes from dislocation climb to viscous glide at acritical stress, which decreases significantly with increasing temperature.
(4) In the stress range where �<�c (n¼ 3.2), the back stress acting on movingdislocations is proportional to the average equivalent stress (applied stress)occurring in the region just below the impression. This finding suggests thatthe back stress is the internal stress related to long-range interaction withdislocations.
(5) The activation energy Qc for creep was found to be 123 kJmol�1, which isclose to the activation energy for mutual diffusion of this alloy, 130 kJmol�1.
(6) Experimental results indicate that the creep of the solid-solution alloy underthe condition of n¼ 3.2 and Qc¼ 123 kJmol�1 is rate controlled by viscousglide of dislocations that drag solute atmosphere. These results are in goodagreement with those obtained from conventional uniaxial creep tests inthe dislocation creep regime.
Acknowledgements
The authors gratefully acknowledge insightful suggestions from Professor SubraSuresh during the course of this study. M.F. acknowledges the support by Overseas
Creep characterization of Al–Mg solid-solution alloy 3975

Researcher Fund of Nihon University. M.D. acknowledges the support by theDefense University Research Initiative on Nano Technology which is funded atthe Massachusetts Institute of Technology by the Office of Naval Research undergrant N00014-01-1-0808.
References
ABAQUS Inc., 2002, ABAQUS, Version 6.3 (Pawtucket, Rhode Island: ABAQUS Inc.)Asif, S. A. S., and Pethica, J. B., 1997, Phil. Mag. A, 76, 1105.Atkins, A. G., Silverio, A., and Tabor, D., 1966, J. Inst. Metals, 94, 369.Bolshakov, A., and Pharr, G. M., 1998, J. Mater. Res., 13, 1049.Brandes, E. A., Brook, G. B., and Smithells, C. J., 1998, Smithells Metals Reference Book,
Seventh edition, edited by E. A. Brandes and G. B. Brook (Oxford: Butterworth–Heinemann).
Cadek, J., 1988, Creep in Metallic Materials (Amsterdam: Elsevier).Carrington, W., Hale, K. F., and McLean, D., 1960, Proc. R. Soc. A, 259, 203.Cheng, Y. T., and Cheng, C. M., 2001, Phil. Mag. Lett., 81, 9.Dao, M., Chollacoop, N., Van Vliet, K. J., Venkatesh, T. A., and Suresh, S., 2001,
Acta mater., 49, 3899.Field, J. S., and Swain, M. V., 1995, J. Mater. Res., 10, 101.Friedel, J., 1964, Dislocations (Oxford: Pergamon).Fujiwara, M., and Otsuka, M., 1999, J. Japan. Inst. Metals, 63, 760; 2001, Mater. Sci.
Engng, A319, 929.Gerberich, W. W., Nelson, J. C., Lilleodden, E. T., Anderson, P., and Wyrobek, J. T.,
1996, Acta mater., 44, 3585.Hill, R., 1983, The Mathematical Theory of Plasticity (Oxford: Clarendon).Horiuchi, R., and Otsuka, M., 1972, Trans. Japan Inst. Metals, 13, 283.Johnson, K. L., 1970, J. Mech. Phys. Solids, 18, 115.Kucharov, K., Saxl, I., and Cadek, J., 1974, Acta metall., 22, 465.Li, J. C. M., 2002, Mater. Sci. Engng, A322, 23.Li, W. B., Henshall, J. L., Hooper, R. M., and Easterling, K. E., 1991, Acta metall.,
39, 3099.Lucas, B. N., and Oliver, W. C., 1999, Metall. Mater. Trans. A, 30, 601.Mackerle, J., 2001, Finite Element Anal. Des., 37, 811.Mayo, M. J., and Nix, W. D., 1988, Acta metall., 36, 2183.Mohamed, F. A., and Langdon, T. G., 1975, Scripta metall., 9, 137.Mukherjee, A. K., Bird, J. E., and Dorn, J. E., 1969, Trans. Am. Soc. Metals, 62, 155.Mulhearn, T. O., and Tabor, D., 1960, J. Inst. Metals, 89, 7.Oliver, W. C., and Pharr, G. M., 1992, J. Mater. Res., 7, 1564.Pahutova, M., and Cadek, J., 1979, Phys. Stat. sol. (a), 56, 305.Poirier, J. P., 1985, Creep of Crystals: High-temperature Deformation Processes in Metals,
Ceramics, and Minerals (Cambridge University Press).Prakash, O., 1996, The Johannes Weertman symposium, edited by R. J. Arsenault, D. Cole,
T. Gross, G. Kostorz, P. K. Liaw, S. Parameswaran and H. Sizek (Anaheim,California: Minerals, Metals & Materials Society).
Sargent, P. M., and Ashby, M. F., 1992, Mater. Sci. Technol., 8, 594.Sato, H., and Oikawa, H., 1988, Scripta metall., 22, 87.Tabor, D., 1951, The Hardness of Metals (Oxford: Clarendon).Taylor, G. I., 1938, J. Inst. Metals, 62, 307.Vagarali, S. S., and Langdon, T. G., 1982, Acta metall., 30, 1157.Yoshinaga, H., Matsuo, S., and Kurishita, H., 1985, Trans. Japan Inst. Metals, 26, 423.
Creep characterization of Al–Mg solid-solution alloy 3976