experimental and informational modeling study on flexural
TRANSCRIPT

sustainability
Article
Experimental and Informational Modeling Study on FlexuralStrength of Eco-Friendly Concrete Incorporating Coal Waste
Farshad Dabbaghi 1 , Maria Rashidi 2, Moncef L. Nehdi 3,* , Hamzeh Sadeghi 4, Mahmood Karimaei 1,Haleh Rasekh 5 and Farhad Qaderi 1
�����������������
Citation: Dabbaghi, F.; Rashidi, M.;
Nehdi, M.L.; Sadeghi, H.; Karimaei,
M.; Rasekh, H.; Qaderi, F.
Experimental and Informational
Modeling Study on Flexural Strength
of Eco-Friendly Concrete
Incorporating Coal Waste.
Sustainability 2021, 13, 7506. https://
doi.org/10.3390/su13137506
Academic Editor: Antonio Caggiano
Received: 4 June 2021
Accepted: 2 July 2021
Published: 5 July 2021
Publisher’s Note: MDPI stays neutral
with regard to jurisdictional claims in
published maps and institutional affil-
iations.
Copyright: © 2021 by the authors.
Licensee MDPI, Basel, Switzerland.
This article is an open access article
distributed under the terms and
conditions of the Creative Commons
Attribution (CC BY) license (https://
creativecommons.org/licenses/by/
4.0/).
1 Faculty of Civil Engineering, Babol Noshirvani University of Technology, Babol 47148-71167, Iran;[email protected] (F.D.); [email protected] (M.K.); [email protected] (F.Q.)
2 Centre for Infrastructure Engineering, Western Sydney University, Penrith, NSW 2751, Australia;[email protected]
3 Department of Civil and Environmental Engineering, Western University, London, ON N6G 5L1, Canada4 Faculty of Civil Engineering, Amirkabir University of Technology, Tehran 47148-71167, Iran;
[email protected] School of Civil and Environmental Engineering, University of Technology Sydney,
Sydney, NSW 2007, Australia; [email protected]* Correspondence: [email protected]; Tel.: +1-(519)-661-2111 (ext. 88308)
Abstract: Construction activities have been a primary cause for depleting natural resources andare associated with stern environmental impact. Developing concrete mixture designs that meetproject specifications is time-consuming, costly, and requires many trial batches and destructive teststhat lead to material wastage. Computational intelligence can offer an eco-friendly alternative withsuperior accuracy and performance. In this study, coal waste was used as a recycled additive inconcrete. The flexural strength of a large number of mixture designs was evaluated to create anexperimental database. A hybrid artificial neural network (ANN) coupled with response surfacemethodology (RSM) was trained and employed to predict the flexural strength of coal waste-treatedconcrete. In this process, four influential parameters including the cement content, water-to-cementratio, volume of gravel, and coal waste replacement level were specified as independent inputvariables. The results show that concrete incorporating 3% recycled coal waste could be a competitiveand eco-efficient alternative in construction activities while attaining a superior flexural strength of6.7 MPa. The RSM-modified ANN achieved superior predictive accuracy with an RMSE of 0.875.Based on the experimental results and model predictions, estimating the flexural strength of concreteincorporating waste coal using the RSM-modified ANN model yielded superior accuracy and canbe used in engineering practice to save the effort, cost, and material wastage associated with trialbatches and destructive laboratory testing while producing mixtures with enhanced flexural strength.
Keywords: concrete; coal waste; flexural strength; artificial neural network; response surface method-ology; model; prediction; mix design
1. Introduction
Coal is considered one of the prevalent sources of energy production worldwide.However, its exploitation and extraction have caused massive waste materials [1]. Suchirresolvable and non-biodegradable waste materials have been used in many differentways yet have never reached an executive phase for diverse reasons [2]. With continu-ing improvements of the industry practice, coal extraction from mines has experiencedsubstantial growth in several locations, resulting in the production of colossal amountsof coal waste. To date, more than two million tons of coal waste material are vacatedaround factories, and this amount is rising rapidly due to the ascending trend of exploita-tion and exploration. Coal waste materials are often piled in mountainous and sylvanareas, exposed to snow and rainfall, and endangering the surrounding environment and
Sustainability 2021, 13, 7506. https://doi.org/10.3390/su13137506 https://www.mdpi.com/journal/sustainability

Sustainability 2021, 13, 7506 2 of 22
ecosystems. Accordingly, many researchers and engineers have been exploring effectiveand cost-competitive solutions to this ongoing issue [3]. Recent investigations suggest thatindustrial byproducts can improve the durability of concrete and have a low influence onthe material properties up to a certain percentage [4,5].
The effects of using recycled tires on the properties of concrete and asphalt have beenexplored in previous studies [6,7]. For instance, Aiello and Leuzzi [8] investigated theeffects of using recycled tires in fresh and hardened concrete and showed that using tirerubber partial replacement for natural fine aggregates in concrete at volume percentages of25, 50, and 75%, the flexural strength degraded by 4.49, 5.81, and 7.3%. They also found thatadding 75% by volume of crumb rubber—replacing natural fines in concrete—increasedenergy absorption. Abousnina et al. [5] investigated the application of oil-contaminatedsand (OCS) in concrete. The mechanical characteristics, strength development, hydration,and microstructure of cement mortar containing oil-contaminated sand were evaluated.Ferdous et al. [9] proposed three new railway sleeper concepts for a mainline track andinvestigated their behaviors experimentally and numerically. The structural behavior ofthe railway sleepers was evaluated experimentally under five-point static bending andwas verified via beams on elastic foundation analysis. Moreover, an in-depth investiga-tion of the in-track behavior of sleepers was conducted using finite element simulation.Rahmani et al. [10] evaluated the behavior of concrete containing Polyethylene Thereph-thalate (PET) 5, 10, and 15% by volume of sand replacement at a water-to-cement (w/c)ratio of 0.42 and 0.54. Their results indicated that adding 5% PET at a w/c ratio of 0.42and 0.54 increased the concrete flexural strength by 6.71 and 8.02%, respectively. How-ever, the flexural strength of concrete specimens decreased with increasing PET content,marking 14.7 and 6.25% of flexural strength reduction for concrete containing 15% PET atthe examined w/c ratios, respectively. Several other byproducts have been beneficiated inconcrete, including mine tailings [11], glass sludge [12,13] coal bottom ash, [14] waste latexpaint, [15] waste marble, [16] sugarcane bagasse ash, etc.
Concrete is the most widely used construction material on earth. If considered bycountry, the cement industry will rank as the third-largest global emitter of carbon diox-ide [17–19]. Considering the sheer volume of concrete production, it offers a conducivemedium for the beneficiation of large amounts of industrial and mining byproducts. Hence,there need for research to explore the effects of recycling industrial and minim byproductson concrete performance. A key mechanical characteristic of concrete is its flexural strength.While its magnitude depends on the concrete mixture design, its accurate prediction ishampered with several challenges. Thus, determining the flexural strength of concretehas generally been carried out through time-consuming and costly destructive testing.Predictive models for estimating flexural strength have long been of interest to researchersowing to potential time, labor, and cost savings. Accordingly, several researchers haveproposed various models for predicting concrete behavior using different mathematicaltechniques, such as linear and non-linear regression methods [20–22].
More recently, data-driven computational intelligence methods, such as machinelearning and deep learning have attracted great interest in predicting the engineeringproperties of cement-based materials. For instance, such techniques have recently been usedfor mixture optimization [23] and predicting the carbonation depth in recycled concreteaggregate [24], shear strength of reinforced concrete shear walls [25], compressive strengthof phase change materials integrated cementitious composites [26], shear strength andfailure mode of SFRC beams [27], ultra-high-performance concrete compressive [28], andstructural response of RC slabs exposed to blast loading [29]. Dedicated literature reviewson the use of machine learning in predicting the properties of concrete are readily accessiblein the open literature [30,31].
The goal of the present study is to develop a suitable and economical solution forbeneficiating coal waste in the concrete manufacturing process. Thus, the feasibilityof developing a type of concrete incorporating coal waste and having suitable flexuralstrength was explored. If using coal waste as an additive material in concrete is successful,

Sustainability 2021, 13, 7506 3 of 22
not only would it mitigate the disposal problem of this waste, but it would also reducethe need for virgin concrete raw materials, thus saving natural resources. Furthermore,to alleviate the need for laborious, costly, and time-consuming trial batches to developconcrete with adequate flexural strength, a hybrid artificial neural network (ANN) coupledwith response surface methodology (RSM) was trained and employed to accurately predictthe flexural strength of coal waste treated concrete. In addition, the use of coal waste inconcrete yields environmental benefits so that the stockpiling of this harmful by-productcan be mitigated. Moreover, partial substitution of cement with coal waste can reducecarbon dioxide emissions from cement production and yield economic advantage throughreducing the cost of concrete production.
Given that the influential input parameters on flexural strength of such concrete arenot available in the existing literature, this study carried out an extensive experimentalstudy and deployed the response surface methodology and variance analysis, for the firsttime, to extract the important parameters affecting the flexural strength in order to enhancethe modeling accuracy. Such a sustainable alternative to conventional destructive testingis presented to predict the flexural strength of concrete. Determining the most suitablemodel by comparing the traditional neural network and the response surface methodology(RSM)-modified artificial neural network is another novel aspect of this paper. Finally, amodel for predicting the flexural strength is proposed using non-linear regression analysis.
Wastes from coal mine extraction have become a paramount challenge in recent years.For each ton of hard coal produced by mining extraction, 400 kg of waste material is gener-ated. The resulting piles of coal refuse typically have momentous negative environmentalimplications, including the leaching of iron, manganese, and aluminum residues into water-ways, along with the possible generation of acid mine drainage. With the ongoing greaterinternational efforts to achieve the United Nations sustainability goals, novel solutions areneeded for the management of such colossal volumes of coal waste. The existing practiceto manage coal waste includes complex reprocessing for instance using fluidized beds. Thepresent study pioneers a sustainable and simple solution consisting of using coal wastein the form of a powder in concrete mixtures. Considering the sheer volume of concreteproduced worldwide, this practice could alleviate the problems of coal waste disposal. It isnoteworthy that there is a dearth of research in this area in the open literature. In particular,informational modeling has not been applied to this topic previously.
2. Materials and Methods2.1. Materials
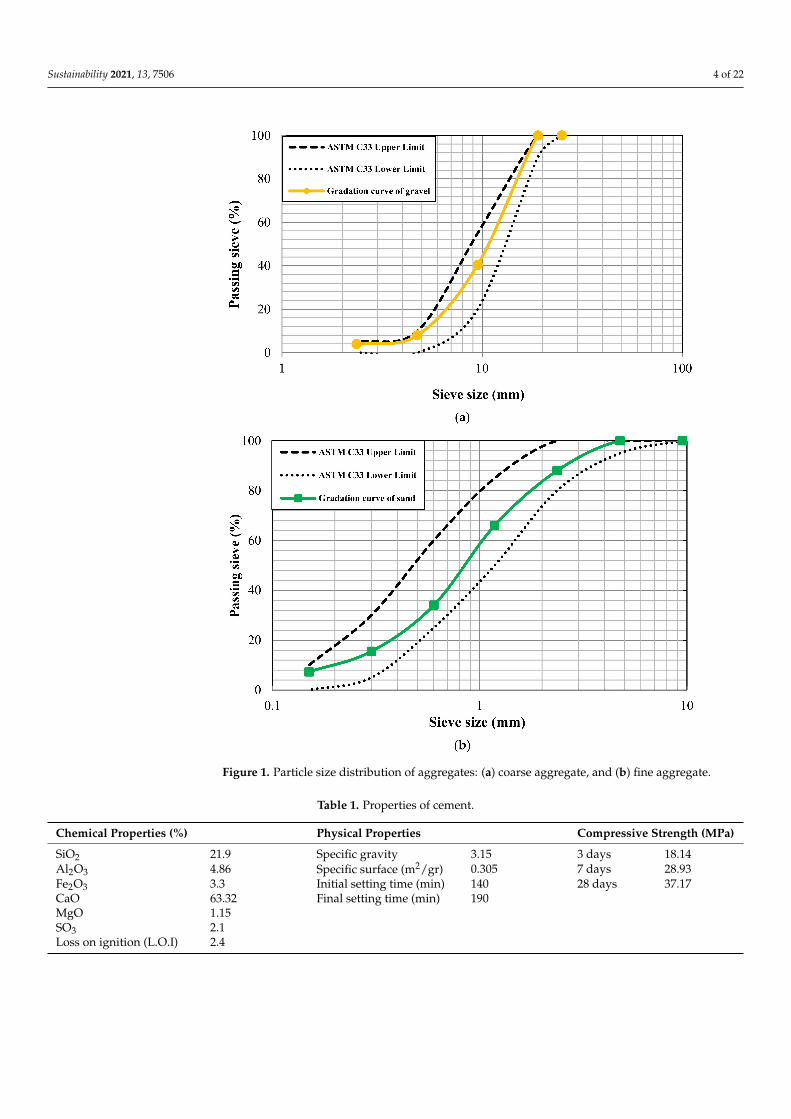
In the present study, gravel having a maximum particle size of 12.5 mm was used. Itsspecific gravity (g/cm3), unit weight (g/cm3), moisture content (%), and saturated surfacedry moisture content (%) are 2.52, 1.59, 0.14, and 0.4, respectively. The correspondingcharacteristics for the used fine aggregate are 2.76, 1.73, 0.3, and 0.3, respectively. Thefineness modulus (FM) of the sand is 2.89 and its sand equivalent (SE) value is 84%. Thedry specific weight of sand was 1.59 g/cm3. The particle size gradation of the aggregates isdepicted in Figure 1 and meets the ASTM C33 [32] standard requirements. Type II Portlandcement obtained from the Golestan Peyvand Cement Company based in north Iran wasused in this study. Table 1 provides the chemical, physical, and mechanical characteristicsof this cement. Coal waste materials were collected from a coal preparation companylocated in the Anjir Tangeh area in the north of Iran. The used coal waste was producedduring the coal washing process at a local company producing coal concentrate as a fuel fordifferent industries. A sieve mesh size of 0.075 mm (sieve 200) was used to sift materials,and then the resulting material was used as a concrete additive. The chemical compositionof this coal waste is given in Table 2.
Sustainability 2021, 13, 7506 4 of 22
Figure 1. Particle size distribution of aggregates: (a) coarse aggregate, and (b) fine aggregate.
Table 1. Properties of cement.
Chemical Properties (%) Physical Properties Compressive Strength (MPa)
SiO2 21.9 Specific gravity 3.15 3 days 18.14Al2O3 4.86 Specific surface (m2/gr) 0.305 7 days 28.93Fe2O3 3.3 Initial setting time (min) 140 28 days 37.17CaO 63.32 Final setting time (min) 190MgO 1.15SO3 2.1Loss on ignition (L.O.I) 2.4

Sustainability 2021, 13, 7506 5 of 22
Table 2. Chemical specifications of coal waste.
Items SiO2 AL2O3 Fe2O3 MgO CaO P2O5–P2O3 Na2O K2O MnO TiO2 L.O.I
UntreatedCoal waste 37.8 13.14 2.85 0.73 0.76 0.27 0.28 2.02 0.02 1.17 40.96
2.2. Concrete Mixtures and Experimental Procedures
To develop effective mixture designs for concrete incorporating untreated coal waste,response surface methodology was adopted in this study, and four variables including thew/c ratio (0.40, 0.45, 0.49, 0.55, and 0.60), cement content, gravel volume, and coal wastepercentage (3.00, 5.25, 7.50, and 9.75%) were considered as independent input variables.The variation ranges of these variables were determined according to the previous studies,and thus, 30 mixture designs of concrete were prepared as shown in Table 3 yielding atotal of 90 tests conducted to evaluate the flexural strength of specimens. To prepare theconcrete specimens, the gravel and sand were first mixed in the mixer for one minute. Thecement and coal waste were then added and mixed for another one minute. Afterward,water was gradually added to the mixture over 30 s, and the mixture was stirred for anadditional two minutes. Then, the fresh concrete was poured into prismatic molds. Avibrating table was used for the consolidation and removal of any entrapped air bubbles.The prismatic specimens were demolded after 24 h and placed inside a water tank forcuring over a period of 28 days based on the ASTM C192 [33] standard procedure. Todetermine the flexural strength of specimens cured for 28 days according to the ASTMC293 [34], three prismatic beams with a dimension of 500 × 100 × 100 mm were tested foreach mixture design using a universal testing machine. In this experiment, the loadingwas applied to the beams at midspan with a rate of 0.5 mm/min. Three experiments wereconducted for each mixture design and the average value was reported in Table 3 to ensurethe reproducibility and accuracy of test results.

Sustainability 2021, 13, 7506 6 of 22
Table 3. Concrete mixing plan.
Mix W/C Coal Waste(%)
Cement(kg/m3)
Water(kg/m3)
Gravel(kg/m3)
Sand(kg/m3)
Coal Waste(kg/m3)
Flexural Strength(MPa)
R1 0.40 5.25 375 150 784 744.8 19.69 6.260R2 0.45 3.00 412 185.4 720 684.0 12.36 5.140R3 0.45 7.5 340 153.0 720 684.0 25.50 6.360R4 0.45 7.5 412 185.4 880 836.0 30.90 4.325R5 0.45 7.5 340 153.0 880 836.0 25.50 4.915R6 0.45 3.00 340 153.0 880 836.0 10.20 5.090R7 0.45 3.00 340 153.0 720 684.0 10.20 6.675R8 0.45 7.50 412 185.4 720 684.0 30.90 6.655R9 0.45 3.00 412 185.4 880 836.0 12.36 5.560
R10 0.49 5.25 375 183.75 640 608.0 19.69 5.430R11 0.49 5.25 375 183.75 784 744.8 19.69 5.875R12 0.49 9.75 375 183.75 784 744.8 36.56 4.080R13 0.49 5.25 375 183.75 784 744.8 19.69 6.605R14 0.49 7.50 375 183.75 784 744.8 28.10 5.620R15 0.49 5.25 375 183.75 784 744.8 19.69 6.350R16 0.49 5.25 445 218.05 784 744.8 23.36 6.620R17 0.49 5.25 375 183.75 960 912.0 19.69 5.540R18 0.49 5.25 375 183.75 784 744.8 19.69 5.395R19 0.49 5.25 375 183.75 784 744.8 19.69 6.395R20 0.49 5.25 305 149.45 784 744.8 16.01 6.025R21 0.49 5.25 375 183.75 784 744.8 19.69 6.640R22 0.55 7.50 412 226.6 880 836.0 30.90 6.160R23 0.55 7.50 340 187.0 880 836.0 25.50 5.940R24 0.55 3.00 412 226.6 880 836.0 12.36 5.500R25 0.55 7.50 340 187.0 720 684.0 25.50 5.420R26 0.55 3.00 340 187.0 720 684.0 10.20 5.770R27 0.55 3.00 412 226.6 720 684.0 12.36 5.980R28 0.55 3.00 340 187.0 880 836.0 10.20 5.750R29 0.55 7.50 412 226.6 720 684.0 30.90 6.440R30 0.60 5.25 375 225.0 784 744.8 19.69 4.145
3. Modeling Approach
Inspired by the process of the biological brain, artificial neural networks (ANN) offera powerful strategy to process information. The inputs in ANN are past observations thataffect the goal function, while the output results in the prediction of the future outcome byconsidering the weight of each variable and a certain amount accumulated in each neuron.One of the most critical performance functions is the “tangent hyperbolic”. Neurons are themain constituent of the ANN. Generally, ANN models consist of three parts: inner (input)layer, hidden layer(s), and outer layer, as depicted in Figure 2. Each layer is responsible forreceiving data, processing it, and producing an output unit. Each neuron in the inner layeris connected to the neurons in the hidden layer(s). It is noted that there are no connectionsbetween the neurons inside each layer. The number of neurons in each layer depends onseveral factors. For instance, the number of neurons in the inner and outer layers dependson the input and output parameters considered in the modeling process. Conversely, thenumber of neurons in the hidden layer(s) is determined using different methods based onthe problem complexity, and this often consists of a trial and error process [35]. Using realdata, the output of the ANN primarily tends to be the same as the laid goal output, andthus, the ANN learns [36]. The network is moderated by comparing its output with thegoal output until the difference is minimum. Since there is no proven method to determinethe number of layers and neurons, choosing the number of layers and neurons in a waythat makes the network output meaningful and makes its difference with the output goalis minimum is the most challenging step in predicting a model by ANN method [35]. Inthis paper, more than 300 networks were assessed by changing the neurons of each layer to

Sustainability 2021, 13, 7506 7 of 22
achieve the most suitable network. Given that each assessment was performed four times,a total of 1200 different experiments were conducted to attain the optimum network.
Figure 2. Illustration of a simple form of Artificial Neural Network (ANN).
The Feed Forward network used in this research consists of an input layer, one orseveral hidden layers, and an output layer. Weight is also considered relative to eachconnection. This algorithm is one of the most widely used for training ANNs, where thegradient descent slope decrease method is used so that errors are directed from the outputlayer to the input layer, and the weights are distributed in an order that the errors becomeminimum. Consequently, the training process consists of gradual weight correction tominimize the error functions. This action continues until one of the stopping criteria is notsatisfied [35,36]. Modeling errors can be calculated by considering the differences betweenthe network output and the actual data through different criteria in the performanceevaluation. The criteria used in this research include the Root Mean Square, Random Error(R2), Mean Squared Error (MSE), Mean Absolute Error (MAE), and Root Mean SquareError (RMSE), as presented in Table 4. In this Table, yt signifies the experimental data, y0 isthe value estimated by the ANN after learning, and n is the entire count of data at eachstep. MAE, RMSE, and MSE are in the range of [0,+∞], with values closer to zero (R2 closerto 1) imply better model fitness and closer output data to the goal output.
Table 4. Statistical metrics used as criteria for model performance evaluation.
Criteria for the Used Models Equation
Root Mean Square: Random Error (R2) R2 = 1− ∑(yo−yt)2
∑(yt)2
Mean Squared Error (MSE) RMSE =
√∑(yO−yt)
2
nMean Absolute Error (MAE) MAE = ∑|yo−yt |
nRoot Mean Square Error (RMSE) MSE = ∑(yO−yt)
2
n
To attain optimal use of coal waste and mixture design, the RSM method was used inthis study. In this method, the Central Composite Design (CCD) solution was deployed,in which the number of experiments is decreased dramatically, leading to saving time,material, and cost. It is noted that this method can not only assess the effects of indepen-dent parameters, but also their interactions, predict the outcome using variable inputs,determine the optimum values and their location of occurrence, and present multi-repliedoptimization for the experimental outputs [37,38]. In the RSM model, variables and theirchanging ranges should be first determined. Subsequently, they are categorized, and theirfront and end are introduced as two levels coded with +1 and −1. The third level thatstands between these two levels is called the zero level or the central level. Two otherlevels with the ranges of (−∞) and (+∞) are added and placed before the −1 and after +1levels [39,40].

Sustainability 2021, 13, 7506 8 of 22
In this study, the dependent variables in the normal ANN modeling included the w/cratio, cement content, volume of gravel, and coal waste percentage. In contrast, the numberof dependent variables was increased to 19 in the RSM-modified ANN modeling to increasemodel accuracy. The additional independent variables comprised the second-grade effectsand mutual effects. As mentioned earlier, the most challenging part of teaching the ANNis to determine the number of layers and neurons in each layer. In this study, 70% of thedata were randomly provided to the neural network as input data for training purposes,15% of the data were used for model validation, and 15% were used for model testing. Thisratio was determined by trial and error to achieve accuracy and avoid network overfitting.
The number of hidden layers must be set such that (i) the amount of discrepancybetween the network output and the actual data is minimized, and (ii) an excessive in-crease in the number of layers does not cause over-fitting. Since there is no limitation indetermining layers and neurons, more than 200 networks were assessed in this paper tolook for the optimal maximum number of layers and neurons using different repetitions bychanging the numbers of layers and neurons. Thereby, a total of 1000 different networkswere evaluated by considering a five times repetition for each network. As a result, theoptimum network for the normal neural network was chosen to have two hidden layers, inwhich ten and eight neurons were presented in the first and second layers, respectively.Likewise, the optimum network for the RSM-modified ANN was selected to have threehidden layers with eight neurons in the first layer, eight neurons in the second layer, andsix neurons in the third layer.
4. Results and Discussion4.1. Effect of Independent Parameters
After conducting flexural tests, as shown in Figure 3, the obtained flexural strengthresults were submitted to the Design Expert software [41]. Using the response surfacemethod, the variation trend of the flexural strength was determined based on the assumedindependent variables presented below. As per the results presented in Table 3, the leastflexural strength (4.08 MPa) corresponds to mixture R12, in which the highest replacementlevel of coal waste (36.56 kg/m3) was used. The maximum flexural strength (6.675 MPa)was attained by mixture R7 made with 3% (10.20 kg/m3) of coal waste. The result of aprevious study by Karimaei et al. [3] also showed that by increasing the percentage ofreplacing natural aggregates with coal waste, the flexural strength of concrete decreased.Using 5% and 25% of untreated coal waste, the flexural strength decreased by 1% and 10%,respectively. On the other hand, when 10% and 25% of sand were replaced with untreatedcoal waste, the flexural strength increased by 6% and decreased by 7%, respectively. There-fore, a lower dosage of coal waste can both serve sustainability and improve the flexuralstrength of concrete. The deduction in flexural strength of concrete incorporating a higherdosage of coal waste can be ascribed to the poor bond between coal waste and cement pasteresulting in a weaker interfacial transition zone. Consequently, the flexural tensile stressinduces cracks in concrete specimens and causes flexural failure. The observed failuremode was typical of plain concrete beams, displaying a brittle, sudden failure right afterthe appearance of the first flexural crack. No significant difference in fracture surfaces wasobserved between specimens made with or without waste coal.

Sustainability 2021, 13, 7506 9 of 22
Figure 3. Universal testing machine.
According to Table 3, by increasing the w/c ratio, the flexural strength of concretespecimens decreased as expected. Additionally, increasing the gravel and sand contentat constant w/c ratio, coal waste percentage, and cement content, decreased the flexuralstrength, such as for mixtures R6 and R7. The reason for this reduction in flexural strengthis related to the lower amount of cement per unit volume, which decreases the bondbetween different particles. It should be noted that at a low w/c ratio, increasing the coalwaste dosage caused an increase in the flexural strength.
Figure 4 shows variations of flexural strength versus the coal waste percentage. Theflexural strength of specimens first slightly increased with an increasing percentage of coalwaste, and then decreased. This is likely because at low dosage the coal waste played amicrofiller effect, reducing porosity. However, beyond 6%, cement dilution prevailed, andthe flexural strength decreased as a consequence. It is also noted that the maximum rateof flexural strength was about 10% of the initial strength. For a w/c ratio of 0.5, gravelvolume of 784 kg/m3, and cement content of 375 kg/m3, the flexural strength of specimensranged between 5.7 and 6.2 MPa by increasing the coal waste content from 3 to 7.5%. Usingnon-linear regression analysis, the relationship for flexural strength versus coal waste (CW)percentage is expressed for all concrete samples via Equation (1) with a high coefficient ofdetermination (R2 = 0.93).
fct = (4.15× e(0.025CW)) + 0.65 (1)
Figure 4. Variation of flexural strength relative to the coal waste in dosage (at w/c ratio of 0.5, gravelvolume of 784 kg/m3, and cement volume of 375 kg/m3).

Sustainability 2021, 13, 7506 10 of 22
Figure 5a depicts the simultaneous effects of the w/c ratio and coal waste contenton the flexural strength of concrete specimens. It is implied that when the w/c ratio waslower, the increasing rate of flexural strength was intensified by increasing the coal wastepercentage. Comparatively, when the cement content and coal waste percentage were atthe maximum level, the flexural strength reached its minimum value.
Figure 5. Concurrent effect of (a) w/c ratio and coal waste percent, and (b) cement content and coalwaste percent on flexural strength.
Using non-linear regression analysis, the relationship between flexural strengthand coal waste dosage for different groups of concrete specimens was expressed as perEquation (2) with a high coefficient of determination (R2 = 0.94).
fct = (3 + 50(wc)
9.7+ 5.2CW0.21)
0.71(2)
Sustainability 2021, 13, 7506 11 of 22
Figure 5b shows the concurrent effect of cement content and the percentage of coalwaste on flexural strength. It is noted that the flexural strength in concrete with maximumcement content is decreased by increasing coal waste content. However, when cementcontent is minimum, the flexural strength increases at first and then declines as the coalwaste percentage increased. Based on the results, in w/c ratio of 0.5 and gravel volume of784 kg/m3, the flexural strength ranges from 5.7 to 6.25 MPa when concrete mix designwith a 3% coal waste percent and 340 kg/m3 cement content changes to mix with a coalwaste amount of 7.5% and cement content of 412 kg/m3.
Using non-linear regression analysis, the relationship between flexural strength, coalwaste percentage (CW), and the amount of cement (C) are expressed for all concrete samplesas Equation (3) with a high coefficient of determination (R2 = 0.94).
fct = 18.4 + 0.72CW − 0.079C− 0.079CW2 + 0.00011C2 (3)
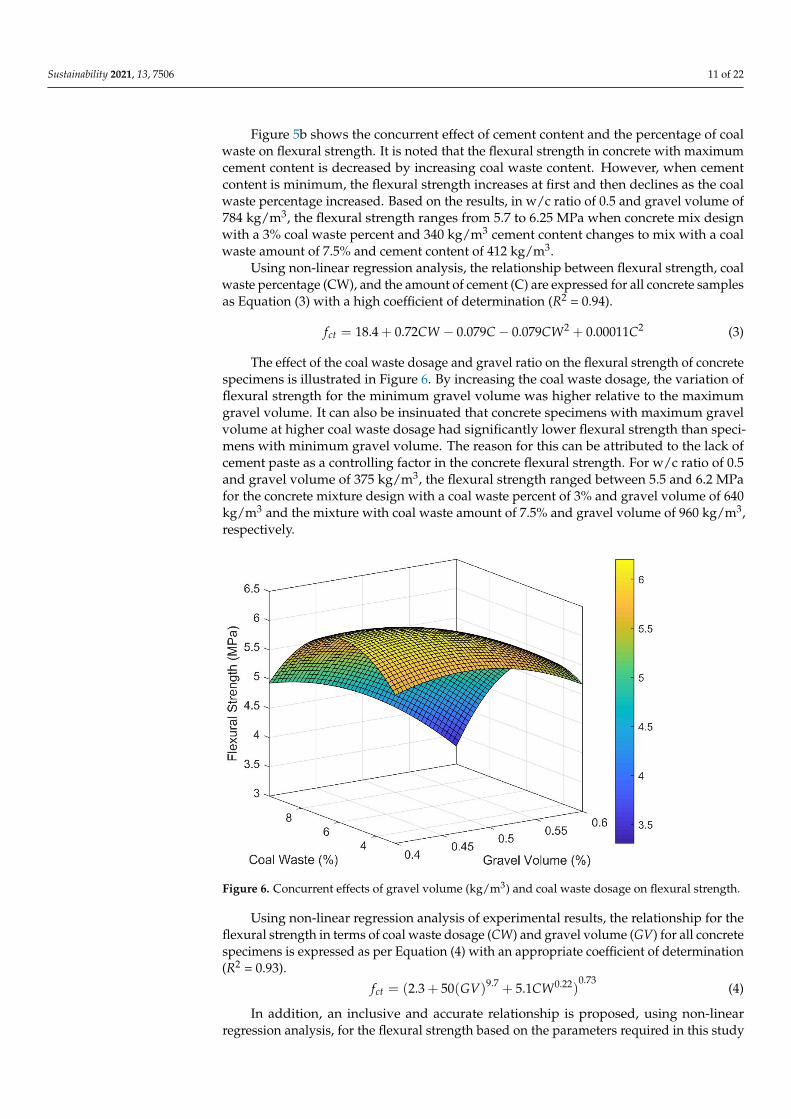
The effect of the coal waste dosage and gravel ratio on the flexural strength of concretespecimens is illustrated in Figure 6. By increasing the coal waste dosage, the variation offlexural strength for the minimum gravel volume was higher relative to the maximumgravel volume. It can also be insinuated that concrete specimens with maximum gravelvolume at higher coal waste dosage had significantly lower flexural strength than speci-mens with minimum gravel volume. The reason for this can be attributed to the lack ofcement paste as a controlling factor in the concrete flexural strength. For w/c ratio of 0.5and gravel volume of 375 kg/m3, the flexural strength ranged between 5.5 and 6.2 MPafor the concrete mixture design with a coal waste percent of 3% and gravel volume of 640kg/m3 and the mixture with coal waste amount of 7.5% and gravel volume of 960 kg/m3,respectively.
Figure 6. Concurrent effects of gravel volume (kg/m3) and coal waste dosage on flexural strength.
Using non-linear regression analysis of experimental results, the relationship for theflexural strength in terms of coal waste dosage (CW) and gravel volume (GV) for all concretespecimens is expressed as per Equation (4) with an appropriate coefficient of determination(R2 = 0.93).
fct = (2.3 + 50(GV)9.7 + 5.1CW0.22)0.73
(4)
In addition, an inclusive and accurate relationship is proposed, using non-linearregression analysis, for the flexural strength based on the parameters required in this study
Sustainability 2021, 13, 7506 12 of 22
for different groups of concrete specimens in the form of Equation (5) with a coefficient ofdetermination (R2 = 0.93).
fct = (0.5 + C× (wc)
14.1+ C× GV14.7 + 3.5× e(CW0.045))
0.73(5)
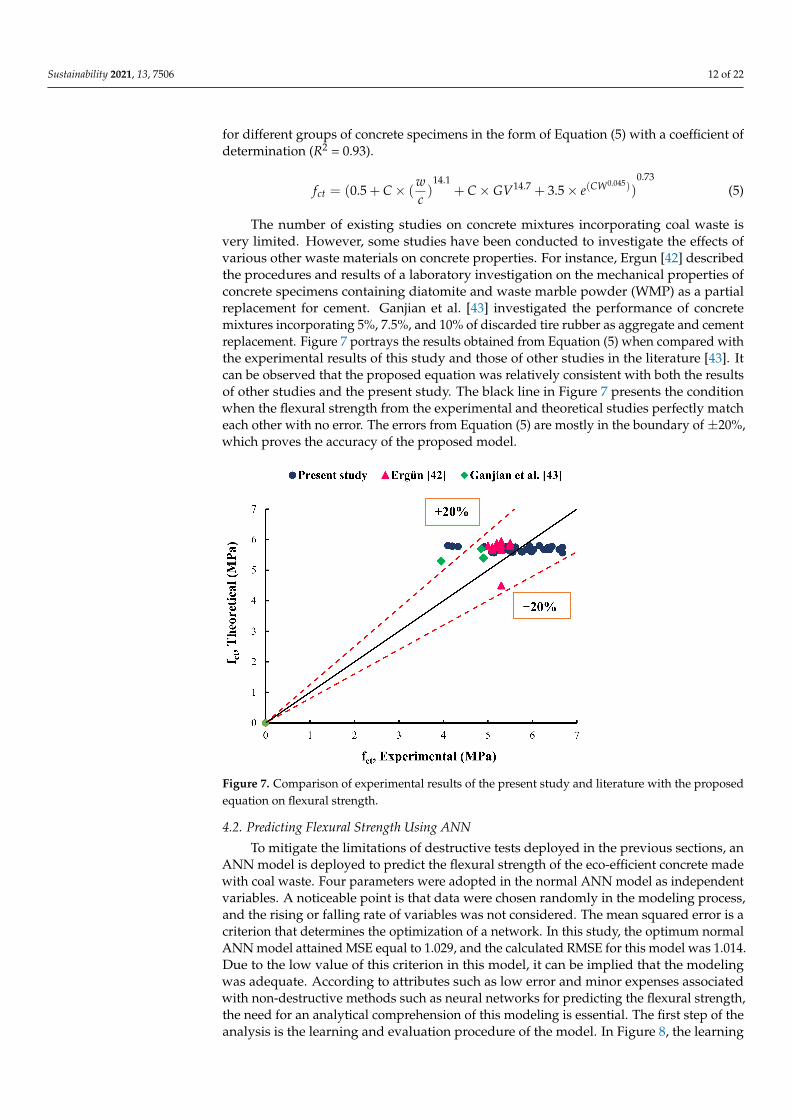
The number of existing studies on concrete mixtures incorporating coal waste isvery limited. However, some studies have been conducted to investigate the effects ofvarious other waste materials on concrete properties. For instance, Ergun [42] describedthe procedures and results of a laboratory investigation on the mechanical properties ofconcrete specimens containing diatomite and waste marble powder (WMP) as a partialreplacement for cement. Ganjian et al. [43] investigated the performance of concretemixtures incorporating 5%, 7.5%, and 10% of discarded tire rubber as aggregate and cementreplacement. Figure 7 portrays the results obtained from Equation (5) when compared withthe experimental results of this study and those of other studies in the literature [43]. Itcan be observed that the proposed equation was relatively consistent with both the resultsof other studies and the present study. The black line in Figure 7 presents the conditionwhen the flexural strength from the experimental and theoretical studies perfectly matcheach other with no error. The errors from Equation (5) are mostly in the boundary of ±20%,which proves the accuracy of the proposed model.
Figure 7. Comparison of experimental results of the present study and literature with the proposedequation on flexural strength.
4.2. Predicting Flexural Strength Using ANN
To mitigate the limitations of destructive tests deployed in the previous sections, anANN model is deployed to predict the flexural strength of the eco-efficient concrete madewith coal waste. Four parameters were adopted in the normal ANN model as independentvariables. A noticeable point is that data were chosen randomly in the modeling process,and the rising or falling rate of variables was not considered. The mean squared error is acriterion that determines the optimization of a network. In this study, the optimum normalANN model attained MSE equal to 1.029, and the calculated RMSE for this model was 1.014.Due to the low value of this criterion in this model, it can be implied that the modelingwas adequate. According to attributes such as low error and minor expenses associatedwith non-destructive methods such as neural networks for predicting the flexural strength,the need for an analytical comprehension of this modeling is essential. The first step of theanalysis is the learning and evaluation procedure of the model. In Figure 8, the learning

Sustainability 2021, 13, 7506 13 of 22
procedure of the normal ANN is presented in the three steps of training, validation, andtesting. The neural network process stops when the number of validation errors exceedsthe allowed number, which was six continuous errors. The training error in the normalneural network first decreased as the validation error decreased, before the optimum point,then increased and finally decreased with a very slight slope. Generally, such a point,shown in Figure 8 by a green circle, is known as the best validation performance where theMSE amount for this model was 0.0087.
Figure 8. Diagram of neural network learning in the three steps of training, validation, and testing.
Data regression diagrams for the normal neural network are depicted in Figure 9. Inthese diagrams, the function in the dotted line is the target function, which is the bestmethod of locating the determined function by the neural network. If it occurs, R will beequal to one, and if not, it will be less than one. The function sketched beside the verticaldiagram is the fitted function by the neural network on the available data points. Thisdiagram is plotted for all the three divided groups that contain training, validation, andtest data, and the regression of each is determined individually. According to the results,all diagrams had regressions of more than 0.96.

Sustainability 2021, 13, 7506 14 of 22
Figure 9. Regression diagrams of the available data in the normal neural network for learning andthe equation for the associated fitted line.
An optimum model is achieved when the associated error reaches its minimumcompared to the actual amount. To compare and evaluate the validity of a network,errors between the actual and neural network-predicted amounts must be compared. Thecomparison between the normal neural network’s output and the actual values is illustratedin Figure 10.
Figure 10. Comparison between the actual and neural network predicted values.
Furthermore, all the dependent variables in this study should be multiplied by anoptimized coefficient based on the trained model. The contribution of each neuron through

Sustainability 2021, 13, 7506 15 of 22
a specific constant value known as “bias” is listed in Table 5 along with all the othercoefficients. The final neural network model of this study was obtained by substitutingthe coefficients in Table 5 with the proposed function of the model Equation (6) in whichk is the input variable, Z is the number of neurons in the hidden layer, and Wj,i(n) is theweight value.
Table 5. The coefficient matrix for each of the variables and bias values for each neuron.
Independent Variables
W/C Cement Gravel Coal Waste BIAS
Layer1
N 1-1 1.4255 −1.6036 0.65367 1.0762 −2.5832N 1-2 0.75982 1.1982 −1.3435 −1.2943 −2.1712N 1-3 −0.95069 1.6273 1.3359 −0.45526 1.8651N 1-4 2.5719 −0.18724 0.77472 −1.5824 −1.1693N 1-5 0.16151 0.1784 0.202 −3.04 −0.74634N 1-6 −1.2883 −0.00035 1.177 1.932 −0.17828N 1-7 −1.5654 −0.9002 1.1944 2.314 −1.277N 1-8 0.5984 2.3704 −0.91183 −0.51606 1.5529N 1-9 1.3918 0.56141 −0.10028 1.2735 2.8188N 1-10 0.80132 0.95138 −0.28147 −2.1724 2.4328
Layer 1
N1-1 N1-2 N1-3 N1-4 N1-5 N1-6 N 1-7 N 1-8 N 1-9 N1-10 BIAS
Layer2
N 2-1 −0.16 0.58 −0.18 0.98 0.83 −0.90 −0.41 0.43 −0.14 −0.38 1.84N 2-2 −0.31 0.66 0.003 1.29 −0.91 0.22 0.06 −0.34 0.15 0.88 1.28N 2-3 0.54 −0.30 0.14 −0.05 0.79 0.22 −0.71 −0.87 −0.48 −0.70 −0.83N 2-4 0.32 −0.03 0.06 −1.25 0.75 −0.20 −1.75 −0.97 0.09 0.71 −0.22N 2-5 −0.77 −0.24 1.11 −0.43 −0.25 1.32 0.69 −0.62 0.21 0.07 −0.23N 2-6 −0.07 −0.77 −0.42 −0.37 −0.84 −0.40 0.62 0.46 0.39 0.94 −0.70N 2-7 −0.30 −0.95 −0.025 −0.15 −0.33 0.61 0.96 −0.10 0.10 −0.69 −1.06N 2-8 0.39 −0.21 0.42 −0.57 −0.48 0.67 −0.94 0.22 −0.85 −0.10 1.77
Layer 2
N 2-1 N 2-2 N 2-3 N 2-4 N 2-5 N 2-6 N 2-7 N 2-8 BIAS
Output −0.228 0.85987 −0.32309 1.1469 0.47257 −0.027428 −0.063393 −0.44329 −1.0208
4.3. Predicting Flexural Strength Using RSM-Modified Neural Network
To enhance the model accuracy using RSM in this paper, the influential parameters onthe flexural strength of concrete and their effects on the normal neural network were con-sidered as independent variables of the neural network. Hence, fifteen effective variableswere extracted via RSM, and four normal independent variables, as the RSM-modifiedneural network variables, and submitted to the network. Similar to the normal neuralnetwork modeling, data selection was made randomly to have an exogenous effect on theresults of the network modeling.
Table 6 portrays the distribution of data based on their variance analysis. The modelused for concrete flexural strength is of the cubic type, in which the non-effective terms wereomitted to make the effects visible and tangible. The flexural strength model had 18 degreesof freedom, and the p-value was less than 5%, indicating that the model was meaningful.The p-value shows the amount of lack differences emanating from the initial hypothesis.All factors in the RSM-recommended cubic model were considered as input variablesfor the neural network, in addition to the four main parameters in the RSM-modifiedneural network.
y =Z
∑J=1
Wj,i(n+1)1− e−2(∑k
J=1 Wj,i(n)Xj+bi(n))
1 + e−2(∑kJ=1 Wj,i(n)Xj+ bi(n) )
+ bi(n+1) (6)

Sustainability 2021, 13, 7506 16 of 22
Table 6. ANOVA for Response Surface Reduced Cubic Model (Aliased).
Response Flexural Strength
Analysis of Variance Table [Partial Sum of Squares—Type III]
Source Sum ofSquares * df Mean
Square F Value p-ValueProb > F
Model 12.74 18 0.71 2.7 0.0479
A-W/C 1.85 1 1.85 7.08 0.0222
B-Cement Content 0.047 1 0.047 0.18 0.6792
C-Gravel volume 0.046 1 0.046 0.18 0.6832
D-Coal waste 0.31 1 0.31 1.18 0.3008
AC 1.35 1 1.35 5.15 0.0444
AD 0.083 1 0.083 0.32 0.5854
BC 6.97 × 10⁻³ 1 6.97 × 10⁻³ 0.027 0.8734
BD 0.27 1 0.27 1.02 0.3335
CD 0.22 1 0.22 0.85 0.3755
A2 0.89 1 0.89 3.41 0.0917
B2 9.62 × 10⁻⁶ 1 9.62 × 10⁻⁶ 3.68 × 10⁻⁵ 0.9953
C2 1.51 × 10⁻³ 1 1.51 × 10⁻³ 5.77E × 10−3 0.9408
D2 2.39 1 2.39 9.13 0.0116
ACD 0.71 1 0.71 2.71 0.1278
BCD 0.66 1 0.66 2.52 0.1405
AC2 2.15 1 2.15 8.22 0.0153
B2C 0.79 1 0.79 3 0.111
A3 0 0
D3 1.03 1 1.03 3.95 0.0724
Residual 2.88 11 0.26
Lack of Fit 1.71 6 0.28 1.22 0.4246
Pure Error 1.17 5 0.23
Cor. Total 15.62 29
* df = Degree of freedom.
As explained previously, MSE is a parameter that determines the optimization ofthe network. In this model, MSE was 0.765, and RMSE was equal to 0.875. The trainingprocedure of the RMS-modified neural network model is presented in Figure 11. Thetraining error in this model initially decreased with a high changing rate, after which therate declined. In addition, the validation error had a sharply increasing rate, contrary to theend of the procedure with a very low decreasing rate. It should be noted that MSE for thismodel was 0.0465 at the best validation performance point. Figure 12 depicts the regressiondiagrams of the training data submitted to the RSM-modified neural network. It can beobserved that the regression values of all diagrams in this model were more than 0.97.As the error between the actual and predicted values is negligible, the network modelingattained superior accuracy. Actual and predicted result rates are presented in Figure 13.In addition, the bias and weight values of the RSM-modified neural network model arepresented in Table 7.

Sustainability 2021, 13, 7506 17 of 22
Table 7. Coefficient matrix for each of the variables and bias values for each neuron in the RSM-modified network.
Independent Variables
W/C(A)
Cement(B)
Gravel(C)
CoalWaste (D) AC AD BC BD CD A2 B2 C2 D2 ACD BCD AC2 B2C A3 D3 BIAS
Layer1
N 1-1 0.12 −0.25 0.07 −0.05 −0.32 −0.24 0.13 −0.35 0.47 0.48 −0.07 0.35 0.49 −0.25 −0.56 0.33 −0.51 −0.41 0.5 −1.57N 1-2 0.04 0.19 −0.95 0.1 −0.61 −0.62 −0.49 −0.53 0.32 0.42 0.22 −0.5 0.51 0.07 −0.74 −0.17 −0.39 −0.23 0.07 0.62N 1-3 −0.31 0.06 0.18 0.46 0.04 0.11 0.25 −0.12 0.1 −0.3 −0.04 0.4 0.36 −0.54 0.71 0.71 −0.68 −0.23 −0.35 0.36N 1-4 −0.36 −0.33 0.37 0.35 0.21 −0.2 0.05 0.41 −0.05 0.22 −0.29 0.59 0.16 0.65 −0.48 −0.26 −0.35 0.03 −0.47 0.22N 1-5 0.2 0.47 0.19 −0.39 −0.75 −0.03 −0.35 0.36 0.19 −0.04 −0.54 0.08 0.6 −0.28 −0.03 −0.31 −0.22 −0.61 0.65 0.39N 1-6 0.09 0.29 0.14 0.3 0.75 0.5 0.09 0.14 −0.31 0.7 −0.52 0.09 −0.14 0.1 0.02 −0.18 −0.48 0.74 0.39 −0.71N 1-7 −0.46 0.08 −0.58 −0.06 −0.22 0.37 0.5 −0.58 −0.46 −0.45 −0.5 −0.31 −0.4 −0.3 −0.43 0.17 0.31 0.16 −0.03 −1.06N 1-8 0.47 0.24 0.17 −0.52 −0.24 −0.47 0.03 −0.58 0.36 0.05 −0.36 0.21 0.09 0.17 −0.08 −0.56 −0.05 −0.52 −0.58 1.52
Layer 1
N1-1 N1-2 N1-3 N1-4 N1-5 N1-6 N 1-7 N 1-8 BIAS
Layer2
N 2-1 −0.370 −0.877 0.97058 0.027 −0.545 −0.414 −0.926 0.323 1.83N 2-2 −0.067 −0.644 0.24806 1.29 −0.204 −0.351 1.005 −0.179 1.259N 2-3 −1.051 0.277 −0.88341 0.34 −0.868 0.407 0.207 0.841 0.726N 2-4 0.087 −0.189 0.97207 0.412 −0.092 −1.137 −1.143 −0.584 −0.156N 2-5 −0.495 −0.733 −0.33314 0.217 0.638 −0.969 0.107 1.086 −0.321N 2-6 −0.0495 1.325 −0.78808 −0.183 0.28 −1.067 0.41 −0.578 −0.903N 2-7 0.125 0.568 0.83299 0.733 −0.215 −0.720 −0.742 0.796 1.31N 2-8 −0.799 0.08 −0.70271 −0.223 0.711 0.759 0.909 −0.488 −1.823
Layer 2
N 2-1 N 2-2 N 2-3 N 2-4 N 2-5 N 2-6 N 2-7 N 2-8 BIAS
Layer3
N 3-1 1.168 −0.6722 1.1144 −0.4385 −0.5610 −0.7026 0.2466 −0.5264 −1.4806N 3-2 −0.0168 −0.8588 −0.2154 −0.2713 0.7424 0.676 −0.9124 0.613 −1.0882N 3-3 −0.0259 0.7562 0.121 −0.5339 0.3314 1.0392 0.4327 −0.8359 −0.5162N 3-4 1.0796 −0.0166 −0.9398 −0.6319 0.532 −0.6619 −0.1677 0.5409 0.3183N 3-5 0.7894 0.148 −0.2405 0.6315 1.2459 −0.3098 −0.3563 0.7113 1.2089N 3-6 −0.4737 0.0196 −0.9185 0.7985 0.177 0.9209 −0.4222 −0.5776 −1.7361
Layer 3
N 3-1 N 3-2 N 3-3 N 3-4 N 3-5 N 3-6 BIAS
output 0.6294 −0.19791 0.49824 −1.0218 0.73563 0.50878 −0.49803

Sustainability 2021, 13, 7506 18 of 22
Figure 11. Diagram of RSM-modified neural network learning in three steps of training, validation,and testing.
Figure 12. Regression diagram of the training data submitted to the RSM-modified neural networkalong with their fitting line equation.

Sustainability 2021, 13, 7506 19 of 22
Figure 13. Comparing the actual measures and predicted values of the RSM-modified neural network.
4.4. Determining Most Suitable Network for Predicting Flexural Strength
Two types of models were developed in this study. At first, a normal neural networkmodeling was carried out according to the four determined independent variables. Then,to increase the model accuracy and consider parameters whose effects were not seen inthe normal neural network, the RSM was used, leading to an increase in the number ofindependent variables from 4 to 19. Therefore, the accuracy of the model was accordinglyenhanced, producing less error between the actual experimentally measured data andthe model predicted values. Nonetheless, only four parameters were considered in thenormal neural network, while other parameters were disregarded. This increased the errormargin of the normal neural network when compared to the RSM-modified neural network.Generally, the ANN hybrid model coupled with RSM attained superior accuracy, whichshould allow the user to avert the laborious, time-consuming, and costly trial batches andthe associated destructive tests that produce further material wastage. The experimentalresults in this study coupled with the trained ANN-RSM model allow for the designing ofsustainable concrete mixtures incorporating proportions of waste coal while maintainingsuperior mechanical strength. Such coupling of sustainability-based mixture design andcomputational intelligence modeling based on data analytics opens the door for new venuesin future research for reducing the environmental footprint of construction. Eventually,construction can become eco-efficient and generative by design, allowing to beneficiatelarge volumes of industrial and mining byproducts and alleviate the landfilling of colossalvolumes of such byproducts.
5. Conclusions
In this study, an extensive experimental study was carried out to explore the effects ofadding waste coal to concrete. An experimental database was developed to capture theeffects of the mixture design parameters and waste coal addition on the flexural strengthof concrete. The database was used to train a hybrid arterial neural network coupledwith response surface methodology to predict the flexural strength of concrete mixtureincorporating coal waste. Based on the experimental and computational intelligencemodeling work conducted, the following conclusions can be drawn:

Sustainability 2021, 13, 7506 20 of 22
• Experimental results demonstrate that coal waste powder can be used as an additivein concrete to mitigate the problem of landfilling this waste. Adequate control ofthe mixture design and dosage of coal waste allows beneficiating this byproduct inconcrete while enhancing the flexural strength. Thus, using waste coal powder as apartial replacement for cement allows for reducing the cost of concrete production andcarbon dioxide emission from cement production, while mitigating the environmentaleffects associated with waste coal disposal. A dosage of 3% coal waste was found tobe optimal in enhancing the mechanical properties of waste coal-modified concrete.
• The response surface methodology (RSM) has proven to be an effective tool formixture design optimization, allowing not only to quantify the effect of the coalwaste parameter, but also the interactions of this parameter with other mixture designparameters. The RSM-modified artificial neural network (ANN) achieved less errorcompared to the traditional ANN, improving model accuracy and enhancing thereliability of predictions. Improving the accuracy of the model led to less outputerror of the neural network. The RMSE for the normal neural network and the RSM-modified neural networks was equal to 1.014 and 0.875, respectively.
• Errors typically arise when some effective parameters are disregarded in the modelingprocedure. Accordingly, the RSM helped significantly in identifying the effectivevariables whose effects are not visible in the modeling. This approach, which increasesthe number of independent variables, increased the modeling accuracy and decreasedthe error between the actual data and the corresponding model-predicted ones.
• It is recommended that the effects of waste coal powder addition on the rheologicaland durability properties of concrete be explored in future work. One of the attractivefeatures is to study the effects of ultrafine ground coal waste and explore whetherit can play a more effective microfiller effect and better enhance the properties ofconcrete than the coarser powder investigated in this study.
Author Contributions: Conceptualization, F.D.; methodology, F.D. and F.Q.; software, F.D. and M.K.;validation, F.D.; formal analysis, F.D. and F.Q.; investigation, F.D., H.S. and F.Q.; resources, F.D. andF.Q.; data curation, F.D. and M.K.; writing—original draft preparation, F.D.; writing—review andediting, M.L.N., M.R. and H.R.; visualization, M.L.N., M.R., H.R. and F.D.; supervision, M.L.N.;project administration, F.Q.; funding acquisition, M.L.N. All authors have read and agreed to thepublished version of the manuscript.
Funding: This research received no external funding.
Institutional Review Board Statement: Not applicable.
Informed Consent Statement: Not applicable.
Data Availability Statement: All data is included in the manuscript.
Conflicts of Interest: The authors declare that they have no conflict of interests relevant to the workreported in this paper. The research was not funded by any specific project grant or the financialsupport of any entity.
References1. Karimaei, M.; Dabbaghi, F.; Dehestani, M.; Rashidi, M. Estimating Compressive Strength of Concrete Containing Untreated Coal
Waste Aggregates Using Ultrasonic Pulse Velocity. Materials 2021, 14, 647. [CrossRef]2. Rashidi, M.; Joshaghani, A.; Ghodrat, M. Towards Eco-Flowable Concrete Production. Sustainability 2020, 12, 1208. [CrossRef]3. Karimaei, M.; Dabbaghi, F.; Sadeghi-Nik, A.; Dehestani, M. Mechanical performance of green concrete produced with untreated
coal waste aggregates. Constr. Build. Mater. 2020, 233, 117264. [CrossRef]4. Khotbehsara, M.M.; Manalo, A.; Aravinthan, T.; Ferdous, W.; Benmokrane, B.; Nguyen, K.T. Synergistic effects of hygrothermal
conditions and solar ultraviolet radiation on the properties of structural particulate-filled epoxy polymer coatings. Constr. Build.Mater. 2021, 277, 122336. [CrossRef]
5. Abousnina, R.; Manalo, A.; Ferdous, W.; Lokuge, W.; Benabed, B.; Al-Jabri, K.S. Characteristics, strength development andmicrostructure of cement mortar containing oil-contaminated sand. Constr. Build. Mater. 2020, 252, 119155. [CrossRef]
6. Hooton, R.; Nehdi, M.; Khan, A. Cementitious Composites Containing Recycled Tire Rubber: An Overview of EngineeringProperties and Potential Applications. Cem. Concr. Aggregates 2001, 23, 3. [CrossRef]

Sustainability 2021, 13, 7506 21 of 22
7. Alfayez, S.; Suleiman, A.; Nehdi, M. Recycling Tire Rubber in Asphalt Pavements: State of the Art. Sustainability 2020, 12, 9076.[CrossRef]
8. Aiello, M.; Leuzzi, F. Waste tyre rubberized concrete: Properties at fresh and hardened state. Waste Manag. 2010, 30, 1696–1704.[CrossRef]
9. Ferdous, W.; Manalo, A.; AlAjarmeh, O.; Mohammed, A.A.; Salih, C.; Yu, P.; Khotbehsara, M.M.; Schubel, P. Static behaviour ofglass fibre reinforced novel composite sleepers for mainline railway track. Eng. Struct. 2021, 229, 111627. [CrossRef]
10. Rahmani, E.; Dehestani, M.; Beygi, M.H.A.; Allahyari, H.; Nikbin, I.M. On the mechanical properties of concrete containing wastePET particles. Constr. Build. Mater. 2013, 47, 1302–1308. [CrossRef]
11. Tariq, A.; Nehdi, M. Developing durable paste backfill from sulphidic tailings. Proc. Inst. Civ. Eng. Waste Resour. Manag. 2007,160, 155–166. [CrossRef]
12. Kazmi, S.M.S.; Abbas, S.; Nehdi, M.L.; Saleem, M.A.; Munir, M.J. Feasibility of Using Waste Glass Sludge in Production ofEcofriendly Clay Bricks. J. Mater. Civ. Eng. 2017, 29, 04017056. [CrossRef]
13. Abbas, S.; Arshad, U.; Abbass, W.; Nehdi, M.; Ahmed, A. Recycling Untreated Coal Bottom Ash with Added Value for MitigatingAlkali–Silica Reaction in Concrete: A Sustainable Approach. Sustainability 2020, 12, 10631. [CrossRef]
14. Mohammed, A.; Nehdi, M.; Adawi, A. Recycling waste latex paint in concrete with added value. ACI Mater. J. 2008, 105, 367–374.15. Abbas, S.; Ahmed, A.; Nehdi, M.L.; Saeed, D.; Abbass, W.; Amin, F. Eco-Friendly Mitigation of Alkali-Silica Reaction in Concrete
Using Waste-Marble Powder. J. Mater. Civ. Eng. 2020, 32, 04020270. [CrossRef]16. Andreão, P.V.; Suleiman, A.R.; Cordeiro, G.C.; Nehdi, M.L. Beneficiation of Sugarcane Bagasse Ash: Pozzolanic Activity and
Leaching Behavior. Waste Biomass Valorization 2019, 11, 1–10. [CrossRef]17. Nehdi, M.L.; Yassine, A. Mitigating Portland Cement CO2 Emissions Using Alkali-Activated Materials: System Dynamics Model.
Materials 2020, 13, 4685. [CrossRef]18. Dabbaghi, F.; Nasrollahpour, S.; Dehestani, M.; Yousefpour, H. Optimization of Concrete Mixtures Containing Lightweight
Expanded Clay Aggregates Based on Mechanical, Economical, Fire-Resistance, and Environmental Considerations. ASCE J. Mater.Civ. Eng. 2021. [CrossRef]
19. Dabbaghi, F.; Dehestani, M.; Yousefpour, H.; Rasekh, H.; Navaratnam, S. Residual compressive stress–strain relationship oflightweight aggregate concrete after exposure to elevated temperatures. Constr. Build. Mater. 2021, 298, 123890. [CrossRef]
20. Zain, M.; Abd, S.M.; Hamid, R.; Jamil, M. Potential for Utilising Concrete Mix Properties to Predict Strength at Different Ages. J.Appl. Sci. 2010, 10, 2831–2838. [CrossRef]
21. DeRousseau, M.; Kasprzyk, J.; Srubar, W. Computational design optimization of concrete mixtures: A review. Cem. Concr. Res.2018, 109, 42–53. [CrossRef]
22. Tsivilis, S.; Parissakis, G. A mathematical model for the prediction of cement strength. Cem. Concr. Res. 1995, 25, 9–14. [CrossRef]23. Nunez, I.; Marani, A.; Nehdi, M.L. Mixture Optimization of Recycled Aggregate Concrete Using Hybrid Machine Learning
Model. Materials 2020, 13, 4331. [CrossRef]24. Nunez, I.; Nehdi, M.L. Machine learning prediction of carbonation depth in recycled aggregate concrete incorporating SCMs.
Constr. Build. Mater. 2021, 287, 123027. [CrossRef]25. Keshtegar, B.; Nehdi, M.L.; Kolahchi, R.; Trung, N.-T.; Bagheri, M. Novel hybrid machine leaning model for predicting shear
strength of reinforced concrete shear walls. Eng. Comput. 2021, 12, 1–12. [CrossRef]26. Marani, A.; Nehdi, M.L. Machine learning prediction of compressive strength for phase change materials integrated cementitious
composites. Constr. Build. Mater. 2020, 265, 120286. [CrossRef]27. Ben Chaabene, W.; Nehdi, M.L. Novel soft computing hybrid model for predicting shear strength and failure mode of SFRC
beams with superior accuracy. Compos. Part C Open Access 2020, 3, 100070. [CrossRef]28. Marani, A.; Jamali, A.; Nehdi, M.L. Predicting Ultra-High-Performance Concrete Compressive Strength Using Tabular Generative
Adversarial Networks. Materials 2020, 13, 4757. [CrossRef]29. Almustafa, M.; Nehdi, M. Machine learning model for predicting structural response of RC slabs exposed to blast loading. Eng.
Struct. 2020, 221, 111109. [CrossRef]30. Flah, M.; Nunez, I.; Ben Chaabene, W.; Nehdi, M.L. Machine Learning Algorithms in Civil Structural Health Monitoring: A
Systematic Review. Arch. Comput. Methods Eng. 2021, 28, 2621–2643. [CrossRef]31. Ben Chaabene, W.; Flah, M.; Nehdi, M.L. Machine learning prediction of mechanical properties of concrete: Critical review. Constr.
Build. Mater. 2020, 260, 119889. [CrossRef]32. ASTM C33/C33M-18, Standard Specification for Concrete Aggregates, Developed by Subcommittee: C09.20; ASTM International: West
Conshohocken, PA, USA, 2018; Available online: www.astm.org (accessed on 15 April 2018).33. ASTM C192/C192M-19, Standard Practice for Making and Curing Concrete Test Specimens in the Laboratory; ASTM International: West
Conshohocken, PA, USA, 2018; Available online: www.astm.org (accessed on 10 August 2000).34. ASTM C293/C293M-16, Standard Test Method for Flexural Strength of Concrete (Using Simple Beam with Center-Point Loading); ASTM
International: West Conshohocken, PA, USA, 2018; Available online: www.astm.org (accessed on 15 April 2016).35. El-Chabib, H.; Nehdi, M. Neural network modelling of properties of cement-based materials demystified. Adv. Cem. Res. 2005,
17, 91–102. [CrossRef]36. Mukherjee, A.; Biswas, S.N. Artificial neural networks in prediction of mechanical behavior of concrete at high temperature. Nucl.
Eng. Des. 1997, 178, 1–11. [CrossRef]

Sustainability 2021, 13, 7506 22 of 22
37. Moghadam, M.T.; Qaderi, F. Modeling of petroleum wastewater treatment by Fe/Zn nanoparticles using the response surfacemethodology and enhancing the efficiency by scavenger. Results Phys. 2019, 15, 102566. [CrossRef]
38. Qaderi, F.; Sayahzadeh, A.H.; Azizpour, F.; Vosughi, P. Efficiency modeling of serial stabilization ponds in treatment of phenolicwastewater by response surface methodology. Int. J. Environ. Sci. Technol. 2019, 16, 4193–4202. [CrossRef]
39. Shi, L.; Wei, D.; Ngo, H.H.; Guo, W.; Du, B.; Wei, Q. Application of anaerobic granular sludge for competitive biosorption ofmethylene blue and Pb(II): Fluorescence and response surface methodology. Bioresour. Technol. 2015, 194, 297–304. [CrossRef]
40. Yang, S.-S.; Guo, W.-Q.; Zhou, X.-J.; Meng, Z.-H.; Liu, B.; Ren, N.-Q. Optimization of operating parameters for sludge processreduction under alternating aerobic/oxygen-limited conditions by response surface methodology. Bioresour. Technol. 2011,102, 9843–9851. [CrossRef]
41. Design Expert Software; Version 13; Stat-Ease, Inc.: Minneapolis, MN, USA, 2016.42. Ergün, A. Effects of the usage of diatomite and waste marble powder as partial replacement of cement on the mechanical
properties of concrete. Constr. Build. Mater. 2011, 25, 806–812. [CrossRef]43. Ganjian, E.; Khorami, M.; Maghsoudi, A.A. Scrap-tyre-rubber replacement for aggregate and filler in concrete. Constr. Build.
Mater. 2009, 23, 1828–1836. [CrossRef]