experimental and life-cycle investigation of …
TRANSCRIPT

EXPERIMENTAL AND LIFE-CYCLE INVESTIGATION OF NONSTEROIDAL ANTI-INFLAMMATORY DRUG REMOVAL IN SOURCE SEPARATED URINE
By
KELLY ANN LANDRY
A DISSERTATION PRESENTED TO THE GRADUATE SCHOOL OF THE UNIVERSITY OF FLORIDA IN PARTIAL FULFILLMENT
OF THE REQUIREMENTS FOR THE DEGREE OF DOCTOR OF PHILOSOPHY
UNIVERSITY OF FLORIDA
2017

© 2017 Kelly Ann Landry

To my husband, for everything

4
ACKNOWLEDGMENTS
I would like to thank Dr. Treavor Boyer for his mentorship, encouragement, and
support throughout my undergraduate and graduate career, and inspiring excellent
dinner conversation related to all things urine. I also thank my committee members: Dr.
Paul Chadik for his inspiring lectures throughout my undergraduate studies which have
contributed to my passion in environmental engineering, and for his continued support
throughout my graduate studies, Dr. Robert Ries for providing valuable insight and
expertise on Life Cycle Assessment, Dr. Nancy Denslow for supporting my endeavors
into ecotoxicology and providing laboratory access to conduct my experiments, and Dr.
Guenther Hochhaus for generously providing access to his laboratory space and
analytical instruments.
I also extend my gratitude to several groups and individuals for their help: Dr.
Ching-Hua Huang and Dr. Peizhe Sun at the Georgia Institute of Technology, the UF
Physical Plant Department and UF Water Reclamation Facility, Kevin Kroll, and Dr.
Hochhaus’ Research Group. This material is based upon work supported by the
National Science Foundation Graduate Fellowship under Grant No. DGE-1315138, the
National Science Foundation CAREER grant under Grant No. CBET-1150790, and the
UF Graduate School Fellowship.
My graduate career would not have been as successful if it weren’t for the
encouragement and support of my colleagues, friends, and family. I thank all of the
wonderful Boyer Research Group members for providing endless entertainment,
commiseration, and lifelong friendship. I would not have maintained my sanity in my
pursuit of a PhD if it weren’t for my closest friends who provided laughter over many
shared bottles of wine and cheese. I also am grateful for my mom, dad, Nanna, and
5
Rob for their endless love and encouragement. I thank Chewie for his unyielding
support and snuggles. I am most thankful for my husband, Tyler, for providing
emotional, intellectual, and nutritional support throughout my graduate studies. I look
forward to this next chapter in life with you by my side. I am forever grateful for your
unconditional love, and I love you.

6
TABLE OF CONTENTS
page
ACKNOWLEDGMENTS .................................................................................................. 4
LIST OF TABLES ............................................................................................................ 9
LIST OF FIGURES ........................................................................................................ 12
LIST OF OBJECTS ....................................................................................................... 15
LIST OF ABBREVIATIONS ........................................................................................... 16
ABSTRACT ................................................................................................................... 18
CHAPTER
1 INTRODUCTION .................................................................................................... 20
Pharmaceuticals and Nutrients in the Environment ................................................ 20 Urine Source Separation ......................................................................................... 23 Nonsteroidal Anti-Inflammatory Drugs .................................................................... 25
Organization of Dissertation .................................................................................... 26
2 ION-EXCHANGE SELECTIVITY OF DICLOFENAC, IBUPROFEN, KETOPROFEN, AND NAPROXEN IN UREOLYZED HUMAN URINE ................... 29
Application of Sorption Processes for Pharmaceutical Removal ............................ 29
Experimental Methods ............................................................................................ 32 Synthetic Human Urine .................................................................................... 32 Pharmaceuticals in Urine .................................................................................. 33
Anion Exchange Resin ..................................................................................... 33 Batch Equilibrium Tests .................................................................................... 34
Column Tests ................................................................................................... 34 Analytical Methods ........................................................................................... 35 Data Analysis ................................................................................................... 36
Isotherm Models ............................................................................................... 36 Results and Discussion........................................................................................... 37
Ion-Exchange of Individual Pharmaceuticals at Realistic Concentrations ........ 37
Effect of Pharmaceutical Properties ................................................................. 41
Effect of Urine Composition .............................................................................. 46 Effect of Multiple Pharmaceuticals ................................................................... 47 Column Studies ................................................................................................ 49 Practical Application and Future Work ............................................................. 52
Concluding Remarks............................................................................................... 53
7
3 FIXED BED MODELING OF NONSTEROIDAL ANTI-INFLAMMATORY DRUG REMOVAL BY ION-EXCHANGE IN SOURCE SEPARATED URINE: MASS REMOVAL OR TOXICITY REDUCTION? .............................................................. 60
Application of Bioassays and Modeling to Assess Pharmaceutical Ecotoxicity ...... 60 Materials and Methods............................................................................................ 64
Pharmaceutical and Pharmaceutical Metabolites ............................................. 64 Synthetic and Real Urine .................................................................................. 64 Anion Exchange Resin ..................................................................................... 65
Pharmaceutical Concentrations in Urine .......................................................... 65 Toxicity Bioassays ............................................................................................ 65 Batch Kinetic and Equilibrium Tests ................................................................. 66 Fixed-Bed Column Modeling ............................................................................ 67
Sample Preparation .......................................................................................... 67 Analytical Methods ........................................................................................... 67
Data Analysis ................................................................................................... 68 Results and Discussion........................................................................................... 68
COX-1 Inhibition for Individual Compounds ...................................................... 68 COX-1 Inhibition Mixture Effects ...................................................................... 71 Comparison of Urine Matrices .......................................................................... 75
Concluding Remarks............................................................................................... 79
4 LIFE CYCLE ASSESSMENT AND COSTING OF URINE SOURCE SEPARATION: FOCUS ON NONSTEROIDAL ANTI-INFLAMMATORY DRUG REMOVAL .............................................................................................................. 87
Application of Life Cycle Assessment for Pharmaceutical Treatment ..................... 87 Life Cycle Model ..................................................................................................... 89
Scope of the Study ........................................................................................... 89
Life Cycle Inventory .......................................................................................... 92 Life Cycle Costing ............................................................................................ 93
Life Cycle Impact Assessment ......................................................................... 93 Sensitivity and Uncertainty Analysis ................................................................. 94
Results and discussion ........................................................................................... 95
Overall Comparison of Scenarios ..................................................................... 95 Urine Source Separation .................................................................................. 98 Pharmaceutical Toxicity.................................................................................. 101 Model Sensitivity ............................................................................................ 104
Concluding Remarks............................................................................................. 107
5 CONCLUSIONS ................................................................................................... 113
APPENDIX
A SUPPLEMENTARY INFORMATION FOR CHAPTER 2 ....................................... 118
B SUPPLEMENTARY INFORMATION FOR CHAPTER 3 ....................................... 140

8
C SUPPLEMENTARY INFORMATION FOR CHAPTER 4 ....................................... 170
LIST OF REFERENCES ............................................................................................. 218
BIOGRAPHICAL SKETCH .......................................................................................... 238

9
LIST OF TABLES
Table page 2-1 Composition of synthetic fresh and ureolyzed urine used in ion-exchange
experiments. ....................................................................................................... 55
2-2 Continuous-flow column ion-exchange of DCF, IBP, KTP, and NPX onto Dowex 22 AER followed by in-column regeneration over three treatment–regeneration cycles. ........................................................................................... 56
3-1 Estimated active ingredient (AI) and metabolite concentrations in urine and fraction excreted in urine. ................................................................................... 81
4-1 Capital and operation and management (O&M) costs, net present value (NPV) for each urine treatment scenario .......................................................... 109
A-1 Properties of pharmaceuticals used in ion-exchange experiments. .................. 121
A-2 Estimated and measured pharmaceutical concentrations in urine based on previous literature. ............................................................................................ 122
A-3 Properties of strong-base, anion exchange polymer resins. ............................. 123
A-4 Linear form of isotherm models and plots to determine estimated initial values for non-linear isotherm modeling parameters. ....................................... 124
A-5 Individual equilibrium experiment isotherm parameters for Dowex 22 AER sorption ............................................................................................................. 125
A-6 Isotherm parameters, sum of squares errors (SSE), correlation coefficients (R2), and average relative errors (ARE) of the Freundlich, Langmuir, Dubinin-Astakhov, and Dubinin-Radushkevich models determined by nonlinear regression for the different ion-exchange resins used to remove diclofenac (Co = 0.2 mmol/L) in ureolyzed urine. .............................................. 126
A-7 Estimated physicochemical parameters of the four major diclofenac metabolites. ...................................................................................................... 127
A-8 Equilibrium experiment isotherm parameters for Dowex 22 AER sorption of ibuprofen (C0 = 0.2 mmol/L) present in fresh urine ........................................... 128
A-9 Combined equilibrium experiment isotherm parameters for Dowex 22 AER sorption. ............................................................................................................ 129
A-10 Analysis of covariance (ANOCOVA) test results to determine whether there was a significant difference at the 95% confidence interval (α = 0.05)

10
between DCF, IBP, KTP, and NPX ion-exchange when present individually or combined in synthetic ureolyzed urine ......................................................... 130
B-1 Active ingredient and metabolite structure and chemical properties. ................ 145
B-2 Synthetic ureolyzed urine composition adapted from Landry et al. (2015). ...... 146
B-3 Estimated and measured pharmaceutical concentrations in urine from literature. .......................................................................................................... 147
B-4 Pharmaceutical dose-response concentrations used to evaluate COX-1 inhibition of single compounds.......................................................................... 148
B-5 Pharmaceutical dose-response concentrations used to evaluate COX-1 inhibition of the pharmaceutical mixture. .......................................................... 149
B-6 Nomenclature used to calculate liquid-phase mass transfer coefficient, liquid-phase diffusion coefficient, and surface diffusion coefficient. ........................... 150
B-7 Urine properties assumed to be equivalent to water at 25°C. ........................... 151
B-8 Molar volume (Vb), liquid diffusivity (DL), and liquid-phase mass transfer coefficients (kL). ................................................................................................ 152
B-9 Surface diffusion coefficient (Ds). ...................................................................... 153
B-10 Column operational parameters. ...................................................................... 154
B-11 Resin properties. .............................................................................................. 155
B-12 Freundlich isotherm parameters. ...................................................................... 156
B-13 Hill model parameters from the COX-1 inhibition bioassays ............................. 157
B-14 Alternative Hill model parameters from the COX-1 inhibition bioassays ........... 158
B-15 In vivo chronic toxicity data for organisms exposed to diclofenac, ibuprofen, naproxen, and ketoprofen. ................................................................................ 159
C-1 Average urination volumes and frequency for asymptomatic men and women. ............................................................................................................. 190
C-2 Total number of weekdays during the fall, spring, and summer semesters, excluding major holidays .................................................................................. 191
C-3 Estimated urine production for entire UF campus over different time periods. . 192
C-4 Daily refuse route distance (km) traveled during fall, spring, and summer semesters. ........................................................................................................ 193

11
C-5 Mass of diclofenac, ibuprofen, ketoprofen, and naproxen sorbed onto AER (mg) and desorbed from AER using a 5% NaCl, 50% methanol regeneration solution. ............................................................................................................ 194
C-6 Inventory data for ion-exchange vessel components. ....................................... 195
C-7 Inventory data for incineration of a regeneration brine at a cement kiln plant. .. 196
C-8 Recommended defined daily dose (DDD), fraction of dose excreted in urine as the parent compound (Fex), and estimated pharmaceutical concentrations in urine. ............................................................................................................. 197
C-9 Unit cost of inventory items. ............................................................................. 198
C-10 USEtox characterization factors (human toxicity in cases/kg and ecotoxicity in PAF·m3·day/kg) for diclofenac, ibuprofen, ketoprofen, and naproxen. ......... 199
C-11 Baseline, minimum, and maximum values used for various input parameter assumptions ..................................................................................................... 200
C-12 Baseline, minimum, and maximum values used for various cost assumptions 201

12
LIST OF FIGURES
Figure page 1-1 Visual representation of the urban life-cycle of pharmaceuticals and nutrients .. 28
2-1 Experimental equilibrium data and isotherm models determined by nonlinear regression ........................................................................................................... 57
2-2 Comparison of pharmaceutical removal when present individually or combined in ureolyzed urine ............................................................................... 58
2-3 Column saturation curves of Dowex 22 AER by pharmaceutical mixture ........... 59
3-1 Predicted column breakthrough curves as a function of mass removal and COX-1 inhibition ................................................................................................. 82
3-2 Cyclooxygenase subtype-1 inhibition curve for a pharmaceutical mixture containing diclofenac, ketoprofen, ketoprofen glucuronide, naproxen, and o-desmethylnaproxen. ........................................................................................... 83
3-3 Predicted column breakthrough curves as a function of mass removal and COX-1 inhibition for a pharmaceutical mixture ................................................... 84
3-4 Ion-exchange removal in real urine and synthetic urine with and without metabolites ......................................................................................................... 85
3-5 Mass of endogenous metabolites (TOC) removed (mg C) during equilibrium experiments for synthetic urine with metabolites and real urine ......................... 86
4-1 Treatment schematic for scenarios A–H (light gray horizontal arrows) and contributing processes ...................................................................................... 110
4-2 Normalized TRACI impact score for all scenarios ............................................ 111
4-3 Comparison of ecotoxicity impact (CTUe = PAF·m3·day) ................................. 112
5-1 Visual representation of the systematic approach for evaluating sorption materials to remove pharmaceuticals in source separated urine ...................... 117
A-1 Individual experimental data and sorption isotherms determined by nonlinear regression of paracetamol (PCM) using Dowex 22 anion exchange resin. ...... 131
A-2 Experimental data and isotherm models for naproxen and ketoprofen ............. 132
A-3 Experimental data and ion-exchange isotherms of diclofenac removal by various resins ................................................................................................... 133
13
A-4 Mole fraction distribution of the neutral and ionized species present in the octanol and water phase .................................................................................. 134
A-5 Combined pharmaceutical experimental data and sorption isotherms determined by nonlinear regression ................................................................. 135
A-6 Sorption by Dowex 22 anion exchange resin over three treatment cycles using fresh resin (Cycle 1) and regenerated resin (Cycles 2 and 3) in a continuous-flow mini-column ............................................................................ 136
A-7 Simultaneous column regeneration curves ....................................................... 137
B-1 Fixed bed ion-exchange removal of diclofenac by Dowex Marathon 11 fit to the homogenous surface diffusion model (HSDM). .......................................... 160
B-2 Fixed bed ion-exchange removal of diclofenac, ketoprofen, and naproxen in synthetic ureolyzed urine using Dowex 22 fit to the homogenous surface diffusion model (HSDM) ................................................................................... 161
B-3 Cyclooxygenase subtype-1 inhbition curves for diclofenac, ketoprofen, naproxen, and O-desmethylnaproxen .............................................................. 162
B-4 Alternative cyclooxygenase subtype-1 inhbition curves for naproxen, and O-desmethylnaproxen .......................................................................................... 163
B-5 Alternative predicted COX-1 inhibition as a function of bed volumes treated by fixed bed ion-exchange of naproxen, and O-desmethylnaproxen ................ 164
B-6 Cyclooxygenase subtype-1 inhbition curves for ibuprofen, OH-ibuprofen, 4’OH-diclofenac, and ketoprofen glucuronide ................................................... 165
B-7 ToxCast database in vitro bioassays for various endpoints plotted as a function of the concentration that induces 50% activity (AC50) ......................... 166
B-8 Predicted column breakthrough curves as a function of mass removal and COX-1 inhibition for diclofenac ion-exchange in real urine ............................... 167
B-9 Isotherm data for ion-exchange removal of diclofenac, ibuprofen, ketoprofen, naproxen, and O-desmethylnaproxen in synthetic urine with and without metabolites and real human urine (DCF only). ................................................. 168
B-10 Kinetic data for ion-exchange removal of diclofenac, ibuprofen, ketoprofen, and naproxen and O-desmethylnaproxen in synthetic urine with and without metabolites and real human urine (DCF only) .................................................. 169
C-1 Bench scale column results for removal of diclofenac, ibuprofen, ketoprofen, and naproxen by anion-exchange resin. ........................................................... 202
14
C-2 Manufacturer data and resulting linear regressions of fiberglass water softener tank ..................................................................................................... 203
C-3 Manufacturer data and resulting linear regressions of centrifugal pump power specifications .................................................................................................... 204
C-4 Relative frequency diagram of ibuprofen concentrations in urine for a community where 1–100% of the population is consuming ibuprofen (Fc) for 1–100% of the collection time (Fd). ................................................................... 205
C-5 Normalized TRACI impact score for centralized wastewater treatment and urine source separation. ................................................................................... 206
C-6 Comparison of ozone depletion impacts (kg CFC-11 eq.) ................................ 207
C-7 Comparison of global warming impacts (kg CO2 eq.) ...................................... 208
C-8 Comparison of smog impacts (kg O3 eq.) ........................................................ 209
C-9 Comparison of acidification impacts (kg SO2 eq.) ............................................ 210
C-10 Comparison of eutrophication impacts (kg N eq.). ............................................ 211
C-11 Comparison of carcinogenic impacts (CTUh). .................................................. 212
C-12 Comparison of respiratory effects impacts (kg PM2.5 eq.) ............................... 213
C-13 Comparison of fossil fuel depletion impacts (MJ surplus) ................................. 214
C-14 Impact assessment results for methanol, sodium chloride, and potable water production used in the regeneration process (positive (+) percent contributions), compared to CO2 and NOx emission offsets, heavy fuel offsets, and hard coal offsets from incineration of the regeneration brine at a cement kiln plant (negative (–) percent contributions) ...................................... 215
C-15 Normalized TRACI impact score (PE) of vacuum truck collection compared to the vacuum sewer collection as a function of vacuum sewer pipe length or distance traveled by vacuum truck (km). .......................................................... 216
C-16 Comparison of non-carcinogenic human toxicity impact (CTUh = number of disease cases). ................................................................................................. 217

15
LIST OF OBJECTS
Object page 4-1 Environmental impact and economic costing sensitivity analysis results .......... 107
16
LIST OF ABBREVIATIONS
AER Anion exchange resin
ANOCOVA Analysis of covariance
BV Bed volume
COX Cyclooxygenase
D-A Dubinin-Astakhov
DCF Diclofenac
D-R Dubinin-Radushkevich
EBCT Empty bed contact time
HSDM Homogenous surface diffusion model
IBP Ibuprofen
IC50 Concentration corresponding to 50% COX-1 inhibition
IC10 Concentration corresponding to 10% COX-1 inhibition
KTP Ketoprofen
KTP-gluc Ketoprofen glucuronide
LCA Life cycle assessment
LDF Linear driving force
N Nitrogen
NPX Naproxen
NSAID Nonsteroidal anti-inflammatory drug
Odm-NPX O-desmethylnaproxen
OH-DCF 4’-OH-diclofenac
OH-IBP Hydroxy ibuprofen
P Phosphorus
PCM Paracetamol

17
TN Total nitrogen
TP Total phosphorus
TRACI Tool for the Reduction and Assessment of Chemical and Other Environmental Impacts
WWTP Wastewater treatment plant

18
Abstract of Dissertation Presented to the Graduate School of the University of Florida in Partial Fulfillment of the Requirements for the Degree of Doctor of Philosophy
EXPERIMENTAL AND LIFE-CYCLE INVESTIGATION OF NONSTEROIDAL ANTI-
INFLAMMATORY DRUG REMOVAL IN SOURCE SEPARATED URINE
By
Kelly Ann Landry
May 2017
Chair: Treavor H. Boyer Major: Environmental Engineering Sciences
Treatment of source separated urine is one proposed method to effectively and
efficiently remove pharmaceuticals excreted in urine, such as nonsteroidal anti-
inflammatory drugs (NSAIDs), to reduce environmental loading. Furthermore, high
nitrogen and phosphorus content makes urine a valuable fertilizer alternative, thus it is
imperative that potential contaminants are removed prior to reuse. Ion-exchange has
the potential to selectively remove NSAIDs with minimal co-removal of nutrients.
Realizing the benefits of an emerging treatment process depends on understanding the
mechanisms of removal, process sustainability, and the ability to protect human and
environmental health.
The work presented here focuses on a systematic approach to evaluate sorption
processes (i.e., ion-exchange and adsorption) to remove pharmaceuticals in source
separated urine. Specifically, the removal of NSAIDs using anion-exchange resin
(AER). Ion-exchange selectivity and mechanisms of removal were elucidated to better
understand NSAID removal. The reduction in ecotoxicity potential was evaluated by
applying in vitro bioassays to the predicted fixed-bed removal. Lastly, life cycle

19
environmental impacts and economic costs of implementing urine source separation
and pharmaceutical removal in a university community were evaluated.
Results suggest that the ion-exchange selectivity of NSAIDs is influenced by
concerted electrostatic and van der Waals interactions between the acidic
pharmaceuticals and the AER. Pharmaceutical hydrophobicity may vary under fresh
and ureolyzed urine conditions, thereby influencing ion-exchange selectivity. The
homogenous surface diffusion model predicted diclofenac, ketoprofen, naproxen, and
O-desmethylnaproxen fixed-bed breakthrough performance. Dose-response
cyclooxygenase inhibition of diclofenac, ketoprofen, ketoprofen glucuronide, naproxen,
and O-desmethylnaproxen followed the generalized concentration addition model for
mixture toxicity. Evaluation of cyclooxygenase inhibition as a function of bed volume
found that complete mass removal may not be necessary to achieve a reduction in
toxicity potential. Furthermore, endogenous metabolites in urine competed for ion-
exchange sites on the resin suggesting that a resin with higher selectivity and/or
capacity may improve pharmaceutical removal in urine. Major benefits of urine source
separation at the community-scale include flush water savings, reduced electricity use
for wastewater treatment (WWT), and reduced nutrient loading. Building-level urine
treatment or collection by vacuum truck for centralized treatment had negligible cost
difference compared with WWT.

20
CHAPTER 1 INTRODUCTION
Historically, nutrient and water management have been viewed as linear
processes with the “take, make, waste” approach growing increasingly unsustainable.
Perspectives on the urban water cycle are shifting as we recognize the limitations of
conventional drinking water and wastewater management to address water stress,
resource consumption, water scarcity, and water quality. Similarly, growing population
concerns regarding global food security, and the environmental consequences of poor
nutrient management are motivating communities to pursue alternative nutrient
management strategies. As the water industry moves towards more sustainable water
management, an issue that is frequently discussed is the presence of emerging
contaminants. Specifically, pharmaceuticals as they relate to environmental and human
health and source water protection. Furthermore, pharmaceuticals may act as a barrier
for some nutrient recovery efforts. The work presented in this dissertation pertains to the
evaluation of a novel treatment process to help address the global issue of
pharmaceutical and nutrient pollution, and enhance nutrient recovery efforts.
Pharmaceuticals and Nutrients in the Environment
Figure 1-1 provides a visual representation of pharmaceuticals (red arrows) and
nutrients (green arrows) in the urban water cycle and the challenges they present for
sustainable water management practices. After pharmaceuticals are ingested, they are
metabolized and excreted in urine and feces as either the parent compound or
metabolites (Lienert et al. 2007b). This waste is then combined with greywater and
conveyed to the centralized wastewater treatment plant. As demonstrated by process A
in Figure 1-1, conventional wastewater treatment processes are generally ineffective

21
and/or inconsistent at removing these constituents, and they are ultimately discharged
to the environment (Blair et al. 2015, Verlicchi et al. 2012). Subsequently, wastewater
effluent has been designated as one of the major point sources of pharmaceutical
pollution in the environment (Daughton and Ternes 1999, Neale et al. 2017, Subedi and
Loganathan 2016). Numerous studies have documented the adverse effects of
pharmaceuticals on aquatic life (Wilkinson et al. 2016). Furthermore, as a result of de
facto reuse (i.e., unplanned reuse) in drinking water systems, pharmaceuticals have
been detected in source water and finished water (Benotti et al. 2008, Furlong et al.
2017, Rice and Westerhoff 2015). Recognizing the risks from unregulated
contaminants, such as pharmaceuticals, the U.S. Environmental Protection Agency has
identified the need to strengthen source water protection (U.S. EPA 2016a). For water
scarce locations direct potable reuse (DPR) (i.e., the use of wastewater as a drinking
water source) has become a necessary option for diversifying water supply. As
demonstrated by process B in Figure 1-1, the presence of pharmaceuticals remains an
issue for DPR systems with respect to source control, and treatment often includes high
energy processes to remove and/or destroy these compounds such as reverse osmosis
and advanced oxidation (WRRF 2015).
In addition to the “take, make, waste” approach to water management, a similar
approach for nutrient management has led to stress on resource consumption,
wastewater treatment, and environmental water quality. Two of the primary nutrients
utilized in fertilizer is phosphorus and nitrogen. Nitrogen fertilizers are created through
fixation of atmospheric nitrogen using the Haber-Bosch process, however, this process
is limited by the cost and availability of fossil fuels (Maurer et al. 2003). Phosphate rock

22
mining, the primary source of phosphorus, is a non-renewable resource whose global
reserves are being depleted at a rapid rate with an expected lifetime of 61 years to 400
years (Cordell et al. 2009, Desmidt et al. 2015). Coupled with growing population rate
and the geo-political challenges associated with the global distribution of phosphate
reserves, sustainable fertilizer resources are necessary to ensure global food security
(Desmidt et al. 2015). Furthermore, nutrient loading in the environment induces
significant water quality issue due to eutrophication (U.S. EPA 2016b). This has led
regulatory agencies to establish more stringent treatment criteria, such as the Numeric
Nutrient Criteria, to reduce nutrient loading to surface water bodies (FDEP 2015b). As
shown in Figure 1-1, the green arrows demonstrate the fate of nutrients in wastewater.
Wastewater effluent has been identified as a major point source of nutrient discharge
and more stringent regulations have made the technical and economic feasibility of
municipal wastewater treatment plants to meet effluent standards difficult (Stone and
Reardon 2011). In the National Water Program Research Strategy, the EPA has
identified the importance of addressing nutrient pollution using a multi-barrier approach
including source reduction, best management practices, sustainable treatment
technologies, and resource recovery (U.S. EPA 2015). Due to the numerous issues
associated with fertilizer production and the high nutrient content in wastewater,
treatment efforts have shifted to recover nutrients from wastewater for reuse as
agricultural fertilizer which can reduce the costs associated with extensive wastewater
treatment and reduce dependence on commercial fertilizers. However, the presence of
pharmaceuticals in wastewater remains a barrier to nutrient recovery efforts. Advanced
treatment of wastewater (i.e., advanced oxidation) for reuse is often employed for

23
pharmaceutical destruction (Gomes et al. in press, Snyder et al. 2014). Furthermore,
adsorption of pharmaceuticals to activated sludge is a barrier to land application due to
potential desorption from sludge, plant uptake, and risk to animal and human exposure
(Taylor-Smith 2015).
Urine Source Separation
A common management strategy among pharmaceutical and nutrient pollution is
source water protection and source reduction. One potential process that addresses this
issue is urine source separation. Urine source separation is the process by which urine
is diverted at the source (i.e., toilet or urinal), instead of being combined with black
water and greywater (Larsen and Gujer 1996a). The motivation for urine source
separation is that urine contributes 1% of the volumetric flow to combined wastewater
but >80% of the nitrogen load and >50% of the phosphorus load (Larsen and Gujer
1996b). In addition, approximately 64% of ingested pharmaceuticals intended for human
use are excreted in urine as the parent compound or metabolites (Lienert et al. 2007a).
As demonstrated by process C in Figure 1-1, urine source separation intercepts the
major sources of nutrient and pharmaceutical loading in wastewater.
In addition to pharmaceuticals, urine is rich in nitrogen and phosphorus which
may be utilized as an alternative nutrient source in agriculture (Kirchmann and
Pettersson 1995). Treating undiluted urine as a separate waste stream reduces nutrient
loading at the wastewater treatment plant and subsequent receiving waters, reduces
energy requirements associated with advanced nutrient removal, and has significant
potable water savings (Ishii and Boyer 2015, Maurer et al. 2003). Nutrient recovery
efforts in urine span several options, ranging from direct land application of urine, and
advanced treatment of urine such as struvite precipitation, adsorption, and ammonia

24
stripping (Maurer et al. 2006). Removing and/or destroying pharmaceuticals in undiluted
urine as opposed to municipal wastewater is expected to be more efficient because
pharmaceuticals are present at much greater concentrations in urine (Lamichhane and
Babcock 2012). To enhance nutrient recovery efforts, either through direct application of
urine or advanced nutrient recovery options, preliminary treatment of urine to separate
pharmaceuticals from nutrients is necessary to ensure a contaminant free nutrient
product (Maurer et al. 2006).
Various advanced treatment processes to remove or destroy pharmaceuticals in
source separated urine have been investigated with varying degrees of success.
Nanofiltration, for example, was effective at rejecting >90% of pharmaceuticals (Pronk
et al. 2006b). However, it was not effective at separating pharmaceuticals from nutrients
as indicated by 100% and >50% rejection of phosphate and ammonia, respectively.
Furthermore, ozonation of ureolyzed urine required very high ozone doses to oxidize
pharmaceuticals due to ozone scavenging by ammonia and other reactive matrix
constituents in ureolyzed urine (Dodd et al. 2008), and electrodialysis detected high
permeation of ibuprofen in the concentrate (Pronk et al. 2006a). The major limitations of
nanofiltration, electrodialysis, and ozonation of source separated urine is that these
treatment methods do not effectively remove pharmaceuticals from urine and separate
them from nutrients to create a contaminant free nutrient product. Previous work by
Landry and Boyer (2013) investigated the removal of diclofenac, an acidic
pharmaceutical, from urine using anion exchange resins (AER). Greater than 90%
removal of diclofenac was achieved under both fresh and ureolyzed urine conditions
with <20% co-removal of phosphate, thereby effectively separating diclofenac and

25
ketoprofen from nutrients. Considering the results from previous work, sorption
processes appear to be an effective method to selectively remove pharmaceuticals from
urine with minimal co-sorption of valuable nutrients. Furthermore, sorption processes
are attractive for pharmaceutical removal because they are scalable and low energy
(Crittenden et al. 2012).
Although AER was shown to be effective at separating pharmaceuticals from
nutrients and urine, the specific pharmaceutical–urine and pharmaceutical–AER
interactions of structurally similar pharmaceuticals at realistic concentrations in urine is
unknown. In addition, evaluating the reduction in ecotoxicity after pharmaceutical
removal in source separated urine provides perspective for the ecotoxicological
implications of the treatment process. Furthermore, conducting a life cycle assessment
of pharmaceutical removal by sorption processes in source separated urine is
necessary to understand the cradle-to-grave environmental impacts of the overall
treatment process.
Nonsteroidal Anti-Inflammatory Drugs
The focus of this dissertation is on the removal of nonsteroidal anti-inflammatory
drugs (NSAIDs); specifically, diclofenac (DCF), ibuprofen (IBP), ketoprofen (KTP), and
naproxen (NPX). This pharmaceutical class is widely consumed globally in large
quantities; non-narcotic analgesics, which includes NSAIDs, was ranked 15 out of 20 for
global therapeutic drug sales with $12.3 billion sold in 2011 (IMS Health 2011).
Approximately 50–100% of an ingested NSAID dose is excreted in urine as the parent
compound or metabolites (Lienert et al. 2007b). Due to the high excretion rates in urine,
urine source separation has been proposed as an effective method to reduce NSAID
loading into the environment (Lienert et al. 2007a). Furthermore, the removal of these

26
compounds in conventional wastewater treatment range from <50% for DCF, 20–50–
80% for KTP and NPX, and >80% for IBP (Petrie et al. 2015). In a review of
pharmaceutical and personal care products in the freshwater environment, Ebele et al.
(2016) found that 17 surface water studies in 13 different countries detected at least one
nonsteroidal anti-inflammatory drug (NSAID) (i.e., diclofenac, (DCF), ibuprofen (IBP),
ketoprofen (KTP), and naproxen (NPX)) ranging from 10 ng/L to >10 µg/L. Furthermore,
in an ecotoxicological risk model, ibuprofen and diclofenac were identified as having the
greatest ecotoxicological risk among pharmaceuticals studied (Lienert et al. 2007b). The
mode of action of NSAIDs is inhibition of the COX enzyme. Cyclooxygenase enzymes
are classified into two subtypes, COX-1 and COX-2, which catalyze prostaglandin (PG)
biosynthesis (Blobaum and Marnett 2007). The COX-2 enzyme produces PGs under
acute inflammatory conditions, and is the target enzyme for the anti-inflammatory
effects of NSAIDs (Blobaum and Marnett 2007). The COX-1 enzyme is associated with
normal cellular homeostasis, and inhibition has been attributed to gastrointestinal
toxicity in humans, gastrulation arrest and defective vascular tube formation in zebrafish
(Cha et al. 2005, Warner et al. 1999). Furthermore, chronic exposure of Japanese
medaka exposure to DCF resulted in decreased hatching success and delay in hatching
(Lee et al. 2011). Prostaglandin E2 (PGE2) was shown to be involved in estrogen
biosynthesis in mice, however it is unknown whether a similar mechanism of COX
enzyme applies to aquatic vertebrates (Lee et al. 2011).
Organization of Dissertation
The goal of this doctoral research was three-fold: (1) to improve the
understanding of pharmaceutical removal by sorption processes in source separated
urine at realistic concentrations in urine, (2) to elucidate the efficacy of ion-exchange

27
resins to reduce the ecotoxicity potential of pharmaceuticals and pharmaceutical
metabolites, and (3) to evaluate the environmental and economic implications of
pharmaceutical removal by ion-exchange in source separated urine. Within individual
chapters, the focus is on one of the specified goals. The following chapter, Chapter 2,
pertains to evaluating the ion-exchange selectivity and competitive sorption of the
NSAIDs, DCF, IBP, KTP, and NPX. Chapter 2 is the topic of a manuscript published in
Water Research. Chapter 3 pertains to the comparison of predicted fixed-bed column
removal of NSAIDs and NSAID metabolites and the corresponding reduction in
ecotoxicity quantified by their ability to inhibit the cyclooxygenase enzyme. The target
journal for findings discussed in Chapter 3 is Environmental Science & Technology and
submission will take place in 2017. The environmental and economic life cycle impacts
of implementing urine source separation with ion-exchange removal at the University of
Florida is the topic of Chapter 4. The system boundaries include potable water
production, urine treatment (i.e., separation, storage disinfection, pharmaceutical
removal, and struvite precipitation), and centralized wastewater treatment with or
without ozone for pharmaceutical destruction. The work presented in Chapter 4 is the
topic of a manuscript published in Water Research. Lastly, the Conclusions chapter
highlights the interconnectedness of the three main chapters’ systematic approach for
evaluating a new process to address pharmaceutical loading in the environment, as well
as address future inquiries for research.

28
Figure 1-1. Visual representation of the urban life-cycle of pharmaceuticals and nutrients in (A) conventional wastewater
treatment (WWT), (B) direct potable reuse (DPR), and (C) urine source separation (USS). In WWT, pharmaceuticals and nutrients discharged to receiving waters result in water quality issues (e.g., eutrophication) and ecotoxicological risk (Corcoran et al. 2010, Smith et al. 1999), and de facto reuse of wastewater effluent for drinking water purposes results in detected pharmaceuticals in finished water (Benotti et al. 2008). To address pharmaceutical concerns in DPR, high energy advanced treatment is often utilized (WRRF 2015). In USS, nutrients and pharmaceuticals are diverted from the general waste stream for more effective and efficient pharmaceutical removal and nutrient recovery (Larsen and Gujer 1996a, Lienert et al. 2007a).

29
CHAPTER 2 ION-EXCHANGE SELECTIVITY OF DICLOFENAC, IBUPROFEN, KETOPROFEN,
AND NAPROXEN IN UREOLYZED HUMAN URINE*
Application of Sorption Processes for Pharmaceutical Removal
Human urine is the major contributor of pharmaceuticals to wastewater treatment
plants, which are not designed to effectively remove pharmaceuticals by conventional
biological treatment (Joss et al. 2005, Salgado et al. 2012). As a result, the
pharmaceuticals are discharged to surface water where they pose an ecotoxicological
risk to aquatic organisms (Lienert et al. 2007b). Non-steroidal anti-inflammatory drugs
(NSAIDs), such as diclofenac, ibuprofen, naproxen, and ketoprofen, pose a high
ecotoxicological risk to species in the aquatic food chain when exposed to
environmentally relevant concentrations (Hernando et al. 2006). Approximately 70% of
ingested pharmaceuticals intended for human use are excreted in urine as either the
parent compound or its metabolites (Lienert et al. 2007a). For this reason, urine source-
separation and treatment is a proposed method to reduce pharmaceutical loading to the
environment by diverting undiluted urine from domestic wastewater (Lamichhane and
Babcock 2012).
Urine source-separation and treatment is also of interest as an alternative
approach to address excess nitrogen and phosphorus loading to aquatic systems
(Larsen et al. 2009). The high nutrient content in urine can be recovered to produce
fertilizer, which in turn can offset the raw materials and energy required to produce
synthetic fertilizer for agriculture (Kirchmann and Pettersson 1995). However, for
*Reproduced with permission from Landry, K.H., Sun, P., Huang, C.H., Boyer, T.H. 2015. Ion-exchange selectivity of diclofenac, ibuprofen, ketoprofen, and naproxen in ureolyzed human urine. Water Research
68, 510–521, DOI: http://dx.doi.org/10.1016/j.watres.2014.09.056. Copyright 2014 Elsevier Ltd.

30
nutrient recovery from source-separated urine to be considered a viable fertilizer
alternative, it is necessary to separate pharmaceuticals from nutrients to produce a
contaminant-free product.
When human urine leaves the body it is known as fresh urine (pH 6), and is
composed of urea, inorganic anions (Cl–, SO42–, PO4
3–), inorganic cations (Na+, K+,
Ca2+, Mg2+), and natural organic metabolites (Saude and Sykes 2007, Udert et al.
2003a). After a period of time, urease active bacteria, which are assumed ubiquitous in
wastewater collection systems, hydrolyze urea to form ammonia and bicarbonate and
increase the pH from 6 to 9 (Udert et al. 2003a). Prevention of urea hydrolysis is an
active area of research, and would require the addition of urease inhibitors to the urine
collection system to prevent pipe blockages in plumbing due to precipitation (Hellström
et al. 1999, Krajewska 2009). Therefore, it is considered more practical to implement
urine treatment technologies that effectively separate pharmaceuticals from nutrients in
ureolyzed urine without the added step of preventing urea hydrolysis.
Advanced treatment processes that have been applied to source-separated urine
for pharmaceutical removal or destruction include nanofiltration, ozonation,
electrodialysis, and anion exchange. Nanofiltration rejected >90% of diclofenac and
ibuprofen in urine, but also rejected 100% of phosphate and >50% of ammonia (Pronk
et al. 2006b). Ozonation of ureolyzed urine was inefficient at pharmaceutical destruction
due to ozone scavenging by ammonia (Dodd et al. 2008). Electrodialysis of urine was
partially effective at separating nutrients from pharmaceuticals, but high permeation of
ibuprofen was detected in the concentrate (Pronk et al. 2006a). Struvite precipitation in
urine can produce a fertilizer product with low pharmaceutical contamination

31
(Kemacheevakul et al. 2012, Ronteltap et al. 2007), but does not prevent
pharmaceuticals from entering the environment. Previous research investigated the use
of anion exchange resin (AER) to remove diclofenac and ketoprofen from synthetic
fresh and ureolyzed urine with high pharmaceutical removal of >90% (Landry and Boyer
2013). Additionally, the AER investigated was not selective for phosphate with negligible
removal in ureolyzed urine, thereby effectively separating pharmaceuticals from
nutrients. The primary mechanism of removal was electrostatic (i.e., Coulombic)
interactions between the carboxylate functional group of the pharmaceutical and the
quaternary ammonium functional group of the resin (Landry and Boyer 2013).
Furthermore, high pharmaceutical removal by AER required van der Waals interactions
between the benzene rings of the pharmaceutical and the polystyrene resin matrix.
Complete regeneration of the AER was achieved using a 5% NaCl, equal-volume
water–methanol solution due to the disruption of the Coulombic interactions between
the functional group of the resin and carboxylate functional group of the pharmaceutical
and van der Waals interactions between the resin matrix and benzene rings of the
pharmaceutical (Landry and Boyer 2013).
Considering previous research on urine treatment, anion exchange appears to be
an effective method to separate acidic pharmaceuticals from nutrients in urine. Although
the previous work by the authors provided new information regarding the use of AERs
to selectively remove diclofenac and ketoprofen from urine, it is unknown how other
pharmaceuticals with structurally similar properties may be removed. Other NSAIDs,
such as ibuprofen and naproxen, contain benzene rings and carboxylic acid functional
groups that deprotonate under fresh and ureolyzed urine conditions allowing for

32
Coulombic and van der Waals interactions with AER. Additionally, the previous research
was conducted at pharmaceutical concentrations much higher than what would be
realistically present in urine (Winker et al. 2008b). Isotherm modeling is often used to
investigate the underlying mechanisms of sorption processes, selectivity of sorbates to
sorbents, and resin capacity (Delle Site 2001). Previous research has incorporated
linearized isotherm modeling when studying the ion-exchange of charged
micropollutants in water using AER (Bäuerlein et al. 2012). However, the use of
linearized isotherm models can lead to errors when estimating model parameters (Foo
and Hameed 2010).
The goal of this research was to generate new experimental data on the ion-
exchange removal of diclofenac (DCF), ibuprofen (IBP), ketoprofen (KTP), naproxen
(NPX), and paracetamol (PCM) by AER in synthetic ureolyzed urine when present at
realistic concentrations in urine. The pharmaceuticals were selected based on
widespread use and high potential for ecotoxicity (Hernando et al. 2006, Li 2014). The
specific objectives of this work were to (i) elucidate the underlying mechanisms that
dictate the selectivity of AER for structurally similar pharmaceuticals, (ii) evaluate the
ion-exchange removal of pharmaceuticals when present individually or combined as a
mixture in synthetic ureolyzed urine, and (iii) evaluate the ion-exchange behavior of
pharmaceuticals under continuous-flow conditions.
Experimental Methods
Synthetic Human Urine
Synthetic ureolyzed urine was used for most experiments and synthetic fresh
urine was used for one experiment. The urine composition is given in Table 2-1 and was

33
based on previous work (Landry and Boyer 2013), with adjustment to maintain nitrogen
and inorganic carbon mass balance in fresh and ureolyzed urine (Boyer et al. 2014).
Pharmaceuticals in Urine
The chemical characteristics of the pharmaceuticals investigated in this work are
listed in Table A-1. Diclofenac sodium (CAS 15307-79-6, MP Biomedicals), ibuprofen
sodium (CAS 31121-93-4, Fluka Analytical), ketoprofen (CAS 22071-15-4, Sigma-
Aldrich), and naproxen sodium (CAS 26159-54-2, Sigma-Aldrich) are all weakly acidic
pharmaceuticals from the NSAID class. Paracetamol (CAS 103-90-2, Sigma-Aldrich) is
a weakly acidic pharmaceutical from the analgesic pharmaceutical class. Stock
solutions (1000 mg/L) of each pharmaceutical were made using equal-volume water–
methanol. Published data was reviewed to estimate realistic pharmaceutical
concentrations in urine as described in Table A-2 in Appendix A (Joss et al. 2005,
Salgado et al. 2012, Ternes 1998, Winker et al. 2008b). Based on this analysis, it was
estimated that pharmaceutical concentrations in urine range from 2–1,600 µg/L. The
stock solutions were used to spike the synthetic ureolyzed urine at an initial
pharmaceutical concentration of 2,000 µg/L (0.006–0.013 mmol/L). The solvent content
in the synthetic urine was 0.1% (v/v) for the individual pharmaceutical equilibrium
experiments and 0.4% (v/v) for the NSAID mixture equilibrium and column experiments.
One equilibrium experiment was performed with 0.2 mmol/L ibuprofen in synthetic fresh
urine.
Anion Exchange Resin
Dowex 22, a strong-base, polystyrene AER was used in all isotherm and column
experiments. A complete description of the AER is described in Appendix A (Table A-3).

34
Batch Equilibrium Tests
Batch equilibrium tests were performed in triplicate to investigate the ion-
exchange behavior of each pharmaceutical individually and as a combination of DCF,
IBP, NPX, and KTP. Ureolyzed urine was measured at 125 mL and added to 125 mL
Erlenmeyer flasks. Varying amounts of dried Dowex 22 AER (average density = 0.366 g
mL–1) was added at corresponding wet doses of 0.16, 2.12, 4.08, 6.04, and 8 mL/L. The
resin doses were selected to span a wide range of removal. Samples were mixed on a
shaker table at 325 rpm for an equilibrium time of 24 h and filtered using a 0.45 µm
PVDF syringe filter before being analyzed for pH and temperature. Filtered samples
were stored in 2 mL low-adsorption LC/MS vials and kept refrigerated until analyzed for
pharmaceutical concentrations. Batch equilibrium tests performed with 0.2 mmol/L IBP
in synthetic fresh urine followed the same method but with varying amounts of dried
Dowex 22 AER corresponding to wet doses of 1, 2, 4, 8, and 16 mL/L, which were the
same doses used in previous work (Landry and Boyer 2013), and analyzed using UV-
absorbance.
Column Tests
Fixed-bed column runs were conducted in a glass column (0.7854 cm inner
diameter) packed with 1 mL of Dowex 22 AER to obtain a height:diameter ratio of at
least 2 (Edzwald 2011). All column tests were performed under the same conditions by
maintaining an empty bed contact time (EBCT) and flow rate of 2 min and 0.5 mL min–1,
respectively. The synthetic ureolyzed urine was spiked with a mixture of DCF, IBP, KTP,
and NPX at an initial concentration of 2000 µg/L (0.006–0.013 mmol/L), each. For the
first column run, 14,300 bed volumes (BVs) of synthetic ureolyzed urine were treated.
Effluent composite samples were collected every 12 h and influent control samples

35
were collected every 24 h. After treatment, the column was rinsed with DI water to
displace the synthetic ureolyzed urine in the column. Regeneration of the AER in the
column was conducted using a regeneration solution that contained 5% (m/m) NaCl in
an equal-volume mixture of water–methanol. Column regeneration was completed with
24 BV of regeneration solution at an EBCT and flow rate of 4 min and 0.25 mL min–1,
respectively. Regeneration effluent samples were collected every 8 min resulting in 2
mL samples which were further diluted 187.5× prior to analysis by LC/MS. The
regenerated AER was used to treat 5,950 BVs of synthetic ureolyzed urine spiked with
the pharmaceutical mixture under the same conditions. The column tests were
conducted for three treatment and regeneration cycles.
Analytical Methods
The synthetic urine was filtered before each test using 0.45 µm membrane filter
(Millipore Durapore) to separate particulate impurities from urine, and after each test
using a 0.45 µm PVDF membrane syringe filter (Millipore Durapore) to separate the
AER from urine. Preliminary experiments showed negligible adsorption of the studied
pharmaceuticals to the PVDF filter (results not shown). Pharmaceutical concentrations
for the equilibrium and column experiments were measured using an Agilent 1100
Series LC/MSD system (Agilent Technologies, Palo Alto, CA) equipped with a reversed-
phase column (2.1 × 150 mm, 3 μm Ascentis RP-amide column; Supelco, Bellefonte,
PA). The mobile phase consisted of (A) a mixture of HPLC grade water and formic acid
(99.9/0.1 v/v), and (B) HPLC grade methanol and acetonitrile (50/50 v/v). The mass
spectrometer was set at positive electron-spray ionization (ESI+) with select ion
monitoring (SIM) mode. A five-point calibration curve (100, 200, 500, 1,000, 2,000 µg/L)
was created by serial dilution of the stock standards. The coefficient of determination

36
(R2) was ≥ 0.992 for all pharmaceuticals except for ibuprofen (0.932 ≤ R2 ≤ 0.958). The
analytical method had a detection limit of around 7–9 µg/L for IBP, KTP, NPX and PCM,
and around 40 µg/L for DCF. Ibuprofen concentrations in the fresh urine experiment (C0
= 0.2 mmol/L) were measured using UV absorbance on a U-2900 UV–visible
spectrophotometer (Hitachi High Technologies) and 1 cm quartz cuvette at a
wavelength of 222 nm. A more detailed explanation of the method used can be found
elsewhere (Landry and Boyer 2013). All samples were measured for pH and
temperature at the end of each experiment using an Accumet AB-15 + pH meter and
pH/ATC probe. The pH meter was calibrated prior to each use with 4, 7, and 10 buffer
solutions.
Data Analysis
Data from the equilibrium tests were the mean value of triplicate samples.
Analysis of covariance (ANOCOVA) was conducted using MATLAB (8.2.0.701 R2013b)
(MathWorks 2013) to determine if there was a significant difference (α = 0.05) between
the slopes of the log-log transformed ion-exchange isotherms. The null hypothesis
states that there was not a significant difference between slopes (p > 0.05) and the
alternative hypothesis states that there was a significant difference between the slopes
(p < 0.05). Integration of the column sorption and regeneration curves was conducted
using trapezoidal numerical integration method in MATLAB.
Isotherm Models
Nonlinear isotherm modeling of the equilibrium experiments was performed using
MATLAB (8.2.0.701 R2013b) following the nonlinear least squares method. The
experimental data were fit to the Freundlich, Langmuir, Dubinin-Astakhov (D-A), and
Dubinin-Radushkevich (D-R) isotherm models; a detailed description of the theory

37
behind each model is given in Appendix A. Linear regression of each isotherm model
was conducted to establish initial values for the nonlinear model parameters. The linear
form and plot of each isotherm are shown in Appendix A (Table A-4). To determine the
best fitting isotherm model, the experimental data were evaluated using the correlation
coefficient (R2), the sum of squares error (SSE), and the average relative error (ARE).
The SSE was used to compare the fit of the four isotherm models to the experimental
data from one equilibrium experiment. The R2 and ARE were used to compare the fit of
one isotherm model to multiple equilibrium experiments. The pharmaceutical
concentration on the AER (qe, mmol/g) was calculated as the difference between initial
and equilibrium aqueous concentrations divided by the dose of AER.
Results and Discussion
Ion-Exchange of Individual Pharmaceuticals at Realistic Concentrations
Batch equilibrium tests were performed to investigate the removal of individual
pharmaceuticals in ureolyzed urine. Some pharmaceuticals were not completely soluble
at the spiked concentration, possibly due to the high ionic strength of the synthetic
ureolyzed urine. For all analysis and discussion of the experimental data, the measured
concentration of the control sample (C0) was used as follows: diclofenac (DCF, C0 =
2.96×10⁻³ mmol/L), ibuprofen (IBP, C0 = 3.65×10⁻³ mmol/L), ketoprofen (KTP, C0 =
7.80×10⁻³ mmol/L), naproxen (NPX, C0 = 7.51×10⁻³ mmol/L), and paracetamol (PCM,
C0 = 1.38×10⁻² mmol/L). High removal was observed for DCF (95%), IBP (93%), KTP
(86%), and NPX (94%) at the highest AER dose of 8 mL/L. High removal of DCF, IBP,
KTP, and NPX was due to the combination of electrostatic (i.e., Coulombic) interactions
between the ionized carboxylic acid functional group of the pharmaceutical and the
quaternary ammonium functional group of the AER as well as the concurrent non-

38
electrostatic (i.e., van der Waals) interactions between the benzene rings of the
pharmaceutical and the polystyrene matrix of the AER (Landry and Boyer 2013). Under
ureolyzed urine conditions, at pH 9, the carboxylic acid functional group of DCF, IBP,
KTP, and NPX are all nearly 100% deprotonated. Low removal was observed for PCM
(14%) due to the lack of Coulombic interactions, only 40% of PCM was present in its
ionized form.
Nonlinear isotherm modeling was conducted to elucidate the selectivity and
capacity of the AER for each pharmaceutical. The selectivity was defined as the
equilibrium ratio of the solid-phase concentration (qe) to the liquid-phase pharmaceutical
concentration (Ce) where a higher selectivity indicates more pharmaceutical is present
on the solid-phase than in solution (Saikia and Dutta 2008). High selectivity of AER for
the pharmaceutical is beneficial because large amounts of pharmaceutical can be
sorbed when present at low concentrations or by using a small amount of AER, as well
as exhibit preferential ion-exchange over competing compounds. The capacity was
defined as the maximum amount of pharmaceutical that can be sorbed to the AER
before it is considered saturated.
Figure 2-1 shows the experimental data and nonlinear isotherm models for DCF,
IBP, KTP, and NPX in ureolyzed urine. The experimental data were fit to the Freundlich,
Langmuir, D-A, and D-R isotherm models; the isotherm parameters and goodness-of-fit
data are listed in Table A-5 in Appendix A. The DCF, KTP, and NPX experimental data
showed more favorable ion-exchange behavior as depicted by the steep slope and
concave-down shape, which allows for higher pharmaceutical loading on the AER at
lower concentrations. The IBP and PCM ion-exchange systems followed an unfavorable

39
ion-exchange trend as shown by a concave-up shape, where high removal was only
achieved at high AER dose (see Figure 2-1 and Figure A-1). Due to the very low
removal of PCM, none of the isotherm models fit the experimental data well (–0.297 <
R2 < 0.142; 82% < ARE < 277%) and therefore PCM was excluded from the remainder
of the discussion.
All isotherm models fit the data well for DCF, IBP, and KTP. However, the
isotherm models exhibited a poor fit to the NPX ion-exchange data (–0.538 ≤ R2 ≤
0.061; 67 ≤ ARE ≤ 91%). The poor fit of NPX to the isotherm models was likely due to
error when determining the amount exchanged onto the resin at the lowest AER dose
(0.16 mL/L). Very low removal occurred at the lowest resin dose, which may have led to
error in determining the amount exchanged onto the resin. In the individual equilibrium
experiments with NPX, only 5.72×10⁻⁴–5.55×10⁻³ mmol/g was exchanged onto the resin
at the lowest resin dose. However, as described later in the discussion, 1.06×10⁻²–
2.02×10⁻² mmol g –1of NPX was exchanged onto the resin during the combined
equilibrium experiments at the same resin dose. Excluding the lowest measured AER
dose from the experimental data improved the fit to the isotherm models (0.961 < R2 <
0.989; 4 ≤ ARE ≤ 20%). For brevity, the discussion will focus on the NPX isotherm
model with the lowest measured AER dose excluded from the experimental data.
However, the isotherm models with the entire range of experimental data may be found
in Appendix A (Table A-5, Figure A-2).
The Langmuir model presented the best fit for DCF, IBP, and KTP ion-exchange
systems (0.751 < R2 < 0.960; 11% < ARE < 34%). Negative parameter values obtained
for the IBP ion-exchange system indicate that the Langmuir model does not provide a

40
good description of the ion-exchange process because these parameters signify the
surface binding energy and monolayer coverage of the AER (Fungaro et al. 2009). A
separation factor (RL) was calculated from the Langmuir constant (KL) and initial solute
concentration (C0) to indicate whether the ion-exchange process was favorable (RL < 1)
or unfavorable (RL > 1), a more detailed description can be found in Appendix A (Foo
and Hameed 2010). For the IBP equilibrium experiment, an RL of 1.84 indicated that ion-
exchange by the AER was unfavorable. However, favorable ion-exchange was
observed for DCF, KTP, and NPX, as shown by RL < 1. In addition, the adsorption
energy of a solute on a sorbent may also be expressed by the change in Gibbs free
energy (ΔG°) calculated from the Langmuir constant, KL, a more detailed description is
presented in Appendix A. The ΔG° values suggested an order of decreasing selectivity
of DCF > NPX > KTP > IBP. The Freundlich isotherm fit the data well for all ion-
exchange systems (0.750 ≤ R2 ≤ 0.988; 10% < ARE < 37%). The selectivity of the AER
for the pharmaceuticals was determined from the Freundlich parameter, 1/nF, and
followed the order of decreasing selectivity of NPX > DCF > KTP > IBP. Favorable ion-
exchange (1/nF < 1) was observed for NPX, DCF, and KTP and unfavorable ion-
exchange (1/nF > 1) was observed for IBP.
Similar to the Langmuir and Freundlich model, the D-A and D-R models fit the
DCF, IBP, and KTP ion-exchange systems fairly well (0.749 < R2 < 0.955; 10 < ARE% <
40%), and the D-A model fit the NPX ion-exchange system best. The mean free energy
of sorption (E) determined from the D-A and D-R isotherms may be used to estimate the
type of sorption and is defined as the free energy change when 1 mole of ion is
transferred to the surface of a solid (Dominguez et al. 2011, Mahramanlioglu et al.
41
2002). Values of 8 kJ mol–1 < E < 16 kJ mol–1 indicate pure ion-exchange and values of
E < 8 kJ mol–1 indicate van der Waals interactions (Mahramanlioglu et al. 2002). The E
for the D-R model were 5.5–9.1 kJ mol–1, suggesting that the sorption mechanism was
not pure ion-exchange. This is consistent with the conclusion from the authors’ previous
work that a combination of Coulombic and van der Waals interactions were necessary
to selectively remove DCF using strong-base, polystyrene AER (Landry and Boyer
2013). The E for the D-A model suggested an order of decreasing selectivity of IBP >
KTP > DCF > NPX, which was not consistent with the ΔG° values deduced from the
Langmuir isotherm. However, the E determined for the D-R model suggested an order
of decreasing selectivity of NPX > DCF > KTP > IBP, which was closely aligned with the
order of selectivity determined by the Freundlich and Langmuir isotherms.
Effect of Pharmaceutical Properties
The NSAIDs investigated in this work all possessed the necessary Coulombic
interactions to participate in ion-exchange. Previous work by the authors found that
although a stoichiometric release of the counter-ion indicated ion-exchange as the main
mechanism of removal, van der Waals interactions were necessary to increase
selectivity between the pharmaceutical and AER (Landry and Boyer 2013). As a result,
the van der Waals interactions between the benzene rings of the pharmaceutical and
the polystyrene matrix of the AER appear to be the underlying reason for the order of
ion-exchange selectivity. Li and SenGupta (2004) found that if the charge of
hydrophobic ionizable organic compounds are identical then the non-polar portion will
influence the ion-exchange selectivity, where larger non-polar domains exhibit higher
selectivity. All of the NSAIDs investigated herein have identical charge (i.e., one
deprotonated carboxylic acid); DCF, NPX, and KTP contain two benzene rings whereas

42
IBP contains one benzene ring. The variation in the number of benzene rings implies
that the polarizability, and the dispersive interactions of DCF, NPX, and KTP are greater
than IBP, similar to that of pyrene, naphthalene, and benzene (Schwarzenbach et al.
2002). The molar refractivity is a measure of the total polarizability of a compound and
can also be used as a measure of the strength of the van der Waals forces between the
sorbate and sorbent (Ghose and Crippen 1987). The molar refractivity of the four
NSAIDs was predicted using the ChemAxon Calculator Plugin in Marvin (v6.3.0,
(ChemAxon 2013)) and followed an order of decreasing magnitude (i.e., decreasing van
der Waals forces) of DCF (75.46 cm3 mol–1) > KTP (72.52 cm3 mol–1) > NPX (64.85 cm3
mol–1) > IBP (60.73 cm3 mol–1). This order suggests that the van der Waals interactions
between DCF, KTP, and NPX and the AER are stronger than the interaction between
IBP and the AER. To further elucidate the pharmaceutical–AER interactions, isotherm
modeling of DCF ion-exchange by three AERs—Dowex 22, A520E, and Dowex 11—
was performed. The varying AER properties are given in Appendix A (Table A-3), and
the respective isotherm figures and parameters are given in Appendix A (Figure A-3 and
Table A-6). In general, the Freundlich, Langmuir, and D-R isotherms suggested an
order of affinity of Dowex 22 > A520E > Dowex 11. It was speculated that the Dowex 22
AER exhibited the greatest selectivity for DCF due to additional hydrogen bonding
between the carboxylic acid functional group or secondary amine of DCF and the
dimethylethanol amine functional group of the AER. Hydrogen bonding between DCF
and A520E or Dowex 11 was not possible because the functional groups of the AERs
cannot form hydrogen bonds. Recent work by Zhang et al. (2014) observed a similar
relationship between the selectivity of AER for anionic organic compounds and

43
hydrogen bonding abilities. Furthermore, steric hindrance may play a role in the AER
selectivity of the investigated pharmaceuticals. The hydrodynamic radii follows a
decreasing order of IBP (0.680 nm) > DCF (0.458 nm) > NPX (0.377 nm) (Bester-Rogac
2009); the hydrodynamic radius of KTP could not be determined from the literature. It is
speculated that the larger hydrated size of IBP in urine may inhibit effective ion-
exchange.
Previous research has established a correlation between the hydrophobicity of
an organic compound and ion-exchange behavior where the more hydrophobic
compounds demonstrate better ion-exchange due the favorable partitioning to the
surface of the sorbent from the bulk aqueous phase (Hand and Williams 1987, Li and
SenGupta 1998, Schwarzenbach et al. 2002). Anion exchange resins, such as Dowex
22, can be viewed as a particle containing a matrix of aromatic hydrocarbons with
charged functional groups, similar to that of particulate organic matter (Schwarzenbach
et al. 2002). The adsorption of hydrophobic organic compounds onto organic sediments
has been described as a partitioning process between water and the lipophilic solid
phase that may be simulated by the octanol–water partitioning coefficient (Kow) (Gawlik
et al. 1997), and linear free energy relationships have been established to demonstrate
the correlation between the Kow and the adsorption of organic compounds onto
particulate organic matter (Gawlik et al. 1997, Schwarzenbach et al. 2002). For
ionizable organic compounds, similar relationships may be developed to estimate ion-
exchange onto sediments using the pH-dependent octanol–water distribution coefficient
(D) as a predictor (Kah and Brown 2007). Dominguez et al. (2011) illustrated that the
maximum sorption of various pharmaceuticals onto a polymeric adsorbent was

44
dependent on the log D of the pharmaceutical in solution, where the more hydrophobic
species (i.e., increasing log D) exhibited greater sorption. The purpose of using the log
D is to account for the change in hydrophobicity at varying pH. Previous studies have
determined that fully ionized hydrophobic organic compounds, such as the ones
investigated here, may partition into octanol in appreciable amounts at high pH, as
shown in Eq. 2-1 (Jafvert et al. 1990, Strathmann and Jafvert 1998):
𝐷 =[𝐶𝑛]𝑜+[𝐶𝑖]𝑜
[𝐶𝑛]𝑤+[𝐶𝑖]𝑤 (2-1)
where [Cn]o is the concentration of the neutral species present in the octanol phase, [Ci]o
is the concentration of the ionized species present in the octanol phase, [Cn]w is the
concentration of the neutral species in the water phase, and [Ci]w is the concentration of
the ionized species in the water phase.
A simple equation (Eq. 2-2) may be used to calculate D of acidic ionized organic
compounds over the entire pH range (Kah and Brown 2008):
𝐷 = 𝐾𝑜𝑤 (1
1+10𝑝𝐻−𝑐𝑝𝐾𝑎) + 𝐾𝑜𝑤
′ (1 −1
1+10𝑝𝐻−𝑐𝑝𝐾𝑎) (2-2)
where (Kow) is the octanol–water partitioning coefficient of the neutral species, K′ow is
the octanol–water partitioning coefficient of the fully ionized species, the pH of
ureolyzed urine, and the conditional acid dissociation constant (cpKa) of the organic
compound which was corrected for the ionic strength of ureolyzed urine. The K′ow
values were determined previously by Scott and Clymer (2002) using a nonlinear least
squares best fit of Eq. 2-2 using experimental data. At pH 9, the hydrophobicity of DCF,
IBP, KTP, and NPX decreased considerably, as indicated by a reduction in the log D
value from that of the neutral species (Table A-1). The mole fraction distributions of the
neutral and ionized species present in the octanol and water phases were determined

45
by using Eq. 2-1 and the Henderson-Hasselbach equation. As illustrated in Figure A-4
at pH 9, 61–85% of the ionized molar fraction of DCF, KTP, and NPX was present in the
octanol phase, whereas only 14–38% of the ionized molar fraction was present in the
water phase. The partitioning behavior of IBP was much different than the other
NSAIDs, where 33% and 66% of ionized IBP was present in the octanol and water
phases, respectively. This suggests that IBP was more hydrophilic in ureolyzed urine
than DCF, KTP, and NPX, and therefore exhibited unfavorable ion-exchange to the
AER due to preferential partitioning in the aqueous phase. However, in fresh urine at pH
6, 92–99% of the molar fractions for all four NSAIDs were present in the octanol phase.
Therefore, it was hypothesized that IBP may be more hydrophobic under fresh urine
conditions and exhibit a greater ion-exchange selectivity for the AER.
Following the logic in the previous paragraph, a qualitative estimate can be made
on the ion-exchange behavior of pharmaceutical metabolites. This is an important
consideration because the majority of the pharmaceuticals found in urine are likely
present in the metabolized form (Lienert et al. 2007a). For example, 6% of diclofenac is
present in urine as the parent compound and 60% as its metabolites (Zhang et al.
2008). Through hydroxylation and conjugation, hydroxyl and carboxyl groups are added
to the diclofenac parent compound, altering the acidity and hydrophobicity. The pKa, log
Kow, and log D for the four major diclofenac metabolites were estimated using the
PALLAS computational program (v3.8.1.2, pKalc, PrologP, and PrologD prediction
programs for Windows, (CompuDrug 2006)); a description of the estimation procedure
is given elsewhere (Parang et al. 1997). The estimated chemical properties of the four
major diclofenac metabolites are listed in Table A-7. The estimated pKa was slightly
46
higher than diclofenac and the addition of phenol groups during hydroxylation added a
second acid dissociation constant. The log Kow decreased in comparison to the parent
compound, with the exception of 4'-hydroxydiclofenac and the log D at pH 6 and 9 were
much lower than diclofenac. Thus, it is speculated that the metabolites may be more
hydrophilic than diclofenac and have a lower selectivity for AER.
Effect of Urine Composition
To investigate the hypothesis that the selectivity of the AER for IBP would
increase in fresh urine, an equilibrium experiment was conducted with IBP (C0 = 0.256
mmol/L) in synthetic fresh urine. The initial concentration of IBP was higher than
previous experiments due to difficulty in measuring the pharmaceutical concentrations
by LC/MS in the synthetic fresh urine. Removal of IBP ranged from 15% at the lowest
resin dose (1 mL/L) to 80% at the highest resin dose (16 mL/L). As shown in Table A-8,
the experimental data was fit to the Freundlich, Langmuir, D-A, and D-R isotherms. Ion-
exchange of IBP was favorable according to the Freundlich parameter, 1/nF = 0.727,
and a RL of 0.562 determined from the Langmuir isotherm. The ion-exchange energy
(E) of 4.22 kJ mol–1 determined from the D-R isotherm indicate that ion-exchange was
not the only sorption mechanism and was coupled with additional interactions such as
van der Waals and hydrogen bonding. These results suggest that the selectivity of the
AER for IBP increased under fresh urine conditions due to the more hydrophobic nature
of IBP at pH 6. Therefore, it may be more advantageous to treat fresh urine to achieve
greater selectivity of IBP. Conversely, pharmaceuticals that are hydrophobic over the
entire pH range, such as DCF and KTP, will exhibit the same ion-exchange behavior in
fresh and ureolyzed urine (Landry and Boyer 2013).

47
Effect of Multiple Pharmaceuticals
Realistically, source separated urine would contain a mixture of various
pharmaceuticals that may compete for ion-exchange sites on the AER, interact in
solution, or in some cases, aid in the ion-exchange process. A previous study by Bui
and Choi (2009) showed an increase in removal due to non-competitive multilayer co-
adsorption of multiple pharmaceuticals onto mesoporous silica. To determine the effect
of multiple pharmaceuticals on ion-exchange, a mixture of DCF (C0 = 3.53×10⁻³
mmol/L), IBP (C0 = 4.70×10⁻³ mmol/L), KTP (C0 = 7.33×10⁻³ mmol/L), and NPX (C0 =
7.45×10⁻³ mmol/L) was spiked in ureolyzed urine. An equilibrium experiment was
conducted following the same approach as the individual pharmaceutical experiments.
High removal was observed for DCF (96%), IBP (80%), KTP (84%), and NPX (95%) at
the highest AER dose of 8 mL/L. A slight increase in removal was observed at all AER
doses for DCF and most AER doses for NPX compared to the individual ion-exchange
experiments (Figure 2-2), and there was a decrease in removal at all AER doses for IBP
and KTP.
For the pharmaceutical mixture equilibrium experiments, nonlinear isotherm
modeling was conducted individually for each pharmaceutical present (Table A-9,
Figure A-5). All isotherm models fit the data well for DCF, IBP, and NPX (0.761 ≤ R2 ≤
0.989; 15% ≤ ARE ≤ 48%). However, the isotherm models exhibited a poor fit to the
KTP ion-exchange data, possibly due to error when determining the amount exchanged
onto the resin at the lowest AER dose (0.16 mL/L) (Figure A-2). At the lowest resin
dose, 0–5.12×10⁻³ mmol/g KTP was exchanged onto the resin during the
pharmaceutical mixture equilibrium experiment; however, 7.48×10⁻³–1.78×10⁻² mmol/g
KTP was exchanged onto the resin during the individual equilibrium experiment.

48
Excluding the lowest measured AER dose from the experimental data improved the fit
to the isotherm models (0.981 < R2 < 0.988; 3 ≤ ARE ≤ 37%). Again, the discussion will
focus on the KTP isotherm model with the lowest measured AER dose excluded from
the experimental data. The Langmuir model presented the best fit for the ion-exchange
systems excluding IBP where favorable ion-exchange was observed for DCF, KTP, and
NPX (0 < RL < 1). The Langmuir model exhibited a poor fit to the IBP ion-exchange data
as indicated by negative KL and q0 values and RL > 1. The ΔG° values indicated an
order of decreasing selectivity of DCF > KTP > NPX > IBP. Overall, there was a
decrease in the ion-exchange capacity for each pharmaceutical, suggesting that there
was competition for ion-exchange sites at increasing concentrations.
According to the Freundlich parameter, 1/nF, ion-exchange of the
pharmaceuticals followed the order of decreasing selectivity of NPX > KTP > DCF > IBP
where NPX, KTP, and DCF exhibited favorable ion-exchange and IBP exhibited
unfavorable ion-exchange (Table A-9). This trend varied slightly from the order of
selectivity established by the Freundlich model for the individual pharmaceutical ion-
exchange experiments. It can be observed that the presence of multiple
pharmaceuticals decreased the ion-exchange selectivity, as indicated by an increase in
1/nF. However, an increase in KF for all pharmaceuticals signified an increase in the ion-
exchange capacity of the AER, which is consistent with previous research that studied
the effect of co-sorption of multiple pharmaceuticals onto a polymeric adsorbent
(Dominguez et al. 2011).
The E calculated for the D-A model followed the order of decreasing selectivity of
IBP > DCF > NPX > KTP, which was inconsistent with the order of selectivity

49
established by the Langmuir and Freundlich isotherms. However, the E determined for
the D-R model suggested an order of decreasing selectivity of DCF > KTP > NPX > IBP.
Again, E values of 4–7.84 kJ mol–1 indicated that pure ion-exchange was not the only
mechanism for removal and other interactions, such as van der Waals or hydrogen
bonding, was occurring between the pharmaceuticals and AER.
An analysis of covariance (ANOCOVA) was conducted to determine if there was
a significant difference (α = 0.05) in the slopes of the isotherm models derived for
pharmaceuticals present individually and as a mixture. The x and y data points, Ce and
qe, respectively, were log-transformed to obtain a linear equation for the ANOCOVA
analysis. The prediction plots and ANOCOVA table are given in Table A-10. For all ion-
exchange systems, there was not a significant difference between the slopes for the
individual and pharmaceutical mixture experiments. However, when comparing all of the
data points for NPX or KTP (i.e. including the lowest measured AER dose (0.16 mL/L)
there was a significant difference in removal when KTP or NPX was present individually
or as a mixture. This reinforces the earlier conclusion that the poor ion-exchange
exhibited by the lowest AER dose may be due to experimental error in the NPX
individual experimental data set and the KTP pharmaceutical mixture data set.
Column Studies
Continuous-flow column studies were performed using a mixture of DCF, IBP,
KTP, and NPX in synthetic ureolyzed urine. The process of treatment and regeneration
was completed for three cycles. Figure 2-3 shows the effluent pharmaceutical
concentration (Ce) normalized by the influent pharmaceutical concentration (C0), and
Figure A-6 shows the absolute pharmaceutical influent and effluent concentrations
during each treatment cycle. Effluent sample concentrations that measured greater than

50
the control sample or less than zero were set equal to the concentration of the control
sample or zero, respectively. Elution curves for regeneration cycles 1–3 are shown in
Figure A-7 and a mass balance of the pharmaceuticals sorbed and desorbed on the
resin is shown in Table 2-2.
The equations used for determining the mass balance in Table 2-2 are outlined in
Appendix A, the following mass balance for DCF during cycles 1–3 is provided as an
example calculation. In cycle 1, the mass of DCF removed from urine was determined
by trapezoidal numerical integration of the column sorption curve (Figure A-6) using
MATLAB. A total mass of 23.2 µmol DCF removed from urine is equivalent to the mass
sorbed onto the AER in cycle 1 because the AER is considered “fresh” (i.e., no
contaminant was initially present). The amount desorbed from the AER in cycle 1 (i.e.,
21.7 µmol DCF) was also determined by trapezoidal numerical integration of the elution
curve (Figure A-7). The amount remaining on the resin was determined by taking the
difference between the mass of DCF sorbed and mass of DCF desorbed (e.g., 1.5 µmol
DCF) and the % regeneration was determined by dividing the amount desorbed by the
amount sorbed (e.g., 93%). In cycle 2, the amount removed from urine (e.g., 9.2 µmol
DCF) was added to the amount remaining on the AER after cycle 1 regeneration to
determine the total amount sorbed onto the AER (e.g., 10.7 µmol DCF). If <100%
regeneration was achieved in the previous cycle then the amount sorbed onto the AER
may be greater than the amount removed from urine, as is the case for DCF in cycle 2.
The amount desorbed from the AER in cycle 2 was greater than the amount sorbed
onto the resin, which theoretically is not possible. Error may have been introduced when

51
diluting the regeneration sample prior to analysis and/or when integrating the sorption
and regeneration curves using the trapezoidal numerical integration method.
For cycle 1, the column treated 14,300 BVs of ureolyzed urine until complete
resin saturation of pharmaceuticals was achieved (i.e., Ce/C0 ≈ 1), and subsequently
regenerated using a 5% (m/m) NaCl, equal-volume water–methanol solution. The
column reached saturation of IBP first after 2,190 BVs followed by KTP and NPX after
5,160 BVs. The column did not reach saturation of DCF after the treated volume of
14,300 BVs. The order of decreasing AER capacity was DCF > NPX > KTP > IBP,
which was the same order observed for the Langmuir isotherm parameter, q0, from the
pharmaceutical mixture equilibrium experiments (Table A-9). DCF had the greatest
amount sorbed onto the resin, followed by NPX and KTP. Complete regeneration was
achieved for NPX in cycles 1–3. Regeneration efficiency for DCF and KTP was 97%
and 74%, respectively. IBP exhibited the lowest amount sorbed onto the AER due to the
unfavorable selectivity of the AER, as well as the lowest regeneration efficiency at 64%.
For cycles 2 and 3, 5,950 BVs of ureolyzed urine was treated. There was a marked
decrease in the total amount sorbed onto the AER because of the lower number of BVs
treated compared to cycle 1. Complete regeneration for DCF was achieved in cycles 2
and 3. Regeneration for KTP decreased in cycles 2 and 3 to 41% and 23%,
respectively. IBP continually decreased in regeneration efficiency from 22% in cycle 2 to
2% in cycle 3. It was expected that complete desorption of IBP would have occurred
during regeneration because the AER had the lowest selectivity for IBP. The low
amount of IBP desorbed from the AER was due to the low amount sorbed onto the
AER. The maximum ion-exchange capacity determined by the Langmuir isotherm from

52
the pharmaceutical mixture equilibrium experiments tended to underestimate the
maximum ion-exchange capacity for each pharmaceutical (cycle 1, Table 2-2) with a
relative error of 61–331%, except for NPX which had an 11% relative error. The D-R
isotherm parameters overestimated the maximum ion-exchange capacity with a relative
error of 36–100% for each pharmaceutical. It should be noted that DCF did not reach
saturation in the column, therefore the estimated capacity of the resin of 0.106 mmol/g
determined from the D-R isotherm (Table A-9) may be an accurate estimation of column
capacity for DCF. However, for the remaining pharmaceuticals, the isotherm models do
not accurately estimate sorption capacities of the AER under continuous flow
conditions.
Practical Application and Future Work
An ion-exchange column for pharmaceutical removal would ideally precede
nutrient removal and/or recovery in source separated urine to produce a contaminant
free nutrient product. For perspective, a 2 L column of AER could potentially treat up to
4,380 L or 28,600 L of ureolyzed urine to fully saturate the AER column with IBP or
DCF, respectively. However, the AER would not treat urine until saturation but would
rather reach a predetermined operating capacity followed by regeneration. The
operating capacity should be established based on a correlation between % removal
and % reduction in ecotoxicity. Future work will need to be conducted to evaluate the %
reduction in ecotoxicity after treatment. Furthermore, brine disposal also poses an
issue, therefore, advanced oxidation of the regeneration brine is being investigated to
further destroy the pharmaceuticals as well as potentially produce a reusable
regeneration solution.

53
Concluding Remarks
The Langmuir and Freundlich isotherm models indicated that the selectivity of
Dowex 22 AER followed the order DCF > NPX > KTP > IBP > PCM and NPX > DCF >
KTP > IBP > PCM, respectively. Favorable ion-exchange was observed for DCF, KTP,
and NPX and unfavorable ion-exchange was observed for IBP and PCM. The D-R
isotherm suggested that the sorption interactions between the AER and
pharmaceuticals were not purely ion-exchange. The ion-exchange selectivity was
governed by van der Waals interactions between the acidic pharmaceuticals and AER.
Based on experimental results, it is predicted that AER will be less selective for the
pharmaceutical metabolites than the parent compound because of more hydrophilic
character of the metabolites. These conclusions are expected to apply generally to
strong-base, polystyrene AER. The selectivity of the AER for IBP was greater in fresh
urine due to increasing hydrophobicity of the pharmaceutical. This result suggests that
more efficient separation of IBP from urine may be achieved in fresh urine as opposed
to ureolyzed urine. Urine chemistry should be considered during treatment design to
achieve greater selectivity of IBP, particularly in demographic areas where IBP may be
consumed in large quantities. The ion-exchange behavior of the NSAIDs was not
significantly different when present individually or as a mixture in solution. Continuous-
flow column experiments provide valuable insight on the practical application of AER to
separate pharmaceuticals from ureolyzed urine. Because the pharmaceuticals
investigated in this work reached saturation at varying bed volumes, the size of the AER
bed may need to vary according to the pharmaceutical present either at the highest
concentration or greatest ecotoxicological risk. Regeneration of the column using a 5%

54
(m/m) NaCl, equal-volume water–methanol solution allowed for repeated use of the
AER.
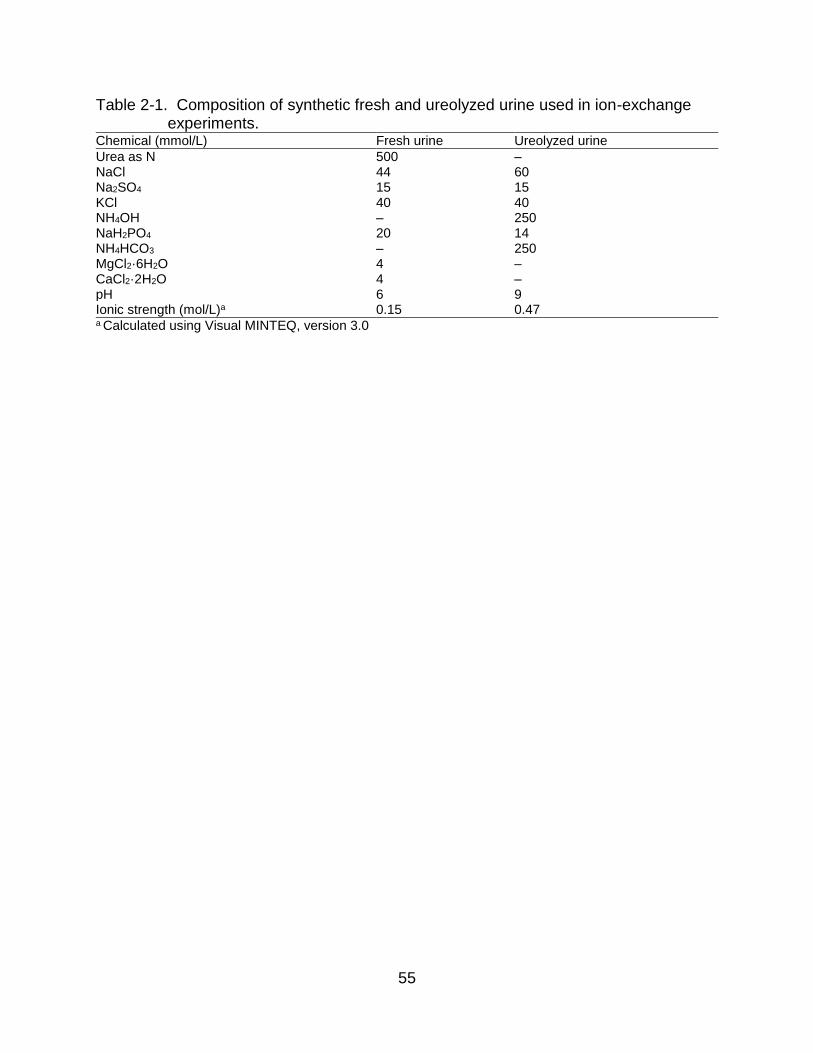
55
Table 2-1. Composition of synthetic fresh and ureolyzed urine used in ion-exchange experiments.
Chemical (mmol/L) Fresh urine Ureolyzed urine
Urea as N 500 – NaCl 44 60 Na2SO4 15 15 KCl 40 40 NH4OH – 250 NaH2PO4 20 14 NH4HCO3 – 250 MgCl2·6H2O 4 – CaCl2·2H2O 4 – pH 6 9 Ionic strength (mol/L)a 0.15 0.47 a Calculated using Visual MINTEQ, version 3.0

56
Table 2-2. Continuous-flow column ion-exchange of DCF, IBP, KTP, and NPX onto Dowex 22 AER followed by in-column regeneration over three treatment–regeneration cycles.
Removed from urine (µmol)
Sorbed onto resin (µmol)
Desorbed from resin (µmol)
Remaining on resin (µmol) % Regeneration
Diclofenac cycle 1 23.2 23.2 21.7 1.5 93% cycle 2 9.2 10.7b 11.5a 0.0 100% cycle 3 6.8 6.8c 9.3a 0.0 100% Ibuprofen cycle 1 3.8 3.8 2.4 1.4 64% cycle 2 1.7 3.0b 0.7 2.4 22% cycle 3 0.5 2.9c 0.1 2.8 2% Ketoprofen cycle 1 8.1 8.1 6.0 2.1 74% cycle 2 4.7 6.8b 2.8 4.0 41% cycle 3 3.2 7.2c 1.7 5.5 23% Naproxen cycle 1 9.2 9.2 9.9a 0.0 100% cycle 2 3.0 3.0b 4.4a 0.0 100% cycle 3 2.4 2.4c 2.5a 0.0 100% a Analyzed sample measured greater than amount exchanged onto the AER, assumed complete regeneration of pharmaceutical b Amount exchanged on the AER for cycle 2 is the summation of the amount removed from urine in cycle 2 and the amount remaining on the AER after regeneration in cycle 1 c Amount exchanged on the AER for cycle 3 is the summation of the amount removed from urine in cycle 3 and the amount remaining on the AER after regeneration in cycle 2

57
Figure 2-1. Experimental equilibrium data and isotherm models determined by
nonlinear regression of (a) diclofenac (DCF) (C0 = 3.0 µmol/L), (b) ibuprofen (IBP) (C0 = 3.6 µmol/L), (c) ketoprofen (KTP) (C0 = 7.8 µmol/L), and (d) naproxen (NPX) (C0 = 7.5 µmol/L) using Dowex 22 AER. Figure (d) *Naproxen illustrates the plotted experimental isotherms excluding the lowest resin dose of 0.16 mL/L) (i.e. excluding the data point with the highest Ce and corresponding nonlinear isotherm models (Freundlich, Langmuir, Dubinin-Astakhov (D-A), and Dubinin-Radushkevich (D-R)).
0
0.005
0.01
0.015
0.02
0 0.002 0.004 0.006 0.008
qe
, m
mo
l/g
Ce, mmol/L
(a) Diclofenac
DCFLangmuirFreundlichD-AD-R
0
0.005
0.01
0.015
0.02
0 0.002 0.004 0.006 0.008
qe
, m
mo
l/g
Ce, mmol/L
(b) Ibuprofen
IBPLangmuirFreundlichD-AD-R
0
0.005
0.01
0.015
0.02
0 0.002 0.004 0.006 0.008
qe
, m
mo
l/g
Ce, mmol/L
(c) Ketoprofen
KTPLangmuirFreundlichD-AD-R
0
0.005
0.01
0.015
0.02
0 0.002 0.004 0.006 0.008
qe
, m
mo
l/g
Ce, mmol/L
(d) *Naproxen
NPXLangmuirFreundlichD-AD-R

58
Figure 2-2. Comparison of pharmaceutical removal when present individually or
combined in ureolyzed urine for (a) diclofenac, (b) ibuprofen, (c) ketoprofen, and (d) naproxen ion-exchange by Dowex 22 AER.
0%
20%
40%
60%
80%
100%
0.16 2.12 4.08 6.04 8
% R
em
oval
Resin dose, mL/L
(a) Diclofenac IndividualCombinedIndividual, C0 = 3.0 µmol/LCombined, C0 = 3.5 µmol/L
0%
20%
40%
60%
80%
100%
0.16 2.12 4.08 6.04 8
% R
em
oval
Resin dose, mL/L
(b) Ibuprofen IndividualCombinedIndividual, C0 = 3.6 µmol/LCombined, C0 = 4.7 µmol/L
0%
20%
40%
60%
80%
100%
0.16 2.12 4.08 6.04 8
% R
em
oval
Resin dose, mL/L
(c) Ketoprofen IndividualCombinedIndividual, C0 = 7.8 µmol/L Combined, C0 = 7.3 µmol/L
0%
20%
40%
60%
80%
100%
0.16 2.12 4.08 6.04 8
% R
em
oval
Resin dose, mL/L
(d) Naproxen IndividualCombinedIndividual, C0 = 7.5 µmol/L Combined, C0 = 7.4 µmol/L

59
Figure 2-3. Column saturation curves of Dowex 22 AER by pharmaceutical mixture of
(a) diclofenac (DCF), (b) ibuprofen (IBP), (c) ketoprofen (KTP), and (d) naproxen (NPX) over three treatment–regeneration cycles with fresh AER (cycle 1) and regenerated AER (cycles 2 and 3).
0
0.2
0.4
0.6
0.8
1
1.2
0 5000 10000 15000
C/C
0
Bed Volume
(a) Diclofenac
Cycle 1Cycle 2Cycle 3
0
0.2
0.4
0.6
0.8
1
1.2
0 5000 10000 15000
C/C
0
Bed Volume
(b) Ibuprofen
Cycle 1Cycle 2Cycle 3
0
0.2
0.4
0.6
0.8
1
1.2
0 5000 10000 15000
C/C
0
Bed Volume
(c) Ketoprofen
Cycle 1Cycle 2Cycle 3
0
0.2
0.4
0.6
0.8
1
1.2
0 5000 10000 15000
C/C
0
Bed Volume
(d) Naproxen
Cycle 1Cycle 2Cycle 3

60
CHAPTER 3 FIXED BED MODELING OF NONSTEROIDAL ANTI-INFLAMMATORY DRUG
REMOVAL BY ION-EXCHANGE IN SOURCE SEPARATED URINE: MASS REMOVAL OR TOXICITY REDUCTION?
Application of Bioassays and Modeling to Assess Pharmaceutical Ecotoxicity
Approximately 50–100% of a consumed dose of nonsteroidal anti-inflammatory
drugs (NSAIDs) are excreted in urine as the parent compound and metabolites
(Houghton et al. 1984, Lienert et al. 2007b, Sawchuk et al. 1995, Sugawara et al. 1978).
Conventional wastewater treatment is ineffective at removing these compounds, and is
considered a major point source of pharmaceutical discharge in the environment (Petrie
et al. 2015, Verlicchi et al. 2012). Furthermore, ibuprofen, diclofenac, and their
metabolites have been identified as having the highest potential ecotoxicological risk out
of 42 pharmaceuticals from 27 therapeutic groups (Lienert et al. 2007b). Urine source
separation has been proposed as an effective method to target these compounds for
more efficient removal, as opposed to centralized wastewater treatment where urine is
diluted by a factor of 100 (Lamichhane 2013, Larsen and Gujer 1996b). In addition to
pharmaceuticals, urine is high in nitrogen and phosphorus which may be utilized as an
alternative fertilizer (Kirchmann and Pettersson 1995). Therefore, effective separation of
pharmaceuticals from nutrients is necessary to produce a “contaminant free” fertilizer
product. From previous research, ion-exchange treatment of source separated urine is
an effective method to selectively remove NSAIDs with no co-removal of nutrients
(Landry and Boyer 2013, Landry et al. 2015). However, the work by Landry and Boyer
(2013) and Landry et al. (2015) primarily focused on ion-exchange of parent
compounds, and no research has been done evaluating pharmaceutical metabolite
removal. This is important because pharmaceuticals are primarily excreted as

61
metabolites, some of which may induce a response, or may be converted back to the
parent compound (Moser et al. 1990, Upton et al. 1980). Practical operation of sorption
processes is usually performed under continuous-flow conditions where concentration
profiles vary in space and time (Alberti et al. 2012). Although isotherm modeling
provides information describing how pollutants interact with sorbent materials (e.g.,
sorption mechanisms, surface properties, selectivity), these experiments are performed
under batch conditions at equilibrium (Foo and Hameed 2010). Column modeling is
commonly used to describe breakthrough curves which are influenced by equilibrium
isotherms, and individual transport processes in the column and sorbent (Alberti et al.
2012). However, mass removal alone is inadequate at evaluating pharmaceutical risk
and the efficacy of using sorption processes to reduce ecotoxicity potential is unknown.
Recently, there has been a paradigm shift in toxicity testing towards in vitro cell-based
and cell-free bioassays to rapidly assess efficacy of water quality treatment processes
(Escher et al. 2013).
Sorption processes are an attractive treatment method for pharmaceutical
removal in urine because it is low energy and has low environmental impact compared
to conventional wastewater treatment (Landry and Boyer 2016). Common
configurations include continuous flow batch reactors and fixed-bed columns
(Crittenden et al. 2012). Most sorption studies include kinetic and equilibrium batch
data, as well as fixed-bed column studies. The equilibrium and kinetic data obtained
from batch tests and fixed-bed configurations are the same, therefore these intrinsic
properties (e.g., surface and film diffusion coefficients) may be used to predict sorption
behavior under both conditions (Chu 2010). Several models have been developed to

62
predict sorption behavior (Xu et al. 2013). One such model is the homogenous surface
diffusion model (HSDM), which requires liquid-phase and intraparticle-phase mass
transfer coefficients, and isotherm parameters which may be determined from kinetic
and equilibrium batch data (Xu et al. 2013, Zhang et al. 2009). This type of predictive
modeling is useful for evaluating fixed-bed behavior under varying conditions, such as
empty bed contact time. From a practical standpoint, batch kinetic and equilibrium tests
are rapid and require limited materials. This is especially useful when evaluating
removal of emerging contaminants, such as pharmaceuticals, which are present at low
concentrations. Conducting long-term column experiments would require large volumes
of urine, synthetic or real, and high material costs particularly for pharmaceutical
metabolites.
Several researchers have developed various batteries of assays to evaluate the
efficacy of treatment methods to reduce pharmaceutical ecotoxicity in water and source
separated urine. For example, Escher et al. (2006) evaluated pharmaceutical ecotoxicity
in source separated urine using bioassays to detect baseline toxicity (i.e., chlorophyll
fluorescence test), estrogenic endocrine disruption (i.e., yeast estrogen screen), and
genotoxicity (i.e., umu test) after urine was treated using various advanced processes.
To our knowledge, no research has been done evaluating pharmaceutical toxicity
reduction using ion-exchange in source separated urine. Furthermore, Escher et al.
(2013) evaluated 103 in vitro bioassays to benchmark organic micropollutants in water,
wastewater, and reclaimed water and found that xenobiotic metabolism, hormone-
related modes of action, genotoxicity, and adaptive stress response were the most
responsive health-related endpoints. However, COX inhibition was not included in this

63
study. Nishi et al. (2010) evaluated NSAID ecotoxicity of surface water and wastewater
using an in vitro cyclooxygenase (COX) inhibition bioassay, which is the primary mode
of action of NSAIDs, and a dose-response relationship was observed between COX
inhibition and NSAID distribution. The cyclooxygenase enzyme has two subtypes, COX-
1 and COX-2. Inhibition of the COX-2 enzyme is attributed to the anti-inflammatory
effects of NSAIDs (Blobaum and Marnett 2007). Inhibition of the COX-1 enzyme, which
is associated with normal cellular homeostasis, has been attributed to aquatic toxicity
including gastrulation arrest and defective vascular tube formation in zebrafish, and
reproductive issues in Japanese medaka (Cha et al. 2005, Lee et al. 2011). For this
reason, inhibition of COX-1 was the mode of action evaluated in this study. The benefit
of using cell-based bioassays is that they evaluate the potential for adverse effect.
Cellular response is one aspect of taking a systems-level approach to assess whole
organism and population response (Julia and Portier 2007).
This study combined predictive column modeling with in vitro bioassays to
provide a preliminary assessment of fixed-bed NSAID ion-exchange removal to reduce
toxic potential. The goal of this research was to develop a systematic approach to
evaluate the ion-exchange removal of pharmaceutical parent compounds and
pharmaceutical metabolites in urine and evaluate the corresponding reduction in
ecotoxicity utilizing the entire dose-response curve through three main objectives: (1)
compare COX-1 inhibition and mass removal for individual compounds, (2) compare
COX-1 inhibition and mass removal for a pharmaceutical mixture, and (3) compare the
effect of urine matrices on pharmaceutical ion-exchange removal.

64
Materials and Methods
Pharmaceutical and Pharmaceutical Metabolites
The chemical characteristics of the pharmaceutical parent compounds and
respective metabolites investigated in this work are listed in Table B-1. Diclofenac
sodium (DCF) (CAS 15307-79-6), ibuprofen sodium (IBP) (CAS 31121-93-4),
ketoprofen (KTP) (CAS 22071-15-4), and naproxen sodium (NPX) (CAS 26159-54-2)
are all weakly acidic pharmaceuticals from the NSAID class. A primary metabolite of
each parent compound were also investigated. 4’-OH-diclofenac (OH-DCF) (CAS
64118-84-9), hydroxy ibuprofen (OH-IBP) (CAS 53949-53-4), ketoprofen acyl
glucuronide (KTP-gluc) (CAS 76690-94-3), and O-desmethylnaproxen (Odm-NPX)
(CAS 52079-10-4). All metabolites were purchased from Toronto Research Chemicals
and all pharmaceutical parent compounds were purchased from Sigma Aldrich.
Separate stock solutions were made by dissolving each compound in methanol.
Synthetic and Real Urine
Synthetic ureolyzed (i.e., aged) urine was made according to a previously
described method and adjusted to include the six major endogenous metabolites found
in human urine (Table B-2) (Landry et al. 2015). Pharmaceutical parent compounds and
metabolites were spiked individually in ureolyzed urine at an initial concentration of
1,000 µg/L. The same bulk solution of ureolyzed urine was used for both the kinetic test
and equilibrium test of the respective compounds. Real ureolyzed urine was collected
from one male and one female. The total organic carbon (TOC) concentration and
conductivity are shown in Table B-2.

65
Anion Exchange Resin
Dowex 22 strong-base, polymeric anion exchange resin (AER) was used for all
batch kinetic and equilibrium experiments. This resin is a macroporous AER
functionalized with dimethylethanolamine functional groups. The AER was
preconditioned using NaCl, and dried following a previously described method (Landry
and Boyer 2013).
Pharmaceutical Concentrations in Urine
Pharmaceutical parent compound and metabolite concentrations in urine were
estimated in urine following a previously described method (Landry et al. 2015).
Detailed methodology may be found in Appendix B. Table 3-1 lists the excretion rates
and estimated parent compound and metabolite concentrations in urine.
Toxicity Bioassays
Cyclooxygenase (COX) inhibiting activity was measured using a COX
Colorimetric Inhibitor Screening Assay Kit (Cayman Chemical Co.) according to the
protocol provided by Cayman Chemical Co. COX subtype 1 (COX-1) was the only
enzyme evaluated for inhibiting activity. COX-1 enzyme was incubated with each
inhibitor for 30 min prior to plate development. Each compound was evaluated for COX-
1 inhibition at five concentration points and performed in triplicate. To evaluate COX-1
inhibition from the pharmaceutical parent compounds and pharmaceutical metabolites
only, and to avoid interference from the high concentrations of nutrients, salts, and
endogenous metabolites in synthetic urine, pharmaceutical stock solutions were diluted
in methanol for the bioassays. The concentration points were made by serial dilution
and corresponded to a 10-log concentration factor (i.e., 0.01×, 0.1×, 1×, 10×, 100×),
where 1× corresponds to the realistic concentration found in urine (Table 3-1). Effect

66
concentrations for single compound dose-response curves is listed in Table B-4. Dose-
response curves were modeled to the classic Hill equation (Eq. 3-1) using a 3-
parametric logistic regression developed by Cardillo (2012) in MATLAB (8.2.0.701
R2013b) (MathWorks 2013).
𝐼 = 𝐼0 +(𝐼𝑚𝑎𝑥−𝐼0)
1+(𝐼𝐶50
𝐶)
𝐻 (3-1)
Where I is the observed inhibition, I0 is the minimum observed inhibition, Imax is
the maximum observed inhibition, IC50 is concentration at which 50% of the COX-1
enzyme is inhibited (µmol/L), C is the inhibitor concentration (µmol/L), and H is the Hill
slope. One experiment was conducted as a mixture of DCF, KTP, KTP-gluc, NPX, and
Odm-NPX. Mixture toxicity was evaluated using the generalized concentration addition
model (Eq. 3-2) (Howard and Webster 2009).
𝐼𝑚𝑖𝑥 =𝐼𝑚𝑎𝑥𝐴𝐶𝐴 𝐼𝐶50𝐴⁄ +𝐼𝑚𝑎𝑥𝐵𝐶𝐵 𝐸𝐶50𝐵⁄ +⋯
1+𝐶𝐴 𝐸𝐶50𝐴⁄ +𝐶𝐵 𝐸𝐶50𝐵⁄ +⋯ (3-2)
Where Imix is the effect of the mixture at a specific concentration, ImaxA is the
maximum inhibition of chemical A, IC50A is the IC50 of chemical A, and CA is the
concentration of chemical A in the mixture, and so-forth for chemical B, etc. Inhibition
concentrations for the pharmaceutical mixture dose-response curves is listed in Table
B-5.
Batch Kinetic and Equilibrium Tests
Batch kinetic and equilibrium tests were performed following a previously
described method using ureolyzed urine at an initial pharmaceutical parent compound
or metabolite concentration of 1,000 µg/L (Landry and Boyer 2013). Details regarding
the experimental method are provided in Appendix B.

67
Fixed-Bed Column Modeling
The unsteady-state adsorption of pharmaceutical parent compounds and
metabolites in a fixed-bed column were predicted by the homogenous surface diffusion
model (HSDM) using the Fixed-bed Adsorption Simulation Tool (Fast 2.1beta) (Sperlich
et al. 2008). Details regarding the HSDM may be found in Appendix B.
Sample Preparation
Pharmaceutical samples from the column experiments were separated from the
urine matrix using a solid phase extraction (SPE) vacuum station (Supelco Visiprep)
and phenyl SPE columns (SiliaPrep, SiliCycle), evaporated, and reconstituted following
a previously described method (Magiera et al., 2014). The dry residue of DCF, KTP,
and NPX samples were dissolved in 1 mL of acetonitrile:10 mM K2HPO4 (pH 3) (10:90;
v/v) mobile phase and 100 µL was injected into the HPLC-UV system (Hewlett Packard
1050 series detector and Agilent 1100 series auto sampler). The dry residue of Odm-
NPX was dissolved in 1 mL of 25 mM KH2PO4 (pH 3) mobile phase and 25 µL was
injected into the HPLC-UV system.
Analytical Methods
The COX Colorimetric Inhibitor Screening Assay Kit was analyzed using
microplate reader (SpectraMax Plus 384) at 590 nm. Pharmaceutical concentrations for
the column experiments were measured using HPLC-UV (Hewlett Packard 1050 series
detector and Agilent 1100 series auto sampler) at 230 nm, equipped with a reversed-
phase column (2.1 × 150 mm, 3 μm Ascentis RP-amide column; Supelco, Bellefonte,
PA). For DCF, KTP, and NPX analysis, the mobile phase consisted of a mixture of
acetonitrile and 10 mM K2HPO4 (pH 3) (55:45 v/v). For Odm-NPX analysis, the mobile
phase consisted of a mixture of acetonitrile and 25 mM KH2PO4 (pH 3) (40:60 v/v). A

68
seven-point calibration curve (0, 50, 100, 500, 1,000, 5,000, and 10,000 µg/L) was
created by serial dilution of the stock standards. The limit of detection (LOD) was 50
μg/L. Pharmaceutical concentrations were set to the LOD if the effluent concentration
fell below the LOD. Endogenous metabolite concentrations in synthetic and real urine
for equilibrium experiments with DCF were analyzed by measuring the TOC
concentration using a Shimadzu TOC-VCPH analyzer equipped with an ASI-V
autosampler (Apell and Boyer 2010). The relative difference between all duplicate
samples was <5%. Several samples had final TOC concentrations greater than the
initial TOC concentrations, in these cases, the final concentration was set equal to the
initial concentration and yielded 0% removal. Conductivity was analyzed using an Orion
Star A212 conductivity meter, and was calibrated prior to use using three conductivity
standards (14, 50, and 100 mS/cm).
Data Analysis
Data from the toxicity bioassays and equilibrium tests were the mean value of
triplicate samples. Data from the kinetic tests were the mean value of duplicate
samples. Analysis of covariance (ANOCOVA) was conducted using MATLAB (8.2.0.701
R2013b) to determine if there was a significant difference (α = 0.05) between the slopes
of the log-log transformed isotherms (MathWorks 2013). The null hypothesis states that
there was not a significant difference between slopes (p > 0.05) and the alternative
hypothesis states that there was a significant difference between the slopes (p < 0.05).
Results and Discussion
COX-1 Inhibition for Individual Compounds
The HSDM was selected to predict fixed-bed performance of ion-exchange
removal of DCF, KTP, NPX, and Odm-NPX (Figure 3-1). The Freundlich isotherm

69
parameters used for model calibration are listed in Table B-12. The HSDM model was
also fit to existing fixed-bed column data to confirm model validity. The R2 and sum of
squares error (SSE) was 0.98 and 1.22, respectively, for the column data shown in
Figure B-1. For the column data in Figure B-2, the SSE was 38, 57, and 7.5 for DCF,
KTP, and NPX, respectively. Furthermore, the R2 was 0.48 for KTP, and 0.88 for DCF
and NPX. Broad tailing in the experimental data, particularly for DCF, may be attributed
to flow non-idealities such as column channeling (Chu 2004). Nevertheless, the HSDM
was deemed appropriate to pursue the objective of coupling toxicity reduction with ion-
exchange removal. The Freundlich isotherm parameter 1/n and Biot number, which is
the ratio of the external mass transfer rate to the intraparticle mass transfer rate, are
indicators of the controlling phase for mass transfer (Hand et al. 1984a). As the 1/n
approaches 1 and the Biot number increases, external mass transfer and intraparticle
mass transfer contribute equally to the rate of adsorption. The Biot number for DCF,
NPX, Odm-NPX were 30, 139, and 20, and 1/n values were 1.05, 0.74, 0.86,
respectively, which indicated both external and intraparticle mass transfer rates
contributed to the rate of adsorption. For irreversible isotherms, such as KTP, where 1/n
= 0, the rate of adsorption is controlled by intraparticle mass transfer (Hand et al.
1984b). The mass breakthrough curves in Figure 3-1 exhibit a broad trailing edge
possibly due to slow intraparticle diffusion within the AER pore space (Chu 2004).
Furthermore, the Freundlich isotherm parameters influence the breakthrough curve
profile (Hand et al. 1984a). In general, increasing selectivity (i.e., decreasing 1/n) or
increasing AER capacity (i.e., KF) increases the volume treated until breakthrough, and
decreases the intraparticle mass transfer rate (DS) resulting in a broad trailing edge.

70
Conversely, decreasing selectivity (i.e., increasing 1/n) or decreasing AER capacity (i.e.,
decreasing KF) decreases the volume treated until breakthrough, and increases the
intraparticle mass transfer rate (DS) resulting in a sharper trailing edge. The benefit of
predicting fixed-bed column performance is that column parameters may be optimized,
and material requirements and costs may be estimated prior to pilot or full-scale
implementation (Crittenden et al. 1987).
As stated previously, the premise of this research is that both mass removal and
toxicity potential are needed to evaluate pharmaceutical risk. To address this, an
alternative approach to evaluating the fixed-bed breakthrough was taken by converting
the commonly depicted normalized effluent concentration (i.e., C/C0) to percent COX-1
inhibition. By evaluating treatment performance as function of COX-1 inhibition, ion-
exchange performance may be compared to the entire dose-response curve and used
as a decision tool to establish treatment objectives. The absolute effluent concentrations
(i.e., µmol/L) from the breakthrough curves for DCF, KTP, NPX, and Odm-NPX were
transformed to COX-1 inhibition using the Hill parameters from the dose-response
curves (Table B-13, Figure B-3). Figure 3-1 shows the simultaneous mass removal
predicted from the HSDM and COX-1 inhibition as a function of treated bed volumes
(BV) of urine. The expected COX-1 inhibition of untreated urine, based on the predicted
pharmaceutical concentrations in urine (Table 3-1), followed a decreasing trend of DCF
(74%) > KTP (51%) > NPX (26%) > Odm-NPX (20%) (Figure 3-1). Using the IC10 (i.e.,
pharmaceutical concentration corresponding to 10% COX-1 inhibition) as the treatment
criteria (i.e., breakthrough), 616 and 209 BV of synthetic urine containing DCF and KTP,
respectively, may be treated before reaching breakthrough. Although DCF was more

71
active than KTP (see IC50 values in Table B-13), the AER had a greater capacity for
DCF compared with KTP so a larger volume of urine may be treated before COX-1
inhibition by DCF is detected in the effluent. This demonstrates that although a
pharmaceutical may not be as active, less effective mass removal may induce greater
ecotoxicity potential. Furthermore, the IC10 breakthrough point corresponded to 96%
DCF mass removal and 89% KTP mass removal suggesting that stringent treatment
objectives (i.e., complete mass removal) may not be necessary to achieve effective
reduction in ecotoxicity potential. Although complete removal (i.e., C/C0 ≈ 0) was
achieved for NPX and Odm-NPX only, COX-1 inhibition was only reduced from 26%
and 20% in untreated urine to 20% and 13%, respectively. This may be attributed to the
dose-response curves which had I0 values of 20% and 13%, respectively, which
suggests that targeting these compounds for removal may not significantly improve
urine quality with respect to COX-1 inhibition. However, the maximum response for NPX
and Odm-NPX did not reach 100% for either compound. When the Hill model was
adjusted to force the minimum and maximum response to 0% and 100%, respectively,
the IC50 was 132 µmol/L and 416 µmol/L for NPX and Odm-NPX, respectively (see
Table B-14 and Figure B-4), which was more consistent with literature (Davies and
Anderson 1997). For the alternate breakthrough curves (Figure B-5), 60 and 550 BV of
urine may be treated before NPX and Odm-NPX reach breakthrough, respectively.
COX-1 Inhibition Mixture Effects
Realistically, NSAIDs are present in urine as a mixture and at varying
concentrations. The generalized concentration addition (GCA) model was used to
predict mixture effects. The benefit of using the GCA model is that individual dose-
response curves may be used to predict mixture response for multiple pharmaceuticals

72
(Howard and Webster 2009). As shown in Figure B-3 and Figure B-5, DCF, KTP, KTP-
gluc, NPX, and Odm-NPX inhibited the COX-1 enzyme to different extents. However,
Ibuprofen, 4-OH diclofenac, and OH-ibuprofen did not inhibit COX-1 enzyme at any
pharmaceutical dose (Figure B-6). For brevity, results and discussion of this paper will
focus on pharmaceuticals that inhibit COX-1 enzyme. The IC50 values for investigated
pharmaceuticals followed the order of increasing magnitude of DCF (0.24 µmol/L) <
KTP (1.30 µmol/L) < Odm-NPX (4.13 µmol/L) < NPX (16.8 µmol/L) < KTP-gluc (73.1
µmol/L) (Table B-13). This trend is consistent with other literature, where IC50 for NPX is
two orders of magnitude greater than DCF and KTP (Cryer and Feldman 1998). The
NPX metabolite, Odm-NPX was more active than the parent compound, based on the
IC50 value.
The Hill parameters for individual COX-1 inhibition curves (Table B-13) were
used to evaluate COX-1 inhibition for a pharmaceutical mixture containing DCF, KTP,
KTP-gluc, NPX, and Odm-NPX (Figure 3-2). The estimated COX-1 inhibition of
untreated urine for the pharmaceutical mixture was 63%. The GCA model adequately
predicted pharmaceutical mixture toxicity, with an R2 of 0.98, although it slightly
overestimated the expected COX-1 inhibition in urine to be 75%. Total excretion for
NSAIDs, including parent compounds and metabolites, range from 50%–100%. As
many as five metabolites may be excreted, however only one metabolite with the
highest excretion was evaluated in this study. For example, only 6.4% of KTP is
excreted in urine unchanged and 52.8% is excreted as the KTP glucuronic acid
conjugate (KTP-gluc) (Table 3-1) (Houghton et al. 1984). However, glucuronic acid
conjugates have been shown to be highly unstable in urine and rapidly hydrolyze back

73
to the parent compound (Upton et al. 1980). This suggests that the concentration of
KTP in urine may be much greater than what was estimated in urine based on
excretion. The expected COX-1 inhibition of KTP-gluc in urine was 2%. However, if
KTP-gluc was completely hydrolyzed back to KTP in ureolyzed urine, the predicted
COX-1 inhibition due to KTP would increase from 51% to 83%, and increase COX-1
inhibition for the pharmaceutical mixture from 75% to 91%. This is demonstrated by the
shift in the GCA model in Figure 3-2.
The influent concentration of NSAIDs at varying concentrations will influence
both fixed-bed performance and expected COX-1 inhibition. Furthermore, the effluent
concentration of each NSAID constantly changes as a function of bed volume until the
resin is fully saturated. The GCA model was used to predict COX-1 inhibition as a
function of bed volume for a pharmaceutical mixture containing DCF, KTP, NPX, and
Odm-NPX (Figure 3-3). Approximately 210 BV of urine may be treated before reaching
breakthrough. Ketoprofen was the greatest contributor to COX-1 inhibition for the
pharmaceutical mixture at breakthrough. Furthermore, if KTP-gluc hydrolyzed back to
KTP, increasing the initial concentration of KTP in urine, breakthrough would decrease
to <25 BV (Figure 3-3). However, a resin with higher capacity for KTP, would allow a
larger volume of urine to be treated before breakthrough. The instability of acyl
glucuronide metabolites provides insight into the practical application of urine source
separation. Pharmaceutical removal under fresh urine conditions may be less effective
at removing acyl glucuronides due to their hydrophilic nature, and the remaining acyl
glucuronides in treated urine may hydrolyze back to the parent compound. This
suggests that pharmaceutical removal may be more effective under ureolyzed urine

74
conditions after acyl glucuronide metabolites hydrolyze back to the parent compound.
Breakthrough of a pharmaceutical mixture may be used to estimate the operation
requirements (e.g., resin volume) and costs to effectively reduce COX-1 inhibition.
Evaluating treatment efficacy in terms of COX-1 inhibition for the pharmaceutical
mixture holistically synthesizes the concurrent relationships between varying
pharmaceutical concentrations in urine, pharmaceutical mixture toxicity, and resin-
pharmaceutical interactions.
Evaluating toxic response of NSAIDs may not be limited to only COX-1 inhibition.
The ToxCast database developed by the EPA evaluated >800 in vitro endpoints for
>2,000 chemicals. For example, DCF and IBP induced a response in 48 and 17
bioassays, respectively, with biological endpoints ranging from cell death, regulation of
gene expression, and receptor binding, to name a few (U.S. EPA 2016c). Figure B-7 is
a graphical depiction of the AC50 (i.e., concentration that induces 50% activity) of the in
vitro bioassays with various endpoints that induce a response from exposure to DCF
and IBP. For DCF, the COX-1 bioassay may be considered a protective assay because
it is more sensitive than other endpoints evaluated. On the other hand, IBP did not
induce COX inhibition, however alternative in vitro bioassays such as the nuclear
receptor assay ATG_ERE_CIS_up may be utilized to evaluate the estrogen response
(U.S. EPA 2016c).
Linking in vitro assays to long term in vivo outcomes is difficult due to the
complex molecular, cellular, and tissue changes from the biological target to adverse
outcomes (Liu et al. 2015). Table B-15 lists the EC50 values for in vivo chronic
ecotoxicity studies from literature. In general, the COX-1 bioassay was more sensitive
75
than the in vivo studies, with the exception of M. galloprovincialis larvae development
when exposed to DCF (Fabbri et al. 2014). This suggests that although the in vitro
bioassay may detect COX-1 inhibition activity, it may not elicit a toxic response in
aquatic life due to repair and defense mechanisms that may prevent toxicity (Escher et
al. 2013). The development of adverse outcomes pathways (AOPs) is a framework that
links molecular-level changes in an organism with adverse outcomes such as survival,
growth, and reproduction (Schroeder et al. 2016). For example, one AOP of
cyclooxygenase inhibition is decreased ovulation and reduced reproductive success
leading to a decline in population (AOPWiki 2016). Efforts to use high-throughput
assays to predict in vivo response is an active area of research. When comparing
estrogenic activity of wastewater using the in vitro yeast estrogen screen assay and in
vivo vitellogenin assay, Huggett et al. (2003) found that the in vivo assay had 10-fold
greater estrogenic activity than the in vitro assay. Furthermore, researchers have
utilized ToxCast, a database containing 1,057 chemicals and >800 in vitro endpoints,
and the Toxicity Reference Database containing in vivo chronic toxicity data to develop
predictive toxicity models including rat reproductive toxicity, hepatotoxicity, estrogenic
activity, and prenatal developmental toxicity (Liu et al. 2015, Martin et al. 2011, Rotroff
et al. 2014, Sipes et al. 2011).
Comparison of Urine Matrices
As shown in Figure B-8, approximately 3.4× more synthetic urine than real urine
may be treated before DCF reaches breakthrough, this suggests that the presence of
endogenous metabolites in real urine may be interfering with DCF ion-exchange.
Equilibrium pharmaceutical removal was conducted in synthetic ureolyzed urine
containing six endogenous metabolites present at the greatest concentrations in urine.

76
This data was compared to previously conducted equilibrium experiments in synthetic
urine in the absence of endogenous metabolites (Landry et al. 2015). Furthermore, an
equilibrium experiment was performed using real ureolyzed human urine spiked with
DCF. As shown in Figure 3-4 and Figure B-9, the presence of endogenous metabolites
in synthetic urine reduced the ion-exchange capacity and removal efficiency. At a resin
dose of 2 mL/L, DCF removal decreased from 89% in synthetic urine without
metabolites to 74% in synthetic urine with metabolites, and further decreased to 32% in
real urine. A similar trend was observed at the 4 mL/L resin dose, however at the 8
mL/L resin dose, diclofenac removal was 95%, 91%, and 97% in synthetic urine with
and without metabolites, and real urine, respectively. A reduction in color and
discoloration of the AER was observed visually with increasing AER dose. It was
hypothesized that endogenous metabolites were competing for ion-exchange sites on
the AER. To confirm this, DCF samples from experiments using synthetic urine with
metabolites and real human urine were analyzed for total organic carbon (TOC) to
estimate endogenous metabolite removal. As shown in Figure 3-5, the mass of TOC
(mg as C) removed from synthetic and real urine increased with increasing resin dose.
Furthermore, the TOC content due to endogenous metabolites was 3,200× and 27,000×
greater than the pharmaceutical content in synthetic and real urine, respectively. The
metabolites present in real urine was 2.7× greater than the concentration (mg C/L) in
synthetic urine (Table B-2). Similar competition was observed for micropollutant
adsorption in the presence of natural organic matter during drinking water treatment,
which is present at much higher concentrations than micropollutants (Worch 2012). Ion-
exchange removal of NSAIDs in urine is due to the electrostatic interactions between

77
the negatively charged functional group of the pharmaceutical and positively charged
quaternary ammonium functional group of the AER, and van der Waals interactions
between the aromatic ring structure between the pharmaceutical and AER (Landry et al.
2015). In addition to being primarily negatively charged or neutral, endogenous
metabolites have an aliphatic or aromatic organic structure (Bouatra et al. 2013). Thus,
it is reasonable to expect that negatively charged endogenous metabolites with an
aromatic ring structure would compete with pharmaceuticals for ion-exchange sites on
the resin due to favorable van de Waals interactions between the metabolites and AER.
However, removal of positively charged pharmaceuticals by a cation exchange resin,
such as citalopram, may experience less competition for ion-exchange sites on the resin
due to unfavorable electrostatic interactions with negatively charged endogenous
metabolites (Solanki and Boyer 2017).
Synthetic urine has been used in several urine source separation studies for
nutrient recovery and pharmaceutical removal. Tarpeh et al. (2017) observed no
significant difference between ammonium adsorption by cliniptilolite zeolite, a
polyacrylic cation exchange resin, or a polystyrene cation exchange resin in synthetic
and real urine. Minimal impact between urine compositions may be because most
endogenous metabolites are negatively charged or neutral in ureolyzed urine, thus lack
the necessary electrostatic interactions for cation exchange removal (Bouatra et al.
2013). Precipitation processes, such as struvite, are driven by supersaturation of the
respective inorganic compounds (e.g., Mg+2, PO4–3, and NH4
+) which is dependent on
their concentration in urine (Udert et al. 2003b). During the nucleation step, organic
compounds can adsorb to the crystals and inhibit further precipitation (Lin et al. 2005,

78
Sindelar et al. 2015). The presence of endogenous metabolites in urine slightly reduced
the amount of struvite precipitated but decreased the rate of precipitation by a factor of
4 (Udert et al. 2003a, Udert et al. 2003b). Conversely, Pronk et al. (2006b) found an
increase in pharmaceutical retention during nanofiltration of real urine compared with
synthetic due to complexation of pharmaceuticals with endogenous metabolites,
changes in surface charge and/or membrane fouling due to endogenous metabolites.
suggests that synthetic urine may or may not be an adequate proxy for evaluating urine
source separation processes. In general, the presence of endogenous metabolites
appears to least impact nitrogen cation exchange and slightly impact struvite
precipitation and pharmaceutical removal by membrane processes. However, favorable
interactions between endogenous metabolites and AER significantly impacts removal of
negatively charged pharmaceuticals.
The competitive effects of organic metabolites on ion-exchange removal of
NSAIDs highlights the need to evaluate alternative sorbents that have higher selectivity
or capacity. The AER used in this study is a commercially available material, however,
sorbent material designed to selectively remove target compounds may improve
pharmaceutical removal in urine. For example, molecularly imprinted polymers (MIPs)
have been used extensively as extraction methods for sample analysis (Beltran et al.
2010), including selective extraction of naproxen in urine (Caro et al. 2004). Studies
have also shown that MIP adsorption may be used to selectively remove >90% of
NSAIDs from surface water (Dai et al. 2012). Alternatively, an adsorbent with much
higher capacity and similar selectivity would increase pharmaceutical removal in the
presence of endogenous metabolites.

79
Concluding Remarks
This study utilized a high-throughput in vitro bioassay to evaluate the treatment
efficacy of ion-exchange resins to remove pharmaceuticals in source separated urine
and reduce ecotoxicity potential. Evaluating breakthrough curves as a function of
toxicity as opposed to mass removal provides a better understanding of treatment
objectives for emerging contaminants, such as pharmaceuticals. For example,
increasing mass removal of naproxen and O-desmethylnaproxen did not necessarily
reduce ecotoxicity potential due to the dose-response behavior. Mass removal of 89%
for KTP and 96% for DCF corresponded with 90% reduction in COX-1 inhibition. This
demonstrates that complete removal (i.e., 0% mass breakthrough) may not be
necessary to achieve an effective reduction in ecotoxicity potential. Furthermore, KTP
was less active than DCF but because the AER had a lower capacity for KTP, it
reached breakthrough (i.e., IC10) sooner than DCF. The generalized concentration
addition model may be used to predict COX-1 inhibition as a function of bed volumes
treated for a pharmaceutical mixture with varying concentrations and mass removal
efficacy. Due to a lack of regulatory framework for pharmaceutical treatment guidelines,
treatment efficacy for emerging contaminants should include toxicity reduction as well
as mass removal. Furthermore, in vitro dose-response curves provide a unique
opportunity to evaluate treatment performance to various pharmaceuticals and toxicity
endpoints. However, linking in vitro bioassays to in vivo effects is a growing research
area. Utilizing kinetic and equilibrium tests to predict fixed-bed breakthrough is a rapid
way to generate data which will provide insights on the process, and compare
pharmaceutical sorption performance under varying conditions. Lastly, human urine
contains a complex mixture of heterogeneous endogenous metabolites that may

80
compete for ion-exchange sites on the resin. More selective or higher capacity resins
may improve the efficacy of using sorption technologies to remove pharmaceuticals
from urine.

81
Table 3-1. Estimated active ingredient (AI) and metabolite concentrations in urine and fraction excreted in urine.
Compound Concentration in urine, µg/L (µmol/L) Fraction of dose excreted in urine
Diclofenac 174 (0.547)a 0.06 b
4’-OH-diclofenac 456 (1.46) 0.16 b
Ibuprofen 2,409 (10.6)a 0.07 c
Hydroxy ibuprofen 5,697 (25.6) 0.17 c
Ketoprofen 342 (1.35)a 0.064 d Ketoprofen acyl glucuronide 4,777 (11.1) 0.528 d
Naproxen 758 (3.01)a 0.013 e
O-Desmethylnaproxen 300 (1.39) 0.006 e
a Average concentration from Table B-3 b Sawchuk et al. (1995) c Lienert et al. (2007b) d Houghton et al. (1984) e Sugawara et al. (1978)

82
Figure 3-1. Predicted column breakthrough curves as a function of mass removal and
COX-1 inhibition for (a) diclofenac (C0 = 0.55 µmol/L), (b) ketoprofen (C0 = 1.3 µmol/L), (c) naproxen (C0 = 3.0 µmol/L), and (d) O-desmethylnaproxen (C0 = 1.4 µmol/L).
0%
20%
40%
60%
80%
100%
0 1000 2000 3000 4000Bed Volume
(a)
C/C0×100%
% Inhibition
0%
20%
40%
60%
80%
100%
0 200 400 600 800 1000
Bed Volume
(b)
C/C0×100%% Inhibition
0%
20%
40%
60%
80%
100%
0 200 400 600 800 1000Bed Volume
(c)
C/C0×100%
% Inhibition
0%
20%
40%
60%
80%
100%
0 1000 2000 3000Bed Volume
(d)
C/C0×100%
% Inhibition

83
Figure 3-2. Cyclooxygenase subtype-1 inhibition curve for a pharmaceutical mixture containing diclofenac, ketoprofen, ketoprofen glucuronide, naproxen, and o-desmethylnaproxen. The dashed line represents the GCA model for the pharmaceutical mixture, and the dotted line represents the GCA model for the pharmaceutical mixture assuming ketoprofen glucuronide completely hydrolyzed back to the parent compound. The symbols are the mean triplicate samples with error bars showing one standard deviation.
-20%
0%
20%
40%
60%
80%
100%
% C
OX
-1 Inhib
itio
n
Concentration, µmol/L
MixHillGCAGCA, KTP-gluc hydrolyzed
10–2 100 102 104

84
Figure 3-3. Predicted column breakthrough curves as a function of mass removal and
COX-1 inhibition for a pharmaceutical mixture containing (a) diclofenac (C0 = 0.55 µmol/L), ketoprofen (C0 = 1.3 µmol/L), naproxen (C0 = 3.0 µmol/L), and O-desmethylnaproxen (C0 = 1.4 µmol/L), and (b) diclofenac (C0 = 0.55 µmol/L), ketoprofen (C0 = 12.4 µmol/L), naproxen (C0 = 3.0 µmol/L), and O-desmethylnaproxen (C0 = 1.4 µmol/L). In figure (b), ketoprofen glucuronide was assumed to be hydrolyzed back to ketoprofen. The mass removal curve is a summation of the molar mass removal normalized by the total concentration.
0%
20%
40%
60%
80%
100%
0 1000 2000 3000
Bed Volumes
(a)
% Inhibition
C/C0×100%
0%
20%
40%
60%
80%
100%
0 1000 2000 3000
Bed Volumes
(b)
% Inhibition
C/C0×100%

85
Figure 3-4. Ion-exchange removal in real urine and synthetic urine with and without
metabolites of (a) diclofenac, (b) ibuprofen, (c) ketoprofen, and (d) naproxen. Data without metabolites reproduced from Landry et al. (2015). The symbols are the mean triplicate samples with error bars showing one standard deviation.
0
0.2
0.4
0.6
0.8
1
0 2 4 6 8 10
C/C
0
Resin dose, mL/L
(a) No metabolites, C0 = 3.0 µMMetabolites, C0 = 2.2 µMReal urine, C0 = 0.71 µM
0
0.2
0.4
0.6
0.8
1
0 2 4 6 8 10
C/C
0
Resin dose, mL/L
(b) No metabolites, C0 = 3.6 µMMetabolites, C0 = 3.2 µM
0
0.2
0.4
0.6
0.8
1
0 2 4 6 8 10
C/C
0
Resin dose, mL/L
(c) No metabolites, C0 = 7.8 µM
Metabolites, C0 = 3.0 µM
0
0.2
0.4
0.6
0.8
1
0 2 4 6 8 10
C/C
0
Resin dose, mL/L
(d) No metabolites, C0 = 7.5 µMMetabolites, C0 = 3.7 µM

86
Figure 3-5. Mass of endogenous metabolites (TOC) removed (mg C) during equilibrium experiments for synthetic urine with metabolites and real urine. The sample volume was 125 mL. The bars are the mean triplicate samples with error bars showing one standard deviation.
87
CHAPTER 4
LIFE CYCLE ASSESSMENT AND COSTING OF URINE SOURCE SEPARATION: FOCUS ON NONSTEROIDAL ANTI-INFLAMMATORY DRUG REMOVAL‡
Application of Life Cycle Assessment for Pharmaceutical Treatment
Approximately 64% of ingested pharmaceuticals intended for human use are
excreted in urine as the parent compound or metabolites (Lienert et al. 2007a). Human
urine is the primary contributor of pharmaceuticals in municipal wastewater but only
constitutes 1% of the total volumetric flow (Joss et al. 2005, Larsen and Gujer 1996a).
Urine source separation has been proposed as a more efficient method to remove
and/or destroy pharmaceuticals as opposed to centralized biological wastewater
treatment because pharmaceuticals are present at much higher concentrations in
undiluted urine (Lamichhane and Babcock 2012). In addition, human urine contributes
80% of the nitrogen (N) and 50% of the phosphorus (P), indicating separate treatment
of urine may have significant impacts on centralized wastewater treatment (Larsen and
Gujer 1996a). Furthermore, human urine may be utilized as an alternative fertilizer
source because N and P are essential nutrients used in agriculture (Kirchmann and
Pettersson 1995). Therefore, effective separation of pharmaceuticals from nutrients is
necessary to obtain a “contaminant free” nutrient product. From previous research,
sorption processes are an effective method to selectively remove nonsteroidal anti-
inflammatory drugs (NSAIDs) from urine with minimal co-sorption of nutrients, and may
be effectively regenerated using a 5% sodium chloride, 50% methanol solution (Landry
‡ Reproduced with permission from Landry, K.H., Boyer, T.H. 2016. Life cycle assessment and costing of urine source separation: Focus on nonsteroidal anti-inflammatory drug removal. Water Research 105,
487–495, DOI: http://dx.doi.org/10.1016/j.watres.2016.09.024. Copyright 2016 Elsevier Ltd.
88
and Boyer 2013, Landry et al. 2015). Furthermore, sorption is attractive for
pharmaceutical removal because it is low energy and has different treatment
configurations such as fixed-bed or mixed reactors, continuous flow or batch, and
sorbent regeneration or disposal (Crittenden et al. 2012). The basis of this research is
that removing pharmaceuticals from undiluted urine would be more effective and
efficient than in centralized wastewater, particularly for pharmaceuticals primarily
excreted in urine (Lienert et al. 2007a, Winker et al. 2008a), however, the environmental
impacts of using sorption processes to remove pharmaceuticals in urine is unknown.
Life cycle assessment (LCA) applied to urine source separation is an emerging
research area with only one study considering removal of pharmaceuticals. The primary
focus of several papers included the source separation system (i.e., urine piping,
collection, and storage), fertilizer offsets, wastewater treatment offsets, and potable
water offsets (Ishii and Boyer 2015, Lam et al. 2015, Maurer et al. 2003, Remy 2010).
Remy (2010) conducted an LCA that included an ozonation process for pharmaceutical
destruction in source separated urine, however they did not evaluate the specific toxicity
of pharmaceuticals in the model. Previous LCA studies have evaluated the
environmental impacts of pharmaceuticals in wastewater effluent. A study by Muñoz et
al. (2008) concluded that pharmaceuticals were a significant contributor to the toxicity of
the studied wastewater. Conversely, it was found that pharmaceuticals in decentralized
hospital wastewater exhibited negligible environmental impact compared with the
impacts generated by wastewater treatment (Igos et al. 2013, Igos et al. 2012).
Advanced treatment of decentralized hospital wastewater would not decrease
pharmaceutical toxicity in total wastewater effluent because the contribution of

89
pharmaceuticals from hospital wastewater was much smaller than other sources (e.g.,
pharmaceutical usage at homes, office buildings, etc.) (Igos et al. 2012). Ort et al.
(2010) estimated that hospital wastewater contributed 15% of pharmaceuticals to
centralized wastewater. This suggests that an alternative approach to treating municipal
wastewater at the community-level, such as urine source separation, could be more
effective at reducing pharmaceutical loading to the environment. To date, there is not a
published LCA study on urine source separation considering removal of
pharmaceuticals by sorption process and corresponding reduction in toxicity. The goal
of this research was to compare the overall environmental and economic impacts of
pharmaceutical removal from urine generated in a university community by centralized
wastewater treatment, advanced treatment of centralized wastewater, and centralized
and decentralized treatment of source separated urine. The pharmaceuticals
investigated in this study were from the NSAID pharmaceutical class and included
diclofenac (DCF), ibuprofen (IBP), ketoprofen (KTP), and naproxen (NPX). They were
selected because of high ecotoxicity potential, prevalence, and variable removal rates in
biological wastewater treatment (Hernando et al. 2006, Lienert et al. 2007b, Verlicchi et
al. 2012). For the reasons given above, NSAIDs have been the focus of ion-exchange
removal studies in urine. This study utilizes lab-scale experimental data to build a robust
framework and conduct a baseline assessment that may be augmented with new
pharmaceutical adsorption data as it becomes available.
Life Cycle Model
Scope of the Study
The functional unit for this study was the conveyance, storage, pharmaceutical
management (i.e., ion-exchange treatment), and nutrient management (i.e., struvite

90
precipitation) of 11,184 m3 of urine, which is equivalent to the estimated annual
production of urine at the University of Florida (UF) campus in Gainesville, Florida, USA.
This study builds upon the LCA model developed by Ishii and Boyer (2015) by
expanding the system boundary from residence halls to include the entire UF campus,
and pharmaceutical management. Detailed calculations used to determine the
functional unit are provided in Appendix C.
Figure 4-1 shows the wastewater management scenarios considered in this LCA.
Scenario AWWT serves as the baseline scenario and included combined collection of
urine, feces, and greywater, and biological treatment at the UF Water Reclamation
Facility. The upstream system boundary includes operational inputs for potable flush
water production at the nearby drinking water treatment facility. The construction and
decommission phase of the wastewater treatment plant was not included in this
assessment because they were assumed to be equal across all scenarios, thus
negating the contributions of these phases to the environmental assessment. Scenario
BWWT,O3 is a hypothetical scenario which included combined collection of urine, feces,
and greywater, and biological treatment at the UF Water Reclamation Facility upgraded
with an ozonation process for pharmaceutical destruction (Ternes et al. 2003). The
construction phase for the ozone contactor and operational phase of the ozone process
were included in this assessment. Decommission of the ozone system was not taken
into consideration. It was assumed that no nutrients were recovered for reuse as
fertilizer in AWWT and BWWT,O3. Land application of biosolids was excluded from the
system boundary because the local utility ceased land application and currently
disposes of biosolids in a landfill. Furthermore, the effect that urine source separation

91
has on the composition of biosolids at the centralized wastewater treatment plant is
unknown. Modeling the composition of biosolids at the wastewater treatment plant after
urine source separation was considered outside the scope of this model.
Scenarios C–H were the hypothetical urine source separation scenarios. The
system boundary includes the processes related to potable water production, urine
source separation, and treatment (i.e., storage disinfection, pharmaceutical removal by
ion-exchange, and struvite precipitation), centralized wastewater treatment, and
wastewater discharge to surface water and landscape irrigation. For scenarios
Ctruck,landfill and Dtruck,regen, urine was collected by a vacuum truck and transported to
a central location for processing. In scenarios Esewer,landfill and Fsewer,regen, urine was
conveyed by vacuum sewer to a central location for processing. In scenarios
Gdecen,landfill and Hdecen,regen, urine was collected and processed at the building level
for decentralized treatment. For scenarios Ctruck,landfill, Esewer,landfill, and Gdecen,landfill, it
was assumed spent anion exchange resin (AER) was transported and disposed of in a
landfill. For scenarios Dtruck,regen, Fsewer,regen, and Hdecen,regen, it was assumed spent
AER was regenerated using 5% NaCl, 50% methanol, and the brine was transported
and incinerated at a cement kiln plant for energy recovery. The system boundaries do
not include redistribution of struvite to agriculture. It was assumed that struvite fertilizer
would replace commercial fertilizers used in AWWT and BWWT,O3and that struvite
fertilizer granules were comparable to commercial fertilizers, allowing the use of
commercial fertilizer spreading equipment (Forrest et al. 2008). Furthermore, the
ammonia, nitrous oxide, and phosphate emissions for struvite and commercial fertilizer

92
(i.e., monoammonium phosphate (MAP)) were assumed to be equivalent due to
identical emission factors and nutrient content (Nemecek and Kägi 2007). However, the
cadmium content of struvite and commercial fertilizers were considered an emission to
land (i.e., 0.39 mg Cd/kg P2O5 in struvite and 97.5 mg Cd/kgP2O5 in MAP) (Lugon-
Moulin et al. 2006, Ronteltap et al. 2007). Infrastructure for the urine source separation
system (e.g., vacuum sewer, urine piping, and ion-exchange system) and operation
(e.g., road transport, energy and chemical requirements) were included within the
system boundary. Decommission of the urine diversion and treatment system was not
taken into consideration.
Life Cycle Inventory
The data sources and design parameters used to develop foreground processes
for each treatment scenario are provided in detail in Appendix C. The life cycle inventory
included potable flush water production, centralized wastewater treatment, ozonation of
wastewater, urine source separation infrastructure, urine collection by vacuum truck or
vacuum sewer, ion-exchange infrastructure and treatment, struvite precipitation for
nutrient recovery, and estimated pharmaceutical concentrations in urine. Background
inventory data for each scenario were designed using existing components in two
databases, the Ecoinvent unit processes (version 2.2) and the U.S. Life Cycle Inventory
Database (USLCI) (Ecoinvent Centre 2015, NREL 2012). Data from the Ecoinvent
database is based on either European, Swiss, or North American technologies
published between 2007–2009. Data from the USLCI database is based on North
American technologies or processes published between 2003–2008. European based
data was adopted without any modification for this study.

93
Life Cycle Costing
The economic analysis included infrastructure and operational costs for
pharmaceutical removal in urine by the alternative treatment scenarios. Net present
value (NPV) was estimated using an interest rate of 3% (National Center for
Environmental Economics 2010). The sources and assumptions underlying all cost
estimates are given in the relevant life cycle inventory sections in Appendix C and are
listed in Table C-9. All infrastructure costs were updated to 2016 based on inflation.
Labor costs were excluded in the cost analysis.
Life Cycle Impact Assessment
The LCA model for all scenarios was constructed using SimaPro 8.0.3.14
software (PRé Consultants 2014). The TRACI impact assessment method was used to
evaluate the contributions of processes, generated, and avoided impacts to ten midpoint
impact categories (U.S. EPA 2014). This method was selected because the study
pertains to wastewater treatment in a U.S. community and TRACI was developed by the
U.S. Environmental Protection Agency. The ten midpoint impact categories (e.g., ozone
depletion, global warming, smog, etc.) were evaluated with respect to a reference unit
(e.g., kg CFC-11 eq, kg CO2 eq, kg O3 eq, etc.) and normalized to obtain a single impact
score, expressed in Person-Equivalent (PE). Normalization is a conversion step that
compares the magnitude of impacts relative to a common reference. For TRACI 2.1,
results were normalized to the average annual impact of a U.S. citizen using 2008 as
the reference year (Ryberg et al. 2014).
The UNEP-SETAC toxicity model USEtox is the basis for the TRACI impact
categories for human health non-carcinogenic, and ecotoxicity and are expressed in
comparative toxic units (U.S. EPA 2014). Non-carcinogenic human toxicity (CTUh) is

94
characterized by the estimated morbidity increase in the total population per unit mass
of emitted chemical (disease cases/kg) and ecotoxicity (CTUe) is an estimate of the
potentially affected fraction of species over time and volume per unit mass of chemical
emitted (PAF·m3·day/kg). Characterization factors for DCF, IBP, and NPX were
obtained from literature (Alfonsín et al. 2014). The USEtox model was used to
determine an ecotoxicity characterization factor for KTP using the model’s substance
database and ecotoxicity data from literature (Andersson et al. 2007, Hauschild et al.
2015, Morais 2014). A characterization factor for human toxicity was not determined for
KTP due to a lack of data. The characterization factors are listed in Table C-10.
Sensitivity and Uncertainty Analysis
The uncertainty of input parameters on the impact assessment results for each
scenario was evaluated using the integrated Monte Carlo module in SimaPro. In each
Monte Carlo analysis, 3000 iterations were conducted. Table C-11 lists all of the input
parameters, range of variation, justification and assumed distribution considered in the
uncertainty analyses. Variability of unit costs were also included to evaluate the
uncertainty of assumed input operational costs (Table C-12). Cost variability of
magnesium oxide and liquid oxygen were excluded due to a lack of data. Infrastructure
costs were assumed to remain constant. Additional sensitivity analyses were conducted
to evaluate the effect of assumed model inputs (Table C-11) and unit costs (Table C-12)
on the environmental impacts for each scenario. The sensitivity analysis was conducted
by varying each parameter individually between the minimum and maximum values. A
parameter was considered sensitive if results varied from the baseline ±10%.

95
Results and discussion
Overall Comparison of Scenarios
Figure 4-2 provides a comparison of the environmental impacts of the treatment
scenarios, subdivided into the contributing processes (e.g., potable water, WWTP
electricity, urine transport, etc.), generated impacts (e.g., nutrient and pharmaceutical
emissions), and avoided impacts (e.g., fertilizer offsets). Alternatively, Figure C-5 shows
the same total impact score of each scenario subdivided into the contributing mid-point
impact categories. Together, these two figures provide a holistic view of the major
contributing processes and impact categories to the total environmental impact. Non-
normalized results for individual TRACI impact categories, excluding ecotoxicity and
non-carcinogenic impacts are provided in Figures B-6–B-13).
The order of decreasing total environmental impact was BWWT,O3 > AWWT >
Esewer,landfill > Fsewer,regen > Ctruck,landfill > Gdecen,landfill > Dtruck,regen > Hdecen,regen. The
trend suggests that centralized wastewater treatment had greater environmental
impacts than the source separation scenarios, primarily due to the potable water
requirements for flushing, electricity for wastewater treatment, and nutrient emissions.
Furthermore, struvite precipitation of source separated urine reduces nutrient
emissions, offsets commercial fertilizer production, and reduces cadmium emissions
due to commercial fertilizers. These results are similar to other LCA studies that found
that potable water savings, electricity savings, reduction in nutrient loading, and reduced
cadmium emissions from commercial fertilizers in the environment are major benefits
gained from urine source separation (Berndtsson 2006, Ishii and Boyer 2015, Lam et al.
2015, Lamichhane and Babcock 2012, Ronteltap et al. 2007). Results of the Monte

96
Carlo simulation indicate that uncertainty does not affect the overall trends for the total
environmental impact, where AWWT and BWWT,O3 have greater observed environmental
impact compared with the urine source separation and the vacuum sewer scenarios had
the largest impact among the source separation scenarios. However, there was
uncertainty between scenarios Ctruck,landfill, Dtruck,regen, Gdecen,landfill, and Hdecen,regen at
the 97.5% confidence interval suggesting that the difference in environmental impact of
urine collection by vacuum truck or decentralized treatment is not significant. However,
the total environmental impact for the resin disposal scenarios was less than the
scenarios where resin was disposed of in a landfill (e.g., Ctruck,landfill > Dtruck,regen). Within
impact categories, AWWT and BWWT,O3 maintained the greatest impact for all categories
except ozone depletion. However, some uncertainty was observed within impact
categories for the source separation scenarios, with the exception of the eutrophication
impact category.
Replacing conventional fixtures with urine diverting flush toilets and waterless
urinals would conserve 2.6×10⁵ m3 of potable flush water and $231,000 annual potable
water savings. The implications of potable water savings would be of particular
importance in areas that face water scarcity and quality issues (Ishii and Boyer 2015).
Accounting for the reduction in potable flush water, influent flow at the wastewater
treatment plant would decrease by 17%. This reduction in influent flow could reduce the
electricity requirements for wastewater treatment. A limitation of this study is that
quantifying electricity use at the plant simplifies the impact urine source separation can
have on centralized wastewater treatment. Jimenez et al. (2015) found that urine source
separation can reduce influent N and P loading and potentially eliminate the need for
97
nitrification, reduce sludge age, and reduce chemical requirements for chemical P
removal.
Table 4-1 provides a summary of the estimated economic impacts associated
with infrastructure, energy, potable flush water, chemicals, and urine-based fertilizer
revenue for each treatment scenario. The NPV and EAC of scenarios Ctruck,landfill,
Dtruck,regen, Gdecen,landfill, and Hdecen,regen vary from AWWT by only ±2–13%. These
scenarios could be considered comparable to AWWT due to the preliminary nature and
uncertainty of the economic evaluation. However, the economic costs of BWWT,O3,
Esewer,landfill, and Fsewer,regen was 21–45% greater than AWWT. Due to the uncertainty of
the input parameters and unit costs, Monte Carlo analysis show that the cost of each
scenario increases and decreases at the 2.5 % confidence interval (CI) and 97.5% CI,
respectively. Compared across scenarios, cost savings for urine source separation may
be even greater (i.e., 48%–69% less than AWWT) at the 2.5% confidence interval (CI).
However, at the 97.5% CI, observed trends were the same as the baseline values. This
suggests that scenarios Ctruck,landfill, Dtruck,regen, Gdececn,landfill, and Hdecen,regen have lower
environmental impact and similar or lower economic cost compared to AWWT. This result
is similar to Ishii and Boyer (2015) which concluded that urine source separation and
struvite precipitation for maximum P recovery had significantly lower environmental
impact but negligible cost differences, compared with centralized wastewater treatment.
This suggests that the cost of additional pharmaceutical treatment of source separated
urine would not limit implementation.
98
Urine Source Separation
The urine source separation scenarios had a lower impact for all impact
categories compared with AWWT and BWWT,O3, with the exception of the ozone depletion
impact category (Figure 4-2). Anion exchange resin is the major contributing process to
the ozone depletion impact category because of the trichloromethane solvent used to
add quaternary amine functional groups to the polymer backbone for a type I AER
(Figure C-6) (Althaus et al. 2007). This result differs from Choe et al. (2013) who found
that ion-exchange resins dominate all impact categories except for ozone depletion,
however ion-exchange resin was modeled as a general polystyrene and did not include
the additional functionalization step in resin manufacturing. Eutrophication is the
greatest contributor to the total environmental impact in the source separation
scenarios, which is primarily due to the N remaining in urine after struvite precipitation
for P recovery (Figure C-5 and Figure C-10). However, Ishii and Boyer (2015) found that
struvite precipitation for maximum P and N recovery had a greater environmental impact
than struvite precipitation for maximum P recovery due to the chemical inputs. This
suggests that alternative N removal or recovery technologies should be explored.
Alternatively, direct application of stored liquid urine could serve as a complete nutrient
source (Kirchmann and Pettersson 1995), with the added benefit of reducing both N and
P loading at the wastewater treatment plant and subsequent receiving waters. Coupled
with the fact that MgO and struvite storage requirements had the second greatest
environmental impact in Ctruck,landfill, Dtruck,regen, Gdececn,landfill, and Hdecen,regen, application
of liquid urine may reduce the total environmental impact. However, the social
implications of applying liquid urine compared to a urine-derived solid fertilizer should be

99
considered. In general, user acceptance surveys found that >79% of respondents
approved of urine source separation technology in residence halls, public buildings, or
workplaces (Ishii and Boyer 2016, Lienert and Larsen 2010), and 85% approved of
urine-derived fertilizers (Lienert and Larsen 2010). However, only 50% of farmers
regarded urine fertilizer as a good idea primarily due to fear of liability (Lienert and
Larsen 2010). Farmers in Switzerland preferred a grainy and odorless ammonium
nitrate fertilizer, but they were willing to use odorous urine fertilizer in fields (Lienert et
al. 2003). This suggests that a mineral fertilizer (e.g., struvite) may be more appropriate
for application in urban areas compared with liquid urine, which could be applied in rural
and agricultural settings.
Scenarios Esewer,landfill and Fsewer,regen have the largest environmental impact
among the source separation scenarios due to the vacuum sewer infrastructure and
operation. This indicates that the method of urine collection and handling (e.g., vacuum
sewer vs. vacuum truck vs. decentralized treatment) is a critical consideration during the
design phase. The material and process inputs for the vacuum sewer system is largely
dependent on the geographical size of the collection area. Conversely, the process
inputs for collection by vacuum truck is dependent on both distance traveled (size of
collection area) and volume of urine produced. As shown in Figure C-15, the total
normalized impact of the vacuum sewer exceeds vacuum truck collection when plotted
as a function of total pipe length of the sewer system or distance traveled (km). This
suggests that a vacuum sewer system would have a greater environmental impact than
vacuum truck collection, regardless of the size of the collection area. Overall,
centralized urine treatment collected by vacuum truck and decentralized urine treatment

100
had the lowest environmental impact. However, the feasibility of implementing multiple
decentralized systems on a large scale must be considered. Facilities and maintenance
staff maintain all building services and operations (e.g., janitorial and maintenance) on
campus. It is expected that maintenance staff would maintain the ion-exchange system
and struvite precipitation operations. This would be a significant new task for
maintenance staff to undertake and would likely require hiring personnel to handle these
tasks or subcontracting to a private firm. The labor requirements and additional costs
were not included in this model but could be considered in future work (Ramos et al.
2014). With respect to other types of communities, decentralized treatment may be
more appropriate in rural areas. For example, Wood et al. (2015) found that urine
diversion coupled with conventional septic systems for greywater management
exhibited the lowest economic cost and highest cost effectiveness for N mitigation for
rural households.
The scenarios where spent resin was disposed of in a landfill had a slightly
greater environmental impact than the scenarios where resin was regenerated and the
waste regeneration solution (i.e., 5% NaCl, 50% methanol) was incinerated at a cement
kiln plant. Although the production of methanol, salt, and potable water used for
regeneration generates environmental impact, greater environmental offsets were
achieved from incinerating the methanol-containing brine for energy recovery as
opposed to fossil fuels used at the cement kiln plant (Figure C-14). A limitation of the
Ecosolvent model used to generate the life cycle inventory for brine incineration is that it
represents Swiss technology, however plants may vary according to the kiln and flue
gas treatment technology (Seyler et al. 2005). Furthermore, the fuel mix assumed in the
101
Ecosolvent model is different compared to the U.S. cement kiln industry (Hanle 2004).
Choe et al. (2013) and Maul et al. (2014) found that salt requirements for the ion-
exchange was the major contributor to the environmental impact of an ion-exchange
process. This indicates that improving the sustainability of ion-exchange regeneration
(e.g., brine incineration for energy recovery or brine recycling) can make regeneration
more favorable than disposing of resin in a landfill. The potential benefits from
incinerating the regeneration brine are two-fold: environmental offsets due to reduced
fossil fuel consumption and ultimate destruction of the pharmaceuticals to prevent
release to the environment. An additional driver for resin regeneration and brine
incineration, as opposed to landfill disposal, is the potential for pharmaceuticals to end
up in landfill leachate (Lu et al. in press). However, occurrence of pharmaceuticals in
landfill leachate was not included within the LCA framework. Alternatively, a semi-
closed loop system may be developed by destroying pharmaceuticals in the
regeneration brine by advanced oxidation processes to allow brine recycling (Zhang et
al. 2015).
Pharmaceutical Toxicity
Figure 4-3a shows the TRACI impact results for ecotoxicity (CTUe) subdivided
into the contributing processes, generated impacts, and avoided impact, and Figure 4-
3b shows the ecotoxicity impact only due to pharmaceutical emissions in wastewater
effluent discharged to surface water and reclaimed water. A similar figure for non-
carcinogenic human toxicity (CTUh) is given in Figure C-16. For brevity, this discussion
focuses on ecotoxicity because the same general trends were observed for human
toxicity. Overall, the order of decreasing total ecotoxicity was BWWT,O3 > AWWT >

102
Esewer,landfill > Fsewer,regen > Ctruck,landfill > Gdecen,landfill > Dtruck,regen > Hdecen,regen (Figure 4-
3a). Ecotoxicity due to pharmaceutical emissions followed a decreasing trend of AWWT >
Ctruck,landfill = Dtruck,regen = Esewer,landfill = Fsewer,regen = Gdecen,landfill = Hdecen,regen >
BWWT,O3 (Figure 4-3b).
As expected, AWWT had the greatest ecotoxicity due to pharmaceutical emissions
because biological treatment only achieves 28–87% pharmaceutical removal and can
vary for individual pharmaceuticals (Fernandez-Fontaina et al. 2012, Hollender et al.
2009, Joss et al. 2005, Lindqvist et al. 2005, Rivera-Utrilla et al. 2013, Rosal et al. 2010,
Salgado et al. 2012, Ternes 1998). The fate of pharmaceuticals in raw wastewater is
removal by adsorption to sludge and/or biotransformation, or discharged in the effluent
(Cook et al. 2012). Furthermore, biological wastewater treatment does not maintain
consistent treatment efficiencies as observed by negative mass balances in wastewater
effluent (Blair et al. 2015). Although biosolids disposal was not included within the
framework of the LCA, land application of biosolids is a common emission source for
pharmaceuticals in wastewater treatment. It was estimated that 210–250 tonnes/year of
72 pharmaceuticals and personal care products are land applied to U.S. soils from
biosolids recycling, nationwide (McClellan and Halden 2010). The pharmaceuticals
investigated in this study, on average, were estimated to be removed 5–7% by sludge
adsorption based on their sludge adsorption coefficient (Kd) (Alvarino et al. 2014, Blair
et al. 2015, Carballa et al. 2008, Jelic et al. 2011, Jones et al. 2002, Joss et al. 2005,
Radjenović et al. 2009, Sipma et al. 2010). High variability of overall removal suggests
that biological wastewater treatment cannot consistently achieve effective removal of
pharmaceuticals.
103
Scenario BWWT,O3 had the lowest pharmaceutical ecotoxicity due to high
pharmaceutical destruction (53–98%) (Hollender et al. 2009, Margot et al. 2013, Rosal
et al. 2010, Ternes et al. 2003), however it exhibits the greatest total ecotoxicity due to
the additional ozone process (e.g., ozone contactor infrastructure, electricity, liquid
oxygen, water, and transport requirements). One of the limitations of this model is that
only the ecotoxicity of the parent compound is considered and reduction in ecotoxicity is
directly related to its removal. However, ecotoxicity studies have shown that more toxic
byproducts may be formed after ozonated wastewater compared to the pre-ozonated
water and would require an extended contact time, or an additional treatment step such
as sand filtration or activated carbon, to remove the oxidation byproduct (Magdeburg et
al. 2012, Sánchez-Polo et al. 2008, Stalter et al. 2010).
For the urine source separation scenarios, the total ecotoxicity impact is 90%
less than AWWT and BWWT,O3, primarily due to the reduction in potable water use and
electricity at the wastewater treatment plant (Figure 4-3a). Indirect toxicity of producing
auxiliary materials and energy for potable water production and electricity use at the
wastewater treatment plant is originated by several substances emitted to water during
electricity production and lime sludge disposal (for potable water production only). As
shown in Figure 4-3b, the toxicity due to pharmaceutical emissions is the same for all
urine source separation scenarios because equivalent pharmaceutical removal was
achieved by ion-exchange. In general, pharmaceutical ecotoxicity followed a decreasing
order of IBP > DCF > KTP > NPX. The fact that DCF removal was highest in these
treatment scenarios (98% removal) but remains the second most toxic pharmaceutical
highlights the importance of evaluating the reduction in toxicity of each pharmaceutical

104
as opposed to the average mass removal. Considering the majority of pharmaceuticals
in centralized wastewater come from human urine, separation and treatment of this
unique waste stream may be the most effective pharmaceutical management strategy.
An expressed limitation of LCA regarding toxicity include not being able to accurately
evaluate mixture toxicity (Muñoz et al. 2009). Toxicity studies have observed
antagonistic or synergistic toxicity effects in pharmaceutical mixtures (Pomati et al.
2008). However, a recent study by Watanabe et al. (2016) found that concentration
addition and independent action are accurate at predicting chronic mixture toxicity of
pharmaceuticals at environmentally relevant concentrations. In addition, LCA does not
evaluate endocrine disruption potential due to limited information and lack of an
epidemiological framework (Finkbeiner et al. 2014). Another limitation of this model is
that the pharmaceuticals evaluated in this study (i.e., non-steroidal anti-inflammatory
drugs) are not comprehensive of all pharmaceutical compounds with respect to toxicity
and removal efficiency.
Model Sensitivity
Object 4-1 is an Excel spreadsheet that shows the results of the sensitivity
analysis as a percent change in each urine treatment scenario’s impact within an impact
category, total impact, and total cost, relative to the baseline assumption; impact
changes within varying ranges (i.e., 10–19%, 20–49%, and ≥50%) are highlighted in
color. Overall, the most sensitive assumptions to the model were pharmaceutical
concentrations in urine, TN and TP in urine, WWTP energy, storage time, and resin
capacity. Similar to Ishii and Boyer (2015), the various impact categories within the
treatment scenarios were sensitive to the assumed concentration of P in urine, the
assumption for electricity use at the wastewater treatment plant, and storage time. In

105
general, AWWT and BWWT,O3 maintained the greatest total impact throughout the entire
sensitivity analysis. Although the model was sensitive to the assumed WWTP energy
requirements, and TN and TP concentrations in urine, the observed trend for total
environmental impact for the scenarios remained the same.
The source separation scenarios were sensitive to the assumed pharmaceutical
concentrations in urine for three out of ten impact categories (i.e., ozone depletion,
acidification, and respiratory effects). A decrease or increase in impact was observed
when pharmaceutical concentrations were minimized or maximized, respectively. This
was attributed to the decrease or increase in resin and chemical requirements (i.e.,
NaCl and methanol for regeneration), and size of the ion-exchange vessel. An inverse
relationship (e.g., a decrease in impact when pharmaceutical concentrations were
maximized) was observed for Dtruck,regen, Fsewer,regen, and Hdecen,regen. This was due to
the greater methanol requirements for regeneration and subsequent fossil fuel offsets
due to brine incineration at the cement kiln plant. Uncertainty regarding the estimated
pharmaceutical concentrations in urine may be improved with increased sampling
campaigns, improved understanding of pharmaceutical consumption, and modeling
procedures. A model developed by Winker et al. (2008b) to predict pharmaceutical
concentrations in urine had a strong correlation but only accounted for prescribed
pharmaceuticals, however a significant amount of pharmaceuticals may be purchased
over-the-counter. Furthermore, there is a lack of data regarding the amount of over-the-
counter pharmaceuticals actually consumed. A similar trend was observed when the
column was sized to achieve maximum IBP removal compared to the baseline, which
was sized to achieve maximum DCF removal. Due to the low capacity of the AER for

106
IBP compared to DCF resin, chemical requirements and corresponding fossil fuel
offsets from brine incineration increased, resulting in a decrease in impact for the
regeneration scenarios, increase in impact for the landfill scenarios, and an increase in
total cost.
The results of the economic sensitivity analysis are shown in the second tab of
Object 4-1. The second table in Object 4-1 shows the percent change from the baseline
NPV values for each scenario, respectively. The third table in Object 4-1 shows the
percent difference in NPV compared with Scenario A. The cost of urine diverting flush
toilets and waterless urinals was the most sensitive cost for the urine source separation
scenario and also the largest single economic cost. Urine-diverting flush toilets are not
widely used compared with conventional toilets. Considering the material inputs of these
fixtures do not differ from conventional toilets, it is reasonable to expect that increasing
demand would decrease market price. If market value of these fixtures cost the same as
conventional fixtures, urine source separation would cost 18–54% less than AWWT. Total
cost was also sensitive to utility rates for potable water and electricity, particularly for
AWWT and BWWT,O3. For example, when the cost of potable water was minimized, the
cost of urine source separation was 24–75% greater than AWWT. However, when the
cost was maximized, urine source separation cost 63–74% less than AWWT. This
suggests that potable water savings may be a driver for or against implementation of
urine source separation, depending on the community. The cost of electricity also varied
between communities. In communities with a high cost of electricity, implementation of
urine source separation may result in appreciable cost savings compared to AWWT.
Finally, the total cost was sensitive to the assumed interest rate. In general, as interest

107
rate increased, the cost of BWWT,O3 increased compared to AWWT, and the cost of urine
source separation decreased compared to AWWT.
Object 4-1. Environmental impact and economic costing sensitivity analysis results (.xlsx file 43.7 KB)
Concluding Remarks
There are numerous environmental benefits associated with urine source
separation (e.g., potable flush water savings, electricity savings at the wastewater
treatment plant, and nutrient offsets), Compared with centralized wastewater treatment,
ozonation of wastewater had a higher environmental impact and economic cost, urine
collected by vacuum sewer had lower environmental impact and higher economic cost,
and urine collected by vacuum truck collection or treated at decentralized locations had
lower environmental impact and similar economic cost. Urine source separation can
achieve a high reduction of pharmaceutical toxicity and comparatively low total toxicity
from the treatment process compared with BWWT,O3. Additional sorption studies are
needed to evaluate the removal of various pharmaceutical compounds from diverse
therapeutic classes and chemical structure, the results of which could be incorporated
into a future version of this LCA framework. The benefit of this LCA framework is that
the environmental impact and economic cost of alternative sorbents can easily be
evaluated. Although the AER used for this study may not be the most appropriate to
remove all pharmaceuticals, multiple sorbents may be utilized which have a higher
selectivity and capacity for the pharmaceuticals of concern. Using a more selective and
higher capacity resin would decrease the resin requirements and subsequent costs. In
conclusion, the framework created and tested herein estimates the environmental and
108
economic impacts of alternative treatment technologies that remove pharmaceuticals
and recover nutrients in source separated urine in a community setting.
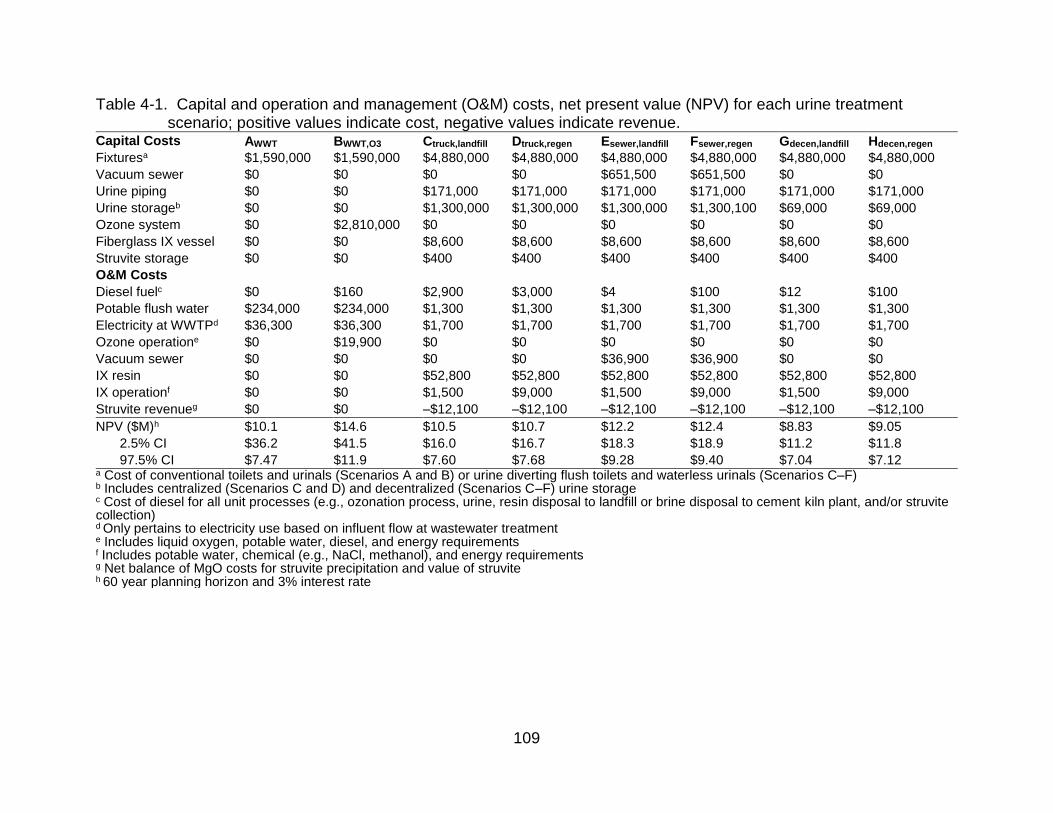
109
Table 4-1. Capital and operation and management (O&M) costs, net present value (NPV) for each urine treatment scenario; positive values indicate cost, negative values indicate revenue.
Capital Costs AWWT BWWT,O3 Ctruck,landfill Dtruck,regen Esewer,landfill Fsewer,regen Gdecen,landfill Hdecen,regen
Fixturesa $1,590,000 $1,590,000 $4,880,000 $4,880,000 $4,880,000 $4,880,000 $4,880,000 $4,880,000
Vacuum sewer $0 $0 $0 $0 $651,500 $651,500 $0 $0
Urine piping $0 $0 $171,000 $171,000 $171,000 $171,000 $171,000 $171,000
Urine storageb $0 $0 $1,300,000 $1,300,000 $1,300,000 $1,300,100 $69,000 $69,000
Ozone system $0 $2,810,000 $0 $0 $0 $0 $0 $0
Fiberglass IX vessel $0 $0 $8,600 $8,600 $8,600 $8,600 $8,600 $8,600
Struvite storage $0 $0 $400 $400 $400 $400 $400 $400
O&M Costs
Diesel fuelc $0 $160 $2,900 $3,000 $4 $100 $12 $100
Potable flush water $234,000 $234,000 $1,300 $1,300 $1,300 $1,300 $1,300 $1,300
Electricity at WWTPd $36,300 $36,300 $1,700 $1,700 $1,700 $1,700 $1,700 $1,700
Ozone operatione $0 $19,900 $0 $0 $0 $0 $0 $0
Vacuum sewer $0 $0 $0 $0 $36,900 $36,900 $0 $0
IX resin $0 $0 $52,800 $52,800 $52,800 $52,800 $52,800 $52,800
IX operationf $0 $0 $1,500 $9,000 $1,500 $9,000 $1,500 $9,000
Struvite revenueg $0 $0 –$12,100 –$12,100 –$12,100 –$12,100 –$12,100 –$12,100
NPV ($M)h $10.1 $14.6 $10.5 $10.7 $12.2 $12.4 $8.83 $9.05
2.5% CI $36.2 $41.5 $16.0 $16.7 $18.3 $18.9 $11.2 $11.8
97.5% CI $7.47 $11.9 $7.60 $7.68 $9.28 $9.40 $7.04 $7.12 a Cost of conventional toilets and urinals (Scenarios A and B) or urine diverting flush toilets and waterless urinals (Scenarios C–F) b Includes centralized (Scenarios C and D) and decentralized (Scenarios C–F) urine storage c Cost of diesel for all unit processes (e.g., ozonation process, urine, resin disposal to landfill or brine disposal to cement kiln plant, and/or struvite collection) d Only pertains to electricity use based on influent flow at wastewater treatment e Includes liquid oxygen, potable water, diesel, and energy requirements
f Includes potable water, chemical (e.g., NaCl, methanol), and energy requirements g Net balance of MgO costs for struvite precipitation and value of struvite h 60 year planning horizon and 3% interest rate

110
Figure 4-1. Treatment schematic for scenarios A–H (light gray horizontal arrows) and contributing processes. Single black lines represent urine flow, grey lines represent ion-exchange resin flow, and double black lines represent struvite flow. The solid lines indicate transport through pipes and dashed lines represent road transport by truck.

111
Figure 4-2. Normalized TRACI impact score for all scenarios (a) centralized wastewater
treatment scenarios (AWWT, BWWT,O3), and (b) urine source separation
scenarios (C–H). Each colored bar represents input processes (e.g., potable water, electricity use at the WWTP, urine source separation (USS) infrastructure), avoided impacts (e.g., fertilizer offsets, brine incineration), and generated impacts (e.g., nutrient discharge, pharmaceutical discharge). The brackets around each error bar represent the 95% confidence interval resulting from Ecoinvent database distributions from the Monte Carlo uncertainty analysis.

112
Figure 4-3. Comparison of ecotoxicity impact (CTUe = PAF·m3·day) due to (a) contributing processes (e.g., flush water, urine transport) and generated emissions (e.g., nutrient discharge, pharmaceutical discharge) and avoided impacts (e.g., fertilizer offsets, brine incineration) in each scenario and (b) pharmaceutical emissions only. The brackets around each error bar represent the 95% confidence interval resulting from Ecoinvent database distributions from the Monte Carlo uncertainty analysis.

113
CHAPTER 5 CONCLUSIONS
Urine source separation is a process that can help advance two paradigm shifts
for sustainable water and nutrient management: resource recovery of valuable nutrients,
and holistic management of contaminants of emerging concern. The significant
contribution of urine to NSAID loading in the environment makes urine source
separation an attractive process to address pharmaceutical pollution. Furthermore, the
beneficial reuse of nutrients in urine makes it necessary to employ a treatment process
that selectively removes NSAIDs without co-removal of nutrients. The work presented
here provides insights into the effectiveness and efficiency of using an AER to
selectively remove NSAIDs from urine. Although this work focused on the removal of
NSAIDs by one AER, this framework may be utilized to evaluate various sorbents and
pharmaceuticals and hormones. Figure 5-1 depicts the systematic approach to evaluate
sorption processes to remove pharmaceuticals in urine, and how future work may be
incorporated into the framework. Generated experimental isotherm and kinetic data for
diverse sorbents and pharmaceuticals may be used to predict fixed-bed breakthrough
performance and compared with bench scale column test. The breakthrough curve may
be compared to in vitro bioassay dose-response curves, and potential in vivo effects to
evaluate the reduction in ecotoxicity potential and to establish a treatment objective
(e.g., breakthrough is when effluent reaches EC10). The treatment objective determines
the reactor size, resin requirements, and regeneration schedule which may be
incorporated into the LCA framework to evaluate the overall environmental impacts and
economic costs of the treatment process. The framework may be expanded to include
alternative sorbents or nutrient recovery technologies such as biochar and ammonia

114
stripping, respectively. The results of the LCA may be used to determine areas of
improvement and the process repeated to optimize the system.
Results from the batch equilibrium tests of NSAIDs at realistic concentrations in
urine highlight the primary interactions that dictate ion-exchange selectivity, and the
impact of urine composition on removal. Understanding the mechanisms of interaction
is important for selecting the appropriate material for successful removal. The removal
of acidic organic compounds (i.e., NSAIDs) was governed by both the electrostatic
interaction between the (i) carboxylic acid functional group of the pharmaceutical and
quaternary ammonium functional group of the resin, and (ii) the non-electrostatic
interactions between the aromatic ring structure of the pharmaceutical and aromatic ring
structure of the AER. Alternatively, carbamazepine, which is a neutral pharmaceutical
containing three aromatic ring structures, may be selectively removed by a polymeric
adsorbent. Furthermore, the hydrophobicity and charge of a pharmaceutical may vary
under fresh (pH 6) and ureolyzed urine (pH 9) conditions, and impact removal efficacy.
For example, the hydrophobicity of the NSAIDs studied decreased with increasing pH
suggesting that sorption was less selective under ureolyzed urine conditions compared
with fresh urine. Although the NSAIDs studied were negatively charged over the entire
pH range, the charge of other pharmaceuticals of interest may vary with pH. Depending
on the point of implementation of a sorption column, whether at the toilet or a central
location, the hydrophobicity and charge of the pharmaceutical compound should be
considered when selecting an appropriate sorbent material.
Predicting fixed-bed breakthrough performance using kinetic and equilibrium
batch data is a rapid way to evaluate pharmaceutical removal performance.

115
Furthermore, this method allows the user to optimize the treatment process by
evaluating treatment performance for varying conditions prior to bench-scale or pilot
column testing, for example, whether treatment would vary significantly under fresh or
ureolyzed urine conditions. Furthermore, the presence of endogenous metabolites in
urine competed for ion-exchange sites on the resin, reducing the capacity of the resin
for pharmaceuticals. Evaluation of more selective sorbents, such as molecularly
imprinted polymers, or sorbents with higher capacity, such as activated carbon, may
improve pharmaceutical removal in the presence of organic endogenous metabolites.
Evaluation of fixed-bed performance as a function of toxicity rather than mass removal
provides a better understanding of treatment efficacy. Evaluating pharmaceutical activity
using high-throughput in vitro bioassays provides a rapid assessment of the potential
effect of pharmaceuticals. The development of high-throughput assay toxicity databases
provides the opportunity to evaluate treatment efficacy with respect to various cellular
response pathways.
The results of the LCA demonstrate that urine source separation has significant
benefits with respect to water conservation, energy savings, and reduced nutrient
loading compared to conventional wastewater treatment. The economic benefits
associated with the water and energy savings gained from implementing urine source
separation is dependent on utility costs for potable water and electricity. However, if the
cost of urine-source separating fixtures (e.g., urine diverting flush toilets and waterless
urinals) was equivalent to conventional fixtures, urine source separation may become
more economically feasible. Furthermore, the scale at which urine is treated (e.g.,
building level or collected by vacuum truck for centralized treatment) have similar
116
environmental impacts and economic costs which provides flexibility for communities’
decision making when considering implementation. The LCA model serves as a
framework to evaluate the environmental impact and economic costs to remove a
variety of pharmaceuticals using alternative sorbents. For example, pharmaceutical
removal by biochar may be evaluated and the framework expanded to include biochar
manufacturing.
Urine source separation is one solution that may help to address pharmaceutical
loading in the environment. However, urine source separation is limited to addressing
pharmaceuticals primarily excreted in urine. Therefore, it may be one of multiple
solutions to address the growing issue of pharmaceuticals, personal care products, and
endocrine disrupting compounds in the environment. The additional benefit of urine
source separation is recovery of valuable nutrients for beneficial reuse, thus requiring a
treatment process, such as ion-exchange, to effectively separate pharmaceuticals from
nutrients. However, early evaluation of a sorption technology or process requires a
multi-faceted, systems-level evaluation to ensure treatment efficacy with respect to both
mass removal and toxicity reduction while minimizing the upstream environmental
impact and economic costs associated with treatment.

117
Figure 5-1. Visual representation of the systematic approach for evaluating sorption materials to remove pharmaceuticals
in source separated urine. Dashed boxes indicate opportunities for future work. Generation of experimental isotherm and kinetic data for various sorbent materials may be utilized to model column breakthrough curves. Breakthrough curves may be compared to dose-response toxicity curves to establish a treatment objective (e.g., IC10). The treatment objective determines the capital (e.g., reactor size) and operation requirements (e.g., resin volume, regeneration) which may be included within the LCA framework to evaluate the overall environmental and economic costs. The resulting LCA may be used to identify areas of improvement to further optimize the sorption process.
118
APPENDIX A SUPPLEMENTARY INFORMATION FOR CHAPTER 2
Estimation of Realistic Pharmaceutical Concentrations in Urine
Data from previous publications was reviewed to estimate realistic
pharmaceutical concentrations in urine as shown in Table A-1. Studies conducted by
Ternes (1998) and Salgado et al. (2012) measured pharmaceutical loading (g/d) in raw
wastewater. For simplicity, it was assumed that all pharmaceuticals originated from
excretion in human urine therefore concentrations in urine were estimated based on
total treatment volume in population equivalents (p.e.) and a daily urine void volume of
1.6 L/person (FitzGerald et al. 2002, Latini et al. 2004). A study by Joss et al. (2005)
measured pharmaceutical concentrations (ng/L) in raw wastewater; an average
volumetric flow rate of the wastewater treatment plant was obtained from the 2005
Annual Report of the wastewater treatment plant studied (Kloten/Opfikon 2005). Lastly,
a study by Winker et al. (2008b) directly measured pharmaceutical concentrations in
human urine as well as theoretically calculated concentrations.
Isotherm Models
Freundlich Isotherm
The Freundlich isotherm is an empirical model that does not imply maximum
adsorption capacity of the sorbent. Adsorption is non-ideal, reversible, and is not
restricted to monolayer adsorption. The amount adsorbed is the summation of
adsorption on all sites, with stronger binding sites occupied first, until adsorption energy
is exponentially decreased. It is based on the following equation,
𝑞𝑒 = 𝐾𝐹𝐶𝑒1/𝑛𝐹 (A-1)

119
where KF (mmol1-1/nF L1/nF/g) and nF (dimensionless) are the Freundlich isotherm
constants determined from nonlinear regression. KF is an approximate indicator of the
adsorption capacity and the nF parameter represents the adsorption intensity and
surface heterogeneity, where 0 < 1/nF < 1 indicates favorable adsorption and 1/nF = 1
indicates linear adsorption (Delle Site 2001).
Langmuir Isotherm
The Langmuir isotherm assumes monolayer adsorption on a homogenous
surface (Foo and Hameed 2010). Graphically, this is characterized by a plateau where
the saturation point is reached and no additional adsorption can take place and is based
on Eq. A-2,
𝑞𝑒 =𝐾𝐿𝑞0𝐶𝑒
1+𝐾𝐿𝐶𝑒 (A-2)
where KL (L/mol) and q0 (mmol/g) are determined from nonlinear regression. The
adsorption energy of a solute on a sorbent can be determined from the Langmuir
isotherm parameter, KL, as a change in Gibbs free energy as shown in Eq. A-3
(Ghodbane and Hamdaoui 2008),
Δ𝐺° = −𝑅𝑇ln (𝐾𝐿) (A-3)
where R is the ideal gas constant, 8.314 J/mol∙K, and T is the temperature (K).
Values of ΔG° < 0 suggest favorable and spontaneous sorption of the solutes
(Ghodbane and Hamdaoui 2008). A separation factor, RL, may also be used to describe
the sorption behavior and can be calculated following Eq. A-4,
𝑅𝐿 =1
1+𝐾𝐿𝐶0 (A-4)

120
where KL is the Langmuir constant, and C0 is the initial concentration of the
solute (mmol/L). Values of 0 < RL < 1 indicate favorable sorption and RL > 1 indicates
unfavorable sorption (Foo and Hameed 2010).
D–A and D–R Isotherm
The Dubinin–Astakhov (D–A) and Dubinin–Radushkevich (D–R) are based on
the Polyani adsorption potential theory where the adsorption potential ɛ (A-5) is related
to the average free energy change of a substance from the liquid to the resin phase
(Foo and Hameed 2010). These models imply a micropore volume filling adsorption
process, which is in contrast to the layer-by-layer and monolayer adsorption modeled by
the Freundlich and Langmuir isotherms (Foo and Hameed 2010), and are temperature
dependent,
𝜀 = 𝑅𝑇 ln (1 +1
𝐶𝑒) (A-5)
The amount adsorbed is quantified by a function of the adsorption potential (Eq.
A-6),
𝑞𝑒 = 𝑞0 exp (− (𝜀
√2𝐸)
𝑛𝐷
) (A-6)
where E is the adsorption energy (J/mol), nD is the heterogeneity factor
(dimensionless), and q0 (mmol/g) is the maximum adsorption capacity of the sorbent. In
the case of the D-A model, q0 is assumed to be limited by a maximum and matches the
manufacturer’s capacity of the AER, while E and nD were determined from nonlinear
regression. For the D-R model nD = 2, and similar to the Freundlich model q0 is not
limited by a maximum adsorption capacity. Along with E, q0 was determined by
nonlinear regression (Eq. A-7),
𝑞𝑒 = 𝑞0 exp (− (𝜀
√2𝐸)
2
) (A-7)

121
Table A-1. Properties of pharmaceuticals used in ion-exchange experiments.
Pharmaceutical, CAS number, molecular weight
Structure pKa log Kow log D, pH 6
log D, pH 9
m/za
Diclofenac sodium 15307-79-6 318.1
4.24d 4.51f 2.49c 0.77c 296
Ibuprofen sodium 31121-93-4 228.26
4.38d 3.97f 2.09c –0.30c 207
Ketoprofen 22071-15-4 254.28
4.07d 3.12e 1.12c 0.67c 255
Naproxen sodium 26159-34-2 252.24
4.15f 3.18f 1.12c 0.20c 231
Paracetamol 103-90-2 151.16
9.38f 0.46f 0.53b 0.41b 151
a Observed under method’s conditions
b Estimated using the PALLAS PrologD prediction program (CompuDrug 2006) c Estimated using Eq. 2-2 d Meloun et al. (2007) e Sangster (2014) f Hazardous Substances Data Bank (TOXNET 2012)

122
Table A-2. Estimated and measured pharmaceutical concentrations in urine based on previous literature.
Reference Matrix Treatment volume Compound Concentration in wastewater, µg/L (µmol/L)
Load in wastewater, g/d (mmol/d)
Concentration in urine, µg/L (µmol/L)
Ternes (1998) Raw wastewater
312,000 p.e.
Diclofenac – 100 (310) 210 (0.67)
Ibuprofen – 250 (1100) 530 (2.3)
Naproxen – 80 (320) 170 (0.68)
Salgado et al. (2012) Raw wastewater
32,700 p.e. Diclofenac – 35 (110) 710 (2.9) Ibuprofen – 46 (200) 940 (4.1) Ketoprofen – 83 (330) 1,700 (6.6)
Joss et al. (2005) Raw wastewater
55,000 p.e., 1.5 × 10⁶ L/d c
Diclofenac 1.1 (3.5) – 210 (0.67)
Ibuprofen 2.0 (8.8) – 390 (1.7)
Naproxen 1.1 (4.4) – 210 (0.84)
Winker et al. (2008b) Urine –
Diclofenac – – 21a/12b
(6.7×10⁻²/3.7×10–2)
Ibuprofen – – 496a/678b (2.2/3.0)
Ketoprofen – – 2b (7.1×10⁻³) a Average concentration of two sampling locations b Theoretical concentration c Average volumetric flow rate of sampling site based on wastewater treatment plant annual report (Kloten/Opfikon 2005)

123
Table A-3. Properties of strong-base, anion exchange polymer resins. Resin Pore structure Polymer Functional group Capacityb
(meq/mL) Density (g/mL)
Dowex 22a macroporous styrene R–N+(CH3)2(CH2OH), dimethylethanolamine
1.2 0.317c
Purolite A520E macroporous styrene R–N+(C2H5)3, triethylamine 0.9 0.323d
Dowex Marathon 11
gel styrene R–N+(CH3)3, trimethylamine 1.3 0.322d
a Primary resin investigated b Manufacturer data c Determined experimentally (this study) d Determined experimentally (Landry and Boyer 2013)

124
Table A-4. Linear form of isotherm models and plots to determine estimated initial values for non-linear isotherm modeling parameters.
Isotherm Linear form Plot
Freundlich log(𝑞𝑒) = log(𝐾𝐹) +1
𝑛log(𝐶𝑒) log(𝑞𝑒) 𝑣𝑠 log(𝐶𝑒)
Langmuir 1
𝑞𝑒=
1
𝑞0+
1
𝑘𝐿𝑞0𝐶𝑒
1
𝑞𝑒 𝑣𝑠
1
𝐶𝑒
Dubinin-Astakhov ln(𝑞0) − ln(𝑞𝑒) = (𝜖
√2𝐸)
𝑛𝐷 ln(𝑞0) − ln(𝑞𝑒) 𝑣𝑠 𝜖
Dubinin-Radushkevich ln(𝑞𝑒) = ln(𝑞0) − (𝜖
√2𝐸)
2
ln(𝑞𝑒) 𝑣𝑠 𝜖2

125
Table A-5. Individual equilibrium experiment isotherm parameters for Dowex 22 AER sorption of diclofenac (C0 = 3.0 µmol/L), ibuprofen (C0 = 3.6 µmol/L), ketoprofen (C0 = 7.8 µmol/L), naproxen (C0 = 7.5 µmol/L), and paracetamol (C0 = 14 µmol/L) in ureolyzed urine. Isotherm parameters and goodness of fit statistics (sum of squares errors (SSE), correlation coefficients (R2), and average relative errors (ARE)) for the Langmuir, Freundlich, Dubinin-Astakhov, and Dubinin-Radushkevich models were determined by nonlinear regression.
Langmuir
Pharmaceutical KL (L/mmol) q0 (mmol/g) RL ΔG° (J/mol) SSE (mmol2/g2) R2 ARE (%)
Diclofenac 989 1.41×10⁻² 0.254 –15,600 6.90×10⁻⁶ 0.960 32 Ibuprofen –125 –1.16×10⁻² 1.84 –b 7.53×10⁻⁶ 0.919 34 Ketoprofen 46.5 4.85×10⁻² 0.734 –8,710 6.33×10⁻⁵ 0.751 11 *Naproxenc 610 9.35×10⁻³ 0.179 –14,600 8.62×10⁻⁷ 0.961 7 Naproxen 1230 5.61×10⁻³ 9.78×10⁻² –16,100 3.35×10⁻⁵ 0.061 70 Paracetamol –77.6 –5.31×10⁻⁵ –14.6 –b 9.14×10⁻⁴ –0.297a 100
Freundlich
Pharmaceutical KF (mmol1–1/nF L1/nF/g) 1/nF SSE (mmol2/g2) R2 ARE (%)
Diclofenac 0.481 0.639 7.62×10⁻⁶ 0.956 32 Ibuprofen 9.79 1.25 9.01×10⁻⁶ 0.903 37 Ketoprofen 0.874 0.864 6.37×10⁻⁵ 0.750 10 *Naproxenc 0.118 0.510 2.63×10⁻⁷ 0.988 4 Naproxen 1.15×10⁻² 0.183 3.41×10⁻⁵ 0.044 67 Paracetamol 1.00×1089 48.3 7.98×10⁻⁴ –0.132a 82
Dubinin-Astakhov
Pharmaceutical E (kJ/mol) nD SSE (mmol2/g2) R2 ARE (%)
Diclofenac 0.810 0.692 7.87×10⁻⁶ 0.955 32 Ibuprofen 1.97 1.120 9.18×10⁻⁶ 0.901 37 Ketoprofen 0.903 0.772 6.38×10⁻⁵ 0.749 10 *Naproxenc 0.228 0.490 2.39×10⁻⁷ 0.989 20 Naproxen 0.009 0.274 4.47×10⁻⁵ –0.253a 76 Paracetamol 6.28 9.20 6.05×10⁻⁴ 0.142 277
Dubinin-Radushkevich
Pharmaceutical E (kJ/mol) q0 (mmol/g) SSE (mmol2/g2) R2 ARE (%)
Diclofenac 7.94 6.12×10⁻² 8.05×10⁻⁶ 0.954 25 Ibuprofen 5.53 0.209 1.02×10⁻⁵ 0.890 40 Ketoprofen 6.31 8.05×10⁻² 6.35×10⁻⁵ 0.751 12 *Naproxenc 9.12 2.08×10⁻² 3.94×10⁻⁷ 0.982 4 Naproxen 9.16 1.37×10⁻² 5.49×10⁻⁵ –0.538a 91 Paracetamol 0.862 1.00×1032 7.31×10⁻⁴ –0.037a 113 a R2 is a proportion of variance explained by the fit, it the fit is worse than fitting a horizontal line, then R2 is negative and cannot be interpreted as the square of a correlation (MathWorks 2013) b Could not be determined due to negative KL value c * Denotes isotherm modeling of naproxen experimental data excluding data for lowest resin dose
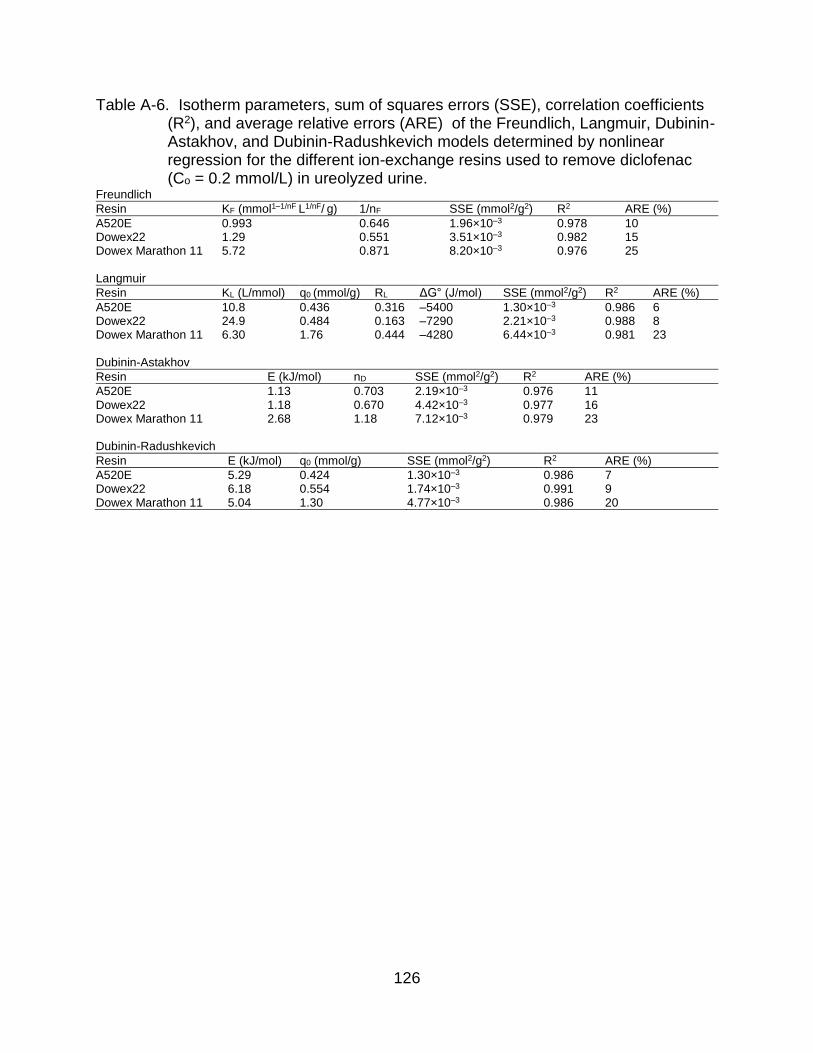
126
Table A-6. Isotherm parameters, sum of squares errors (SSE), correlation coefficients (R2), and average relative errors (ARE) of the Freundlich, Langmuir, Dubinin-Astakhov, and Dubinin-Radushkevich models determined by nonlinear regression for the different ion-exchange resins used to remove diclofenac (Co = 0.2 mmol/L) in ureolyzed urine.
Freundlich
Resin KF (mmol1–1/nF L1/nF/ g) 1/nF SSE (mmol2/g2) R2 ARE (%)
A520E 0.993 0.646 1.96×10⁻³ 0.978 10 Dowex22 1.29 0.551 3.51×10⁻³ 0.982 15 Dowex Marathon 11 5.72 0.871 8.20×10⁻³ 0.976 25 Langmuir
Resin KL (L/mmol) q0 (mmol/g) RL ΔG° (J/mol) SSE (mmol2/g2) R2 ARE (%)
A520E 10.8 0.436 0.316 –5400 1.30×10⁻³ 0.986 6 Dowex22 24.9 0.484 0.163 –7290 2.21×10⁻³ 0.988 8 Dowex Marathon 11 6.30 1.76 0.444 –4280 6.44×10⁻³ 0.981 23 Dubinin-Astakhov
Resin E (kJ/mol) nD SSE (mmol2/g2) R2 ARE (%)
A520E 1.13 0.703 2.19×10⁻³ 0.976 11 Dowex22 1.18 0.670 4.42×10⁻³ 0.977 16 Dowex Marathon 11 2.68 1.18 7.12×10⁻³ 0.979 23 Dubinin-Radushkevich
Resin E (kJ/mol) q0 (mmol/g) SSE (mmol2/g2) R2 ARE (%)
A520E 5.29 0.424 1.30×10⁻³ 0.986 7 Dowex22 6.18 0.554 1.74×10⁻³ 0.991 9 Dowex Marathon 11 5.04 1.30 4.77×10⁻³ 0.986 20

127
Table A-7. Estimated physicochemical parameters of the four major diclofenac metabolites, 3’-hydroxydiclofenac, 4’-hydroxydiclofenac, 5’-hydroxydiclofenac, and 3’hydroxy-4’-methoxydiclofenac.
Metabolite pKaa LogKowb LogD, pH 6c LogD, pH 9c
3’-hydroxydiclofenac 4.50, 8.05 4.00 2.48 –1.00 4’-hydroxydiclofenac 4.50, 8.82 4.86 2.34 –0.55 5’-hydroxydiclofenac 4.40, 10.43 3.88 2.26 –0.18 3’hydroxy-4’-methoxydiclofenac
4.52, 8.05 3.83 2.34 –1.16
a Acid dissociation constant calculated using the PALLAS pKalc prediction program, v.3.8.1.2 (CompuDrug 2006) b Octanol–water partitioning coefficient calculated using the PALLAS PrologP prediction program, v.3.8.1.2 (CompuDrug 2006) c pH dependent distribution coefficient calculated using the PALLAS PrologD prediction program, v.3.8.1.2 (CompuDrug 2006)

128
Table A-8. Equilibrium experiment isotherm parameters for Dowex 22 AER sorption of ibuprofen (C0 = 0.2 mmol/L) present in fresh urine. Isotherm parameters and goodness of fit statistics (sum of squares errors (SSE), correlation coefficients (R2), and average relative errors (ARE)) for the Langmuir, Freundlich, Dubinin-Astakhov, and Dubinin-Radushkevich models were determined by nonlinear regression.
Langmuir KL (L/mmol) q0 (mmol/g) RL ΔG° (J/mol) SSE (mmol2/g2) R2 ARE (%)
3.45 0.236 0.562 -2810 2.80E-04 0.966 3
Freundlich KF (mmol1–1/nF L1/nF/ g) 1/nF SSE (mmol2/g2) R2 ARE (%)
0.317 0.727 3.28E-04 0.960 4
Dubinin-Astakhov E (kJ/mol) nD SSE (mmol2/g2) R2 ARE (%)
0.187 0.459 3.59E-04 0.956 5
Dubinin-Radushkevich E (kJ/mol) q0 (mmol/g) SSE (mmol2/g2) R2 ARE (%)
4.22 0.166 2.73E-04 0.967 4

129
Table A-9. Combined equilibrium experiment isotherm parameters for Dowex 22 AER sorption of diclofenac (C0 = 3.5 µmol/L), ibuprofen (C0 = 4.7 µmol/L), ketoprofen (C0 = 7.3 µmol/L), and naproxen (C0 = 7.4 µmol/L) all present in ureolyzed urine. Isotherm parameters and goodness of fit statistics (sum of squares errors (SSE), correlation coefficients (R2), and average relative errors (ARE)) for the Langmuir, Freundlich, Dubinin-Astakhov, and Dubinin-Radushkevich models were determined by nonlinear regression.
Langmuir
Pharmaceutical KL (L/mmol) q0 (mmol/g) RL ΔG° (J/mol) SSE (mmol2/g2) R2 ARE (%)
Diclofenac 354 3.78×10⁻² 0.445 –13300 6.48×10⁻⁶ 0.989 32 Ibuprofen –173 –4.65×10⁻³ 5.32 –b 2.54×10⁻⁵ 0.885 31 *Ketoprofenc 182 1.24×10⁻² 0.429 –11800 1.58×10⁻⁷ 0.988 3 Ketoprofen 595 5.12×10⁻³ 0.187 –14500 2.89×10⁻⁵ –0.046a 65535 Naproxen 123 2.99×10⁻² 0.521 –10900 7.70×10⁻⁵ 0.763 20
Freundlich Pharmaceutical KF (mmol1–1/nF L1/nF/ g) 1/nF SSE (mmol2/g2) R2 ARE (%)
Diclofenac 1.87 0.777 6.99×10⁻⁶ 0.988 34 Ibuprofen 1130 2.10 3.02×10⁻⁵ 0.863 44 *Ketoprofenc 0.306 0.733 2.39×10⁻⁷ 0.981 3 Ketoprofen 0.176 0.302 3.02×10⁻⁵ –0.091a 65535 Naproxen 0.467 0.707 7.61×10⁻⁵ 0.765 16
Dubinin-Astakhov Pharmaceutical E (kJ/mol) nD SSE (mmol2/g2) R2 ARE (%)
Diclofenac 1.59 0.889 7.04×10⁻⁶ 0.988 34 Ibuprofen 3.83 1.91 3.16×10⁻⁵ 0.857 47 *Ketoprofenc 0.472 0.623 2.49×10⁻⁷ 0.981 4 Ketoprofen 0.054 0.375 3.79×10⁻⁵ –0.371a 65535 Naproxen 0.65 0.664 7.60×10⁻⁵ 0.766 15
Dubinin-Radushkevich Pharmaceutical E (kJ/mol) q0 (mmol/g) SSE (mmol2/g2) R2 ARE (%)
Diclofenac 7.84 0.106 7.86×10⁻⁶ 0.987 38 Ibuprofen 4.00 3.65 3.17×10⁻⁵ 0.857 48 *Ketoprofenc 7.25 3.12×10⁻² 1.82×10⁻⁷ 0.986 37 Ketoprofen 10.0 8.86×10⁻³ 3.09×10⁻⁵ -0.119a 65535 Naproxen 7.03 6.45×10⁻² 7.74×10⁻⁵ 0.761 20 a R2 is a proportion of variance explained by the fit, it the fit is worse than fitting a horizontal line, then R2 is negative and cannot be interpreted as the square of a correlation (MathWorks 2013) b Could not be determined due to negative KL value c * Denotes isotherm modeling of ketoprofen experimental data excluding data for lowest resin dose

130
Table A-10. Analysis of covariance (ANOCOVA) test results to determine whether there was a significant difference at the 95% confidence interval (α = 0.05) between DCF, IBP, KTP, and NPX ion-exchange when present individually or combined in synthetic ureolyzed urine. The null hypothesis states that there was not a significant difference between slopes (p > 0.05) and the alternative hypothesis states that there was a significant difference between the slopes (p < 0.05).
Pharmaceutical F Statistic Probability > F
Diclofenac 0.602 0.446 Ibuprofen 1.08 0.309 Ketoprofen 11.8 0.002 Ketoprofena 0.602 0.446 Naproxen 9.04 0.006 Naproxena 0.163 0.690 a Excluding lowest resin dose (0.16 mL/L)

131
Figure A-1. Individual experimental data and sorption isotherms determined by nonlinear regression of paracetamol (PCM) (C0 = 14 µmol/L) using Dowex 22 anion exchange resin.
0
0.005
0.01
0.015
0.02
0.025
0 0.005 0.01 0.015
qe
, m
mo
l/g
Ce, mmol/L
Paracetamol
PCMLangmuirFreundlichD-AD-R

132
Figure A-2. Experimental data and isotherm models for naproxen and ketoprofen
when (a) naproxen (NPX) present individually in ureolyzed urine, and (b) ketoprofen (KTP) present as a mixture in ureolyzed urine. Both figures illustrate the plotted experimental isotherms including the lowest resin dose of 0.16 mL/L (i.e. including the data point with the highest Ce) and corresponding nonlinear isotherm models (Freundlich, Langmuir, Dubinin-Astakhov (D-A), and Dubinin-Radushkevich (D-R)).
0
0.005
0.01
0.015
0.02
0 0.002 0.004 0.006 0.008
qe
, m
mo
l/g
Ce, mmol/L
(a) Naproxen
NPXLangmuirFreundlichD-AD-R
0
0.005
0.01
0.015
0.02
0 0.002 0.004 0.006 0.008
qe
, m
mo
l/g
Ce, mmol/L
(b) KetoprofenKTPLangmuirFreundlichD-AD-R

133
Figure A-3. Experimental data and ion-exchange isotherms of diclofenac removal by various resins (a) A520E, (b) Dowex 22, and (c) Dowex Marathon 11 AER; C0 = 0.2 mmol/L.
0
0.1
0.2
0.3
0.4
0.5
0 0.02 0.04 0.06 0.08 0.1 0.12 0.14
qe
, m
mo
l/g
Ce, mmol/L
(a) A520E
A520EFreundlichLangmuirD-AD-R
0
0.1
0.2
0.3
0.4
0.5
0 0.02 0.04 0.06 0.08 0.1 0.12 0.14
qe
, m
mo
l/g
Ce, mmol/L
(b) Dowex 22
Dowex 22FreundlichLangmuirD-AD-R
0
0.1
0.2
0.3
0.4
0.5
0 0.02 0.04 0.06 0.08 0.1 0.12 0.14
qe
, m
mo
l/g
Ce, mmol/L
(c) Dowex Marathon 11
Dowex 11FreundlichLangmuirD-AD-R

134
Figure A-4. Mole fraction distribution of the neutral and ionized species present in the
octanol and water phase for (a) diclofenac (DCF), (b) ibuprofen (IBP), (c) ketoprofen (KTP), and (d) naproxen (NPX). Dashed red lines indicate the mole fraction of the ionized species present in the octanol phase at pH 6 (i.e., fresh urine) and the solid red lines indicate the mole fraction of the ionized species present in the octanol phase at pH 9 (i.e., ureolyzed urine).
0
0.2
0.4
0.6
0.8
1
1 2 3 4 5 6 7 8 9 10 11 12 13 14
Mole
Fra
ction
pH
(a)
[DCF]o
[DCF–]o
[DCF]w
[DCF–]w
0
0.2
0.4
0.6
0.8
1
1 2 3 4 5 6 7 8 9 10 11 12 13 14
Mole
Fra
ction
pH
(b)
[IBP]o[IBP–]o[IBP]w[IBP–]w
0
0.2
0.4
0.6
0.8
1
1 2 3 4 5 6 7 8 9 10 11 12 13 14
Mole
Fra
ction
pH
(c)
[KTP]o[KTP–]o[KTP]w[KTP–]w
0
0.2
0.4
0.6
0.8
1
1 2 3 4 5 6 7 8 9 10 11 12 13 14
Mole
Fra
ction
pH
(d) [NPX]o[NPX–]o[NPX]w[NPX–]w

135
Figure A-5. Combined pharmaceutical experimental data and sorption isotherms
determined by nonlinear regression of (a) diclofenac (DCF) (C0=3.5 µmol/L), (b) ibuprofen (IBP) (C0=4.7 µmol/L), (c) ketoprofen (KTP) (C0=7.3 µmol/L), and (d) naproxen (NPX) (C0=7.4 µmol/L) using Dowex 22 anion exchange resin. Figure (c) *Ketoprofen illustrates the plotted experimental isotherms excluding the lowest resin dose of 0.16 mL/L (i.e. excluding the data point with the highest Ce and corresponding nonlinear isotherm models (Freundlich, Langmuir, Dubinin-Astakhov (D-A), and Dubinin-Radushkevich (D-R)).
0
0.005
0.01
0.015
0.02
0 0.002 0.004 0.006 0.008
qe
, m
mo
l/g
Ce, mmol/L
(a) Diclofenac
DCFLangmuirFreundlichD-AD-R
0
0.005
0.01
0.015
0.02
0 0.002 0.004 0.006 0.008
qe
, m
mo
l/g
Ce, mmol/L
(b) Ibuprofen
IBPLangmuirFreundlichD-AD-R
0
0.005
0.01
0.015
0.02
0 0.002 0.004 0.006 0.008
qe
, m
mo
l/g
Ce, mmol/L
(c) *KetoprofenKTPLangmuirFreundlichD-AD-R
0
0.005
0.01
0.015
0.02
0 0.002 0.004 0.006 0.008
qe
, m
mo
l/g
Ce, mmol/L
(d) Naproxen
NPXLangmuirFreundlichD-AD-R

136
C0, Cycle 1 Ce, Cycle 1 C0, Cycle 2 Ce, Cycle 2
C0, Cycle 3 Ce, Cycle 3
Figure A-6. Sorption by Dowex 22 anion exchange resin over three treatment cycles using fresh resin (Cycle 1) and regenerated resin (Cycles 2 and 3) in a continuous-flow mini-column. Influent (solid shapes) and effluent (open shapes) concentrations (mmol/L) of (a) diclofenac (DCF), (b) ibuprofen (IBP), (c) ketoprofen (KTP), and (d) naproxen (NPX) following sorption by Dowex 22 anion exchange resin over three treatment cycles.
0
2
4
6
8
0 5000 10000 15000
Ce,
mm
ol/L
Bed Volume
(a) Diclofenac
0
2
4
6
8
0 5000 10000 15000
Ce,
mm
ol/L
Bed Volume
(b) Ibuprofen
0
2
4
6
8
0 5000 10000 15000
Ce,
mm
ol/L
Bed Volume
(c) Ketoprofen
0
2
4
6
8
0 5000 10000 15000
Ce,
mm
ol/L
Bed Volume
(d) Naproxen

137
Figure A-7. Simultaneous column regeneration curves of (a) diclofenac, (b) ibuprofen,
(c) ketoprofen, and (d) naproxen using a 5% NaCl, equal-volume water–methanol solution. Regeneration was performed after the column was saturated with each pharmaceutical (i.e. influent = effluent) and reused for a total of three cycles.
0.0
1.0
2.0
3.0
4.0
0 4 8 12 16 20 24
Ce
, m
mo
l/L
Bed Volume
(a) DiclofenacCycle 1
Cycle 2
Cycle 3
0.00
0.25
0.50
0.75
0 4 8 12 16 20 24
Ce
, m
mo
l/L
Bed Volume
(b) IbuprofenCycle 1
Cycle 2
Cycle 3
0.0
0.5
1.0
1.5
0 4 8 12 16 20 24
Ce
, m
mo
l/L
Bed Volume
(c) Ketoprofen Cycle 1
Cycle 2
Cycle 3
0.0
0.5
1.0
1.5
2.0
0 4 8 12 16 20 24
Ce,
mm
ol/L
Bed Volume
(d) Naproxen Cycle 1
Cycle 2
Cycle 3

138
Column Mass Balance
The following equations summarize the calculations used for the pharmaceutical
mass balance. The mass of pharmaceuticals removed from urine (Mrem) and desorbed
(Mdesorb) from the AER column over three treatment and regeneration cycles was
performed by trapezoidal numerical integration of the column saturation and
regeneration curves using MATLAB (8.2.0.701 R2013b) software. For cycle 1, the mass
of pharmaceutical removed from urine (Mrem) was equivalent to the mass of
pharmaceutical sorbed onto the fresh resin (Msorb). After regeneration, the amount
remaining on the resin (Mfoul) was determined by subtracting Msorb from Mdesorb. For
cycles 2 and 3, the Msorb was the summation of the Mrem during each cycle and Mfoul
from the previous cycle.
C0 = influent concentration in urine (µmol/L)
Ce = effluent concentration in urine (µmol/L)
Cr = effluent concentration in regeneration solution (µmol/L)
Mrem = mass removed from urine (µmol)
Msorb = mass sorbed onto resin (µmol)
Mdesorb = mass desorbed from resin (µmol)
Mfoul = mass remaining on resin (µmol)
Vu = volume of urine treated (L)
Vr = volume of regeneration solution (L)

139
Cycle 1:
𝑀𝑟𝑒𝑚1= 𝑀𝑠𝑜𝑟𝑏1
= ∫ (𝐶0 − 𝐶𝑒)𝑑𝑉𝑉𝑢
𝑉0 (A-8)
𝑀𝑑𝑒𝑠𝑜𝑟𝑏1= ∫ 𝐶𝑟𝑑𝑉
𝑉𝑟
𝑉0 (A-9)
𝑀𝑓𝑜𝑢𝑙1= 𝑀𝑠𝑜𝑟𝑏1
− 𝑀𝑑𝑒𝑠𝑜𝑟𝑏1 (A-10)
Cycle 2:
𝑀𝑟𝑒𝑚2= ∫ (𝐶0 − 𝐶𝑒)𝑑𝑉
𝑉𝑢
𝑉0 (A-11)
𝑀𝑠𝑜𝑟𝑏2= 𝑀𝑟𝑒𝑚2
+ 𝑀𝑓𝑜𝑢𝑙1 (A-12)
𝑀𝑑𝑒𝑠𝑜𝑟𝑏2= ∫ 𝐶𝑟𝑑𝑉
𝑉𝑟
𝑉0 (A-13)
𝑀𝑓𝑜𝑢𝑙2= 𝑀𝑠𝑜𝑟𝑏2
− 𝑀𝑑𝑒𝑠𝑜𝑟𝑏2 (A-14)
Cycle 3
𝑀𝑟𝑒𝑚3= ∫ (𝐶0 − 𝐶𝑒)𝑑𝑉
𝑉𝑢
𝑉0 (A-15)
𝑀𝑠𝑜𝑟𝑏3= 𝑀𝑟𝑒𝑚3
+ 𝑀𝑓𝑜𝑢𝑙2 (A-16)
𝑀𝑑𝑒𝑠𝑜𝑟𝑏3= ∫ 𝐶𝑟𝑑𝑉
𝑉𝑟
𝑉0 (A-17)
𝑀𝑓𝑜𝑢𝑙3= 𝑀𝑠𝑜𝑟𝑏3
− 𝑀𝑑𝑒𝑠𝑜𝑟𝑏3 (A-18)

140
APPENDIX B SUPPLEMENTARY INFORMATION FOR CHAPTER 3
Estimation of Pharmaceutical Concentrations in Urine
A literature review was conducted to estimate pharmaceutical concentrations in
urine based on total treatment volume in population equivalents (p.e.) or flow rate (L/d),
and pharmaceutical influent loading. Several papers directly measured the mass
loading of pharmaceuticals (g/d) (Guerra et al. 2014, Salgado et al. 2012, Ternes 1998).
Other studies measured pharmaceutical concentrations in the influent wastewater
(Chen et al. 2015, Clara et al. 2005, Ferrando-Climent et al. 2012, Joss et al. 2005,
Lindqvist et al. 2005, Margot et al. 2013, Reungoat et al. 2010, Rosal et al. 2010,
Santos et al. 2007, Zorita et al. 2009). One paper directly measured pharmaceuticals in
urine (Winker et al. 2008b). It was assumed that all pharmaceuticals originated from
excretion in human urine, therefore the theoretical undiluted concentration in urine was
based on a daily urine void volume of 1.6 L/person (FitzGerald et al. 2002, Latini et al.
2004). Excretion rates of the parent compounds and metabolites were obtained from
literature to estimate the concentration of metabolites in urine.
Experimental Methods for Batch Tests
Batch kinetic and equilibrium test results were based on a measured wet weight
density of 0.8183 g/mL. Kinetic and equilibrium tests were only performed for DCF, IBP,
KTP, NPX, and Odm-NPX. A kinetic and equilibrium test was not conducted for KTP-
gluc due to its high cost and expected instability of the metabolite. For the kinetic tests,
flasks were placed on a shaker table and mixed at 350 rpm and removed at pre-
determined contact times (5 min, 30 min, 1 h, 2 h, 6 h, and 24 h). For the equilibrium
tests, samples were dosed with 0.25, 1, 2, 4, and 8 mL/L AER and mixed on a shaker

141
table at 350 rpm for 24 h. For one equilibrium experiment, real human urine was
collected and stored until hydrolysis (pH 9) and spiked with 1,000 µg/L of DCF. An
aliquot of treated urine was taken prior to sample preparation and analysis.
Homogenous Surface Diffusion Model
Briefly, the HSDM describes the mass transport through the filter bed (Eq. B-1)
and intraparticle mass transport through the adsorbent grains described by Fick’s
second law (Eq. B-2).
𝜖𝐵𝜕𝐶
𝜕𝑡+
𝑣𝐹𝜕𝐶
𝜕𝑧+ 3(1 − 𝜖𝐵) (
𝑘𝐿
𝑟𝑝) (𝑐 − 𝑐∗) = 0 (B-1)
𝜕𝑞
𝜕𝑡= 𝐷𝑆 (
𝜕2𝑞
𝜕𝑞2 +2𝜕𝑞
𝑟𝜕𝑟) (B-2)
Where εB is the bed porosity; q is the solid phase concentration (M/M); t is the
time coordinate (t); vF is the superficial velocity (L/t); kL is the liquid phase mass transfer
coefficient (L/t); rp is the AER particle radius (L); c and c* (M/L3) are the liquid phase
concentration in the bulk solution and exterior adsorbent surface, respectively; Ds is the
surface diffusion coefficient (L2/t); and r is the radial coordinate (L). The HSDM assumes
plug flow conditions in the fixed bed, liquid-phase and solid phase mass transfer,
constant flow, and constant diffusion coefficients, adsorbent grains are assumed to be
spherical and the adsorption equilibrium can be described by the Freundlich isotherm
(Eq. B-3).
𝑞𝑒 = 𝐾𝐹𝐶𝑒1/𝑛
(B-3)
A more detailed explanation of the model used in Fast 2.1beta may be found in
Sperlich et al. (2008). The input parameters for Fast 2.1beta included liquid mass
transfer and surface diffusion coefficients (Table B-8 and Table B-9), column operation
parameters (Table B-10) and AER properties (Table B-11). To validate the models,

142
experimental data from previously published research was fit to the HSDM (Landry and
Boyer 2016). An additional simplified fixed-bed column experiment was conducted by
dosing 0.2 mmol/L of DCF in synthetic ureolyzed urine without endogenous metabolites
following the same conditions previously described in Landry and Boyer (2016), using
Dowex Marathon 11 AER.
The Gnielinski correlation for packed beds was used to estimate the liquid-phase
mass transfer coefficient (Eq. B-4 ) (Crittenden et al. 2012). Liquid-phase mass transfer
is a function of the liquid-phase diffusion coefficient (Dl), Reynolds number (Re) and
Schmidt number (Sc), which may be calculated using Eq. B-5 through B-7, respectively.
The liquid diffusivity was calculated using the Hayduk–Laudie correlation (Crittenden et
al. 2012). The molar volume (Vb) of the solutes was calculated using the group
contribution method (Fedors 1974). A table of nomenclature used in Eq. C4–S7 is listed
in Table B-1. The fluid density and viscosity of urine were assumed to be the same as
water at 25°C (Table B-2). The values for Vb, Dl, and kl used in column modeling are
listed in Table B-3.
𝑘𝐿 =[1+1.5(1−𝜖𝐵)]𝐷𝐿
𝑑𝑝(2 + 0.644𝑅𝑒
1
2𝑆𝑐1
3) (B-4)
𝐷𝐿 =13.26×10⁻⁹
𝜇𝑙1.14𝑉𝑏
0.589 (B-5)
𝑅𝑒 =(𝜌𝑙)(𝜙)(𝑑𝑃)(𝑣𝑙)
(𝜖𝐵)(𝜇𝑙) (B-6)
𝑆𝑐 =𝜇𝑙
(𝜌𝑙)(𝐷𝐿) (B-7)
Batch kinetic data was used to estimate the NPX, and Odm-NPX surface
diffusion coefficients (Ds) (Table B-4) using the method developed by (Zhang et al.

143
2009). Kinetic data was used to calculate the dimensionless concentration 𝐶�̅�𝑎𝑡𝑎 at
time, t using Eq. B-8,
𝐶�̅�𝑎𝑡𝑎 =𝐶𝑡−𝐶𝑒
𝐶0−𝐶𝑒 (B-8)
Where C is the liquid-phase concentration at time t, C0 is the initial liquid-phase
concentration, and Ce is the equilibrium concentration determined by the Freundlich
isotherm. The values for 𝐶�̅�𝑜𝑑𝑒𝑙 were calculated using Eq. B-9,
𝐶�̅�𝑜𝑑𝑒𝑙 = 𝐴0 + 𝐴1(ln 𝑡̅) + 𝐴2(ln 𝑡̅)2 + 𝐴3(ln 𝑡̅)3 (B-9)
where the coefficients A1, A2, and A3 are parameters specific to the Freundlich
parameter 1/n, and Ce/C0 and may be found in (Zhang et al. 2009); and 𝑡̅ is the
dimensionless time (Dst/rp2) where rp is the particle radius. The experimental data was fit
to the model by optimizing Ds/rp2 by minimizing the objective function (Eq. B-10) using
the Solver function in Excel.
𝑂𝐹 = √∑ (𝐶̅𝑑𝑎𝑡𝑎,𝑖−�̅�𝑚𝑜𝑑𝑒𝑙,𝑖)2𝑛
𝑖=1
𝑛−1 (B-10)
This method for determining Ds is limited to data with Freundlich parameters 0.1
< 1/n < 0.9. For this reason, Ds for DCF, KTP and DCF in real urine was estimated
using the correlation developed by Crittenden et al. (1987), which relates the surface
diffusion flux to the pore diffusion flux (Eq. B-11 and Eq. B-12).
𝐷𝑠 = (𝑆𝑃𝐷𝐹𝑅)(𝑃𝐷𝐹𝐶) (B-11)
𝑃𝐷𝐹𝐶 =(𝜖𝑃)(𝐶0)(𝐷𝐿)
(𝜌𝑃)(𝐾𝐹𝐶0
1𝑛)(𝜏𝑃)
(B-12)
Where SPDFR is the surface-to-pore diffusion flux ratio, assumed to be 0.4 due
to the presence of DOC; PDFC is the pore diffusion flux; εp is the particle porosity; C0 is
the initial phase of the solute in the liquid phase; ρp is the particle density; KF is the

144
Freundlich isotherm parameter; and τp is the particle tortuosity, assumed to be 1
because its effects are accounted for in the SPDFR.
Fast2.1beta software predicts fixed-bed column breakthrough using the
homogenous surface diffusion model (HSDM) but is limited for case where the
Freundlich parameter 0.01 < 1/n < 1.05. For irreversible isotherms (e.g., 1/n = 0), Wicke
(1939) provided a solution to the HSDM in Eq. B-13
𝐶̅(𝑧̅ = 1, 𝑇) = 1 −6
𝜋2∑
1
𝑘2 exp (−𝑘2 {𝜋2𝐸𝑑 [𝑇(𝐷𝑔+1)−1
𝐷𝑔− 1] + 0.64}) …∞
𝑘=1 (B-13)
Where 𝐶̅ is the is the reduced fluid-phase concentration as a function of mass
throughput (T) calculated in Eq. B-14 and reduced axial position (𝑧̅), Dg is the solute
distribution parameter, calculated by Eq. B-15, Ed is the diffusivity modular, calculated
by Eq. B-16, and k is an integer constant.
𝑇 =𝑡
𝐸𝐵𝐶𝑇∗𝜖𝐵(𝐷𝑔+1) (B-14)
𝐷𝑔 =𝜌𝐵𝑞𝑒(1−𝜖𝐵)
𝜖𝐵𝐶0 (B-15)
𝐸𝑑 =𝐷𝑠𝐷𝑔𝐸𝐵𝐶𝑇(𝜖𝐵)
(𝑑𝑝
2)
2 (B-16)

145
Table B-1. Active ingredient and metabolite structure and chemical properties. Compound, CAS, molecular weight Structure pKa logKow Diclofenac sodium 15307-79-6 318.1 ≥98% purity
4.15a 4.51a
4’-Hydroxy diclofenac 64118-84-9 312.2 98% purity
3.76b 3.96b
Ibuprofen sodium 31121-93-4 228.26 ≥98% purity
4.9a 3.97a
Hydroxy ibuprofen 53949-53-4 222.3 98% purity
4.55b 2.69b
Ketoprofen 22071-15-4 254.28 ≥98% purity
3.88b 3.61b
Ketoprofen acyl glucuronide 76690-94-3 430.4 98% purity
3.24b 1.67 b
Naproxen 26159-34-2 252.24 98%–102% purity
4.15a 3.18a
O-Desmethylnaproxen 52079-10-4 216.23 98% purity
4.31 b 2.84 b
aTOXNET (2016)
bChemAxon (2016)

146
Table B-2. Synthetic ureolyzed urine composition adapted from Landry et al. (2015). Chemical Synthetic urine Real urine
NaCl, mmol/L 60 n.a.b
Na2SO4, mmol/L 15 n.a. KCl, mmol/L 40 n.a. NH4OH, mmol/L 250 n.a. NaH2PO4, mmol/L 14 n.a. NH4HCO3, mmol/L 250 n.a. Citrate, mmol/L 2.49 n.a. Creatinine, mmol/L 0.56 n.a. Glycine, mmol/L 1.24 n.a. Hippurate, mmol/L 2.80 n.a. L-Cysteine, mmol/L 0.81 n.a. Taurine, mmol/L 0.99 n.a. TOC, mg C/La 1,280 3,220 Conductivity, mS/cma 39.7 20.8 a Measured b Not analyzed
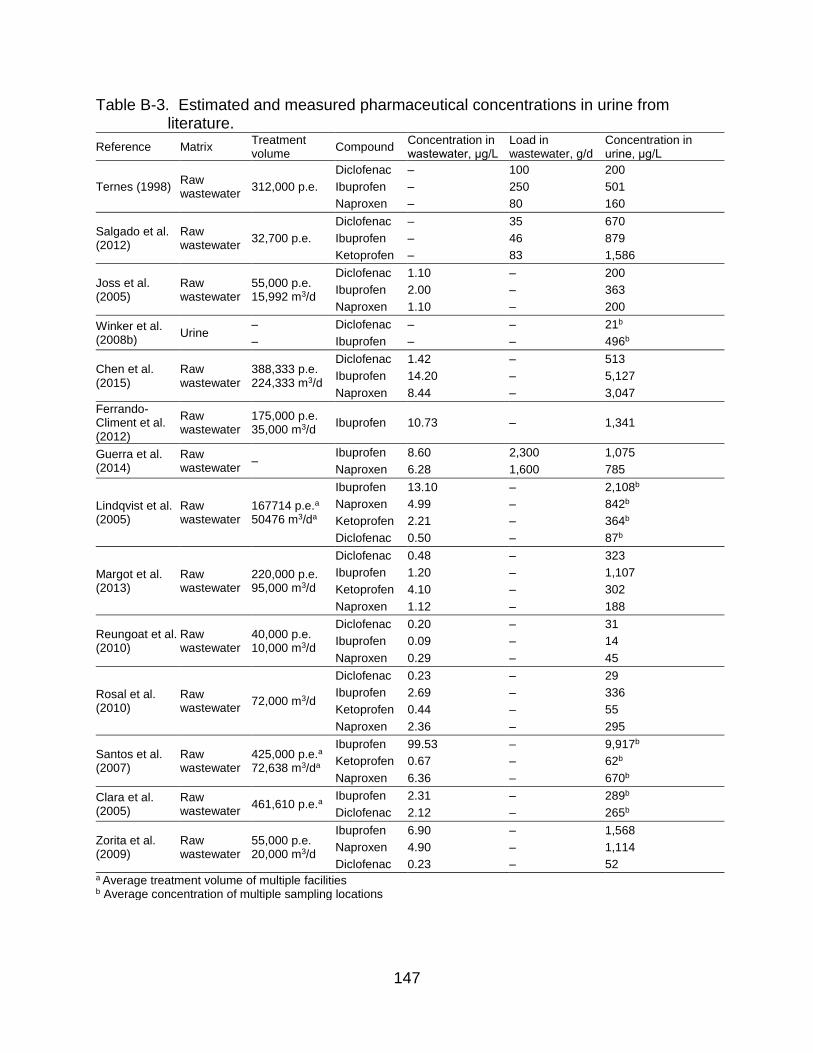
147
Table B-3. Estimated and measured pharmaceutical concentrations in urine from literature.
Reference Matrix Treatment volume
Compound Concentration in wastewater, μg/L
Load in wastewater, g/d
Concentration in urine, μg/L
Ternes (1998) Raw wastewater
312,000 p.e.
Diclofenac – 100 200
Ibuprofen – 250 501
Naproxen – 80 160
Salgado et al. (2012)
Raw wastewater
32,700 p.e.
Diclofenac – 35 670
Ibuprofen – 46 879
Ketoprofen – 83 1,586
Joss et al. (2005)
Raw wastewater
55,000 p.e. 15,992 m3/d
Diclofenac 1.10 – 200
Ibuprofen 2.00 – 363
Naproxen 1.10 – 200
Winker et al. (2008b)
Urine – Diclofenac – – 21b
– Ibuprofen – – 496b
Chen et al. (2015)
Raw wastewater
388,333 p.e. 224,333 m3/d
Diclofenac 1.42 – 513
Ibuprofen 14.20 – 5,127
Naproxen 8.44 – 3,047
Ferrando-Climent et al. (2012)
Raw wastewater
175,000 p.e. 35,000 m3/d
Ibuprofen 10.73 – 1,341
Guerra et al. (2014)
Raw wastewater
– Ibuprofen 8.60 2,300 1,075
Naproxen 6.28 1,600 785
Lindqvist et al. (2005)
Raw wastewater
167714 p.e.a 50476 m3/da
Ibuprofen 13.10 – 2,108b
Naproxen 4.99 – 842b
Ketoprofen 2.21 – 364b
Diclofenac 0.50 – 87b
Margot et al. (2013)
Raw wastewater
220,000 p.e. 95,000 m3/d
Diclofenac 0.48 – 323
Ibuprofen 1.20 – 1,107
Ketoprofen 4.10 – 302
Naproxen 1.12 – 188
Reungoat et al. (2010)
Raw wastewater
40,000 p.e. 10,000 m3/d
Diclofenac 0.20 – 31
Ibuprofen 0.09 – 14
Naproxen 0.29 – 45
Rosal et al. (2010)
Raw wastewater
72,000 m3/d
Diclofenac 0.23 – 29
Ibuprofen 2.69 – 336
Ketoprofen 0.44 – 55
Naproxen 2.36 – 295
Santos et al. (2007)
Raw wastewater
425,000 p.e.a 72,638 m3/da
Ibuprofen 99.53 – 9,917b
Ketoprofen 0.67 – 62b
Naproxen 6.36 – 670b
Clara et al. (2005)
Raw wastewater
461,610 p.e.a Ibuprofen 2.31 – 289b
Diclofenac 2.12 – 265b
Zorita et al. (2009)
Raw wastewater
55,000 p.e. 20,000 m3/d
Ibuprofen 6.90 – 1,568
Naproxen 4.90 – 1,114
Diclofenac 0.23 – 52 a Average treatment volume of multiple facilities b Average concentration of multiple sampling locations
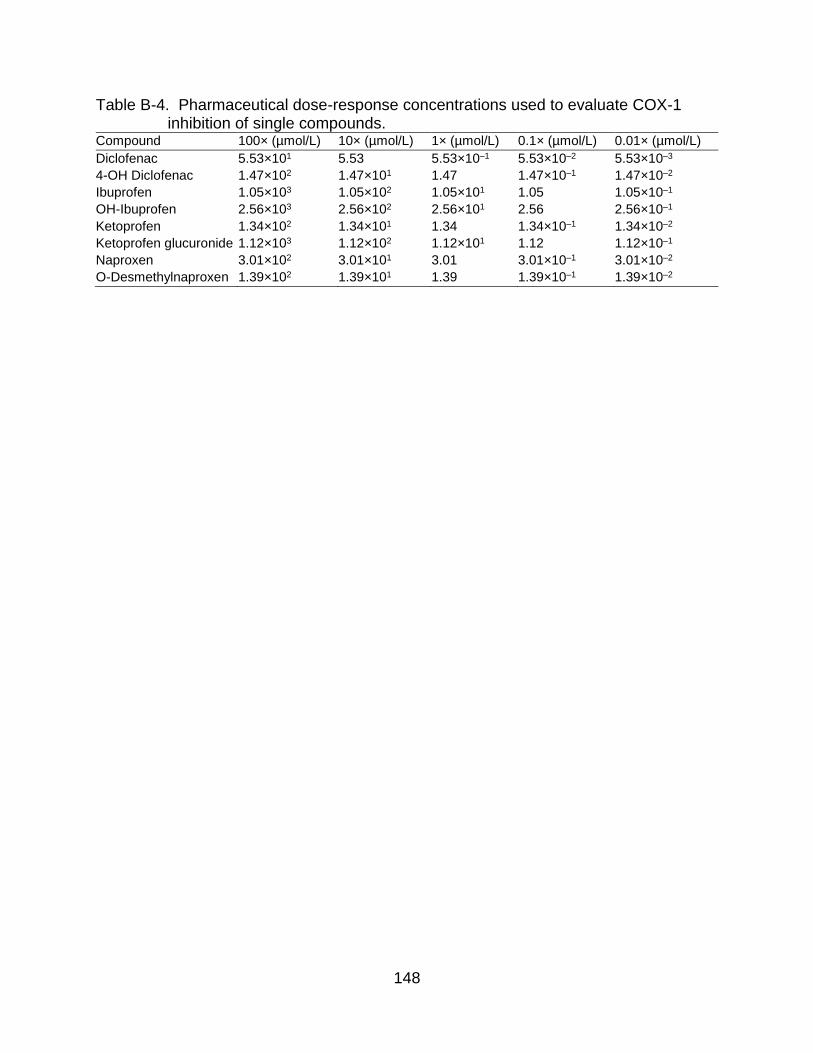
148
Table B-4. Pharmaceutical dose-response concentrations used to evaluate COX-1 inhibition of single compounds.
Compound 100× (µmol/L) 10× (µmol/L) 1× (µmol/L) 0.1× (µmol/L) 0.01× (µmol/L)
Diclofenac 5.53×101 5.53 5.53×10⁻¹ 5.53×10⁻² 5.53×10⁻³
4-OH Diclofenac 1.47×10² 1.47×101 1.47 1.47×10⁻¹ 1.47×10⁻²
Ibuprofen 1.05×10³ 1.05×10² 1.05×101 1.05 1.05×10⁻¹
OH-Ibuprofen 2.56×10³ 2.56×10² 2.56×101 2.56 2.56×10⁻¹
Ketoprofen 1.34×10² 1.34×101 1.34 1.34×10⁻¹ 1.34×10⁻²
Ketoprofen glucuronide 1.12×10³ 1.12×10² 1.12×101 1.12 1.12×10⁻¹
Naproxen 3.01×10² 3.01×101 3.01 3.01×10⁻¹ 3.01×10⁻²
O-Desmethylnaproxen 1.39×10² 1.39×101 1.39 1.39×10⁻¹ 1.39×10⁻²

149
Table B-5. Pharmaceutical dose-response concentrations used to evaluate COX-1
inhibition of the pharmaceutical mixture. Compound 100× (µmol/L) 10× (µmol/L) 1× (µmol/L) 0.1× (µmol/L) 0.01× (µmol/L)
Diclofenac 5.06×101 5.06 5.06×10⁻¹ 5.06×10⁻² 5.06×10⁻³
Ketoprofen 9.78×101 9.78 9.78×10⁻¹ 9.78×10⁻² 9.78×10⁻³
Ketoprofen glucuronide 1.24×10³ 1.24×10² 1.24×101 1.24 1.24×10⁻¹
Naproxen 2.19×10² 2.19×101 2.19 2.19×10⁻¹ 2.19×10⁻²
O-Desmethylnaproxen 8.63×101 8.63 8.63×10⁻¹ 8.63×10⁻² 8.63×10⁻³
Total 1.69×10³ 1.69×10² 1.69×101 1.69 1.69×10⁻¹
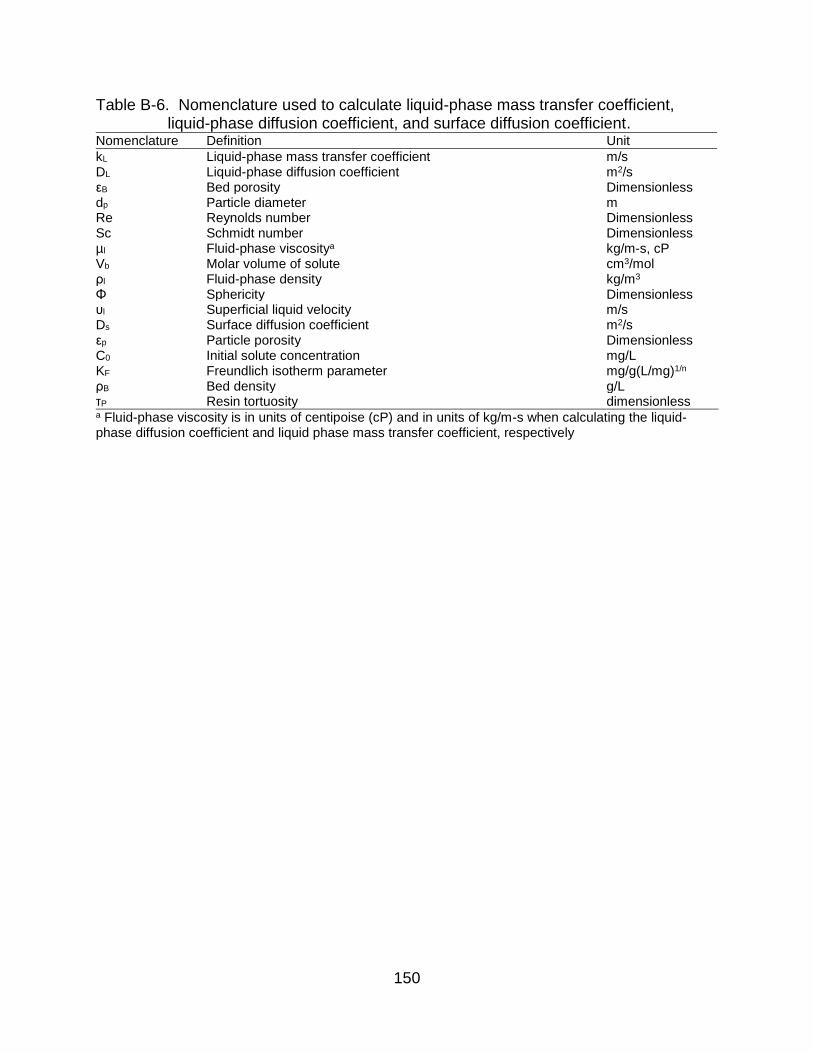
150
Table B-6. Nomenclature used to calculate liquid-phase mass transfer coefficient, liquid-phase diffusion coefficient, and surface diffusion coefficient.
Nomenclature Definition Unit
kL Liquid-phase mass transfer coefficient m/s DL Liquid-phase diffusion coefficient m2/s εB Bed porosity Dimensionless dp Particle diameter m Re Reynolds number Dimensionless Sc Schmidt number Dimensionless µl Fluid-phase viscositya kg/m-s, cP Vb Molar volume of solute cm3/mol ρl Fluid-phase density kg/m3
Φ Sphericity Dimensionless υl Superficial liquid velocity m/s Ds Surface diffusion coefficient m2/s εp Particle porosity Dimensionless C0 Initial solute concentration mg/L KF Freundlich isotherm parameter mg/g(L/mg)1/n
ρB Bed density g/L τP Resin tortuosity dimensionless a Fluid-phase viscosity is in units of centipoise (cP) and in units of kg/m-s when calculating the liquid-phase diffusion coefficient and liquid phase mass transfer coefficient, respectively

151
Table B-7. Urine properties assumed to be equivalent to water at 25°C.
Viscosity (µl), cP 0.89 Density (ρl), kg/m3 997

152
Table B-8. Molar volume (Vb), liquid diffusivity (DL), and liquid-phase mass transfer coefficients (kL).
Pharmaceutical Vb, cm3/mol DL, m2/s kL, m/s
Diclofenac 186.9 6.95×10⁻¹⁰ 1.84×10⁻⁵ Ketoprofen 195.6 6.77×10⁻¹⁰ 1.81×10⁻⁵ Naproxen 165.1 7.48×10⁻¹⁰ 1.95×10⁻⁵ O-Desmethylnaproxen 137.8 8.32×10⁻¹⁰ 2.12×10⁻⁵

153
Table B-9. Surface diffusion coefficient (Ds). Pharmaceutical Ds, m2/s
Diclofenac 6.97×10⁻¹⁴ Ketoprofen 4.43×10⁻¹³ Naproxen 8.78×10⁻¹⁴ O-Desmethylnaproxen 1.76×10⁻¹³
Diclofenac, real urine 7.18×10⁻¹³
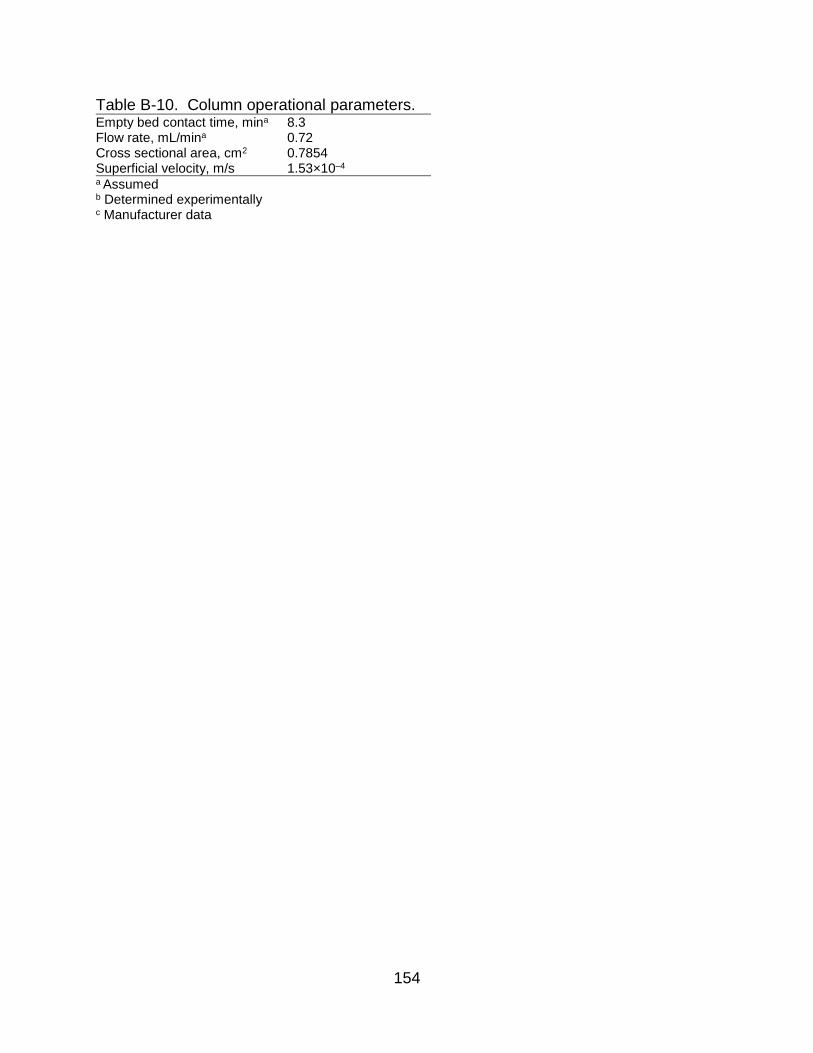
154
Table B-10. Column operational parameters. Empty bed contact time, mina 8.3 Flow rate, mL/mina 0.72 Cross sectional area, cm2 0.7854 Superficial velocity, m/s 1.53×10⁻⁴
a Assumed b Determined experimentally c Manufacturer data

155
Table B-11. Resin properties. Wet resin bed density (ρB), g/mLb 0.8183 Particle density (ρp), g/mLc 1.1 Particle diameter (dp), µmc 450 Bed porosity (εB)
0.27 Particle porosity (εP) d 0.59 Particle sphericity (Φ) a 0.9 a Assumed b Determined experimentally c Manufacturer data d Particle porosity is calculated by the equation 1–ρP/ ρs, where ρs is the density of graphite (2.2 g/mL) e Assumed from literature

156
Table B-12. Freundlich isotherm parameters. Pharmaceutical KF, (µmol/g)(L/g)1/nF 1/nF SSE R2
Diclofenac 1.871 1.050 1.476 0.90 Ibuprofen 0.310 0.313 0.424 0.01 Ketoprofen 0.374 1.72×10⁻⁸ 0.013 0.00 Naproxen 0.436 0.738 0.288 0.63 O-Desmethylnaproxen 1.250 0.865 1.343 0.88 Diclofenac, real urine 0.134 0.061 0.009 0.11

157
Table B-13. Hill model parameters from the COX-1 inhibition bioassays, including 95% confidence intervals, and goodness of fit measures for Diclofenac (DCF), Ketoprofen (KTP), Naproxen (NPX), Ketoprofen glucuronide (KTP gluc), O-desmethylnaproxen (Odm-NPX), and a pharmaceutical mixture (Mix).
DCF KTP NPX KTP gluc Odm-NPX Mix
I0 1% 0% 20% 0% 13% 0%
Imax 105% 100% 58% 100% 44% 100%
H 1.12 0.69 0.99 2.00 1.03 1.00
IC50, µmol/L 0.24 (0.161, 0.341)
1.30 (0.487, 2.12)
16.8 (–6.71, 40.2)
73.1 (52, 119)
4.13 (–0.486, 2.55)
9.73 (2.90, 16.8)
SSE 0.021 0.163 0.054 0.079 0.034 0.094
R2 0.987 0.926 0.851 0.967 0.827 0.955
dfe 9 13 11 13 8 10
Adjusted R2 0.984 0.921 0.810 0.964 0.762 0.951
RMSE 0.049 0.112 0.070 0.078 0.065 0.097

158
Table B-14. Alternative Hill model parameters from the COX-1 inhibition bioassays, including 95% confidence intervals, and goodness of fit measures for Naproxen (NPX), and O-desmethylnaproxen (Odm-NPX) where I0 and Imax
bounds extrapolated to 0% and 100%, respectively. NPX Odm-NPX
I0 0% 0%
Imax 100% 100%
H 0.21 0.21
IC50, µmol/L 132 (–40, 305) 416 (–493, 1235)
SSE 0.076 0.041
R2 0.787 0.794
dfe 13 10
Adjusted R2 0.771 0.773
RMSE 0.077 0.064

159
Table B-15. In vivo chronic toxicity data for organisms exposed to diclofenac, ibuprofen, naproxen, and ketoprofen. Compound Organism End point Exposure time EC50, μmol/L NOEC, μmol/L LOEC, μmol/L Reference
Diclofenac M. galloprovincialis Larvae development 48 h
3.14×10⁻⁶ 3.14×10⁻⁵ (Fabbri et al. 2014)
Rainbow trout Histopathology 95 d
1.01
(Memmert et al. 2013)
D. magna Reproduction 21 d
26.1
(Lee et al. 2011)
O. latipes Survival 30 dph
31.4
(Lee et al. 2011)
O. latipes Survival 77 dph
31.4
(Lee et al. 2011)
M. macrocopa Reproduction 7 d
52.5
(Lee et al. 2011)
D. magna Survival 21 d
78.6
(Lee et al. 2011)
M. macrocopa Survival 7 d
157
(Lee et al. 2011)
Ibuprofen O. latipes Adult survival 120 dph
4.38×10⁻⁴
(Han et al. 2010)
O. latipes Adult survival 90 dph
4.38×10⁻³
(Han et al. 2010)
O. latipes Reproduction 120 dph
4.38×10⁻³
(Han et al. 2010)
M. galloprovincialis Larvae development 48 h
4.38×10⁻² 0.438 (Fabbri et al. 2014)
O. latipes Juvenile survival 30 dph
0.438
(Han et al. 2010)
Hydra attenuata Morphology 96 h 7.23 4.38 0.438 (Quinn et al. 2008)
D. magna Reproduction 21 d
5.39
(Han et al. 2010)
Hydra attenuata Feeding 96 h 16.9
(Quinn et al. 2008)
Naproxen Hydra attenuata Morphology 96 h 10.4 21.9 4.38 (Quinn et al. 2008)
C. dubia Growth/reproduction inhibition 7 d 1.31
(Isidori et al. 2005)
B. calyciflorus Growth/reproduction inhibition 48 h 2.22
(Isidori et al. 2005)
Hydra attenuata Feeding 96 h 10.6
(Quinn et al. 2008)
P. subcapitata Growth/reproduction inhibition 72 h 126
(Isidori et al. 2005)
L. peronii Tactile responsiveness 72 h 132
(Melvin et al. 2014)
L. peronii Tactile responsiveness 96 h 132
(Melvin et al. 2014)
L. peronii Tactile responsiveness 24 h 149
(Melvin et al. 2014) L. peronii Tactile responsiveness 48 h 149
(Melvin et al. 2014)
Ketoprofen P. subcapitata Growth 72 h 96.7 39.1 (Watanabe et al. 2016)
C. dubia Reproduction 6 d 116 88.5 (Watanabe et al. 2016)
Zebrafish Reproduction 9 d 58.6 24.6 (Watanabe et al. 2016)

160
Figure B-1. Fixed bed ion-exchange removal of diclofenac (DCF) by Dowex Marathon
11 fit to the homogenous surface diffusion model (HSDM).
0
0.2
0.4
0.6
0.8
1
0 2000 4000 6000
C/C
0
Bed Volume
DCF, 0.2 mmol/LHSDMR2 = 0.98SSE = 1.22

161
Figure B-2. Fixed bed ion-exchange removal of diclofenac (DCF), ketoprofen (KTP),
and naproxen (NPX) in synthetic ureolyzed urine using Dowex 22 fit to the homogenous surface diffusion model (HSDM). Data reproduced from (Landry and Boyer 2016).
0.00
0.20
0.40
0.60
0.80
1.00
0 1000 2000 3000 4000
C/C
0
Bed Volume
DCF, C0 = 4.5 μM DCF HSDMKTP, C0 = 5.9 μM KTP HSDMNPX, C0 = 5.1 μM NPX HSDM

162
Figure B-3. Cyclooxygenase subtype-1 inhbition curves for (a) diclofenac (DCF), (b)
ketoprofen (KTP), (c) naproxen (NPX), and (d) O-desmethylnaproxen (Odm-NPX). The symbols are the mean triplicate samples with error bars showing one standard deviation.
0%
20%
40%
60%
80%
100%%
CO
X-1
Inhib
itio
n
Concentration, µmol/L
(a)
DCF
Hill model
10–4 10–2 100 102 104 -20%
0%
20%
40%
60%
80%
100%
% C
OX
-1 Inhib
itio
n
Concentration, µmol/L
(b)
KTP
Hill model
10–3 10–1 101 103 105
0%
20%
40%
60%
80%
100%
% C
OX
-1 Inhib
itio
n
Concentration, µmol/L
(c) NPX
Hill model
10–4 10–2 100 102 104
-20%
0%
20%
40%
60%
80%
100%
% C
OX
-1 Inhib
itio
n
Concentration, µmol/L
(d) Odm-NPX
Hill model
10–3 10–1 101 103 105

163
Figure B-4. Alternative cyclooxygenase subtype-1 inhbition curves for (a) naproxen
(NPX), and (b) O-desmethylnaproxen (Odm-NPX) with I0 and Imax extrapolated to 0% and 100%, respectively. The symbols are the mean triplicate samples with error bars showing one standard deviation.
0%
20%
40%
60%
80%
100%%
CO
X-1
Inhib
itio
n
Concentration, µmol/L
(a) NPX
Hill model
10–5 10–3 10–1 101 103 105
0%
20%
40%
60%
80%
100%
% C
OX
-1 Inhib
itio
n
Concentration, µmol/L
(b) Odm-NPX
Hill model
10–5 10–3 10–1 101 103 105 107

164
Figure B-5. Alternative predicted COX-1 inhibition as a function of bed volumes treated
by fixed bed ion-exchange of (a) naproxen (NPX) (C0 = 3.0 µmol/L), and (b) O-desmethylnaproxen (Odm-NPX) (C0 = 1.4 µmol/L) for dose-response with I0 and Imax extrapolated to 0% and 100%, respectively.
0%
20%
40%
60%
80%
100%
0 200 400 600 800 1000Bed Volume
(a)
C/C0×100%
% Inhibition
0%
20%
40%
60%
80%
100%
0 500 1000 1500 2000 2500 3000Bed Volume
(b)
C/C0×100%
% Inhibition

165
Figure B-6. Cyclooxygenase subtype-1 inhbition curves for (a) ibuprofen (IBP), (b) OH-
ibuprofen (OH-IBP), (c) 4’OH-diclofenac (OH-DCF), and (d) ketoprofen glucuronide (KTP gluc). The symbols are the mean triplicate samples with error bars showing one standard deviation.
-50%
-25%
0%
25%
50%
75%
100%%
CO
X-1
Inhib
itio
n
Concentration, µmol/L
(a)
100 101 102 103 104 -25%
0%
25%
50%
75%
100%
% C
OX
-1 Inhib
itio
n
Concentration, µmol/L
(b)
100 101 102 103 104
-25%
0%
25%
50%
75%
100%
% C
OX
-1 Inhib
itio
n
Concentration, µmol/L
(c)
10–1 100 101 102 103 -20%
0%
20%
40%
60%
80%
100%
% C
OX
-1 Inhib
itio
n
Concentration, µmol/L
(d)
KTP gluc
Hill model
10–2 100 102 104 106

166
Figure B-7. ToxCast database in vitro bioassays for various endpoints plotted as a function of the concentration that induces 50% activity (AC50) for (a) diclofenac and (b) ibuprofen. For figure (a), the data points within the circle are the results from COX-1 and COX-2 inhbition bioassays from ToxCast and this study.

167
Figure B-8. Predicted column breakthrough curves as a function of mass removal and
COX-1 inhibition for diclofenac ion-exchange in real urine (C0 = 0.55 µmol/L).
0%
20%
40%
60%
80%
100%
0 200 400 600 800 1000
Bed Volume
C/C0×100%
% Inhibition

168
Figure B-9. Isotherm data for ion-exchange removal of (a) diclofenac, (b) ibuprofen, (c)
ketoprofen, (d) naproxen and (e) O-desmethylnaproxen in synthetic urine with and without metabolites and real human urine (DCF only). Isotherm data without metabolites reproduced from Landry et al. (2015). The symbols are the mean triplicate samples with error bars showing one standard deviation.
0
2
4
6
0 1 2 3
qe,
µm
ol/g
Ce, µmol/L
(a) Diclofenac
No metabolites
Metabolites
Real urine
0
1
2
3
4
0 1 2 3 4
qe,
µm
ol/g
Ce, µmol/L
(b) Ibuprofen
No metabolitesMetabolites
0
1
2
3
4
0 1 2 3 4
qe,
µm
ol/g
Ce, µmol/L
(c) Ketoprofen
No metabolites
Metabolites
0
1
2
3
4
0 1 2 3 4
qe,
µm
ol/g
Ce, µmol/L
(d) Naproxen
No metabolites
Metabolites
0
1
2
3
4
0 1 2 3 4
qe,
µm
ol/g
Ce, µmol/L
(e) O-Desmethylnaproxen
Metabolites

169
Figure B-10. Kinetic data for ion-exchange removal of (a) diclofenac, (b) ibuprofen, (c)
ketoprofen, and (d) naproxen and (e) O-desmethylnaproxen in synthetic urine with and without metabolites and real human urine (DCF only). The symbols are the mean duplicate samples.
0
0.2
0.4
0.6
0.8
1
0 500 1000 1500
C/C
0
Time, min
(a) DiclofenacC0 = 2.2 µmol/L
0
0.2
0.4
0.6
0.8
1
0 500 1000 1500
C/C
0
Time, min
(b) IbuprofenC0 = 3.2 µmol/L
0
0.2
0.4
0.6
0.8
1
0 500 1000 1500
C/C
0
Time, min
(c) KetoprofenC0 = 3.0 µmol/L
0
0.2
0.4
0.6
0.8
1
0 500 1000 1500
C/C
0
Time, min
(d) NaproxenC0 = 3.7 µmol/L
170
APPENDIX C SUPPLEMENTARY INFORMATION FOR CHAPTER 4
Determination of Functional Unit
Urine production at the University of Florida (UF) was estimated from solid waste
production according to UF annual refuse routes (personal communication with UF
Physical Plant Department). The refuse routes included collection locations, collection
days (e.g., Monday–Thursday, Monday and Thursday only), and dumpster volumes.
Some buildings shared dumpsters, which are labeled according to the nearest building.
If one building or cluster of buildings (e.g., dormitories) had multiple dumpsters, they
were consolidated into one cumulative-volume dumpster. This reduced a total of 188
urine-producing buildings to 125 decentralized collection areas. UF student, faculty, and
staff produce 1.46 lb waste/person∙d (0.662 kg waste/person∙d) and 0.76 lb
waste/person∙d (0.345 kg waste/person∙d) of that waste is landfilled (Townsend et al.
2015). The approximate density of landfilled waste at UF is 75.4 lb/yd3 (44.7 kg/m3)
(Townsend et al. 2015). It was assumed that at the time of collection, the dumpsters
were filled to capacity (personal communication with UF Physical Plant Division), and
non-collection days the dumpsters were assumed to be empty. Building-level waste
production and per capita waste production were used to estimate daily building
occupancy (Eq. C-1).
𝐵𝑢𝑖𝑙𝑑𝑖𝑛𝑔 𝑜𝑐𝑐𝑢𝑝𝑎𝑛𝑐𝑦 = (𝐷𝑢𝑚𝑝𝑠𝑡𝑒𝑟 𝑐𝑎𝑝𝑎𝑐𝑖𝑡𝑦, 𝑦𝑑3) (75.4𝑙𝑏
𝑦𝑑3) (𝑝𝑒𝑟𝑠𝑜𝑛−𝑑𝑎𝑦
0.76 𝑙𝑏) (C-1)
Daily urination events at the building-level were estimated based on urination
frequency and number of hours a building was assumed to be occupied (Eq. C-2).
According to a 7-day sleep log of 237 people, college-aged students on average sleep
6.40 h per night resulting in 17.6 waking h/d It was assumed that residence halls were
171
occupied for 9.14 h/d (Ishii and Boyer 2015), and all other campus buildings were
occupied for 8 h/d. Outlined in Table C-1 are the average urination volumes and
frequency for asymptomatic men and women (FitzGerald et al. 2002, Latini et al. 2004).
𝑈𝑟𝑖𝑛𝑎𝑡𝑖𝑜𝑛 𝑒𝑣𝑒𝑛𝑡𝑠 = (𝐵𝑢𝑖𝑙𝑑𝑖𝑛𝑔 𝑜𝑐𝑐𝑢𝑝𝑎𝑛𝑐𝑦)(𝐻𝑜𝑢𝑟𝑠 𝑜𝑐𝑐𝑢𝑝𝑖𝑒𝑑, ℎ) ((0.4𝑣𝑜𝑖𝑑𝑠
ℎ) (0.46 ) + (0.45
𝑣𝑜𝑖𝑑𝑠
ℎ) (0.54))
𝑈𝑟𝑖𝑛𝑎𝑡𝑖𝑜𝑛 𝑒𝑣𝑒𝑛𝑡𝑠 = (𝐵𝑢𝑖𝑙𝑑𝑖𝑛𝑔 𝑜𝑐𝑐𝑢𝑝𝑎𝑛𝑐𝑦)(𝐻𝑜𝑢𝑟𝑠 𝑜𝑐𝑐𝑢𝑝𝑖𝑒𝑑, ℎ) (0.428𝑣𝑜𝑖𝑑𝑠
ℎ) (C-2)
Based on enrollment and employment data, UF population is composed of 46%
males and 54% females (UF 2014b, 2015). The volume of urine produced daily was
estimated using Eq. C-3.
𝑉𝑜𝑙𝑢𝑚𝑒 𝑢𝑟𝑖𝑛𝑒 𝑝𝑟𝑜𝑑𝑢𝑐𝑒𝑑,𝐿
𝑑𝑎𝑦= (𝑈𝑟𝑖𝑛𝑎𝑡𝑖𝑜𝑛 𝑒𝑣𝑒𝑛𝑡𝑠) ((0.46) (0.237
𝐿
𝑣𝑜𝑖𝑑) + (0.54) (0.204
𝐿
𝑣𝑜𝑖𝑑))
𝑉𝑜𝑙𝑢𝑚𝑒 𝑢𝑟𝑖𝑛𝑒 𝑝𝑟𝑜𝑑𝑢𝑐𝑒𝑑,𝐿
𝑑𝑎𝑦= (𝑈𝑟𝑖𝑛𝑎𝑡𝑖𝑜𝑛 𝑒𝑣𝑒𝑛𝑡𝑠) (0.219
𝐿
𝑣𝑜𝑖𝑑) (C-3)
Discrete values for urine production was estimated for each day of the week
(Monday–Sunday), therefore the annual urine production was estimated by multiplying
daily urine production by the number of days that campus was assumed to be occupied
during the academic year (Table C-2). The 2014–2015 UF academic calendar was used
to estimate the number of days that students, faculty, and staff were present on campus
(UF 2014a). It was assumed campus was closed over major holidays (e.g.,
Thanksgiving, Christmas, spring break, and breaks between semesters), resulting in no
urine production (Table C-2). Table C-3 lists the estimated daily, 60-day, and annual
urine production for all of University of Florida campus.
Life Cycle Inventory
The following section describes the data sources and design parameters used to
assess the various treatment scenarios.
172
Flush Water
Estimated potable flush water requirements were based on flush water
specifications for conventional toilets (6 L/flush), conventional urinals (3.8 L/flush), and
urine diverting flush toilets (0.05 L/small flush) and the estimated number of urination
events over the course of a year at UF (Ishii and Boyer 2015, Zinckgraf et al. 2014).
Operational phase inputs (e.g., energy, chemicals, raw groundwater) for producing
potable water were included within the life cycle boundary (Ishii and Boyer 2015).
Operational costs for potable water and electricity were based on local utility rates (Ishii
and Boyer 2015).
Centralized Wastewater Treatment
At the WRF, 15% and 32% of wastewater effluent is reused as cooling water at a
cogeneration plant and landscape irrigation across campus, respectively (FDEP 2015a).
The remaining 51% is discharged by deep well injection. Deep well injection of
municipal wastewater is conducted primarily in Florida (U.S. EPA 2012). In the United
States, 14,651 out of 15,837 wastewater treatment plants discharge to surface waters
(Rice and Westerhoff 2015). To make this study transferable across communities in the
U.S. and elsewhere, it was assumed that non-reclaimed wastewater was discharged to
surface water. Only the reclaimed water and surface discharge effluent were considered
within the system boundary of the LCA; water sent to the cogeneration plant was
assumed to have negligible impact on the environment with respect to pharmaceuticals.
Waste sludge collected during secondary clarification is transported off campus to the
city’s wastewater treatment plant for further processing and land application. The
environmental impact of biosolids was considered outside the scope of this study

173
because the treatment facility ceased land application of biosolids in February 2016 and
currently disposes of biosolids in a landfill (personal communication with J.H. Hope,
June 26, 2016). Several alternative disposal options are currently under review. The
most cost effective recommended option is waste-to-energy disposal (GRU 2011).
Furthermore, the effect urine source separation has on the composition of biosolids at
centralized wastewater treatment is unknown. Jimenez et al. (2015) modeled the effect
of urine source separation on biological wastewater treatment but not necessarily how
the composition of biosolids would change, with respect to N and P content. Due to the
complexity of wastewater modeling, the N and P content of biosolids was considered
outside the scope of this model. N and P were assumed to be partially removed by
biological treatment (Ishii and Boyer 2015).
The electricity and cost requirements for urine treatment at the centralized
wastewater treatment plant were based on the influent volumetric flow of urine and urine
flush water and the flow normalized electricity use at the plant. (Ishii and Boyer 2015).
Costs were based on local utility rates (Ishii and Boyer 2015). For scenarios AWWT and
BWWT,O3, the impact of centralized wastewater treatment pertained only to inputs related
to the functional unit, i.e., the influent flow was attributed to the total volume of urine
(11,184 m3) and associated urine flush water from conventional toilets and urinals, and
did not account for additional wastewater inputs (e.g., greywater). Similarly, for
scenarios C–F, the influent flow was attributed to the total volume of urine and urine
flush water from urine diverting flush toilets. At UF, one central department (i.e.,
Physical Plant Division (PPD)) maintains all operations on campus, including irrigation
and grounds maintenance (e.g., fertilization with commercial fertilizers). For all

174
scenarios it was assumed that 84.3% and 49.8% of influent N and P mass loads were
removed during centralized treatment with no nutrient recovery (Ishii and Boyer 2015).
Pharmaceutical removal for each compound was estimated using the average
pharmaceutical removal by biological wastewater treatment in literature (Fernandez-
Fontaina et al. 2012, Hollender et al. 2009, Joss et al. 2005, Lindqvist et al. 2005,
Margot et al. 2013, Rivera-Utrilla et al. 2013, Rosal et al. 2010, Salgado et al. 2012,
Santos et al. 2007, Ternes 1998). The N and P that remain in the fraction of treated
wastewater effluent discharged to surface water was considered an emission. The N
and P in the fraction of treated wastewater used as reclaimed water in landscape
irrigation was assumed to be completely taken up by turf grass. Reclaimed water
containing 9 mg/L N may be applied at a rate of 2 cm/week without N leaching
(Hochmuth et al. 2013). This corresponds to ~8900 kg N/year that may be applied to
UF’s 235 acres of active irrigation on campus. It was estimated that 571 kg N and 558
kg N was applied to landscape irrigated with reclaimed water in scenarios A–B and C–
H, respectively. The mass of pharmaceutical remaining in wastewater effluent was
considered an emission to surface water or an emission to non-industrial, urban land for
the respective fractions discharged to surface water or used as landscape irrigation.
Ozonation of Wastewater
For scenario BWWT,O3, an additional ozonation step was added to the centralized
wastewater treatment plant in scenario AWWT to treat the influent urine and urine flush
water. Pharmaceutical destruction for each compound was estimated using the average
pharmaceutical destruction by ozonation of secondary wastewater in literature
(Hollender et al. 2009, Huber et al. 2003, Margot et al. 2013, Rosal et al. 2010, Ternes
175
1998). The system boundary included the infrastructure requirements for the ozone
contactor, production of oxygen, electricity, transport, and cooling water for ozone
production. The material inputs for infrastructure did not include the ozone generator,
due to a lack of data. The ozone contactor was sized to treat the entire influent flow at
the wastewater treatment plant (i.e., urine, flush water, feces, and greywater). The
ozone contactor was assumed to have an HRT of 5 min and was designed to meet
specifications outlined by Snyder et al. (2014). The ozone contactor was assumed to
have 4 cells (1.2 m/cell), 5.8 m of submergence, and 1.5 m of freeboard. The length and
width of the contactor were 5 m and 0.64 m, respectively (personal communication with
Mike Witwer, 2016). Material inputs for the ozone contactor only included concrete
requirements. The infrastructure costs included the total ozonation system (e.g., ozone
contactor, ozone generator, installation costs, yard piping, landscaping, electrical and
construction, and labor) (Snyder et al. 2014). Inventory data for the operational phase
(e.g., electricity, oxygen, water, and transport) were estimated on the basis of treating 1
m3 of wastewater at a full-scale plant according to Muñoz et al. (2009).
Urine Source Separation Infrastructure
There are 5,666 toilets and 1,237 urinals in 189 buildings on UF campus whose
wastewater is conveyed to the UF WRF. For scenarios C–H it was assumed that the
conventional toilets and urinals were replaced with urine diverting toilets and waterless
urinals. Conventional fixtures were replaced to make a fair economic comparison with
other scenarios that use waterless urinals and urine-diverting flush toilets. Costs for
replacing toilets and urinals (conventional and alternative fixtures) were based on
market prices (Ishii and Boyer 2015, Kohler 2016, U.S. EPA 2016d). It was assumed

176
that the urine diverting toilets had an 80% separation efficiency (Vinnerås 2001), and
that these were used exclusively by women. Waterless urinals were assumed to have
100% separation efficiency. The manufacturing and installation of conventional
(scenarios AWWT and BWWT,O3) and urine diverting fixtures (scenarios C–H) were
assumed to be equal, thus negating these fixtures in the environmental assessment.
Material and formation processes and associated costs required for pipes and storage
tanks were included in this assessment with an expected pipe lifetime of 50 years (Ishii
and Boyer 2015). A separate urine collection piping system was added to divert urine
and urine flush water (generated by urine-diverting flush toilets only) from the general
waste stream and collected in decentralized HDPE storage tanks located at 125
collections areas on campus. Pipe requirements for urine diverting toilets were based
on the requirements for a model apartment in Remy (2010) and the requirements for
urinals were assumed to be equivalent.
Urine was assumed to be stored for 60 days to inactivate potential pathogens
and/or fecal contamination (Nordin et al. 2009, Vinnerås et al. 2008). Decentralized
HDPE urine storage tanks were sized according to the estimated volume of urine
produced at each of the decentralized treatment areas on campus. For scenarios
Ctruck,landfill and Dtruck,regen, one HDPE tank was located at each decentralized collection
area and sized to hold the estimated daily maximum volume of urine produced before
being collected and transported to a central location for treatment on campus. The
material and formation inputs for the HDPE urine storage tanks per functional unit was
estimated using previous research and an expected tank lifetime of 40 years (Ishii and
Boyer 2015). Decentralized HDPE storage tanks were estimated using a linear

177
regression for tank costs as a function of storage volume (Ishii and Boyer 2015). The
centralized treatment area was equipped with two bolted steel and polyurethane lined
storage tanks, where one tank collects new urine and urine flush water while the other
stores previously collected urine and urine flush water for stabilization and disinfection.
The steel tanks were assumed to meet AWWA D-103 steel tank specifications and lined
with polyurethane to protect the steel from corrosion (AWWA 2009, Richardson 1999,
STI/SPFA 2016). Centralized urine storage tank costs were estimated using a cost
analysis tool for AWWA D-103 steel water storage tanks (STI/SPFA 2016). For
scenarios Gdecen,landfill and Hdecen,regen, urine was collected, stored, and treated at the
building level. In these scenarios, each collection area required two HDPE tanks for
simultaneous collection and storage disinfection of urine and urine flush water.
Urine Transport
For scenarios Ctruck,landfill and Dtruck,regen, urine was collected following the same refuse
routes established by UF for municipal solid waste. In SimaPro, transportation (kg∙km)
is quantified by the emissions and diesel fuel consumption for a truck that has an
efficiency of 1.72×10⁴ kg∙km/L diesel (PRé Consultants 2014). UF refuse routes are
subdivided into north, central, and south campus routes. The roundtrip distance for each
route was estimated by plotting the dumpster locations (i.e., decentralized collection
areas) on Google Earth and using the “path” function to best guess the route and
estimated distance traveled for every day of the week, as shown in Table C-4.
For ease of calculation, decentralized areas within each route (i.e., north, central,
and south campus) were assumed to be equidistant. For example, the north route is
approximately 12 km and the 27 decentralized areas within that route were assumed to

178
be 0.43 km apart. To account for the incremental increase in weight with the addition of
urine in the vacuum truck at each pickup location, the daily urine transport for the north
(tn), central (tc), and south (ts) campus routes was estimated using Eq. C-4,
𝑡𝑛,𝑐,𝑠 = ∑ 𝑑𝑖𝑚𝑖 + 𝑑𝑖+1(𝑚𝑖 + 𝑚𝑖+1) + ⋯ + 𝑑𝑛(𝑚𝑖 + ⋯ + 𝑚𝑛)𝑛𝑖=1 (C-4)
where dn is the incremental distance between each decentralized location (km)
and mn is the mass of urine (kg) collected at each location. Discrete values for urine
transport was estimated at each decentralized area for every day of the week (Monday–
Sunday). The maximum capacity of the vacuum truck was assumed to be 4,000 gal
(15,142 L). If the cumulative daily volume at each route exceeded the maximum
capacity, it was assumed the truck stopped collecting urine and returned to the
centralized location to unload the urine before completing the route. Annual transport
was estimated by multiplying daily transport by the number of days that urine was
assumed to be collected during the academic year (Table C-2). The cost of urine
transport was estimated based on market price of diesel fuel (U.S. EIA 2015).
Vacuum Sewer System
For scenarios Esewer,landfill and Fsewer,regen, a vacuum sewer system was assumed
to be installed to convey source separated urine and urine flush water to a centralized
location on campus for further treatment. The wastewater planning model for
decentralized systems (version 1.0) (Buchanan et al. n.d.) was used to estimate cost, 4”
(102 mm) PVC pipe requirements, energy for the vacuum and wastewater transfer
pumps, and pump station to implement a vacuum sewer system servicing 188 buildings
on UF campus. It was assumed that 100% of the collection system was vacuum based
and 152.4 m was the typical distance between each source. The vacuum sewer system

179
was assumed to have a lifetime of 60 years. In SimaPro, a gravity pump station
inventory item was substituted for the vacuum pump station.
Ion-Exchange Treatment and Disposal
Bench-scale column experiments were used to estimate full-scale column design
for pharmaceutical removal. Full-scale columns were designed to achieve maximum
DCF removal, which was the pharmaceutical most selective for the resin. The operating
capacity was calculated as the mass of DCF sorbed onto the resin before removal of
DCF fell below the maximum achievable level (i.e., mass of DCF sorbed onto the resin
when DCF removal <98% after 1266 BV of treatment). The results of the treatment and
regeneration experiments are shown in Figure C-1 and Table C-5, respectively.
Columns were scaled to treat the entire volume of urine and urine flush water
collected by the source separation system, with one preconditioning cycle at the
beginning (scenarios C–H) and one regeneration cycle (scenarios Dtruck,regen,
Fsewer,regen, and Hdecen,regen) at the end of the year. Energy, water, and chemical
requirements were included for 10 BV of resin preconditioning using 5% NaCl and 10
BV of regeneration solution using 5% NaCl and 50% methanol. The column was
designed to maintain an EBCT of 8.3 min and minimum HLR of 10 m/h (Taute et al.
2013). For scenarios C–F, one large column was used to treat the entire volume of
urine, and for scenarios Gdecen,landfill and Hdecen,regen, one column was scaled to treat
urine produced annually at each decentralized location. Market values for fiberglass ion-
exchange vessels of varying sizes were used to generate a linear regression for vessel
cost as a function of volume (Fresh Water Systems 2016, Water Softeners & Filters
180
2016). The material input and cost of the fiberglass column vessel were estimated using
linear regressions shown in Figure C-2 (Choe et al. 2013).
Additional components (e.g., valves, pressure indicator, etc.) were estimated
from a pilot scale ion-exchange vessel (personal communication with a representative
at Tonka Water). A description of the components included in each ion-exchange
column and list of materials and respective masses are provided in Table C-6. Pump
power requirements (kW) was estimated as a function of flow rate using a linear
regression (Figure C-3) developed from various centrifugal pump specifications.
Disposal of the spent resin or regeneration brine was included within the system
boundary because they were considered integral to the overall life cycle impacts of the
treatment process. For scenarios Gdecen,landfill and Hdecen,regen, the fiberglass ion-
exchange columns at each decentralized location were collected and transported to a
central location for further processing. For scenarios Ctruck,landfill, Esewer,landfill, and
Gdecen,landfill, spent resin was transported and disposed of in a local Class I landfill.
Disposal of the resin was modeled as polystyrene because it constitutes the backbone
of the ion-exchange resin (Choe et al. 2013). In scenarios Dtruck,regen, Fsewer,regen, and
Hdecen,regen, the regeneration brine was transported to a local cement kiln plant where it
was incinerated. The use of waste solvents as fuel in cement production reduces the
need for fossil fuels. Ecosolvent 1.0.1 life cycle assessment tool was used to generate
the life cycle inventory data for solvent combustion as a function of the elemental
solvent composition (e.g., 5% NaCl and 50% methanol) and technology used (e.g.,
incineration at a cement kiln) (Weber et al. 2006). The resulting inventory included the
amount of fossil fuels substituted by waste solvents and changes in the atmospheric

181
emissions (Table C-7); changes to infrastructure at the cement kiln plant were not
considered. The Ecosolvent model for solvent incineration in a cement kiln was based
on average technology used in Switzerland (Seyler et al. 2005). The cost of chemicals
(i.e., methanol and NaCl) and potable water used during the preconditioning and
regeneration process were based on market price (Ishii and Boyer 2015, methanex
2015, USGS 2015).
Nutrient Recovery
For scenarios C–H, struvite (MgNH4PO4∙6H2O) precipitation of urine, after ion-
exchange treatment, was conducted to recover maximum P in urine. It was assumed
that all magnesium and calcium in collected urine was lost in the collection system due
to spontaneous precipitation of struvite and hydroxyapatite resulting in some nutrient
loss (Udert et al. 2003a). Magnesium oxide (MgO) was dosed to stored urine to achieve
a molar Mg:P ratio of 1.2:1 to achieve maximum P recovery as struvite. The cost of
magnesium oxide was based on market price (Ishii and Boyer 2015). The value of
struvite fertilizer was estimated using a regression model of common fertilizers and
costs of contributing nutrients (Ishii and Boyer 2015). In scenarios Gdecen,landfill and
Hdecen,regen, struvite precipitation was conducted every 60 days after storage
disinfection, collected and centrally stored in a HDPE tank. The recovered struvite can
be used directly as a slow-release fertilizer in place of conventional fertilizers (Johnston
and Richards 2003), and thus contributes to the environmental and cost benefits for
scenarios C–H. For these scenarios, conventional fertilizers were considered an
“avoided product” in SimaPro, represented as “monoammonium phosphate, as P2O5 at
regional storehouse/RER U” and “monoammonium phosphate, as N, at regional
182
storehouse/RER U” (NH4H2PO4) because it is a commonly used fertilizer product
containing both N and P. It was assumed that the quality and size of precipitated
struvite was comparable to commercial granular fertilizers and that identical commercial
spreading machines were used for struvite or commercial fertilizers (Forrest et al. 2008).
This assumption negates the power requirements for spreading struvite or
monoammonium phosphate. Furthermore, emissions (e.g., ammonia, nitrous oxide, and
phosphorus) for commercial fertilizers and struvite fertilizers were assumed to be
equivalent. Ammonia emissions for multi-nutrient fertilizers (e.g., struvite, and
monoammonium phosphate) are quantified by an identical emission factor of 4%
(Nemecek and Kägi 2007). Furthermore, nitrous oxide and phosphorus emissions are
quantified as a function of N and P content in the fertilizer (Nemecek and Kägi 2007).
Those emissions were also negated because struvite fertilizer is assumed to offset the
equivalent amount of N and P in monoammonium phosphate. One of the benefits of
struvite precipitation from urine is the low heavy metal content compared to commercial
fertilizers. However, studies have shown that heavy metals in urine (e.g.,) cadmium may
be incorporated into the final struvite product, although to a much lesser extent than
what is found in commercial fertilizers (Lugon-Moulin et al. 2006, Ronteltap et al. 2007).
Therefore, cadmium emissions from struvite and monoammonium phosphate was
included within the LCA boundary. Cadmium content of struvite and monoammonium
phosphate was assumed to be 0.397 mg Cd/kg P2O5 and 97.5 mg Cd/kg P2O5,
respectively (Lugon-Moulin et al. 2006, Ronteltap et al. 2007).
Estimation of Pharmaceuticals in Urine

183
Pharmaceutical concentrations in urine can vary as a function of fraction of
population use, duration of use, and rate of urine collection. A system of equations was
used to estimate pharmaceutical concentrations in urine as a function of these
variables. All calculations were based on urinary excretion rates of the pharmaceutical
active ingredient in urine, pharmaceutical metabolites were not considered in this study.
Sample calculations are provided using ibuprofen as the example pharmaceutical.
According to Khan and Nicell (2010) the pharmaceutical concentration in urine can be
estimated as a function of the percentage of the population that is using a particular
pharmaceutical and the maximum pharmaceutical concentration that may be present if
100% of the population consumed pharmaceuticals, as shown in Eq. C-5 (Khan and
Nicell 2010).
𝐹𝑐 =𝐶
𝐶100 (C-5)
Where Fc is the fraction of the population that is currently using a pharmaceutical,
C is the pharmaceutical concentration in urine and C100 is the pharmaceutical
concentration in urine if 100% of the population consumed a pharmaceutical. This
equation can be rearranged so that the concentration in urine can be determined by Eq.
C-6:
𝐶 = 𝐹𝑐 × 𝐶100 (C-6)
C100 may be estimated by Eq. C-7:
𝐶100 =𝐷𝐷𝐷×𝐹𝑒𝑥
𝑈 (C-7)
Where DDD (mg) is the defined daily dose of a pharmaceutical (Table C-8). In
this example, the defined daily dose was based on the World Health Organization
recommendation (Table C-8) (Holloway and Green 2003), Fex is the fraction of the

184
consumed dose excreted in urine as the pharmaceutical active ingredient based on
pharmacokinetics in literature (Table C-8), and U is the average urine excretion volume
per person per day which is estimated to be 1.5 L/p/d (FitzGerald et al. 2002, Latini et
al. 2004).
The pharmaceutical concentration can be diluted by two additional factors:
duration of pharmaceutical use and urine storage collection time. Duration of
pharmaceutical use is expressed as a fraction of the urine storage collection time. For
example, if the urine storage collection time was one week and the maximum daily dose
of a pharmaceutical was consumed for one week, then the pharmaceutical was
consumed for 100% of the collection time. Conversely, if the pharmaceutical was
consumed 1 day out of the 7-day collection time, the pharmaceutical was consumed for
14.3% of the collection time. The percent duration of use can be determined by Eq. C-8:
𝐹𝑑 =𝑑𝑢
𝑑𝑐 (C-8)
Where Fd is the fraction of duration of use compared to collection time, du is the
number of days a pharmaceutical was consumed, and dc is the storage collection time
in days. The total concentration in urine over the entire collection period may be
calculated by Eq. C-9:
𝐶𝑇 = 𝐶 × 𝐹𝑑 = 𝐶100 × 𝐹𝑐 × 𝐹𝑑 (C-9)
Where CT is the total pharmaceutical concentration in collected urine.
Ex. What is the concentration of ibuprofen in urine if 100 out of 100 students in a dorm consumed ibuprofen for 7 days and the urine collection time was 7 days? What if 25% of the students consumed ibuprofen for 4 days?
𝐹𝑢 =100
100= 1
𝐶 = 56𝑚𝑔
𝐿× 1 = 56
𝑚𝑔
𝐿

185
𝐹𝑑 =7
7= 1
𝐶𝑇 = 56𝑚𝑔
𝐿× 1 = 56
𝑚𝑔
𝐿
Intuitively, this value makes sense because if the entire population of students consumes ibuprofen for the entire collection period, the pharmaceutical concentration would not be diluted and would simply equal C100. Ex. What if 25% of the students consumed ibuprofen for 4 days? 𝐹𝑢 = 0.25
𝐶 = 56𝑚𝑔
𝐿× 0.25 = 14
𝑚𝑔
𝐿
𝐹𝑑 =4
7= 0.57
𝐶𝑇 = 14𝑚𝑔
𝐿× 0.57 = 7.98
𝑚𝑔
𝐿
One final variable that could impact pharmaceutical concentrations in urine is if
different fractions of the population consume pharmaceuticals for varying durations of
time. For example, if 25% of the population consumed a pharmaceutical for 10% of the
collection time and then 15% of the population consumed the same pharmaceutical for
25% of the collection time. The concentration of pharmaceuticals in urine is simply the
summation of the total pharmaceutical concentration in urine according to each
pharmaceutical consumption scenario, as outlined in Eq. C-10:
CTn= CT1
+ CT2+ ⋯ CTn = 𝐶100 ∑ 𝐹𝑐𝑛
𝐹𝑑𝑛
𝑛𝑖=1 (C-10)
Ex. What is the ibuprofen concentration in urine if 25 of 100 students in the dorm population consumed the pharmaceutical for 2 out of 7 days of collection time and a few days later 15 students consumed ibuprofen for 4 out of 7 days of the collection time?
𝐶𝑇 = (56𝑚𝑔
𝐿×
25
100×
2
7) + (56
𝑚𝑔
𝐿×
15
100×
4
7) = 4
𝑚𝑔
𝐿+ 4.8
𝑚𝑔
𝐿
𝐶𝑇 = 8.8𝑚𝑔
𝐿
This value can be confirmed by individually calculating the mass pharmaceutical load (Mpharm) for each population fraction and determining the concentration of pharmaceuticals for the entire storage collection period.
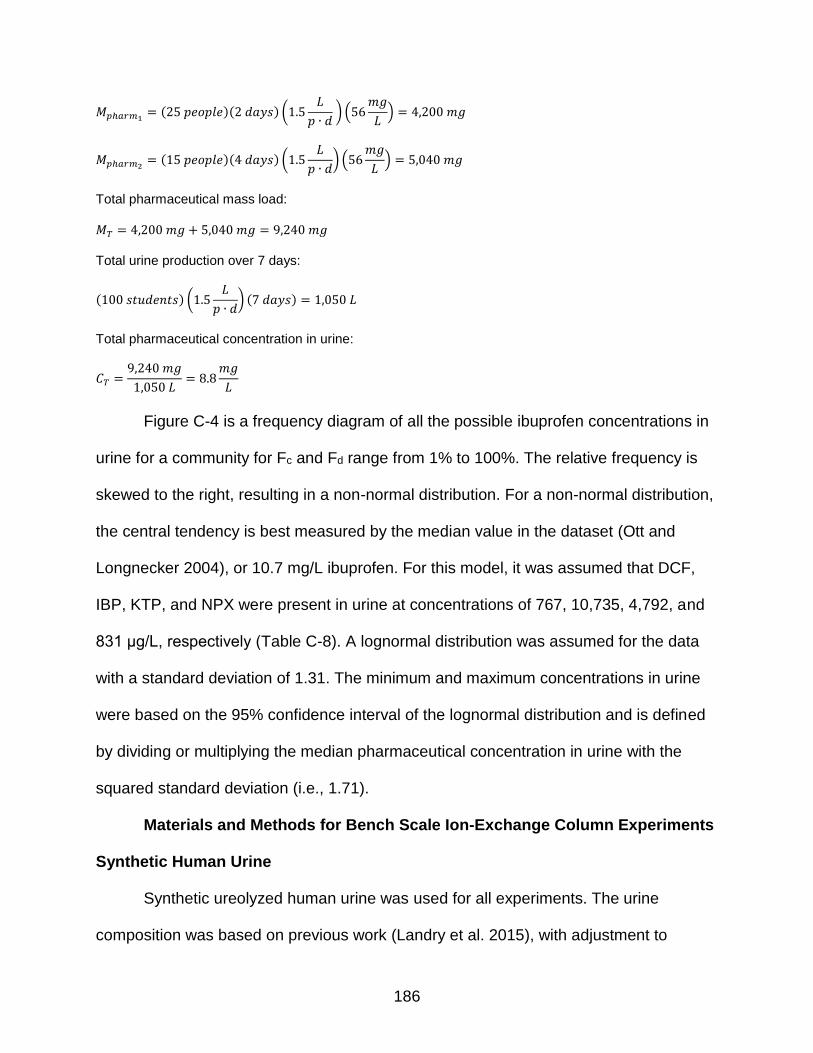
186
𝑀𝑝ℎ𝑎𝑟𝑚1= (25 𝑝𝑒𝑜𝑝𝑙𝑒)(2 𝑑𝑎𝑦𝑠) (1.5
𝐿
𝑝 ∙ 𝑑 ) (56
𝑚𝑔
𝐿) = 4,200 𝑚𝑔
𝑀𝑝ℎ𝑎𝑟𝑚2= (15 𝑝𝑒𝑜𝑝𝑙𝑒)(4 𝑑𝑎𝑦𝑠) (1.5
𝐿
𝑝 ∙ 𝑑) (56
𝑚𝑔
𝐿) = 5,040 𝑚𝑔
Total pharmaceutical mass load: 𝑀𝑇 = 4,200 𝑚𝑔 + 5,040 𝑚𝑔 = 9,240 𝑚𝑔 Total urine production over 7 days:
(100 𝑠𝑡𝑢𝑑𝑒𝑛𝑡𝑠) (1.5𝐿
𝑝 ∙ 𝑑) (7 𝑑𝑎𝑦𝑠) = 1,050 𝐿
Total pharmaceutical concentration in urine:
𝐶𝑇 =9,240 𝑚𝑔
1,050 𝐿= 8.8
𝑚𝑔
𝐿
Figure C-4 is a frequency diagram of all the possible ibuprofen concentrations in
urine for a community for Fc and Fd range from 1% to 100%. The relative frequency is
skewed to the right, resulting in a non-normal distribution. For a non-normal distribution,
the central tendency is best measured by the median value in the dataset (Ott and
Longnecker 2004), or 10.7 mg/L ibuprofen. For this model, it was assumed that DCF,
IBP, KTP, and NPX were present in urine at concentrations of 767, 10,735, 4,792, and
831 μg/L, respectively (Table C-8). A lognormal distribution was assumed for the data
with a standard deviation of 1.31. The minimum and maximum concentrations in urine
were based on the 95% confidence interval of the lognormal distribution and is defined
by dividing or multiplying the median pharmaceutical concentration in urine with the
squared standard deviation (i.e., 1.71).
Materials and Methods for Bench Scale Ion-Exchange Column Experiments
Synthetic Human Urine
Synthetic ureolyzed human urine was used for all experiments. The urine
composition was based on previous work (Landry et al. 2015), with adjustment to

187
include the six endogenous metabolites present at the greatest concentrations in urine
(Bouatra et al. 2013).
Pharmaceutical Compounds
Four pharmaceuticals were investigated for this study; the chemical
characteristics were described previously (Landry et al. 2015). Diclofenac sodium (CAS
15307-79-6, MP Biomedicals), ibuprofen (CAS 311-21-95-4, Fluka Analytical), naproxen
(CAS 26159-54-2, Sigma-Aldrich), and ketoprofen (CAS 22071-15-4, Sigma-Aldrich)
are all acidic pharmaceuticals from the non-steroidal anti-inflammatory drugs (NSAIDs)
pharmaceutical class. A stock solution containing 1,000 mg/L of each solution was
made by diluting the pharmaceutical salts in methanol.
Ion-Exchange Resin
A strong-base, polymeric anion exchange resins (AER), Dowex 22, was used in
all experiments. Dowex 22 is a strong-base, macroporous polystyrene AER
functionalized with dimethyl ethanol functional groups with a manufacturer’s total
capacity of 1.2 meq/mL. The AER was pre-conditioned using NaCl, following a method
described elsewhere (Landry and Boyer 2013).
Column Tests
Fixed bed column runs were conducted in a glass column (0.7854 cm diameter)
packed with 6 mL of Dowex 22 AER to obtain a height: diameter of at least 2:1
(Edzwald 2011). All column runs were performed under the same conditions by
maintaining an empty bed contact time (EBCT) and flow rate of 8.3 min and 0.72
mL/min, respectively. Synthetic ureolyzed urine was spiked with the pharmaceutical
stock solution at an initial concentration of 1,000 µg/L. 100 mL of sample was collected

188
every 12 h using an IS-95 interval sampler (Spectra/Chrom). Control samples were
collected at the beginning and end of the column experiment. At the end of the run, the
column was regenerated using 10 BV of regeneration solution containing 5% NaCl, 50%
methanol by maintaining an EBCT and flow rate of 16.7 min and 0.36 mL/min,
respectively.
Sample Preparation
Pharmaceutical samples from the column experiments were separated from the
urine matrix using a solid phase extraction (SPE) vacuum station (Supelco Visiprep)
and phenyl SPE columns (SiliaPrep, SiliCycle), evaporated, and reconstituted following
a previously described method (Magiera et al. 2014). The dry residue was dissolved in 1
mL of mobile phase (acetonitrile:25 mM KH2PO4 (pH 3) (40:60; v/v)) and 100 µL was
injected into the HPLC-UV system (Hewlett Packard 1050 series detector and Agilent
1100 series auto sampler).
Analytical Methods
Pharmaceutical concentrations for the batch regeneration experiments were
measured using UV absorbance (Hitachi U-2900) following a method described
elsewhere (Landry and Boyer 2013). Pharmaceutical concentrations for the column
experiments were measured using HPLC-UV (Hewlett Packard 1050 series detector
and Agilent 1100 series auto sampler) at 230 nm, equipped with a reversed-phase
column (2.1 × 150 mm, 3 μm Ascentis RP-amide column; Supelco, Bellefonte, PA). The
mobile phase consisted of (A) a mixture of acetonitrile and 25 mM KH2PO4 (pH 3)
(40:60 v/v), and (B) HPLC grade acetonitrile. Elution was performed by increasing
mobile phase B from 0% (5 min) to 50% (20 min), hold for 1 min, and decrease to 0%
189
(21.5 min) to re-equilibrate the baseline for 9.5 min. A seven-point calibration curve (0,
10, 50, 100, 500, 1,000, 5,000 µg/L) was created by serial dilution of the stock
standards previously mentioned in mobile phase A. The minimum limit of detection
(LOD) was 50 μg/L for DCF and IBP, 10 μg/L for KTP and NPX. Pharmaceutical
concentrations were set to the LOD if the effluent concentration fell below the LOD. One
DCF sample in the treatment cycle fell below the LOD. Eight KTP samples, two NPX
samples, seven IBP samples, and two DCF samples fell below the LOD in the
regeneration cycle.
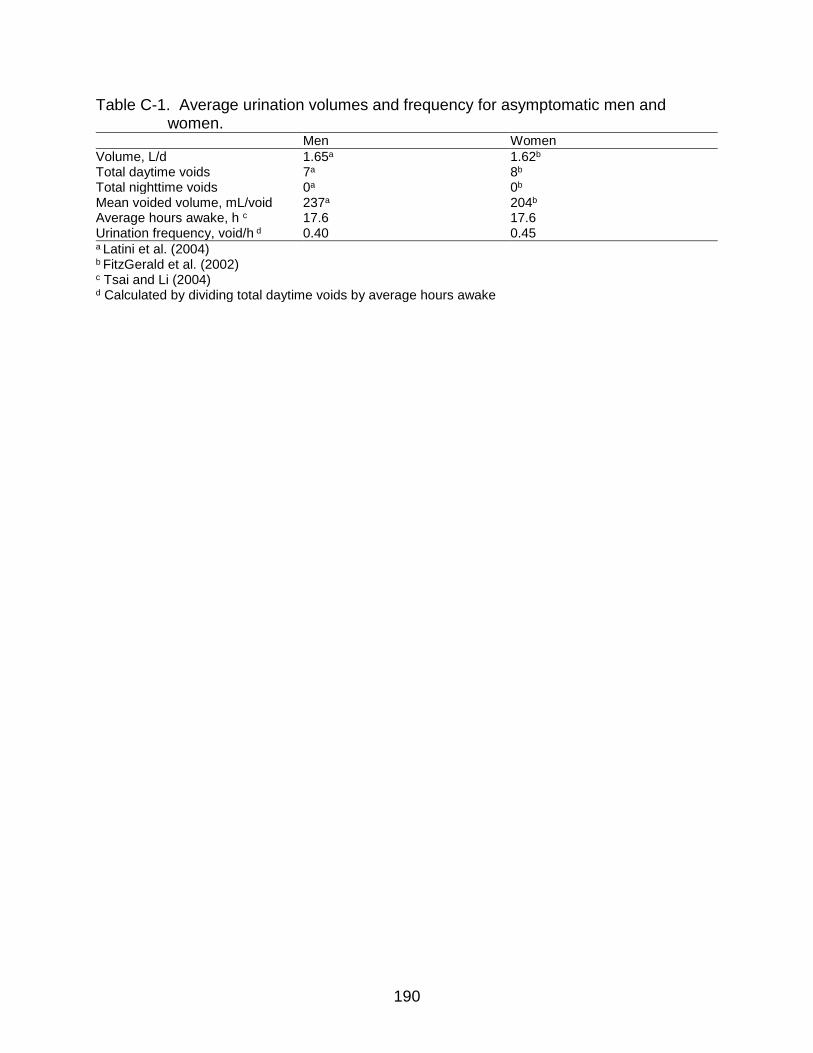
190
Table C-1. Average urination volumes and frequency for asymptomatic men and women.
Men Women
Volume, L/d 1.65a 1.62b
Total daytime voids 7a 8b
Total nighttime voids 0a 0b
Mean voided volume, mL/void 237a 204b
Average hours awake, h c 17.6 17.6 Urination frequency, void/h d 0.40 0.45 a Latini et al. (2004) b FitzGerald et al. (2002) c Tsai and Li (2004) d Calculated by dividing total daytime voids by average hours awake

191
Table C-2. Total number of weekdays during the fall, spring, and summer semesters, excluding major holidays; data from the University of Florida 2014–2015 academic calendar.
Monday Tuesday Wednesday Thursday Friday Saturday Sunday
Fall 17 17 15 16 15 15 15 Spring 15 16 16 16 16 14 14 Summer 12 12 12 12 12 11 10

192
Table C-3. Estimated urine production for entire UF campus over different time periods. Time Urine production, m3
Dailya 39.7 60-dayb 2,381 Annual 11,184 a Average daily urine production over the week b Average 60-day urine production

193
Table C-4. Daily refuse route distance (km) traveled during fall, spring, and summer semesters.
Monday Tuesday Wednesday Thursday Friday Saturday Sunday
Fall & Spring
North Campus 12 12 12 12 12 10 0
Central Campus 14 16 14 10 16 8 0
South Campus 14 18 15 20 13 10 0
Summer
North Campus 12 8 12 9 12 10 0
Central Campus 13 12 14 10 14 8 0
South Campus 11 15 14 20 11 10 0

194
Table C-5. Mass of diclofenac (DCF), ibuprofen (IBP), ketoprofen (KTP), and naproxen (NPX) sorbed onto AER (mg) and desorbed from AER using a 5% NaCl, 50% methanol regeneration solution.
Pharmaceutical Mass sorbed (mg) Mass desorbed (mg) % Regeneration
DCF 25.6 3.63 14% IBP 2.4 0.331 14% KTP 18.7 0.15 1% NPX 4.6 1.346 30%

195
Table C-6. Inventory data for ion-exchange vessel components; data provided by Tonka Water (personal communication).
Component Material Mass, kgd
Ball valves with lever Brass 1.34 Air release valve PVC 0.195 Pressure indicatorsa Steel 0.029 Aluminum 0.029 Bronze 0.029 Brass 0.029 1” Tee connectors to tank HDPE 3.63×10⁻³
1” ID × 1/4” OD Tubingb PVDF 0.6 1/4” ID × 3/8” ODc Tubingc PVDF 0.490 a Pressure indicator composed of multiple materials, total mass of pressure indicator equally distributed among components b Tubing used for ion-exchange vessel in scenarios C–F only c Tubing used for ion-exchange vessels in scenarios G and H only d Non-normalized mass of components; mass of ion-exchange vessel and components normalized by 40 year lifetime in LCA inventory

196
Table C-7. Inventory data for incineration of a regeneration brine at a cement kiln plant. kg per m3 of total regeneration solution volume (e.g., water + methanol)
Regeneration solution 5% NaCl, 50% Methanola
Hard coal –148b
Heavy fuel oil –54.5 Carbon dioxide –76.3 Carbon dioxide fuel –621
Nitrogen oxides –1.67 Nickel –1.11×10⁻⁷ Copper –6.59×10⁻⁷ Zinc –1.10×10⁻⁴ Metals unspecified –1.43×10⁻⁵ Arsenic –3.09×10⁻⁷ Cadmium –4.45×10⁻⁵ Chromium –9.39×10⁻⁷ Mercury –8.86×10⁻⁵ Lead –1.01×10⁻⁴ a Inventory data obtained from Ecosolvent 1.0.0 software (Weber et al. 2006) b Negative values indicate an avoided impact (i.e., offset)

197
Table C-8. Recommended defined daily dose (DDD), fraction of dose excreted in urine as the parent compound (Fex), and estimated pharmaceutical concentrations in urine.
Pharmaceutical DDD, mg Fex Median (minimum, maximum), μg/L
Diclofenac (DCF) 100a 0.06b 767 (450, 1,308) Ibuprofen (IBP) 1,200a 0.07c 10,735 (6,294, 18,309) Ketoprofen (KTP) 300a 0.06d 1,230 (721, 2,098) Naproxen (NPX) 500a 0.013e 831 (487, 1,417) a WHOCC (2013) b Sawchuk et al. (1995) c Lienert et al. (2007b) d Houghton et al. (1984) e Sugawara et al. (1978)

198
Table C-9. Unit cost of inventory items.
Input Unit Unit pricef Year of original cost data
Justification Impacted Scenarios
Infrastructure
Ozone system (30 years)a $ unit–1 $2,808,853 2011 Cost regression curve, as a function of plant capacity B
Conventional toilet (25 years)b $ fixture–1 $203 2015 Ishii and Boyer (2015) A, B
Conventional urinal (25 yearsb $ fixture–1 $355 2015 U.S. market price, www.us.kohler.com A, B
Urine diverting flush toilet (25 years)b $ fixture–1 $700 2016 Ishii and Boyer (2015) C–H
Waterless urinal (25 years)b $ fixture–1 $740 2016 U.S. market price, www.us.kohler.com C–H
Urine piping (50 years)b $ fixture–1 $25 2015 Ishii and Boyer (2015) C–H
Steel and HDPE lined urine central storage tanks (40 years)c
$ m–3 $272 2008 Cost estimation tool (STI/SPFA 2016) C–F
HDPE storage tanks (40 years)b $ m–3 $29 2015
Linear regression of vessel cost as a function of volume (Ishii and Boyer 2015)
C–H
Fiberglass ion-exchange vessel (10 years)d
$ m–3 $1,955 2015
Linear regression of vessel cost as a function of volume (Figure C-2)
C–H
4” PVC vacuum sewer pipe (60 years)e $ m–1 $10 2009 Wastewater planning model (Buchanan et al. n.d.) E, F
Vacuum sewer station (60 years)e $ unit–1 $503,928 2009 Wastewater planning model (Buchanan et al. n.d.) E, F
Operation
Potable water $ m–3 $0.92 2015 Local utility rates (Ishii and Boyer 2015) A–H
Liquid oxygen $ kg–1 $0.12 2012 U.S. market price (Carollo Engineers 2012) B
Vacuum sewer annual maintenance $ yr–1 $29,677 2009 Wastewater planning model (Buchanan et al. n.d.) E, F
Anion exchange resin $ L–1 $12 2016 U.S. market price, www.apswater.com C–H
Electricity $ kWh–1 $0.10 2015 Local utility rates (Ishii and Boyer 2015) A–H
Sodium chloride $ kg–1 $0.20 2014 U.S. market price (USGS 2015) C–H
Methanol $ m3 $322 2015 U.S. market price, www.methanex.com D, F, H
Diesel fuel $ L–1 $0.73 2015 U.S. market price, (U.S. EIA 2015) A–H
Magnesium oxide $ kg–1 $0.21 2015 Ishii and Boyer (2015) C–H
Struvite profit $ kg–1 $0.57 2013 Ishii and Boyer (2015) C–H a Carollo Engineers (2012) b Ishii and Boyer (2015) c Guishard (n.d.) d Choe et al. (2013) e Buchanan et al. (n.d.) f Infrastructure costs and vacuum sewer operation costs adjusted to 2016 based on inflation (www.bls.gov)

199
Table C-10. USEtox characterization factors (human toxicity in cases/kg and ecotoxicity in PAF·m3·day/kg) for diclofenac, ibuprofen, ketoprofen, and naproxen.
Pharmaceutical
Emissions to freshwater Emissions to soil
Reference FAETP HTP-NC FAETP HTP-NC
Diclofenac 2,670 1.22×10⁻⁶ 105 1.24×10⁻⁶ Alfonsín et al. (2014) Ibuprofen 209 3.71×10⁻⁷ 3.67 1.51×10⁻⁷ Alfonsín et al. (2014) Ketoprofena 113 – 6.92 – Andersson et al. (2007), Morais (2014)b
Naproxen 218 2.95×10⁻⁷ 4.86 4.26×10⁻⁸ Alfonsín et al. (2014) a Characterization factors calculated using USEtox 2.0 (Hauschild et al. 2015) b Toxicity data references

200
Table C-11. Baseline, minimum, and maximum values used for various input parameter assumptions. Minimum and maximum values used to conduct a sensitivity analysis of TRACI impact assessment results and uncertainty analysis with assumed distribution (e.g., uniform, normal, lognormal).
Assumption Baseline Minimum Maximum Basis for assumption
Pharmaceutical concentrations in urine, μg/L
767 (DCF) 10,735 IBP) 1,230 KTP) 831 (NPX)
450 (DCF) 6,294 IBP) 721 (KTP) 487 (NPX)
1,308 (DCF) 18,309(IBP) 2,098 (KTP) 1,417 (NPX)
Range of all possible concentrations in urine estimated based on DDD, urinary excretion rates, and theoretical fraction of the population consuming the pharmaceutical for a theoretical length of time. Data is positively skewed; baseline is median value. Lognormal distribution assumed with minimum and maximum values determined by dividing or multiplying baseline with the squared standard deviation.
Pharmaceutical removal by biological treatment, %
27.5 (DCF) 87.3 (IBP) 54.9 (KTP) 71.1 (NPX)
5 (DCF) 40 (IBP) 10 (KTP) 0 (NPX)
90 (DCF) 100 (IBP) 98 (KTP) 98 (NPX)
Uniform distribution of pharmaceutical removal by biological wastewater treatment in literature. Baseline average of literature values.
Pharmaceutical removal by ozonation, %
97.8 (DCF) 53.1 (IBP) 76.7 (KTP) 79.5 (NPX)
94 (DCF) 32 (IBP) 63 (KTP) 50 (NPX)
100 (DCF) 77 (IBP) 98 (KTP) 90 (NPX)
Uniform distribution of pharmaceutical removal by ozonation of wastewater in literature. Baseline average of literature values.
Pharmaceutical removal by ion-exchange, %a
98.4 (DCF) 17.1 (IBP) 45.9 (KTP) 36.2 (NPX)
98.4 (DCF) 17.1 (IBP) 45.9 (KTP) 36.2 (NPX)
98.4 (DCF) 98.4 (IBP) 98.4 (KTP) 98.4 (NPX)
Arbitrary; baseline from experimental column results and maximum based on the assumption that an AER may be developed to achieve equivalent removal as diclofenac for all pharmaceuticals
Capacity of resina 5.52×10⁻³
meq/mL DCF 3.07×10⁻⁴ meq/mL IBP
5.52×10⁻³ meq/mL DCF
Baseline capacity of resin based on maximum diclofenac removal, minimum capacity of resin based on maximum ibuprofen removal
Urine storage time, days 60 14 180 Uniform distribution; min based on optimal storage conditions, max based on WHO recommendation (Ishii and Boyer 2015).
N content in urine, kg/m3 6.9 4.89 12.07 Uniform distribution of urine nitrogen concentrations in literature (Ishii and Boyer 2015). Baseline average of literature values.
P content in urine, kg/m3 0.559 0.37 0.80 Uniform distribution of urine phosphorus concentrations in literature (Ishii and Boyer 2015). Baseline average of literature values.
Electricity use at drinking water treatment plant to produce potable flush water (kWh/m3)
0.558 0.533 0.583 Normal distribution of data provided by drinking water treatment plant, Min = Mean – 2 St. Dev., Max = Mean + 2 St. Dev (Ishii and Boyer 2015).
Electricity use at wastewater treatment plant to treat influent urine and flush water (kWh/m3)
1.366 0.777 1.955 Normal distribution of data provided by wastewater treatment plant, Min = Mean – 2 St. Dev., Max = Mean + 2 St. Dev (Ishii and Boyer 2015).
a Capacity of resin and pharmaceutical removal by ion-exchange excluded from the uncertainty analysis due to a lack of data and arbitrarily assumed values.

201
Table C-12. Baseline, minimum, and maximum values used for various cost assumptions. Minimum and maximum values used to conduct a sensitivity analysis of the economic costs and uncertainty analysis assuming a uniform distribution.
Input Unit Baseline Min Max Justification
Interest rate 3% 3% 7% Interest rates of 3%, 5%, and 7% were evaluated (National Center for Environmental Economics 2010)
Infrastructure
Urine diverting flush toileta $ fixture–1 $700 $203 $700
Minimum price assumes demand for urine diverting flush toilets increases, driving costs down to meet cost of conventional toilets.
Waterless urinala $ fixture–1 $740 $355 $740 Minimum price assumes demand for waterless urinals increases, driving costs down to meet cost of conventional urinals
Operation
Potable water $ m–3 $0.92 $0.51 $4.17 Range of U.S. water rates by city based on 2014 data (Walton 2014). Baseline based on local utility rates (Ishii and Boyer 2015).
Anion exchange resin
$ L–1 $12 $7 $18 Range of U.S. market prices (www.apswater.com). Baseline average of market values.
Electricity $ kWh–1 $0.10 $0.07 $0.33
Range of U.S. energy rates by state based on 2014 data (U.S. EIA 2016). Baseline based on local utility rates (Ishii and Boyer 2015).
Sodium chloride $ kg–1 $0.20 $0.19 $0.20 Range of U.S. market prices for vacuum and open pan salt based on 2010-2014 data (USGS 2015).
Methanol $ m–3 $322 $95 $660 Range of U.S. methanol market prices based on 2001-2016 data (www.methanex.com).
Diesel fuel $ L–1 $0.73 $0.53 $1.24 Range of U.S. diesel market prices based on 2007-2016 data (U.S. EIA 2015).
Struvite profit $ kg–1 $0.57 $0.00 $1.35 95% confidence interval of linear regression model (Ishii and Boyer 2015).
a Cost of fixtures excluded from the uncertainty analysis, only included in sensitivity analysis to evaluate effect of decreasing fixture cost
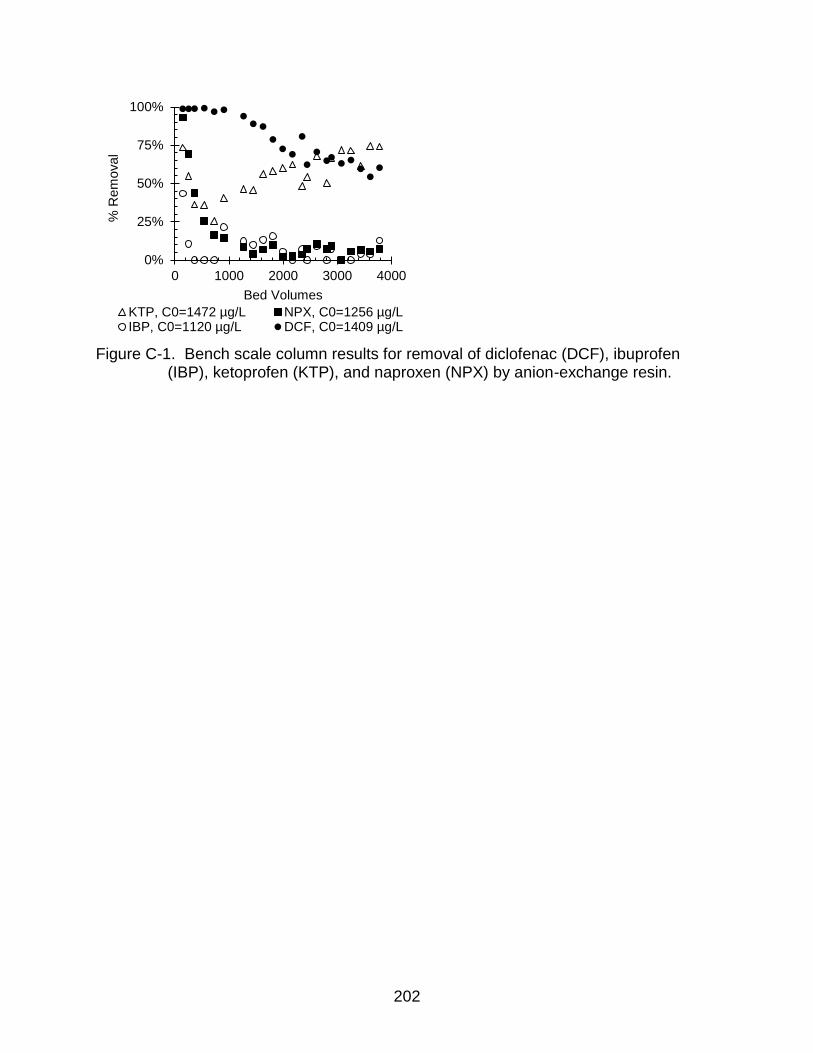
202
Figure C-1. Bench scale column results for removal of diclofenac (DCF), ibuprofen (IBP), ketoprofen (KTP), and naproxen (NPX) by anion-exchange resin.
0%
25%
50%
75%
100%
0 1000 2000 3000 4000
% R
em
oval
Bed Volumes
KTP, C0=1472 µg/L NPX, C0=1256 µg/LIBP, C0=1120 µg/L DCF, C0=1409 µg/L

203
Figure C-2. Manufacturer data and resulting linear regressions of fiberglass water softener tank (a) empty weight (kg) as a function of volume (m3) and (b) cost ($) as a function of volume (m3); data provided by waterpurification.pentair.com, reskem.com, freshwater.
y = 140.29xR² = 0.9294
0
200
400
600
800
1000
0 2 4 6 8
Weig
ht, k
g
Volume, m3
(a)
y = 1928.8xR² = 0.6983
0
200
400
600
800
1000
1200
0 0.2 0.4 0.6 0.8 1
Cost, $
Volume, m3
(b)
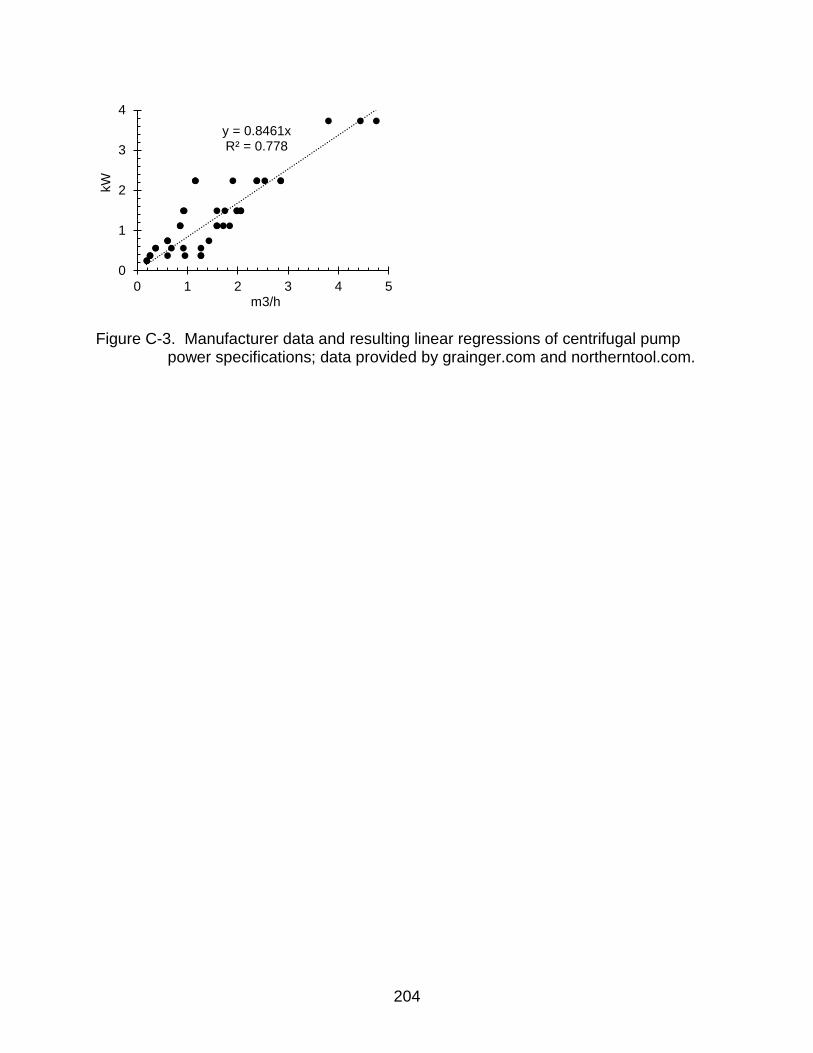
204
Figure C-3. Manufacturer data and resulting linear regressions of centrifugal pump power specifications; data provided by grainger.com and northerntool.com.
y = 0.8461xR² = 0.778
0
1
2
3
4
0 1 2 3 4 5
kW
m3/h
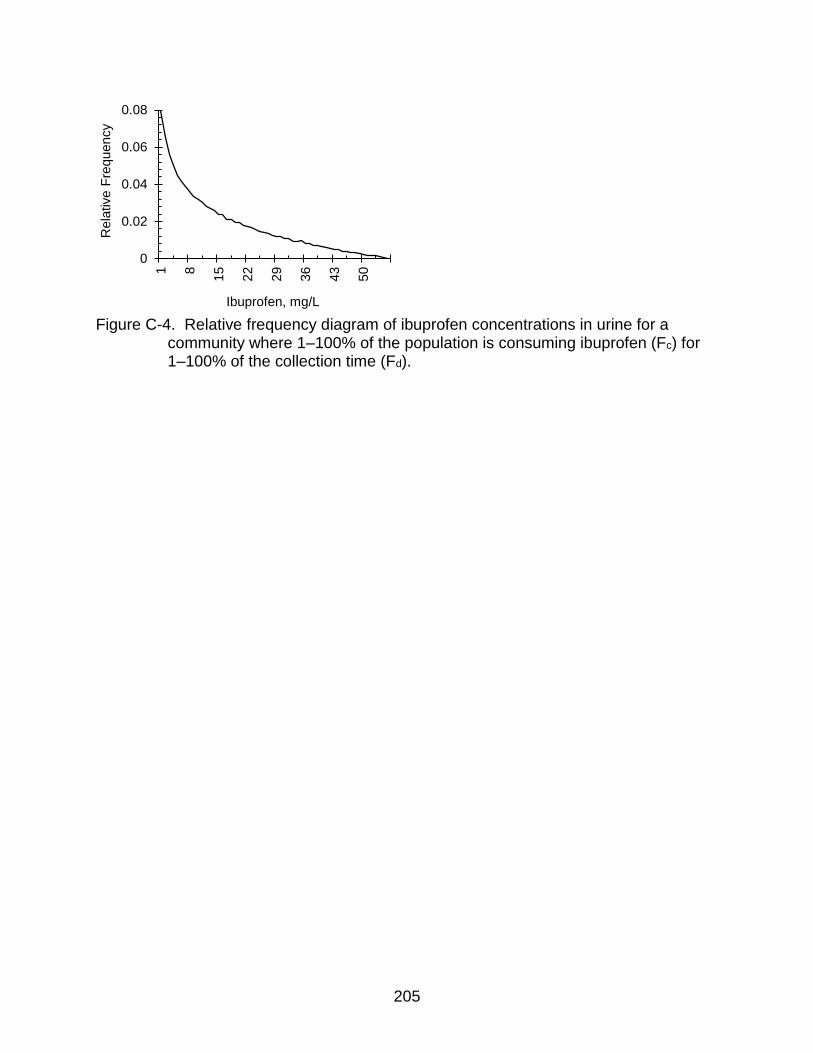
205
Figure C-4. Relative frequency diagram of ibuprofen concentrations in urine for a community where 1–100% of the population is consuming ibuprofen (Fc) for 1–100% of the collection time (Fd).
0
0.02
0.04
0.06
0.08
1 8
15
22
29
36
43
50
Rela
tive F
requency
Ibuprofen, mg/L
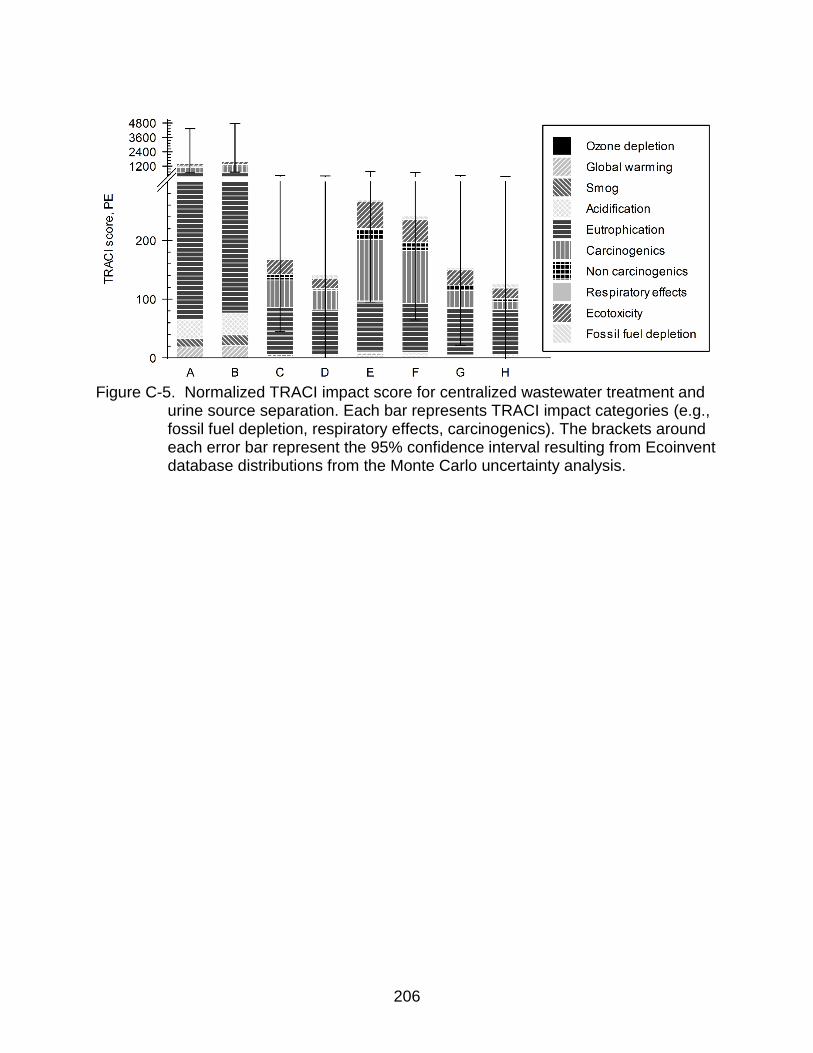
206
Figure C-5. Normalized TRACI impact score for centralized wastewater treatment and
urine source separation. Each bar represents TRACI impact categories (e.g., fossil fuel depletion, respiratory effects, carcinogenics). The brackets around each error bar represent the 95% confidence interval resulting from Ecoinvent database distributions from the Monte Carlo uncertainty analysis.

207
Figure C-6. Comparison of ozone depletion impacts (kg CFC-11 eq.) due to
contributing processes (e.g., flush water, urine transport), generated emissions (e.g., nutrient discharge, pharmaceutical discharge), and avoided impacts (e.g., fertilizer offsets, brine incineration) in each scenario. The brackets around each error bar represent the 95% confidence interval resulting from Ecoinvent database distributions from the Monte Carlo uncertainty analysis.
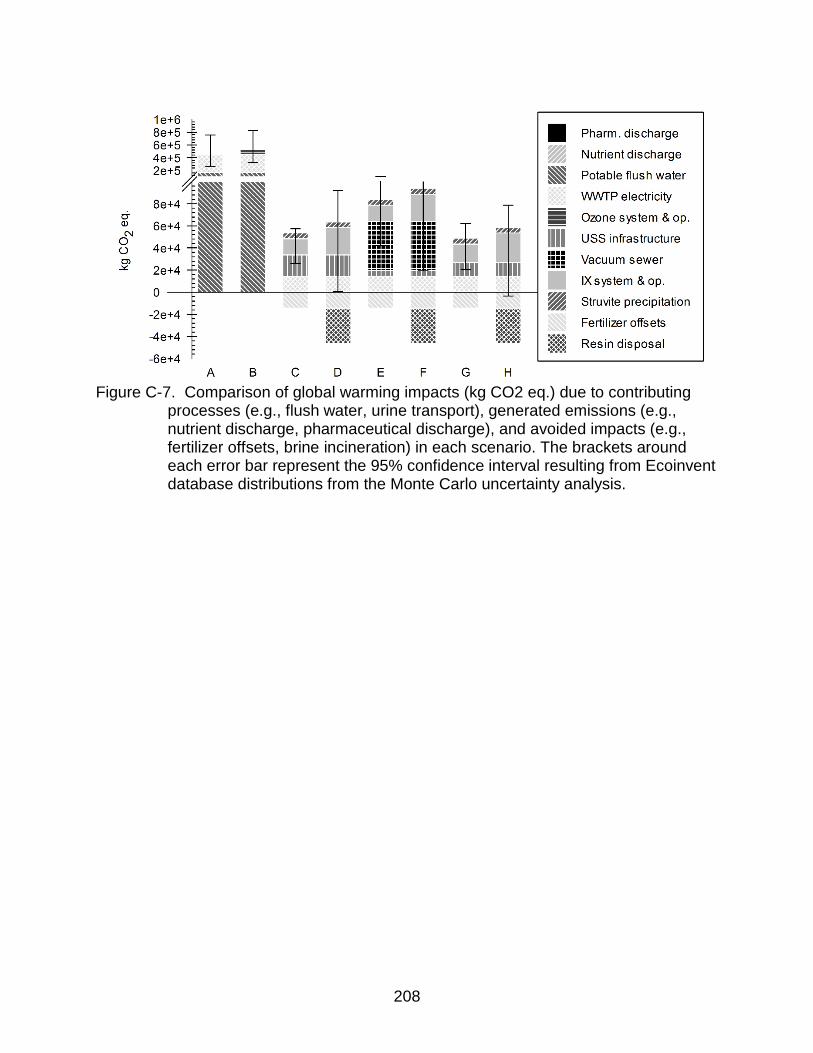
208
Figure C-7. Comparison of global warming impacts (kg CO2 eq.) due to contributing
processes (e.g., flush water, urine transport), generated emissions (e.g., nutrient discharge, pharmaceutical discharge), and avoided impacts (e.g., fertilizer offsets, brine incineration) in each scenario. The brackets around each error bar represent the 95% confidence interval resulting from Ecoinvent database distributions from the Monte Carlo uncertainty analysis.

209
Figure C-8. Comparison of smog impacts (kg O3 eq.) due to contributing processes
(e.g., flush water, urine transport), generated emissions (e.g., nutrient discharge, pharmaceutical discharge), and avoided impacts (e.g., fertilizer offsets, brine incineration) in each scenario. The brackets around each error bar represent the 95% confidence interval resulting from Ecoinvent database distributions from the Monte Carlo uncertainty analysis.

210
Figure C-9. Comparison of acidification impacts (kg SO2 eq.) due to contributing
processes (e.g., flush water, urine transport), generated emissions (e.g., nutrient discharge, pharmaceutical discharge), and avoided impacts (e.g., fertilizer offsets, brine incineration) in each scenario. The brackets around each error bar represent the 95% confidence interval resulting from Ecoinvent database distributions from the Monte Carlo uncertainty analysis.

211
Figure C-10. Comparison of eutrophication impacts (kg N eq.) due to contributing
processes (e.g., flush water, urine transport), generated emissions (e.g., nutrient discharge, pharmaceutical discharge), and avoided impacts (e.g., fertilizer offsets, brine incineration) in each scenario. The brackets around each error bar represent the 95% confidence interval resulting from Ecoinvent database distributions from the Monte Carlo uncertainty analysis.

212
Figure C-11. Comparison of carcinogenic impacts (CTUh) due to contributing
processes (e.g., flush water, urine transport), generated emissions (e.g., nutrient discharge, pharmaceutical discharge), and avoided impacts (e.g., fertilizer offsets, brine incineration) in each scenario. The brackets around each error bar represent the 95% confidence interval resulting from Ecoinvent database distributions from the Monte Carlo uncertainty analysis.

213
Figure C-12. Comparison of respiratory effects impacts (kg PM2.5 eq.) due to
contributing processes (e.g., flush water, urine transport), generated emissions (e.g., nutrient discharge, pharmaceutical discharge), and avoided impacts (e.g., fertilizer offsets, brine incineration) in each scenario. The brackets around each error bar represent the 95% confidence interval resulting from Ecoinvent database distributions from the Monte Carlo uncertainty analysis.

214
Figure C-13. Comparison of fossil fuel depletion impacts (MJ surplus) due to
contributing processes (e.g., flush water, urine transport), generated emissions (e.g., nutrient discharge, pharmaceutical discharge), and avoided impacts (e.g., fertilizer offsets, brine incineration) in each scenario. The brackets around each error bar represent the 95% confidence interval resulting from Ecoinvent database distributions from the Monte Carlo uncertainty analysis.
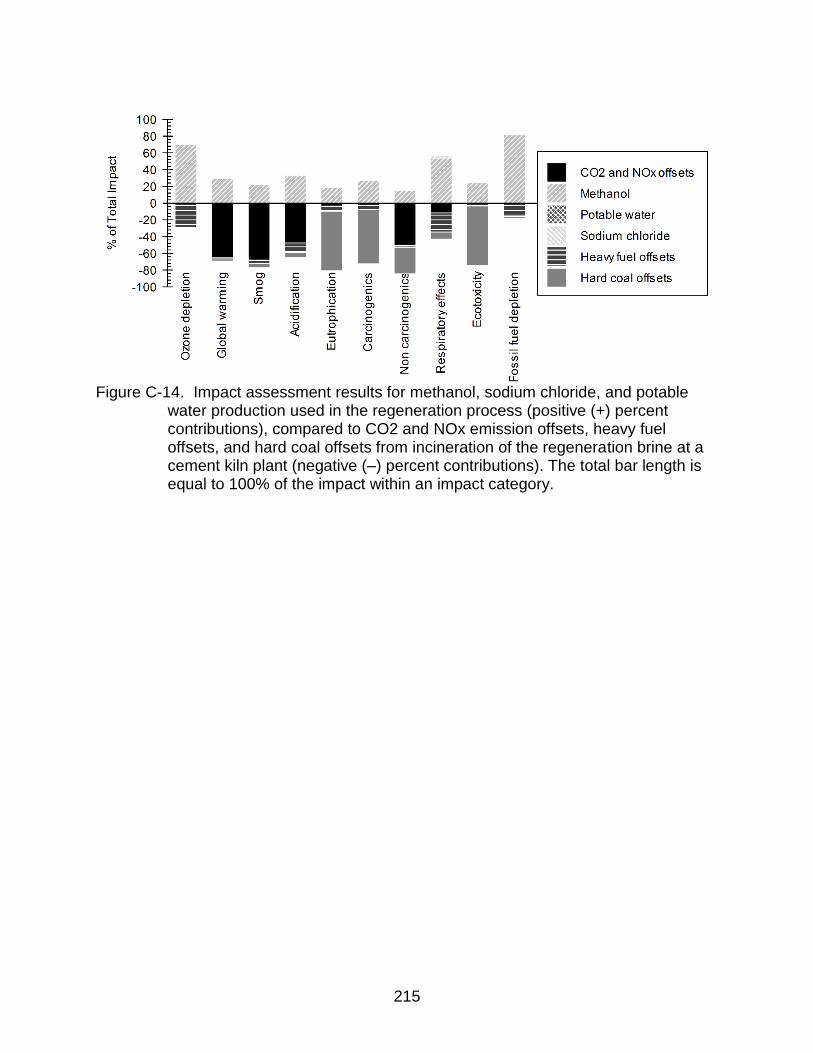
215
Figure C-14. Impact assessment results for methanol, sodium chloride, and potable
water production used in the regeneration process (positive (+) percent contributions), compared to CO2 and NOx emission offsets, heavy fuel offsets, and hard coal offsets from incineration of the regeneration brine at a cement kiln plant (negative (–) percent contributions). The total bar length is equal to 100% of the impact within an impact category.

216
Figure C-15. Normalized TRACI impact score (PE) of vacuum truck collection compared to the vacuum sewer collection as a function of vacuum sewer pipe length or distance traveled by vacuum truck (km).
0
100
200
300
400
500
600
0 25000 50000 75000 100000
TR
AC
I score
, P
E
Pipe length or distance traveled, km
Vacuum sewerVacuum truck
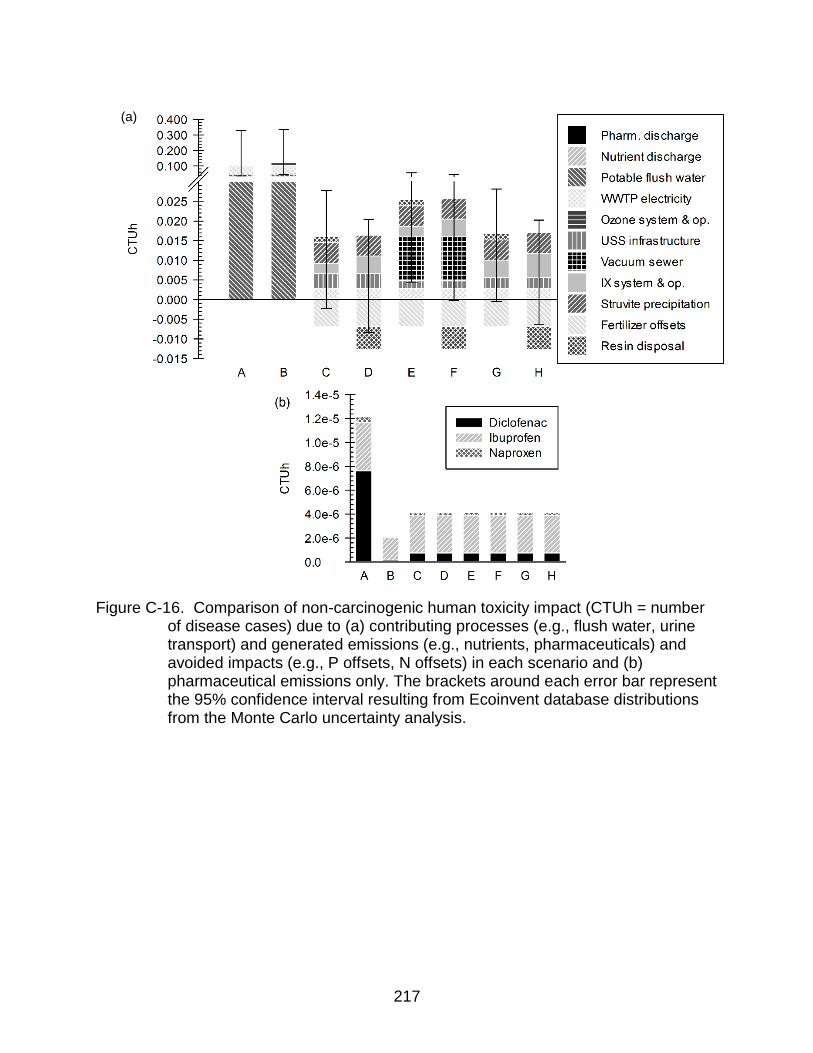
217
Figure C-16. Comparison of non-carcinogenic human toxicity impact (CTUh = number
of disease cases) due to (a) contributing processes (e.g., flush water, urine transport) and generated emissions (e.g., nutrients, pharmaceuticals) and avoided impacts (e.g., P offsets, N offsets) in each scenario and (b) pharmaceutical emissions only. The brackets around each error bar represent the 95% confidence interval resulting from Ecoinvent database distributions from the Monte Carlo uncertainty analysis.
(a)

218
LIST OF REFERENCES
Alberti, G., Amendola, V., Pesavento, M. and Biesuz, R. (2012) Beyond the synthesis of novel solid phases: Review on modelling of sorption phenomena. Coordination Chemistry Reviews 256(1–2), 28-45.
Alfonsín, C., Hospido, A., Omil, F., Moreira, M.T. and Feijoo, G. (2014) PPCPs in wastewater – Update and calculation of characterization factors for their inclusion in LCA studies. Journal of Cleaner Production 83, 245-255.
Althaus, H.J., Hischier, R. and Osses, M. (2007) Life Cycle Inventories of Chemicals, Data v2.0.
Alvarino, T., Suarez, S., Lema, J.M. and Omil, F. (2014) Understanding the removal mechanisms of PPCPs and the influence of main technological parameters in anaerobic UASB and aerobic CAS reactors. Journal of Hazardous Materials 278, 506-513.
Andersson, J., EKHEDEN, Y., KAJ, L., REMBERGER, M. and WOLDEGIORGIS, A. (2007) Results from the Swedish National Screening Programme, 2005. Subreport 1: Antibiotics, Anti-Inflammatory Substances, and Hormones.
AOPWiki (2016), Cyclooxygenase inhibition leading to reproductive dysfunction. https://aopwiki.org/aops/63 (accessed 01/2017)
Apell, J.N. and Boyer, T.H. (2010) Combined ion exchange treatment for removal of dissolved organic matter and hardness. Water Research 44(8), 2419-2430.
AWWA (2009) AWWA D103-09 Factory-Coated Bolted Carbon Steel Tanks for Water Storage.
Bäuerlein, P.S., ter Laak, T.L., Hofman-Caris, R.C.H.M., de Voogt, P. and Droge, S.T.J. (2012) Removal of charged micropollutants from water by ion-exchange polymers – Effects of competing electrolytes. Water Research 46(16), 5009-5018.
Beltran, A., Borrull, F., Marcé, R.M. and Cormack, P.A.G. (2010) Molecularly-imprinted polymers: useful sorbents for selective extractions. TrAC Trends in Analytical Chemistry 29(11), 1363-1375.
Benotti, M.J., Trenholm, R.A., Vanderford, B.J., Holady, J.C., Stanford, B.D. and Snyder, S.A. (2008) Pharmaceuticals and Endocrine Disrupting Compounds in U.S. Drinking Water. Environmental Science & Technology 43(3), 597-603.
Berndtsson, J.C. (2006) Experiences from the implementation of a urine separation system: Goals, planning, reality. Building and Environment 41(4), 427-437.

219
Bester-Rogac, M. (2009) Nonsteroidal Anti-Inflammatory Drugs Ion Mobility : A Conductometric Study of Salicylate, Naproxen, Diclofenac and Ibuprofen Dilute Aqueous Solutions. Slovenian Chemical Society 56(1), 8.
Blair, B., Nikolaus, A., Hedman, C., Klaper, R. and Grundl, T. (2015) Evaluating the degradation, sorption, and negative mass balances of pharmaceuticals and personal care products during wastewater treatment. Chemosphere 134, 395-401.
Blobaum, A.L. and Marnett, L.J. (2007) Structural and Functional Basis of Cyclooxygenase Inhibition. Journal of Medicinal Chemistry 50(7), 1425-1441.
Bouatra, S., Aziat, F., Mandal, R., Guo, A.C., Wilson, M.R., Knox, C., Bjorndahl, T.C., Krishnamurthy, R., Saleem, F., Liu, P., Dame, Z.T., Poelzer, J., Huynh, J., Yallou, F.S., Psychogios, N., Dong, E., Bogumil, R., Roehring, C. and Wishart, D.S. (2013) The Human Urine Metabolome. PLoS ONE 8(9), e73076.
Boyer, T.H., Taylor, K., Reed, A. and Smith, D. (2014) Ion-exchange softening of human urine to control precipitation. Environmental Progress & Sustainable Energy 33(2), 564-571.
Buchanan, J.R., Deal, N.E., Lindbo, D.L., Hanson, A.T., Gustafson, D. and Miles, R.J. (n.d.) Cost of Individual and Small Community Wastewater Management Systems: Wastewater Planning Model, version 1.0. Foundation, W.E.R. (ed).
Bui, T.X. and Choi, H. (2009) Adsorptive removal of selected pharmaceuticals by mesoporous silica SBA-15. Journal of Hazardous Materials 168(2–3), 602-608.
Carballa, M., Fink, G., Omil, F., Lema, J.M. and Ternes, T. (2008) Determination of the solid–water distribution coefficient (Kd) for pharmaceuticals, estrogens and musk fragrances in digested sludge. Water Research 42(1–2), 287-295.
Cardillo, G. (2012) Four parameters logistic regression - There and back again.
Caro, E., Marcé, R.M., Cormack, P.A.G., Sherrington, D.C. and Borrull, F. (2004) A new molecularly imprinted polymer for the selective extraction of naproxen from urine samples by solid-phase extraction. Journal of Chromatography B 813(1–2), 137-143.
Carollo Engineers (2012), Appedix P - Ozone Sizing and Cost Estimate for TORC Removal. http://www.cityofpaloalto.org/civicax/filebank/documents/32098 (accessed 01/2016)
Cha, Y.I., Kim, S.-H., Solnica-Krezel, L. and DuBois, R.N. (2005) Cyclooxygenase-1 signaling is required for vascular tube formation during development. Developmental Biology 282(1), 274-283.
ChemAxon (2013) Marvin, ChemAxon, Ltd.

220
ChemAxon (2016), chemicalize.org. http://www.chemicalize.org/ (accessed 01/2014)
Chen, M., Cooper, V.I., Deng, J., Amatya, P.L., Ambrus, D., Dong, S., Stalker, N., Nadeau-Bonilla, C. and Patel, J. (2015) Occurrence of Pharmaceuticals in Calgary's Wastewater and Related Surface Water. Water Environ Res 87(5), 414-424.
Choe, J.K., Mehnert, M.H., Guest, J.S., Strathmann, T.J. and Werth, C.J. (2013) Comparative Assessment of the Environmental Sustainability of Existing and Emerging Perchlorate Treatment Technologies for Drinking Water. Environmental Science & Technology 47(9), 4644-4652.
Chu, K.H. (2004) Improved fixed bed models for metal biosorption. Chemical Engineering Journal 97(2–3), 233-239.
Chu, K.H. (2010) Fixed bed sorption: Setting the record straight on the Bohart–Adams and Thomas models. Journal of Hazardous Materials 177(1–3), 1006-1012.
Clara, M., Kreuzinger, N., Strenn, B., Gans, O. and Kroiss, H. (2005) The solids retention time—a suitable design parameter to evaluate the capacity of wastewater treatment plants to remove micropollutants. Water Research 39(1), 97-106.
CompuDrug (2006) PALLAS, CompuDrug Chemistry Ltd.
Cook, S.M., VanDuinen, B.J., Love, N.G. and Skerlos, S.J. (2012) Life Cycle Comparison of Environmental Emissions from Three Disposal Options for Unused Pharmaceuticals. Environmental Science & Technology 46(10), 5535-5541.
Corcoran, J., Winter, M.J. and Tyler, C.R. (2010) Pharmaceuticals in the aquatic environment: A critical review of the evidence for health effects in fish. Critical Reviews in Toxicology 40(4), 287-304.
Cordell, D., Drangert, J.-O. and White, S. (2009) The story of phosphorus: Global food security and food for thought. Global Environmental Change 19(2), 292-305.
Crittenden, J.C., Hand, D.W., Arora, H. and Lykins, B.W. (1987) Design Considerations for GAC Treatment of Organic Chemicals. Journal (American Water Works Association) 79(1), 74-82.
Crittenden, J.C., Trussell, R.R., Hand, D.W., Howe, K.J. and Tchobanoglous, G. (2012) MWH's Water Treatment: Principles and Design.
Cryer, B. and Feldman, M. (1998) Cyclooxygenase-1 and cyclooxygenase-2 selectivity of widely used nonsteroidal anti-inflammatory drugs. Am J Med 104(5), 413-421.

221
Dai, C.-M., Zhang, J., Zhang, Y.-L., Zhou, X.-F., Duan, Y.-P. and Liu, S.-G. (2012) Selective removal of acidic pharmaceuticals from contaminated lake water using multi-templates molecularly imprinted polymer. Chemical Engineering Journal 211-212, 302-309.
Daughton, C.G. and Ternes, T.A. (1999) Pharmaceuticals and personal care products in the environment: agents of subtle change? Environ Health Perspect 107(Suppl 6), 907-938.
Davies, N.M. and Anderson, K.E. (1997) Clinical Pharmacokinetics of Naproxen. Clin Pharmacokinet 32(4), 268-293.
Delle Site, A. (2001) Factors Affecting Sorption of Organic Compounds in Natural Sorbent/Water Systems and Sorption Coefficients for Selected Pollutants. A Review. Journal of Physical and Chemical Reference Data 30(1), 187-439.
Desmidt, E., Ghyselbrecht, K., Zhang, Y., Pinoy, L., Van der Bruggen, B., Verstraete, W., Rabaey, K. and Meesschaert, B. (2015) Global Phosphorus Scarcity and Full-Scale P-Recovery Techniques: A Review. Critical Reviews in Environmental Science and Technology 45(4), 336-384.
Dodd, M., Zuleeg, S., Von Gunten, U. and Pronk, W. (2008) Ozonation of Source-Separated Urine for Resource Recovery and Waste Minimization: Process Modeling, Reaction Chemistry, and Operational Considerations. Environmental Science & Technology 42(24), 9329-9337.
Dominguez, J., Gonzalez, T., Palo, P. and Cuerda-Correa, E. (2011) Removal of common pharmaceuticals present in surface waters by Amberlite XAD-7 acrylic-ester-resin: Influence of pH and presence of other drugs. Desalination 269(1-3), 231-238.
Ebele, A.J., Abou-Elwafa Abdallah, M. and Harrad, S. (2016) Pharmaceuticals and personal care products (PPCPs) in the freshwater aquatic environment. Emerging Contaminants.
Ecoinvent Centre (2015), http://www.ecoinvent.org/database/database.html (accessed 01/2016)
Edzwald, J.K. (2011) Water quality & treatment: a handbook on drinking water, McGraw-Hill New York.
Escher, B.I., Allinson, M., Altenburger, R., Bain, P.A., Balaguer, P., Busch, W., Crago, J., Denslow, N.D., Dopp, E., Hilscherova, K., Humpage, A.R., Kumar, A., Grimaldi, M., Jayasinghe, B.S., Jarosova, B., Jia, A., Makarov, S., Maruya, K.A., Medvedev, A., Mehinto, A.C., Mendez, J.E., Poulsen, A., Prochazka, E., Richard, J., Schifferli, A., Schlenk, D., Scholz, S., Shiraishi, F., Snyder, S., Su, G., Tang, J.Y.M., Burg, B.v.d., Linden, S.C.v.d., Werner, I., Westerheide, S.D., Wong, C.K.C., Yang, M., Yeung, B.H.Y., Zhang, X. and Leusch, F.D.L. (2013)

222
Benchmarking Organic Micropollutants in Wastewater, Recycled Water and Drinking Water with In Vitro Bioassays. Environmental Science & Technology 48(3), 1940-1956.
Escher, B.I., Pronk, W., Suter, M.J.F. and Maurer, M. (2006) Monitoring the Removal Efficiency of Pharmaceuticals and Hormones in Different Treatment Processes of Source-Separated Urine with Bioassays. Environmental Science & Technology 40(16), 5095-5101.
Fabbri, R., Montagna, M., Balbi, T., Raffo, E., Palumbo, F. and Canesi, L. (2014) Adaptation of the bivalve embryotoxicity assay for the high throughput screening of emerging contaminants in Mytilus galloprovincialis. Marine Environmental Research 99, 1-8.
FDEP (2015a) 2014 Reuse Inventory: Appendix D - Reclaimed Water Utilization.
FDEP (2015b), Numeric Nutrient Standards for Florida Waters. http://www.dep.state.fl.us/water/wqssp/nutrients/ (accessed 02/2017)
Fedors, R.F. (1974) A method for estimating both the solubility parameters and molar volumes of liquids. Polymer Engineering & Science 14(2), 147-154.
Fernandez-Fontaina, E., Omil, F., Lema, J.M. and Carballa, M. (2012) Influence of nitrifying conditions on the biodegradation and sorption of emerging micropollutants. Water Research 46(16), 5434-5444.
Ferrando-Climent, L., Collado, N., Buttiglieri, G., Gros, M., Rodriguez-Roda, I., Rodriguez-Mozaz, S. and Barceló, D. (2012) Comprehensive study of ibuprofen and its metabolites in activated sludge batch experiments and aquatic environment. Science of The Total Environment 438, 404-413.
Finkbeiner, M., Ackermann, R., Bach, V., Berger, M., Brankatschk, G., Chang, Y.-J., Grinberg, M., Lehmann, A., Martínez-Blanco, J., Minkov, N., Neugebauer, S., Scheumann, R., Schneider, L. and Wolf, K. (2014) Background and Future Prospects in Life Cycle Assessment. Klöpffer, W. (ed), pp. 207-258, Springer Netherlands, Dordrecht.
FitzGerald, M.P., Stablein, U. and Brubaker, L. (2002) Urinary habits among asymptomatic women. American Journal of Obstetrics and Gynecology 187(5), 1384-1388.
Foo, K.Y. and Hameed, B.H. (2010) Insights into the modeling of adsorption isotherm systems. Chemical Engineering Journal 156(1), 2-10.
Forrest, A., Fattah, K., Mavinic, D. and Koch, F. (2008) Optimizing Struvite Production for Phosphate Recovery in WWTP. Journal of Environmental Engineering 134(5), 395-402.
223
Fresh Water Systems (2016), Composite Well Tanks. https://www.freshwatersystems.com/c-35-composite-well-tanks.aspx (accessed 01/2016)
Fungaro, D.A., Bruno, M. and Grosche, L.C. (2009) Adsorption and kinetic studies of methylene blue on zeolite synthesized from fly ash. Desalination and Water Treatment 2(1-3), 231-239.
Furlong, E.T., Batt, A.L., Glassmeyer, S.T., Noriega, M.C., Kolpin, D.W., Mash, H. and Schenck, K.M. (2017) Nationwide reconnaissance of contaminants of emerging concern in source and treated drinking waters of the United States: Pharmaceuticals. Science of The Total Environment 579, 1629-1642.
Gawlik, B.M., Sotiriou, N., Feicht, E.A., Schulte-Hostede, S. and Kettrup, A. (1997) Alternatives for the determination of the soil adsorption coefficient, KOC, of non-ionicorganic compounds — a review. Chemosphere 34(12), 2525-2551.
Ghodbane, I. and Hamdaoui, O. (2008) Removal of mercury(II) from aqueous media using eucalyptus bark: Kinetic and equilibrium studies. Journal of Hazardous Materials 160(2–3), 301-309.
Ghose, A.K. and Crippen, G.M. (1987) Atomic physicochemical parameters for three-dimensional-structure-directed quantitative structure-activity relationships. 2. Modeling dispersive and hydrophobic interactions. Journal of Chemical Information and Computer Sciences 27(1), 21-35.
Gomes, J., Costa, R., Quinta-Ferreira, R.M. and Martins, R.C. (in press) Application of ozonation for pharmaceuticals and personal care products removal from water. Science of The Total Environment.
GRU (2011) Biosolids Management Plan Update.
Guerra, P., Kim, M., Shah, A., Alaee, M. and Smyth, S.A. (2014) Occurrence and fate of antibiotic, analgesic/anti-inflammatory, and antifungal compounds in five wastewater treatment processes. Science of The Total Environment 473–474, 235-243.
Guishard, T. (n.d.), Comparisons of Steel Water Storage Tanks. http://timswatersolutions.com/pdf/2.pdf (accessed 01/2016)
Han, S., Choi, K., Kim, J., Ji, K., Kim, S., Ahn, B., Yun, J., Choi, K., Khim, J.S., Zhang, X. and Giesy, J.P. (2010) Endocrine disruption and consequences of chronic exposure to ibuprofen in Japanese medaka (Oryzias latipes) and freshwater cladocerans Daphnia magna and Moina macrocopa. Aquatic Toxicology 98(3), 256-264.
Hand, D.W., Crittenden, J.C. and Thacker, W.E. (1984a) Simplified Models for Design of Fixed Bed Adsorption Systems. Journal of Environmental Engineering 110(2).

224
Hand, D.W., Crittenden, J.C. and Thacker, W.E. (1984b) Simplified Models for Design of Fixed‐Bed Adsorption Systems. Journal of Environmental Engineering 110(2).
Hand, V.C. and Williams, G.K. (1987) Structure-activity relationships for sorption of linear alkylbenzenesulfonates. Environmental Science & Technology 21(4), 370-373.
Hanle, L.J. (2004), CO2 emissions profile of the U.S. cement industry. Washington D.C., 2004. https://www3.epa.gov/ttnchie1/conference/ei13/ghg/hanle.pdf (accessed
Hauschild, M., McKone, T., Van de Meent, D., Huijbregts, M., Margni, M., Rosenbaum, R.K., Jolliet, O. and Fantke, P. (2015) USEtox 2.0.
Hellström, D., Johansson, E. and Grennberg, K. (1999) Storage of human urine: acidification as a method to inhibit decomposition of urea. Ecological Engineering 12(3–4), 253-269.
Hernando, M.D., Mezcua, M., Fernández-Alba, A.R. and Barceló, D. (2006) Environmental risk assessment of pharmaceutical residues in wastewater effluents, surface waters and sediments. Talanta 69(2), 334-342.
Hochmuth, G., Fan, J.H., Kruse, J. and Sartain, J. (2013), SL389/SS591: Using Reclaimed Water to Irrigate Turfgrass - Lessons Learned from Research with Nitrogen. University of Florida, https://edis.ifas.ufl.edu/ss591 (accessed
Hollender, J., Zimmermann, S., Koepke, S., Krauss, M., McArdell, C., Ort, C., Singer, H., von Gunten, U. and Siegrist, H. (2009) Elimination of Organic Micropollutants in a Municipal Wastewater Treatment Plant Upgraded with a Full-Scale Post-Ozonation Followed by Sand Filtration. Environmental Science & Technology 43(20), 7862-7869.
Holloway, K. and Green, T. (2003) Drug and Therapeutics Committees - A Practical Guide, World Health Organization.
Houghton, G.W., Dennis, M.J., Rigler, E.D. and Parsons, R.L. (1984) Urinary pharmacokinetics of orally administered Ketoprofen in man. European Journal of Drug Metabolism and Pharmacokinetics 9(3), 201-204.
Howard, G.J. and Webster, T.F. (2009) Generalized concentration addition: A method for examining mixtures containing partial agonists. Journal of Theoretical Biology 259(3), 469-477.
Huber, M.M., Canonica, S., Park, G.-Y. and von Gunten, U. (2003) Oxidation of Pharmaceuticals during Ozonation and Advanced Oxidation Processes. Environmental Science & Technology 37(5), 1016-1024.

225
Huggett, D.B., Foran, C.M., Brooks, B.W., Weston, J., Peterson, B., Marsh, K.E., La Point, T.W. and Schlenk, D. (2003) Comparison of in Vitro and in Vivo Bioassays for Estrogenicity in Effluent from North American Municipal Wastewater Facilities. Toxicological Sciences 72(1), 77-83.
Igos, E., Benetto, E., Venditti, S., Kohler, C. and Cornelissen, A. (2013) Comparative and integrative environmental assessment of advanced wastewater treatment processes based on an average removal of pharmaceuticals. Water Science and Technology 67(2).
Igos, E., Benetto, E., Venditti, S., Kohler, C., Cornelissen, A., Moeller, R. and Biwer, A. (2012) Is it better to remove pharmaceuticals in decentralized or conventional wastewater treatment plants? A life cycle assessment comparison. Science of The Total Environment 438(0), 533-540.
IMS Health (2011), Top 20 Therapeutic Classes, 2011. https://www.imshealth.com/en/about-us/news/top-line-market-data (accessed
Ishii, S.K.L. and Boyer, T.H. (2015) Life cycle comparison of centralized wastewater treatment and urine source separation with struvite precipitation: Focus on urine nutrient management. Water Research 79, 88-103.
Ishii, S.K.L. and Boyer, T.H. (2016) Student support and perceptions of urine source separation in a university community. Water Research 100, 146-156.
Isidori, M., Lavorgna, M., Nardelli, A., Parrella, A., Previtera, L. and Rubino, M. (2005) Ecotoxicity of naproxen and its phototransformation products. Science of The Total Environment 348(1–3), 93-101.
Jafvert, C.T., Westall, J.C., Grieder, E. and Schwarzenbach, R.P. (1990) Distribution of hydrophobic ionogenic organic compounds between octanol and water: organic acids. Environmental Science & Technology 24(12), 1795-1803.
Jelic, A., Gros, M., Ginebreda, A., Cespedes-Sánchez, R., Ventura, F., Petrovic, M. and Barcelo, D. (2011) Occurrence, partition and removal of pharmaceuticals in sewage water and sludge during wastewater treatment. Water Research 45(3), 1165-1176.
Jimenez, J., Bott, C., Love, N. and Bratby, J. (2015) Source Separation of Urine as an Alternative Solution to Nutrient Management in Biological Nutrient Removal Treatment Plants. Water Environ Res 87(12), 2120-2129.
Johnston, A.E. and Richards, I.R. (2003) Effectiveness of different precipitated phosphates as phosphorus sources for plants. Soil Use and Management 19(1), 45-49.

226
Jones, O.A.H., Voulvoulis, N. and Lester, J.N. (2002) Aquatic environmental assessment of the top 25 English prescription pharmaceuticals. Water Research 36(20), 5013-5022.
Joss, A., Keller, E., Alder, A., Gobel, A., McArdell, C., Ternes, T. and Siegrist, H. (2005) Removal of pharmaceuticals and fragrances in biological wastewater treatment. Water Research 39(14), 3139-3152.
Julia, M.G. and Portier, C.J. (2007) The Forest for the Trees: A Systems Approach to Human Health Research. Environ Health Perspect 115(9), 1261-1263.
Kah, M. and Brown, C.D. (2007) Prediction of the adsorption of ionizable pesticides in soils. J Agric Food Chem 55(6), 2312-2322.
Kah, M. and Brown, C.D. (2008) LogD: Lipophilicity for ionisable compounds. Chemosphere 72(10), 1401-1408.
Kemacheevakul, P., Otani, S., Matsuda, T. and Shimizu, Y. (2012) Occurrence of micro-organic pollutants on phosphorus recovery from urine. Water Science and Technology 66(10), 2194-2201.
Khan, U. and Nicell, J.A. (2010) Assessing the risk of exogenously consumed pharmaceuticals in land-applied human urine. Water Science & Technology 62(6).
Kirchmann, H. and Pettersson, S. (1995) Human Urine - Chemical-Composition and Fertilizer Use Efficiency. Fertilizer Research 40(2), 149-154.
Kloten/Opfikon, K. (2005) Geschäftsbericht 2005 Management Review, p. 16.
Kohler (2016), Steward waterless urinal. http://www.us.kohler.com/ (accessed 01/2016)
Krajewska, B. (2009) Ureases I. Functional, catalytic and kinetic properties: A review. Journal of Molecular Catalysis B: Enzymatic 59(1–3), 9-21.
Lam, L., Kurisu, K. and Hanaki, K. (2015) Comparative environmental impacts of source-separation systems for domestic wastewater management in rural China. Journal of Cleaner Production 104, 185-198.
Lamichhane, K. and Babcock, R. (2012) An economic appraisal of using source separation of human urine to contain and treat endocrine disrupters in the USA. Journal of Environmental Monitoring 14(10), 2557-2565.
Lamichhane, K.M. (2013) Environmental consequences of adopting source separated sanitation system: First and third world perspectives. Ph.D., University of Hawai'i at Manoa, Ann Arbor.

227
Landry, K.A. and Boyer, T.H. (2013) Diclofenac removal in urine using strong-base anion exchange polymer resins. Water Research 47(17), 6432-6444.
Landry, K.A. and Boyer, T.H. (2016) Life cycle assessment and costing of urine source separation: Focus on nonsteroidal anti-inflammatory drug removal. Water Research 105, 487-495.
Landry, K.A., Sun, P., Huang, C.-H. and Boyer, T.H. (2015) Ion-exchange selectivity of diclofenac, ibuprofen, ketoprofen, and naproxen in ureolyzed human urine. Water Research 68(0), 510-521.
Larsen, T. and Gujer, W. (1996a) Separate management of anthropogenic nutrient solutions (human urine). Water Science and Technology 34(3-4), 87-94.
Larsen, T.A., Alder, A.C., Eggen, R.I.L., Maurer, M. and Lienert, J. (2009) Source Separation: Will We See a Paradigm Shift in Wastewater Handling? Environmental Science & Technology 43(16), 6121-6125.
Larsen, T.A. and Gujer, W. (1996b) Separate management of anthropogenic nutrient solutions (human urine). Water Science and Technology 34(3–4), 87-94.
Latini, J.M., Mueller, E., Lux, M.M., Fitzgerald, M.P. and Kreder, K.J. (2004) VOIDING FREQUENCY IN A SAMPLE OF ASYMPTOMATIC AMERICAN MEN. The Journal of Urology 172(3), 980-984.
Lee, J., Ji, K., Lim Kho, Y., Kim, P. and Choi, K. (2011) Chronic exposure to diclofenac on two freshwater cladocerans and Japanese medaka. Ecotoxicol Environ Saf 74(5), 1216-1225.
Li, P. and SenGupta, A. (2004) Sorption of hydrophobic ionizable organic compounds (HIOCs) onto polymeric ion exchangers. Reactive & Functional Polymers 60, 27-39.
Li, P. and SenGupta, A.K. (1998) Genesis of Selectivity and Reversibility for Sorption of Synthetic Aromatic Anions onto Polymeric Sorbents. Environmental Science & Technology 32(23), 3756-3766.
Li, W.C. (2014) Occurrence, sources, and fate of pharmaceuticals in aquatic environment and soil. Environmental Pollution 187(0), 193-201.
Lienert, J., Burki, T. and Escher, B. (2007a) Reducing micropollutants with source control: substance flow analysis of 212 pharmaceuticals in faeces and urine. Water Science and Technology 56(5), 87-96.
Lienert, J., Gudel, K. and Escher, B. (2007b) Screening method for ecotoxicological hazard assessment of 42 pharmaceuticals considering human metabolism and excretory routes. Environmental Science & Technology 41(12), 4471-4478.

228
Lienert, J., Haller, M., Berner, A., Stauffacher, M. and Larsen, T.A. (2003) How farmers in Switzerland perceive fertilizers from recycled anthropogenic nutrients (urine). Water Sci Technol 48(1), 47-56.
Lienert, J. and Larsen, T.A. (2010) High Acceptance of Urine Source Separation in Seven European Countries: A Review. Environmental Science & Technology 44(2), 556-566.
Lin, Y.-P., Singer, P.C. and Aiken, G.R. (2005) Inhibition of Calcite Precipitation by Natural Organic Material: Kinetics, Mechanism, and Thermodynamics. Environmental Science & Technology 39(17), 6420-6428.
Lindqvist, N., Tuhkanen, T. and Kronberg, L. (2005) Occurrence of acidic pharmaceuticals in raw and treated sewages and in receiving waters. Water Research 39(11), 2219-2228.
Liu, J., Mansouri, K., Judson, R.S., Martin, M.T., Hong, H., Chen, M., Xu, X., Thomas, R.S. and Shah, I. (2015) Predicting hepatotoxicity using ToxCast in vitro bioactivity and chemical structure. Chem Res Toxicol 28(4), 738-751.
Lu, M.-C., Chen, Y.Y., Chiou, M.-R., Chen, M.Y. and Fan, H.-J. (in press) Occurrence and treatment efficiency of pharmaceuticals in landfill leachates. Waste Management.
Lugon-Moulin, N., Ryan, L., Donini, P. and Rossi, L. (2006) Cadmium content of phosphate fertilizers used for tobacco production. Agron. Sustain. Dev. 26(3), 151-155.
Magdeburg, A., Stalter, D. and Oehlmann, J. (2012) Whole effluent toxicity assessment at a wastewater treatment plant upgraded with a full-scale post-ozonation using aquatic key species. Chemosphere 88(8), 1008-1014.
Magiera, S., Hejniak, J. and Baranowski, J. (2014) Comparison of different sorbent materials for solid-phase extraction of selected drugs in human urine analyzed by UHPLC–UV. Journal of Chromatography B 958(0), 22-28.
Mahramanlioglu, M., Kizilcikli, I. and Bicer, I.O. (2002) Adsorption of fluoride from aqueous solution by acid treated spent bleaching earth. Journal of Fluorine Chemistry 115(1), 41-47.
Margot, J., Kienle, C., Magnet, A., Weil, M., Rossi, L., de Alencastro, L.F., Abegglen, C., Thonney, D., Chèvre, N., Schärer, M. and Barry, D.A. (2013) Treatment of micropollutants in municipal wastewater: Ozone or powdered activated carbon? Science of The Total Environment 461–462, 480-498.
Martin, M.T., Knudsen, T.B., Reif, D.M., Houck, K.A., Judson, R.S., Kavlock, R.J. and Dix, D.J. (2011) Predictive model of rat reproductive toxicity from ToxCast high throughput screening. Biol Reprod 85(2), 327-339.
229
MathWorks (2013) MATLAB and Statistics Toolbox Release 2013b, The MathWorks, Inc., Natick, Massachusetts.
Maul, G.A., Kim, Y., Amini, A., Zhang, Q. and Boyer, T.H. (2014) Efficiency and life cycle environmental impacts of ion-exchange regeneration using sodium, potassium, chloride, and bicarbonate salts. Chemical Engineering Journal 254(0), 198-209.
Maurer, M., Pronk, W. and Larsen, T.A. (2006) Treatment processes for source-separated urine. Water Research 40(17), 3151-3166.
Maurer, M., Schwegler, P. and Larsen, T.A. (2003) Nutrients in urine: energetic aspects of removal and recovery. Water Science and Technology 48(1), 37-46.
McClellan, K. and Halden, R.U. (2010) Pharmaceuticals and Personal Care Products in Archived U.S. Biosolids from the 2001 EPA National Sewage Sludge Survey. Water Research 44(2), 658-668.
Meloun, M., Bordovska, S. and Galla, L. (2007) The thermodynamic dissociation constants of four non-steroidal anti-inflammatory drugs by the least-squares nonlinear regression of multiwavelength spectrophotometric pH-titration data. Journal of Pharmaceutical and Biomedical Analysis 45(4), 552-564.
Melvin, S.D., Cameron, M.C. and Lanctot, C.M. (2014) Individual and mixture toxicity of pharmaceuticals naproxen, carbamazepine, and sulfamethoxazole to Australian striped marsh frog tadpoles (Limnodynastes peronii). J Toxicol Environ Health A 77(6), 337-345.
Memmert, U., Peither, A., Burri, R., Weber, K., Schmidt, T., Sumpter, J.P. and Hartmann, A. (2013) Diclofenac: New data on chronic toxicity and bioconcentration in fish. Environ Toxicol Chem 32(2), 442-452.
methanex (2015), Methanex posts regional contract methanol prices for North America, Europe, and Asia. https://www.methanex.com/our-business/pricing (accessed 01/2015)
Morais, S.A. (2014) Multimedia fate modelling and impact of pharmaceutical compounds on freshwater ecosystems.
Moser, P., Sallmann, A. and Wiesenberg, I. (1990) Synthesis and quantitative structure-activity relationships of diclofenac analogs. Journal of Medicinal Chemistry 33(9), 2358-2368.
Muñoz, I., José Gómez, M., Molina-Díaz, A., Huijbregts, M.A.J., Fernández-Alba, A.R. and García-Calvo, E. (2008) Ranking potential impacts of priority and emerging pollutants in urban wastewater through life cycle impact assessment. Chemosphere 74(1), 37-44.

230
Muñoz, I., Rodríguez, A., Rosal, R. and Fernández-Alba, A.R. (2009) Life Cycle Assessment of urban wastewater reuse with ozonation as tertiary treatment: A focus on toxicity-related impacts. Science of The Total Environment 407(4), 1245-1256.
National Center for Environmental Economics (2010), Guidelines for preparing economic analyses. U.S. Environmental Protection Agency, https://yosemite.epa.gov/ee/epa/eerm.nsf/vwAN/EE-0568-50.pdf/$file/EE-0568-50.pdf (accessed
Neale, P.A., Munz, N.A., Aїt-Aїssa, S., Altenburger, R., Brion, F., Busch, W., Escher, B.I., Hilscherová, K., Kienle, C., Novák, J., Seiler, T.-B., Shao, Y., Stamm, C. and Hollender, J. (2017) Integrating chemical analysis and bioanalysis to evaluate the contribution of wastewater effluent on the micropollutant burden in small streams. Science of The Total Environment 576, 785-795.
Nemecek, T. and Kägi, T. (2007) Life cycle inventories of agricultural production systems, Data v2.0, Ecoinvent Centre, Zurich and Dubendorf.
Nishi, I., Komuro, T., Kawakami, T. and Onodera, S. (2010) In vitro cyclooxygenase inhibition assay for evaluating ecotoxicity of the surface water and domestic wastewater in the Tone Canal, Japan. Arch Environ Contam Toxicol 58(3), 535-542.
Nordin, A., Nyberg, K. and Vinnerås, B. (2009) Inactivation of Ascaris Eggs in Source-Separated Urine and Feces by Ammonia at Ambient Temperatures. Applied and Environmental Microbiology 75(3), 662-667.
NREL (2012), U.S. Life Cycle Inventory Database. https://www.lcacommons.gov/nrel/search (accessed 01/2015)
Ort, C., Lawrence, M.G., Reungoat, J., Eaglesham, G., Carter, S. and Keller, J. (2010) Determining the fraction of pharmaceutical residues in wastewater originating from a hospital. Water Research 44(2), 605-615.
Ott, L. and Longnecker, M. (2004) A first course in statistical methods, Thomson-Brooks/Cole, Belmont, CA.
Parang, K., Wiebe, L.I., Knaus, E.E., Huang, J.-S., Tyrrell, D.L. and Csizmadia, F. (1997) In vitro antiviral activities of myristic acid analogs against human immunodeficiency and hepatitis B viruses. Antiviral Research 34(3), 75-90.
Petrie, B., Barden, R. and Kasprzyk-Hordern, B. (2015) A review on emerging contaminants in wastewaters and the environment: current knowledge, understudied areas and recommendations for future monitoring. Water Research 72(0), 3-27.

231
Pomati, F., Orlandi, C., Clerici, M., Luciani, F. and Zuccato, E. (2008) Effects and Interactions in an Environmentally Relevant Mixture of Pharmaceuticals. Toxicological Sciences 102(1), 129-137.
PRé Consultants (2014), http://www.pre-sustainability.com/ (accessed 01/2015)
Pronk, W., Biebow, M. and Boller, M. (2006a) Electrodialysis for Recovering Salts from a Urine Solution Containing Micropollutants. Environmental Science & Technology 40(7), 2414-2420.
Pronk, W., Palmquist, H., Biebow, M. and Boller, M. (2006b) Nanofiltration for the separation of pharmaceuticals from nutrients in source-separated urine. Water Research 40(7), 1405-1412.
Quinn, B., Gagne, F. and Blaise, C. (2008) An investigation into the acute and chronic toxicity of eleven pharmaceuticals (and their solvents) found in wastewater effluent on the cnidarian, Hydra attenuata. Sci Total Environ 389(2-3), 306-314.
Radjenović, J., Petrović, M. and Barceló, D. (2009) Fate and distribution of pharmaceuticals in wastewater and sewage sludge of the conventional activated sludge (CAS) and advanced membrane bioreactor (MBR) treatment. Water Research 43(3), 831-841.
Ramos, T.R.P., Gomes, M.I. and Barbosa-Póvoa, A.P. (2014) Planning a sustainable reverse logistics system: Balancing costs with environmental and social concerns. Omega 48, 60-74.
Remy, C. (2010) Life Cycle Assessment of conventional and source-separation systems for urban wastewater management. Ph.D. Dissertation, Technische Universität Berlin.
Reungoat, J., Macova, M., Escher, B.I., Carswell, S., Mueller, J.F. and Keller, J. (2010) Removal of micropollutants and reduction of biological activity in a full scale reclamation plant using ozonation and activated carbon filtration. Water Research 44(2), 625-637.
Rice, J. and Westerhoff, P. (2015) Spatial and Temporal Variation in De Facto Wastewater Reuse in Drinking Water Systems across the U.S.A. Environmental Science & Technology 49(2), 982-989.
Richardson, G. (1999) Bolted steel tanks, HDPE geomembrane linings.
Rivera-Utrilla, J., Sánchez-Polo, M., Ferro-García, M.Á., Prados-Joya, G. and Ocampo-Pérez, R. (2013) Pharmaceuticals as emerging contaminants and their removal from water. A review. Chemosphere 93(7), 1268-1287.

232
Ronteltap, M., Maurer, M. and Gujer, W. (2007) The behaviour of pharmaceuticals and heavy metals during struvite precipitation in urine. Water Research 41(9), 1859-1868.
Rosal, R., Rodríguez, A., Perdigón-Melón, J.A., Petre, A., García-Calvo, E., Gómez, M.J., Agüera, A. and Fernández-Alba, A.R. (2010) Occurrence of emerging pollutants in urban wastewater and their removal through biological treatment followed by ozonation. Water Research 44(2), 578-588.
Rotroff, D.M., Martin, M.T., Dix, D.J., Filer, D.L., Houck, K.A., Knudsen, T.B., Sipes, N.S., Reif, D.M., Xia, M., Huang, R. and Judson, R.S. (2014) Predictive Endocrine Testing in the 21st Century Using in Vitro Assays of Estrogen Receptor Signaling Responses. Environmental Science & Technology 48(15), 8706-8716.
Ryberg, M., Vieira, M.M., Zgola, M., Bare, J. and Rosenbaum, R. (2014) Updated US and Canadian normalization factors for TRACI 2.1. Clean Technologies and Environmental Policy 16(2), 329-339.
Saikia, M.D. and Dutta, N.N. (2008) Adsorption affinity of certain biomolecules onto polymeric resins: Effect of solute chemical nature. Reactive and Functional Polymers 68(1), 33-38.
Salgado, R., Marques, R., Noronha, J., Carvalho, G., Oehmen, A. and Reis, M. (2012) Assessing the removal of pharmaceuticals and personal care products in a full-scale activated sludge plant. Environmental Science and Pollution Research 19(5), 1818-1827.
Sánchez-Polo, M., Rivera-Utrilla, J., Prados-Joya, G., Ferro-García, M.A. and Bautista-Toledo, I. (2008) Removal of pharmaceutical compounds, nitroimidazoles, from waters by using the ozone/carbon system. Water Research 42(15), 4163-4171.
Sangster, J. (2014) LOGKOW: A databank of evaluated octanol-water partition coefficients (Log P), Sangster Research Laboratories, Montreal, Quebec, Canada.
Santos, J.L., Aparicio, I. and Alonso, E. (2007) Occurrence and risk assessment of pharmaceutically active compounds in wastewater treatment plants. A case study: Seville city (Spain). Environment International 33(4), 596-601.
Saude, E. and Sykes, B. (2007) Urine stability for metabolomic studies: effects of preparation and storage. Metabolomics 3(1), 19-27.
Sawchuk, R., Maloney, J., Cartier, L., Rackley, R., Chan, K.H. and Lau, H.L. (1995) Analysis of Diclofenac and Four of Its Metabolites in Human Urine by HPLC. Pharmaceutical Research 12(5), 756-762.

233
Schroeder, A.L., Ankley, G.T., Houck, K.A. and Villeneuve, D.L. (2016) Environmental surveillance and monitoring--The next frontiers for high-throughput toxicology. Environ Toxicol Chem 35(3), 513-525.
Schwarzenbach, R.P., Gschwend, P.M. and Imboden, D.M. (2002) Environmental Organic Chemistry, 2nd Edition.
Scott, D.C., Clymer, J.W. (2002) Estimation of Distribution Coefficients from the Partition Coefficient and pKa. Pharmaceutical Technology 26(11), 30.
Seyler, C., Hellweg, S., Monteil, M. and Hungerbühler, K. (2005) Life Cycle Inventory for Use of Waste Solvent as Fuel Substitute in the Cement Industry - A Multi-Input Allocation Model (11 pp). The International Journal of Life Cycle Assessment 10(2), 120-130.
Sindelar, H.R., Brown, M.T. and Boyer, T.H. (2015) Effects of natural organic matter on calcium and phosphorus co-precipitation. Chemosphere 138, 218-224.
Sipes, N.S., Martin, M.T., Reif, D.M., Kleinstreuer, N.C., Judson, R.S., Singh, A.V., Chandler, K.J., Dix, D.J., Kavlock, R.J. and Knudsen, T.B. (2011) Predictive models of prenatal developmental toxicity from ToxCast high-throughput screening data. Toxicol Sci 124(1), 109-127.
Sipma, J., Osuna, B., Collado, N., Monclús, H., Ferrero, G., Comas, J. and Rodriguez-Roda, I. (2010) Comparison of removal of pharmaceuticals in MBR and activated sludge systems. Desalination 250(2), 653-659.
Smith, V.H., Tilman, G.D. and Nekola, J.C. (1999) Eutrophication: impacts of excess nutrient inputs on freshwater, marine, and terrestrial ecosystems. Environmental Pollution 100(1–3), 179-196.
Snyder, S.A., Gunten, U.V., Amy, G., Debroux, J. and Gerrity, D. (2014) Use of Ozone in Water Reclamation for Contaminant Oxidation, pp. 373-376.
Solanki, A. and Boyer, T.H. (2017) Pharmaceutical removal in synthetic human urine using biochar. Environmental Science: Water Research & Technology.
Sperlich, A., Schimmelpfennig, S., Baumgarten, B., Genz, A., Amy, G., Worch, E. and Jekel, M. (2008) Predicting anion breakthrough in granular ferric hydroxide (GFH) adsorption filters. Water Research 42(8–9), 2073-2082.
Stalter, D., Magdeburg, A., Weil, M., Knacker, T. and Oehlmann, J. (2010) Toxication or detoxication? In vivo toxicity assessment of ozonation as advanced wastewater treatment with the rainbow trout. Water Research 44(2), 439-448.
STI/SPFA (2016), Water Storage Tank Total Cost of Ownership. http://www.steeltank.com/FabricatedSteelProducts/FieldErectedWaterTanks/TotalCostofOwnershipfreeonlinetool/tabid/474/Default.aspx (accessed 01/2015)

234
Stone, E. and Reardon, R. (2011) Technologies to meet numeric nutrient criteria. Florida Water Resources Journal.
Strathmann, T.J. and Jafvert, C.T. (1998) Ion-pair association of substituted phenolates with K+ in octanol. Environmental Toxicology and Chemistry 17(3), 369-376.
Subedi, B. and Loganathan, B. (2016) Persistent Organic Chemicals in the Environment: Status and Trends in the Pacific Basin Countries II Temporal Trends, pp. 181-202, American Chemical Society.
Sugawara, Y., Fujihara, M., Miura, Y., Hayashida, K. and Takahashi, T. (1978) Studies on the fate of naproxen. II. Metabolic fate in various animals and man. Chem Pharm Bull (Tokyo) 26(11), 3312-3321.
Tarpeh, W.A., Udert, K.M. and Nelson, K.L. (2017) Comparing Ion Exchange Adsorbents for Nitrogen Recovery from Source-Separated Urine. Environmental Science & Technology.
Taute, J.J., Sole, K.C. and Hardwick, E. (2013) Zinc removal from a base metal solution by ion exchange: process design to full-scale operation, The Southern African Institute of Mining and Metallurgy, White River, Mpumalanga, South Africa.
Taylor-Smith, A. (2015) Pharmaceutical Compounds in Land-Applied Sludge and Plant Uptake: A Review, North Carolina State University, Raleigh, North Carolina.
Ternes, T.A. (1998) Occurrence of drugs in German sewage treatment plants and rivers. Water Research 32(11), 3245-3260.
Ternes, T.A., Stüber, J., Herrmann, N., McDowell, D., Ried, A., Kampmann, M. and Teiser, B. (2003) Ozonation: a tool for removal of pharmaceuticals, contrast media and musk fragrances from wastewater? Water Research 37(8), 1976-1982.
Townsend, T., Gustitus, S.A., Walsh, A. and Krause, M.J. (2015) Municipal Solid Waste Composition Study at the University of Florida 2014, University of Florida.
TOXNET (2012), Hazardous Substances Data Bank. National Library of Medicine, Bethesda, Maryland. http://toxnet.nlm.nih.gov/cgi-bin/sis/htmlgen?HSDB (accessed July)
TOXNET (2016), Hazardous Substances Data Bank. http://www.ncbi.nlm.nih.gov/pubmed/ (accessed 01/2014)
Tsai, L.L. and Li, S.P. (2004) Sleep patterns in college students: gender and grade differences. Journal of Psychosomatic Research 56(2), 231-237.
U.S. EIA (2015) U.S. Gasoline and Diesel Retail Prices.

235
U.S. EIA (2016), State Electricity Profiles. http://www.eia.gov/electricity/state/ (accessed 01/2016)
U.S. EPA (2012), Industrial & Municipal Waste Disposal Wells (Class I). http://water.epa.gov/type/groundwater/uic/wells_class1.cfm (accessed 01/2016)
U.S. EPA (2014), Tool for the Reduction and Assessment of Chemical and Other Environmental Impacts. http://www.epa.gov/nrmrl/std/traci/traci.html (accessed 01/2015)
U.S. EPA (2015) 21st Century Science Challenges for EPA’s National Water Program: An Update to the National Water Program Research Strategy.
U.S. EPA (2016a) Drinking Water Action Plan.
U.S. EPA (2016b) National Rivers and Stream Assessment 2008-2009: A Collaborative Survey, Washington, D.C.
U.S. EPA (2016c), Toxicity Forecaster (ToxCast). http://epa.gov/ncct/toxcast/ (accessed 01/2017)
U.S. EPA (2016d), WaterSense Labeled Flushing Urinals. https://www3.epa.gov/watersense/pubs/faq_lfu.html (accessed 01/2016)
Udert, K., Larsen, T., Biebow, M. and Gujer, W. (2003a) Urea hydrolysis and precipitation dynamics in a urine-collecting system. Water Research 37(11), 2571-2582.
Udert, K.M., Larsen, T.A. and Gujer, W. (2003b) Estimating the precipitation potential in urine-collecting systems. Water Research 37(11), 2667-2677.
UF (2014a), Approved Calendar: 2014-2015 Academic Year. https://catalog.ufl.edu/ugrad/current/Pages/calendar1415.pdf (accessed 01/2016)
UF (2014b) Human Resources 2013-2014. Florida, U.o. (ed), Integrated Postsecondary Education Data System.
UF (2015) Common Data Set 2014-2015, University of Florida.
Upton, R.A., Buskin, J.N., Williams, R.L., Holford, N.H. and Riegelman, S. (1980) Negligible excretion of unchanged ketoprofen, naproxen, and probenecid in urine. J Pharm Sci 69(11), 1254-1257.
USGS (2015) Mineral Commodity Summaries 2015, pp. 134-135.
Verlicchi, P., Al Aukidy, M. and Zambello, E. (2012) Occurrence of pharmaceutical compounds in urban wastewater: Removal, mass load and environmental risk
236
after a secondary treatment—A review. Science of The Total Environment 429(0), 123-155.
Vinnerås, B. (2001) Feacal separation and urine diversion for nutrient management of household biodegradable waste and wastewater.
Vinnerås, B., Nordin, A., Niwagaba, C. and Nyberg, K. (2008) Inactivation of bacteria and viruses in human urine depending on temperature and dilution rate. Water Research 42(15), 4067-4074.
Walton, B. (2014), Price of Water 2014: Up 6 Percent in 30 Major U.S. Cities; 33 Percent Rise Since 2010 - Circle of Blue. Circle of Blue, http://www.circleofblue.org/2014/world/price-water-2014-6-percent-30-major-u-s-cities-33-percent-rise-since-2010/ (accessed 01/2016)
Warner, T.D., Giuliano, F., Vojnovic, I., Bukasa, A., Mitchell, J.A. and Vane, J.R. (1999) Nonsteroid drug selectivities for cyclo-oxygenase-1 rather than cyclo-oxygenase-2 are associated with human gastrointestinal toxicity: a full in vitro analysis. Proc Natl Acad Sci U S A 96(13), 7563-7568.
Watanabe, H., Tamura, I., Abe, R., Takanobu, H., Nakamura, A., Suzuki, T., Hirose, A., Nishimura, T. and Tatarazako, N. (2016) Chronic toxicity of an environmentally relevant mixture of pharmaceuticals to three aquatic organisms (alga, daphnid, and fish). Environ Toxicol Chem 35(4), 996-1006.
Water Softeners & Filters (2016), Water Softener Tanks. http://www.water-softeners-filters.com/water-softeners/softener-tanks (accessed 01/2016)
Weber, D., Capello, C., Seyler, C., Kohler, A., Hellweg, S. and Hungerbuhler, K. (2006), Ecosolvent 1.0.1. ETH Zurich, http://www.sust-chem.ethz.ch/tools/ecosolvent (accessed 01/2015)
WHOCC (2013), ATC/DDD Index 2015. http://www.whocc.no/atc_ddd_index/ (accessed 01/2015)
Wicke, E. (1939) Empirische und theoretische Untersuchungen der Sorptionsgeschivindigkeit von Gasen an porosen Stoffen I and II. Kolloid-Z. 86, 295.
Wilkinson, J.L., Hooda, P.S., Barker, J., Barton, S. and Swinden, J. (2016) Ecotoxic pharmaceuticals, personal care products, and other emerging contaminants: A review of environmental, receptor-mediated, developmental, and epigenetic toxicity with discussion of proposed toxicity to humans. Critical Reviews in Environmental Science and Technology 46(4), 336-381.
Winker, M., Faika, D., Gulyas, H. and Otterpohl, R. (2008a) A comparison of human pharmaceutical concentrations in raw municipal wastewater and yellowwater. Science of The Total Environment 399(1–3), 96-104.

237
Winker, M., Tettenborn, F., Faika, D., Gulyas, H. and Otterpohl, R. (2008b) Comparison of analytical and theoretical pharmaceutical concentrations in human urine in Germany. Water Research 42(14), 3633-3640.
Wood, A., Blackhurst, M., Hawkins, T., Xue, X., Ashbolt, N. and Garland, J. (2015) Cost-effectiveness of nitrogen mitigation by alternative household wastewater management technologies. Journal of Environmental Management 150, 344-354.
Worch, E. (2012) Adsorption Technology in Water Treatment, Fundamentals, Processes, and Modeling.
WRRF (2015) Framework for Direct Potable Reuse.
Xu, Z., Cai, J.-g. and Pan, B.-c. (2013) Mathematically modeling fixed-bed adsorption in aqueous systems. Journal of Zhejiang University SCIENCE A 14(3), 155-176.
Zhang, H., Shields, A.J., Jadbabaei, N., Nelson, M., Pan, B. and Suri, R.P.S. (2014) Understanding and Modeling Removal of Anionic Organic Contaminants (AOCs) by Anion Exchange Resins. Environmental Science & Technology 48(13), 7494-7502.
Zhang, Q., Crittenden, J., Hristovski, K., Hand, D. and Westerhoff, P. (2009) User-oriented batch reactor solutions to the homogeneous surface diffusion model for different activated carbon dosages. Water Research 43(7), 1859-1866.
Zhang, R., Sun, P., Boyer, T.H., Zhao, L. and Huang, C.-H. (2015) Degradation of Pharmaceuticals and Metabolite in Synthetic Human Urine by UV, UV/H2O2, and UV/PDS. Environmental Science & Technology 49(5), 3056-3066.
Zhang, Y., Geissen, S. and Gal, C. (2008) Carbamazepine and diclofenac: Removal in wastewater treatment plants and occurrence in water bodies. Chemosphere 73(8), 1151-1161.
Zinckgraf, B., Liebnitzky, C., Kruse, J. and Boyer, T.H. (2014) Nutrient recovery potential from stadium wastewater for use as turfgrass fertilizer. University of Florida Journal of Undergraduate Research 15(2), 4.
Zorita, S., Mårtensson, L. and Mathiasson, L. (2009) Occurrence and removal of pharmaceuticals in a municipal sewage treatment system in the south of Sweden. Science of The Total Environment 407(8), 2760-2770.
238
BIOGRAPHICAL SKETCH
Kelly Landry began her academic career as a Gator in 2010 and has since
earned her Bachelor of Science degree (2013), and Doctor of Philosophy degree
(2017), both within the Department of Environmental Engineering Sciences at the
University of Florida. Kelly’s interest for water and wastewater treatment began during
her undergraduate career and has been strengthened through coursework and research
as well as involvement with the American Water Works Association. She looks forward
to a career dedicated to furthering the efforts of the one-water paradigm.