experimental and numerical evaluation of … 5.pdf · experimental and numerical evaluation of ......
TRANSCRIPT
5th International Conference on Mechanics and Materials in Design
Chapter I: Experimental Mechanics and Testing in Design 1
REF: A0111.0097
EXPERIMENTAL AND NUMERICAL EVALUATION OF BOND PROPERTIES BETWEEN REINFORCEMENT AND CONCRETE
Carlos Moreno1, and Ana Sarmento Bastos Civil Engineering Department, University of Porto Porto, Portugal Email: (1)[email protected]
SYNOPSIS A study of the bond behaviour between steel reinforcement bars and four different types of surrounding concrete: normal strength concrete (NSC), steel fibber reinforced concrete (SFRC) and two structural lightweight aggregate concretes (SLWAC) is here presented. Five beam-tests according to Standard RILEM (1982) [5] were conducted on specimens under monotonously increased loading. Bond-slip response curves between concretes and reinforcement are obtained and discussed. The results obtained show that standard bond length of 10∅d is not adequate to determine bond characteristics of reinforcement in concretes with grades higher than C 25/30. Bond failure of the NSC beam did not occur but the bar itself failed. Bond failure was observed for NSC beam and for LWAC and SFRC beams when reduced bond length of 5∅d was used. A numerical simulation of the beam tests using the finite element method analysis, using bond-slip model of CEB-FIP Model Code 1990 [1] and real properties of test materials, was also carried out and the results are compared with the experimental values. The research was conducted at the Faculty of Engineering of the University of Porto. Keywords: bond; slip; bond stress; normal-strength concrete; RILEM beam test. INTRODUCTION The evaluation of bond characteristics of steel bars in different types of hardened concrete is determinant for hybrid concrete construction. Hybrid concrete construction (HCC) uses different types of concrete, with other materials as steel and different construction techniques, in order to achieve better performance and lower cost. Although in the construction of most buildings the combination of different materials and methods is used, the term HCC, also referred as mixed construction by FIP, 2002, means the rational combination of different material properties and efficient techniques in order to maximize the global structural performance. In this paper, bond properties of reinforcement in four different types of concrete are evaluated for application in a hybrid system developed for flat slabs. This innovative solution consists of precast column zones composed of normal strength concrete (NSC) or steel fibber reinforced concrete (SFRC) and the inside panels made of structural lightweight clay aggregate concrete (SLWCA) cast-in-situ. The structural and economical advantages of this system are, among others, the reduction of the dead weight of the slab, the quality and reliability of precast components and the speed and cost of the construction.
Porto-Portugal, 24-26 July 2006
Editors: J.F. Silva Gomes and Shaker A. Meguid 2
The beam-test, according to Standard RILEM (1982) [5], was used for evaluation of bond properties, maximum bond strength (τmax) and slipping between reinforcement and different types of concrete. Five beam-tests were conducted, on specimens made of four types of concrete, normal strength concrete (NSC), concrete with two different percentages of lightweight clay aggregates partially replacing mineral aggregates (SLWCA1 and SLWCA2) and steel fibber reinforced concrete (SFRC). The reinforcement steel used was a rebar with diameter ∅d = 16 mm with embedded lengths of 10∅d and 5∅d. A numerical simulation of the beam tests using the finite element method analysis was also carried out. The bond-slip model from CEB-FIP Model Code 1990 [1] and real properties of the test materials were used in the numerical simulation.
BOND-SLIP BETWEEN CONCRETE AND REINFORCEMENT
Introduction Bond behaviour between different types of concrete with steel bars is characterized by the relationship between bond stress, τb, and slip, s, achieved from specific standard beam test [5]. Bond stress is the shear stress developed on the contact surface between reinforcement bar and concrete, along embedment length. Slip is the relative displacement between rebar and surrounding concrete.
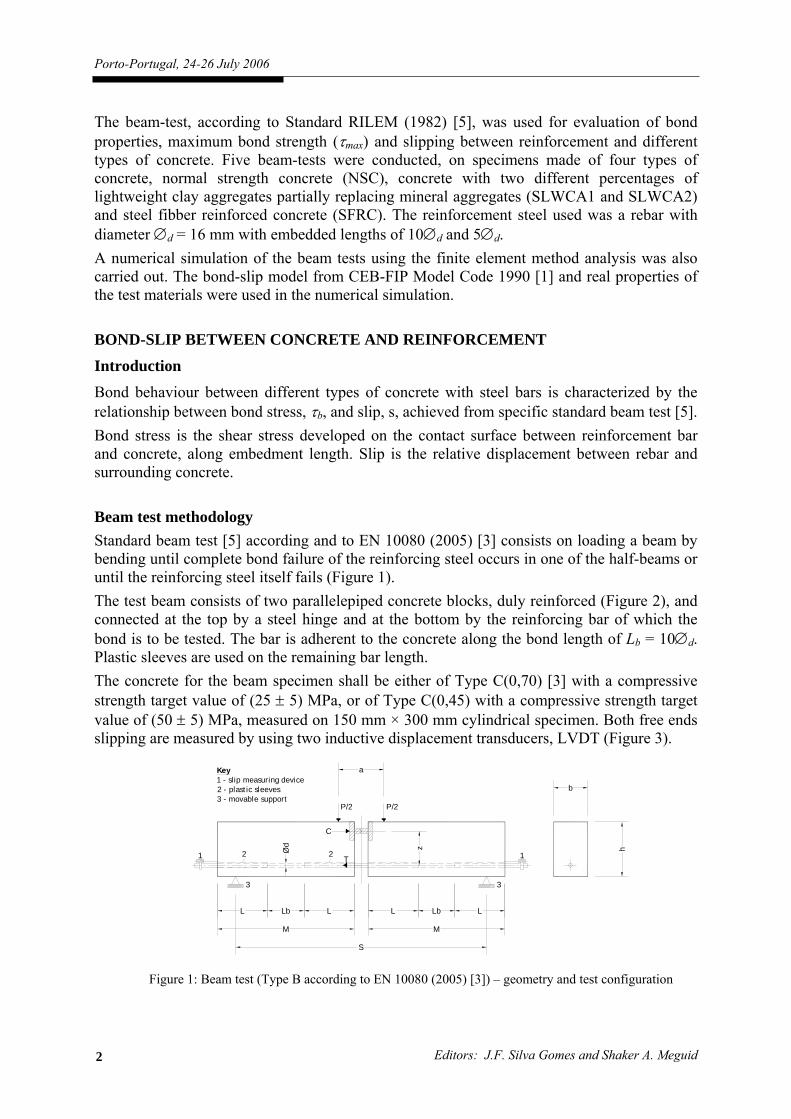
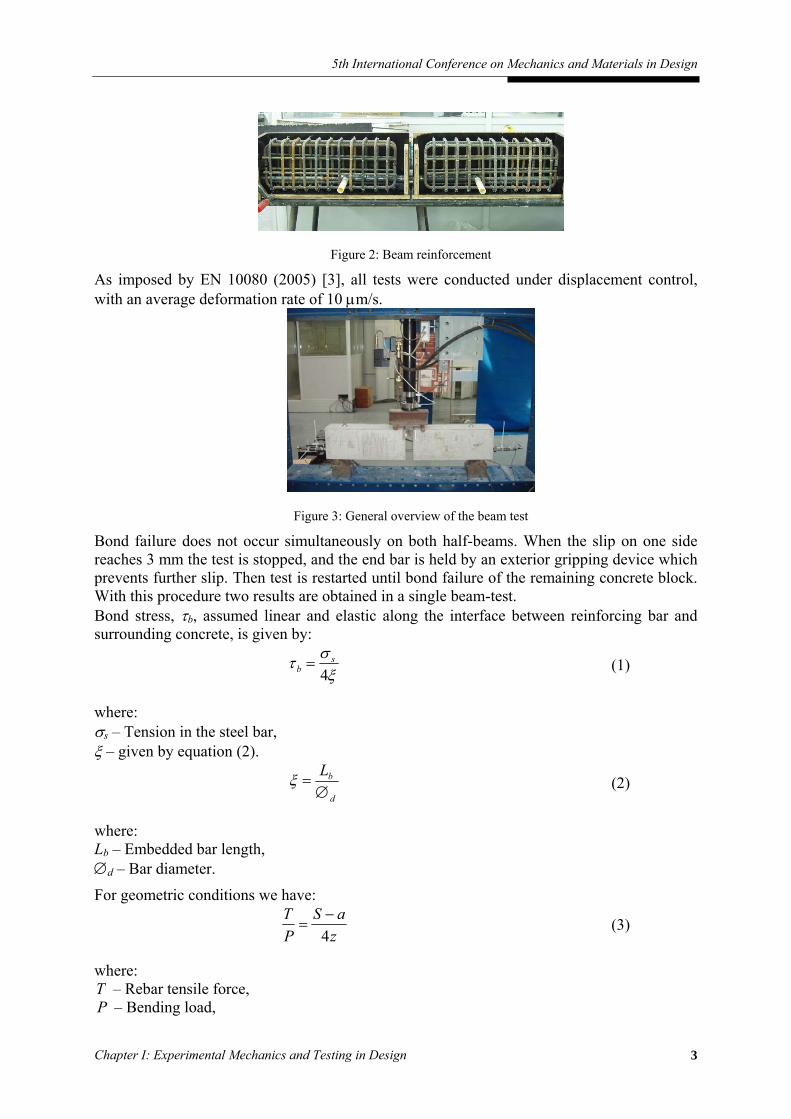
Beam test methodology Standard beam test [5] according and to EN 10080 (2005) [3] consists on loading a beam by bending until complete bond failure of the reinforcing steel occurs in one of the half-beams or until the reinforcing steel itself fails (Figure 1). The test beam consists of two parallelepiped concrete blocks, duly reinforced (Figure 2), and connected at the top by a steel hinge and at the bottom by the reinforcing bar of which the bond is to be tested. The bar is adherent to the concrete along the bond length of Lb = 10∅d. Plastic sleeves are used on the remaining bar length. The concrete for the beam specimen shall be either of Type C(0,70) [3] with a compressive strength target value of (25 ± 5) MPa, or of Type C(0,45) with a compressive strength target value of (50 ± 5) MPa, measured on 150 mm × 300 mm cylindrical specimen. Both free ends slipping are measured by using two inductive displacement transducers, LVDT (Figure 3).
S
M
L
Key1 - slip measuring device2 - plastic sleeves3 - movable support
3
Ød
21
L Lb Lb LL
3
2 T
C
1
z
M
a
h
b
P/2 P/2
Figure 1: Beam test (Type B according to EN 10080 (2005) [3]) – geometry and test configuration
5th International Conference on Mechanics and Materials in Design
Chapter I: Experimental Mechanics and Testing in Design 3
Figure 2: Beam reinforcement
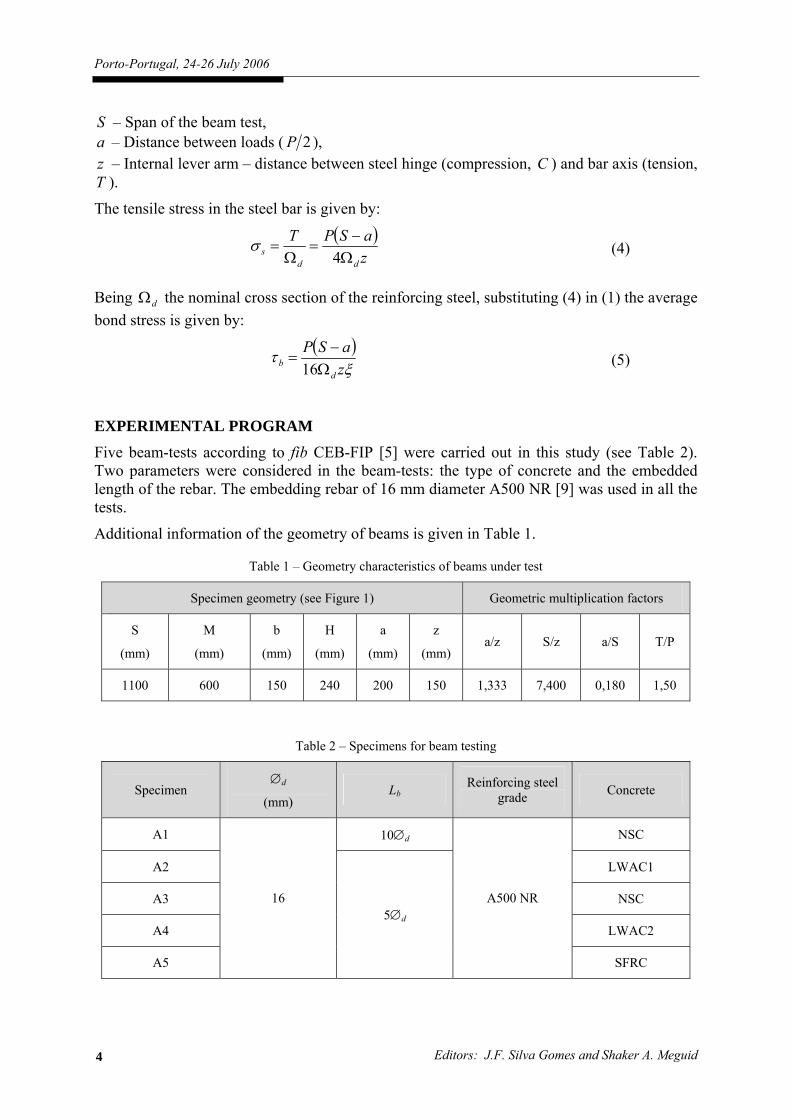
As imposed by EN 10080 (2005) [3], all tests were conducted under displacement control, with an average deformation rate of 10 µm/s.
Figure 3: General overview of the beam test
Bond failure does not occur simultaneously on both half-beams. When the slip on one side reaches 3 mm the test is stopped, and the end bar is held by an exterior gripping device which prevents further slip. Then test is restarted until bond failure of the remaining concrete block. With this procedure two results are obtained in a single beam-test. Bond stress, τb, assumed linear and elastic along the interface between reinforcing bar and surrounding concrete, is given by:
ξστ4
sb =
(1)
where: σs – Tension in the steel bar, ξ – given by equation (2).
d
bL∅
=ξ (2)
where: Lb – Embedded bar length, ∅d – Bar diameter.
For geometric conditions we have:
zaS
PT
4−
= (3)
where: T – Rebar tensile force, P – Bending load,
Porto-Portugal, 24-26 July 2006
Editors: J.F. Silva Gomes and Shaker A. Meguid 4
S – Span of the beam test, a – Distance between loads ( 2P ), z – Internal lever arm – distance between steel hinge (compression, C ) and bar axis (tension, T ).
The tensile stress in the steel bar is given by:
( )zaSPT
dds Ω
−=
Ω=
4σ (4)
Being dΩ the nominal cross section of the reinforcing steel, substituting (4) in (1) the average bond stress is given by:
( )ξ
τzaSP
db Ω
−=
16 (5)
EXPERIMENTAL PROGRAM
Five beam-tests according to fib CEB-FIP [5] were carried out in this study (see Table 2). Two parameters were considered in the beam-tests: the type of concrete and the embedded length of the rebar. The embedding rebar of 16 mm diameter A500 NR [9] was used in all the tests.
Additional information of the geometry of beams is given in Table 1.
Table 1 – Geometry characteristics of beams under test
Specimen geometry (see Figure 1) Geometric multiplication factors
S
(mm)
M
(mm)
b
(mm)
H
(mm)
a
(mm)
z
(mm) a/z S/z a/S T/P
1100 600 150 240 200 150 1,333 7,400 0,180 1,50
Table 2 – Specimens for beam testing
Specimen ∅d
(mm) Lb
Reinforcing steel grade Concrete
A1 10∅d NSC
A2 LWAC1
A3 NSC
A4 LWAC2
A5
16 5∅d
A500 NR
SFRC
5th International Conference on Mechanics and Materials in Design
Chapter I: Experimental Mechanics and Testing in Design 5
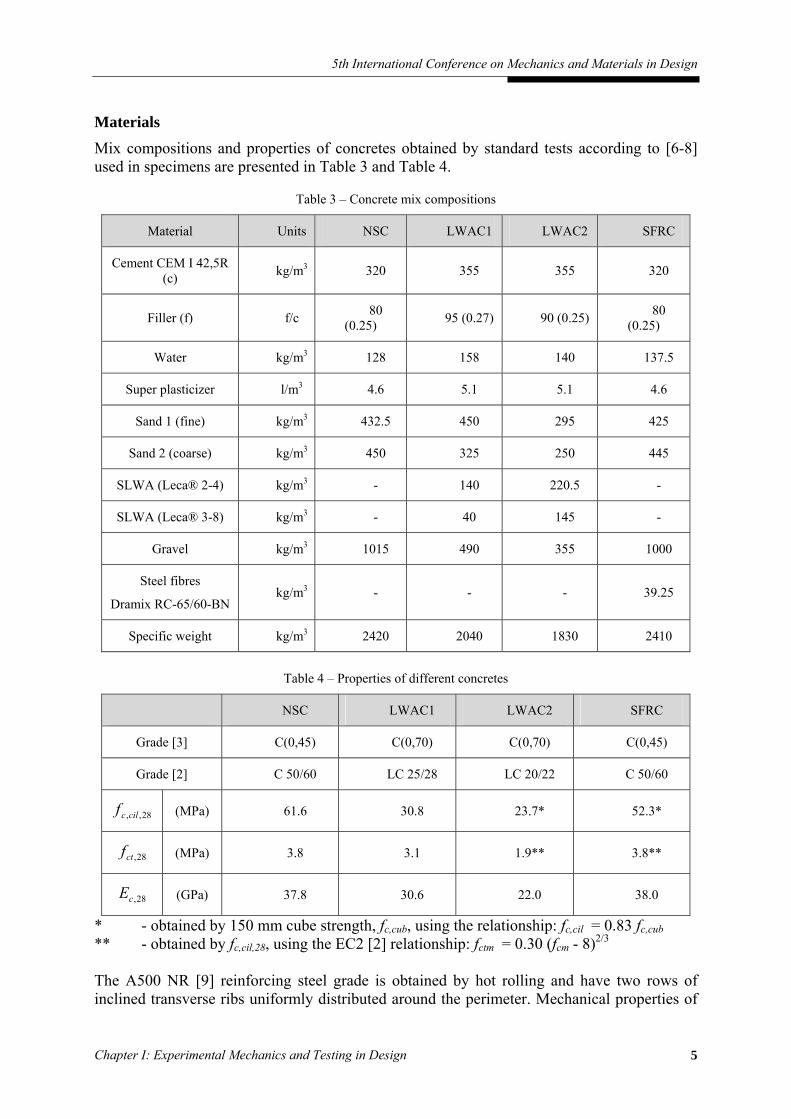
Materials Mix compositions and properties of concretes obtained by standard tests according to [6-8] used in specimens are presented in Table 3 and Table 4.
Table 3 – Concrete mix compositions
Material Units NSC LWAC1 LWAC2 SFRC
Cement CEM I 42,5R (c) kg/m3 320 355 355 320
Filler (f) f/c 80 (0.25) 95 (0.27) 90 (0.25) 80
(0.25)
Water kg/m3 128 158 140 137.5
Super plasticizer l/m3 4.6 5.1 5.1 4.6
Sand 1 (fine) kg/m3 432.5 450 295 425
Sand 2 (coarse) kg/m3 450 325 250 445
SLWA (Leca® 2-4) kg/m3 - 140 220.5 -
SLWA (Leca® 3-8) kg/m3 - 40 145 -
Gravel kg/m3 1015 490 355 1000
Steel fibres
Dramix RC-65/60-BN kg/m3 - - - 39.25
Specific weight kg/m3 2420 2040 1830 2410
Table 4 – Properties of different concretes
NSC LWAC1 LWAC2 SFRC
Grade [3] C(0,45) C(0,70) C(0,70) C(0,45)
Grade [2] C 50/60 LC 25/28 LC 20/22 C 50/60
28,,cilcf (MPa) 61.6 30.8 23.7* 52.3*
28,ctf (MPa) 3.8 3.1 1.9** 3.8**
28,cE (GPa) 37.8 30.6 22.0 38.0
* - obtained by 150 mm cube strength, fc,cub, using the relationship: fc,cil = 0.83 fc,cub ** - obtained by fc,cil,28, using the EC2 [2] relationship: fctm = 0.30 (fcm - 8)2/3 The A500 NR [9] reinforcing steel grade is obtained by hot rolling and have two rows of inclined transverse ribs uniformly distributed around the perimeter. Mechanical properties of
Porto-Portugal, 24-26 July 2006
Editors: J.F. Silva Gomes and Shaker A. Meguid 6
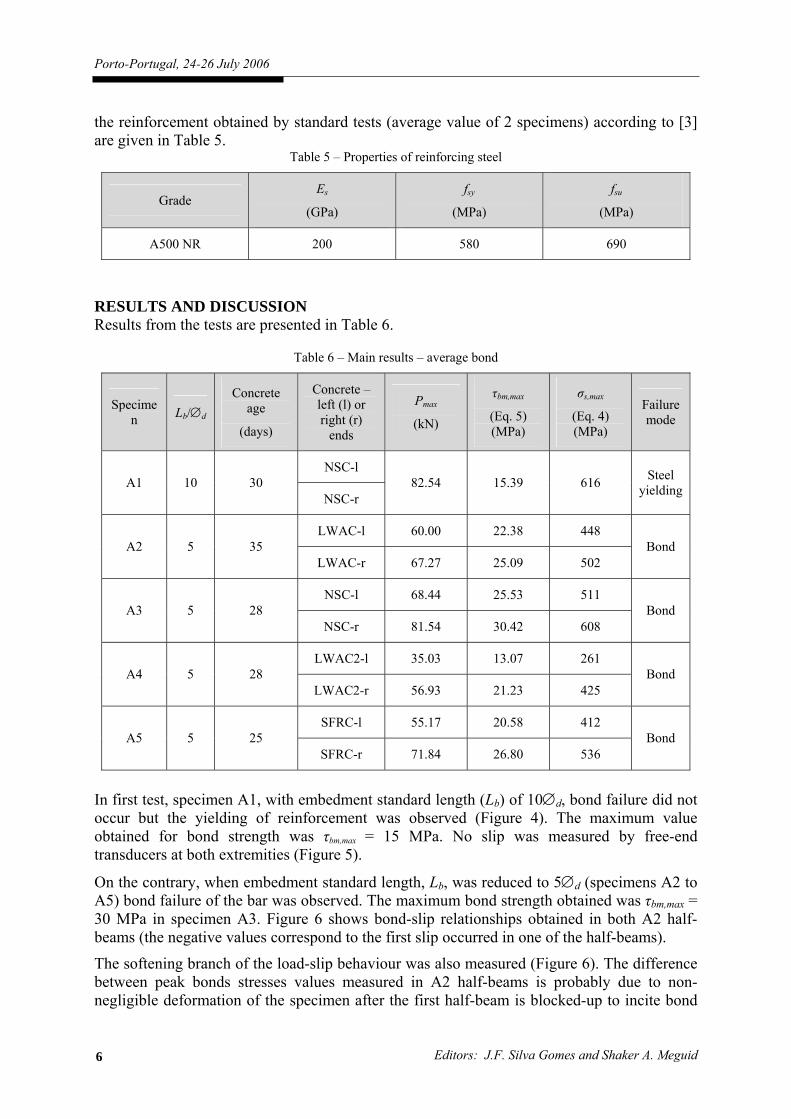
the reinforcement obtained by standard tests (average value of 2 specimens) according to [3] are given in Table 5.
Table 5 – Properties of reinforcing steel
Grade Es
(GPa)
fsy
(MPa)
fsu
(MPa)
A500 NR 200 580 690
RESULTS AND DISCUSSION Results from the tests are presented in Table 6.
Table 6 – Main results – average bond
Specimen Lb/∅d
Concrete age
(days)
Concrete – left (l) or right (r)
ends
Pmax
(kN)
τbm,max
(Eq. 5) (MPa)
σs,max
(Eq. 4) (MPa)
Failure mode
NSC-l A1 10 30
NSC-r 82.54 15.39 616 Steel
yielding
LWAC-l 60.00 22.38 448 A2 5 35
LWAC-r 67.27 25.09 502 Bond
NSC-l 68.44 25.53 511 A3 5 28
NSC-r 81.54 30.42 608 Bond
LWAC2-l 35.03 13.07 261 A4 5 28
LWAC2-r 56.93 21.23 425 Bond
SFRC-l 55.17 20.58 412 A5 5 25
SFRC-r 71.84 26.80 536 Bond
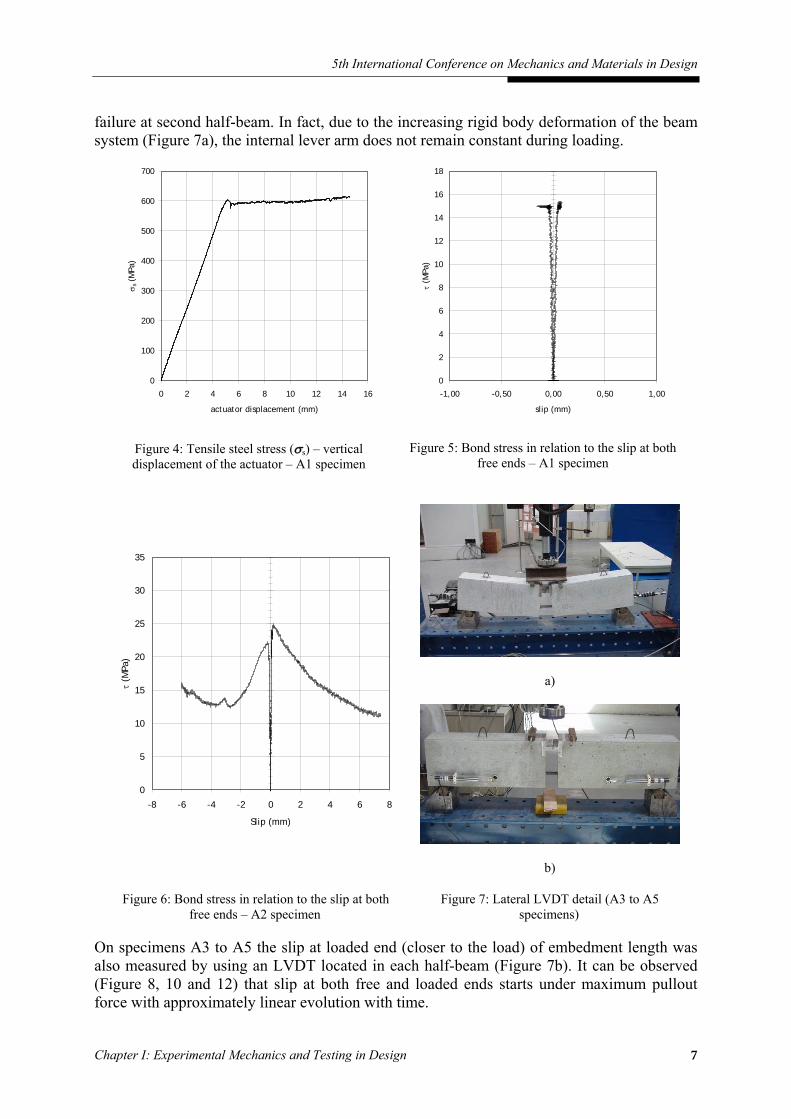
In first test, specimen A1, with embedment standard length (Lb) of 10∅d, bond failure did not occur but the yielding of reinforcement was observed (Figure 4). The maximum value obtained for bond strength was τbm,max = 15 MPa. No slip was measured by free-end transducers at both extremities (Figure 5).
On the contrary, when embedment standard length, Lb, was reduced to 5∅d (specimens A2 to A5) bond failure of the bar was observed. The maximum bond strength obtained was τbm,max = 30 MPa in specimen A3. Figure 6 shows bond-slip relationships obtained in both A2 half-beams (the negative values correspond to the first slip occurred in one of the half-beams).
The softening branch of the load-slip behaviour was also measured (Figure 6). The difference between peak bonds stresses values measured in A2 half-beams is probably due to non-negligible deformation of the specimen after the first half-beam is blocked-up to incite bond
5th International Conference on Mechanics and Materials in Design
Chapter I: Experimental Mechanics and Testing in Design 7
failure at second half-beam. In fact, due to the increasing rigid body deformation of the beam system (Figure 7a), the internal lever arm does not remain constant during loading.
0
100
200
300
400
500
600
700
0 2 4 6 8 10 12 14 16
actuator displacement (mm)
σ s (
MPa
)
0
2
4
6
8
10
12
14
16
18
-1,00 -0,50 0,00 0,50 1,00
slip (mm)
τ (M
Pa)
Figure 4: Tensile steel stress (σs) – vertical displacement of the actuator – A1 specimen
Figure 5: Bond stress in relation to the slip at both free ends – A1 specimen
0
5
10
15
20
25
30
35
-8 -6 -4 -2 0 2 4 6 8
Slip (mm)
τ (M
Pa)
a)
b)
Figure 6: Bond stress in relation to the slip at both free ends – A2 specimen
Figure 7: Lateral LVDT detail (A3 to A5 specimens)
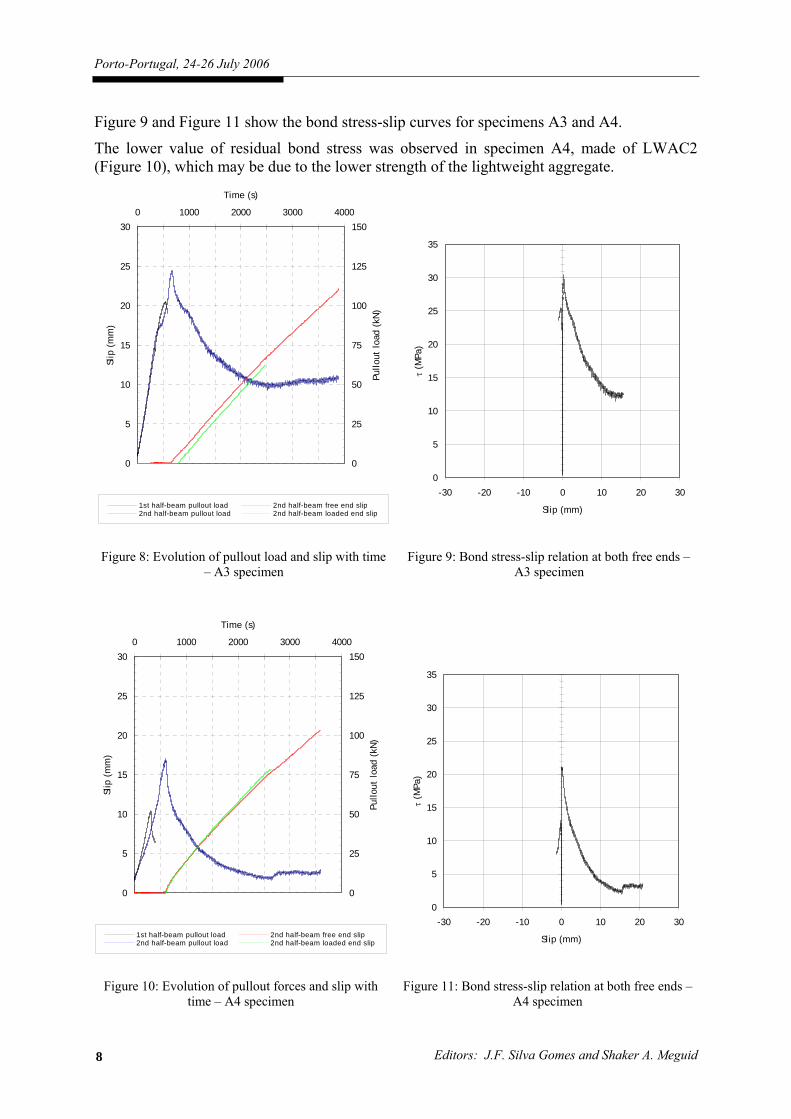
On specimens A3 to A5 the slip at loaded end (closer to the load) of embedment length was also measured by using an LVDT located in each half-beam (Figure 7b). It can be observed (Figure 8, 10 and 12) that slip at both free and loaded ends starts under maximum pullout force with approximately linear evolution with time.
Porto-Portugal, 24-26 July 2006
Editors: J.F. Silva Gomes and Shaker A. Meguid 8
Figure 9 and Figure 11 show the bond stress-slip curves for specimens A3 and A4.
The lower value of residual bond stress was observed in specimen A4, made of LWAC2 (Figure 10), which may be due to the lower strength of the lightweight aggregate.
0
25
50
75
100
125
150
0 1000 2000 3000 4000
Time (s)
Pullo
ut lo
ad (
kN)
0
5
10
15
20
25
30
Slip
(m
m)
1st half-beam pullout load 2nd half-beam pullout load
2nd half-beam free end slip 2nd half-beam loaded end slip
0
5
10
15
20
25
30
35
-30 -20 -10 0 10 20 30
Slip (mm)
τ (M
Pa)
Figure 8: Evolution of pullout load and slip with time – A3 specimen
Figure 9: Bond stress-slip relation at both free ends – A3 specimen
0
25
50
75
100
125
150
0 1000 2000 3000 4000
Time (s)
Pullo
ut lo
ad (
kN)
0
5
10
15
20
25
30
Slip
(m
m)
1st half-beam pullout load 2nd half-beam pullout load
2nd half-beam free end slip 2nd half-beam loaded end slip
0
5
10
15
20
25
30
35
-30 -20 -10 0 10 20 30
Slip (mm)
τ (M
Pa)
Figure 10: Evolution of pullout forces and slip with time – A4 specimen
Figure 11: Bond stress-slip relation at both free ends – A4 specimen
5th International Conference on Mechanics and Materials in Design
Chapter I: Experimental Mechanics and Testing in Design 9
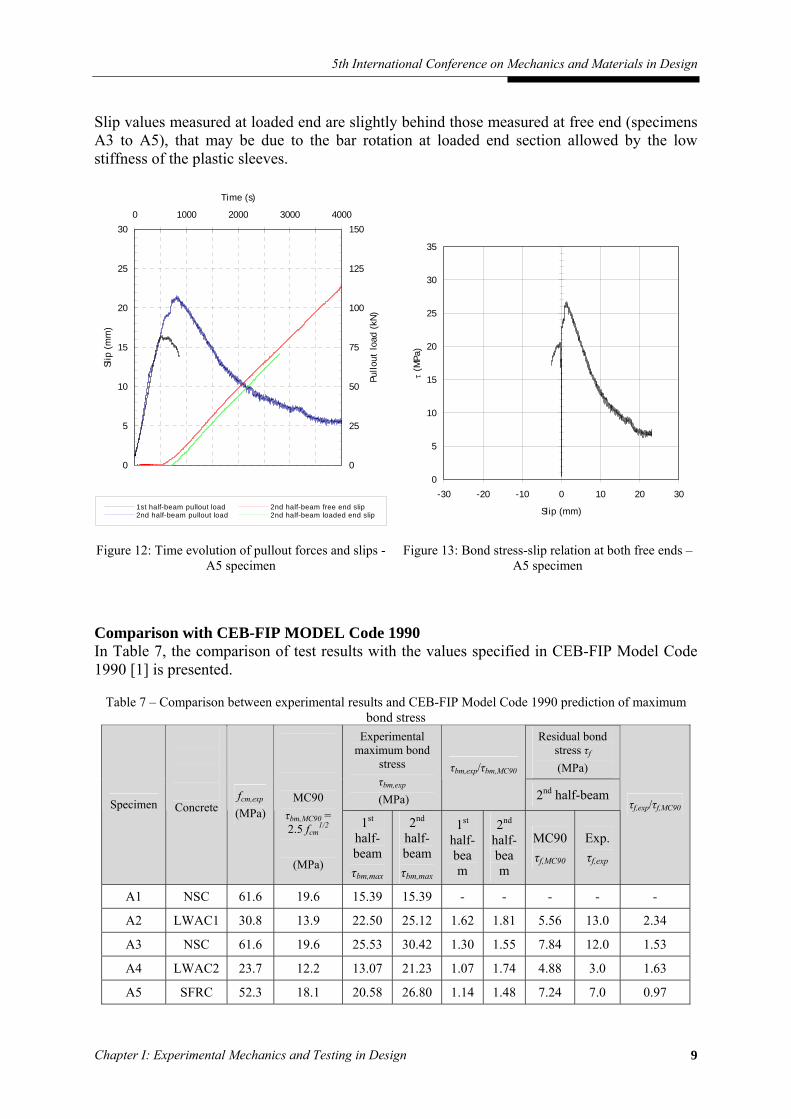
Slip values measured at loaded end are slightly behind those measured at free end (specimens A3 to A5), that may be due to the bar rotation at loaded end section allowed by the low stiffness of the plastic sleeves.
0
25
50
75
100
125
150
0 1000 2000 3000 4000
Time (s)
Pullo
ut lo
ad (
kN)
0
5
10
15
20
25
30
Slip
(m
m)
1st half-beam pullout load 2nd half-beam pullout load
2nd half-beam free end slip 2nd half-beam loaded end slip
0
5
10
15
20
25
30
35
-30 -20 -10 0 10 20 30
Slip (mm)
τ (M
Pa)
Figure 12: Time evolution of pullout forces and slips - A5 specimen
Figure 13: Bond stress-slip relation at both free ends – A5 specimen
Comparison with CEB-FIP MODEL Code 1990 In Table 7, the comparison of test results with the values specified in CEB-FIP Model Code 1990 [1] is presented.
Table 7 – Comparison between experimental results and CEB-FIP Model Code 1990 prediction of maximum bond stress
Residual bond stress τf (MPa)
Experimental maximum bond
stress τbm,exp
(MPa)
τbm,exp/τbm,MC90
2nd half-beam Specimen
Concrete fcm,exp (MPa)
MC90 τbm,MC90 = 2.5 fcm
1/2
(MPa)
1st half-beam τbm,max
2nd half-beam τbm,max
1st half-beam
2nd half-beam
MC90 τf,MC90
Exp. τf,exp
τf,exp/τf,MC90
A1 NSC 61.6 19.6 15.39 15.39 - - - - -
A2 LWAC1 30.8 13.9 22.50 25.12 1.62 1.81 5.56 13.0 2.34
A3 NSC 61.6 19.6 25.53 30.42 1.30 1.55 7.84 12.0 1.53
A4 LWAC2 23.7 12.2 13.07 21.23 1.07 1.74 4.88 3.0 1.63
A5 SFRC 52.3 18.1 20.58 26.80 1.14 1.48 7.24 7.0 0.97
Porto-Portugal, 24-26 July 2006
Editors: J.F. Silva Gomes and Shaker A. Meguid 10
It may be concluded that MC90 [1] underestimate the maximum bond stress and the variability is quite large: the ratio of experimental to predicted bond strength values ranges from 1.07 to 1.62, with an average of 1.35, for the first slid, and from 1.48 to 1.81 with an average of 1.65 for the slid in the second half-beam.
CEB-FIP Model Code 1990 [1] gives, in general, also conservative predictions for the residual bond capacity as shown in Table 7. The ratio of experimental to predicted residual strength values ranges from 1.53 to 2.34. For specimen A5, made of SFRC, the experimental value is behind the one indicated in the code.
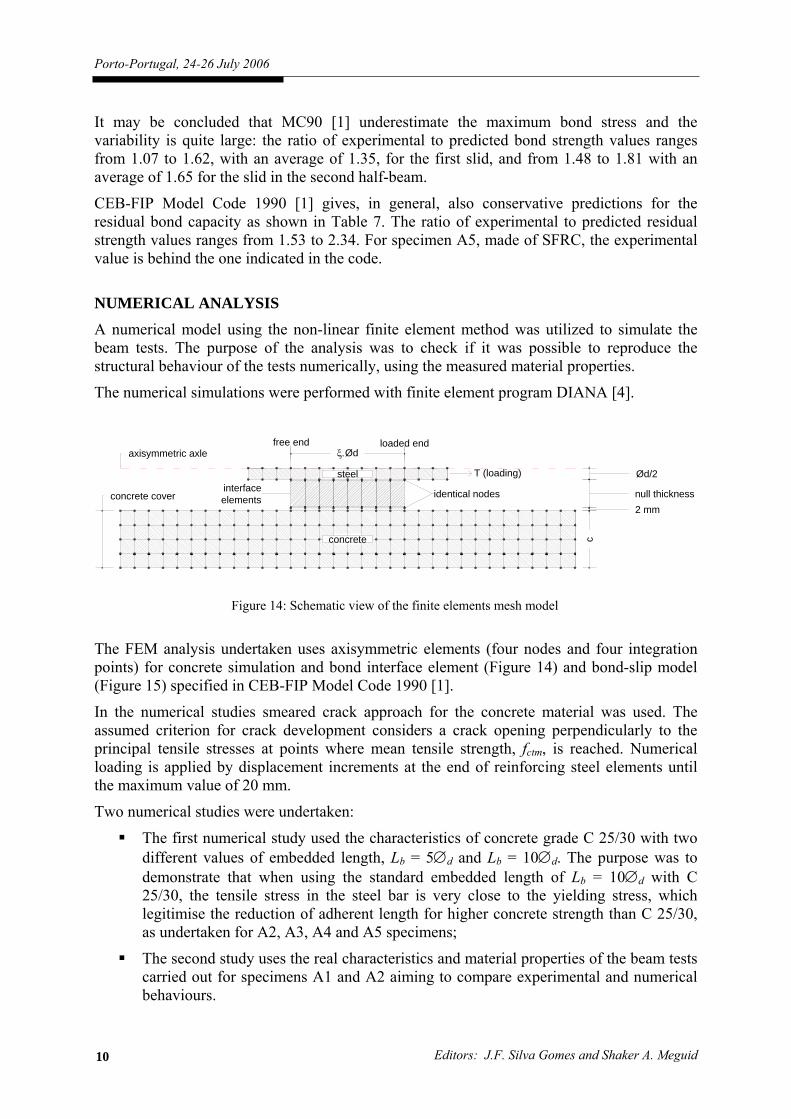
NUMERICAL ANALYSIS A numerical model using the non-linear finite element method was utilized to simulate the beam tests. The purpose of the analysis was to check if it was possible to reproduce the structural behaviour of the tests numerically, using the measured material properties.
The numerical simulations were performed with finite element program DIANA [4].
concrete cover
ξ.Ød
c
2 mmnull thickness
Ød/2
axisymmetric axle
steel
concrete
identical nodesinterfaceelements
T (loading)
loaded endfree end
Figure 14: Schematic view of the finite elements mesh model
The FEM analysis undertaken uses axisymmetric elements (four nodes and four integration points) for concrete simulation and bond interface element (Figure 14) and bond-slip model (Figure 15) specified in CEB-FIP Model Code 1990 [1].
In the numerical studies smeared crack approach for the concrete material was used. The assumed criterion for crack development considers a crack opening perpendicularly to the principal tensile stresses at points where mean tensile strength, fctm, is reached. Numerical loading is applied by displacement increments at the end of reinforcing steel elements until the maximum value of 20 mm.
Two numerical studies were undertaken:
The first numerical study used the characteristics of concrete grade C 25/30 with two different values of embedded length, Lb = 5∅d and Lb = 10∅d. The purpose was to demonstrate that when using the standard embedded length of Lb = 10∅d with C 25/30, the tensile stress in the steel bar is very close to the yielding stress, which legitimise the reduction of adherent length for higher concrete strength than C 25/30, as undertaken for A2, A3, A4 and A5 specimens;
The second study uses the real characteristics and material properties of the beam tests carried out for specimens A1 and A2 aiming to compare experimental and numerical behaviours.
5th International Conference on Mechanics and Materials in Design
Chapter I: Experimental Mechanics and Testing in Design 11
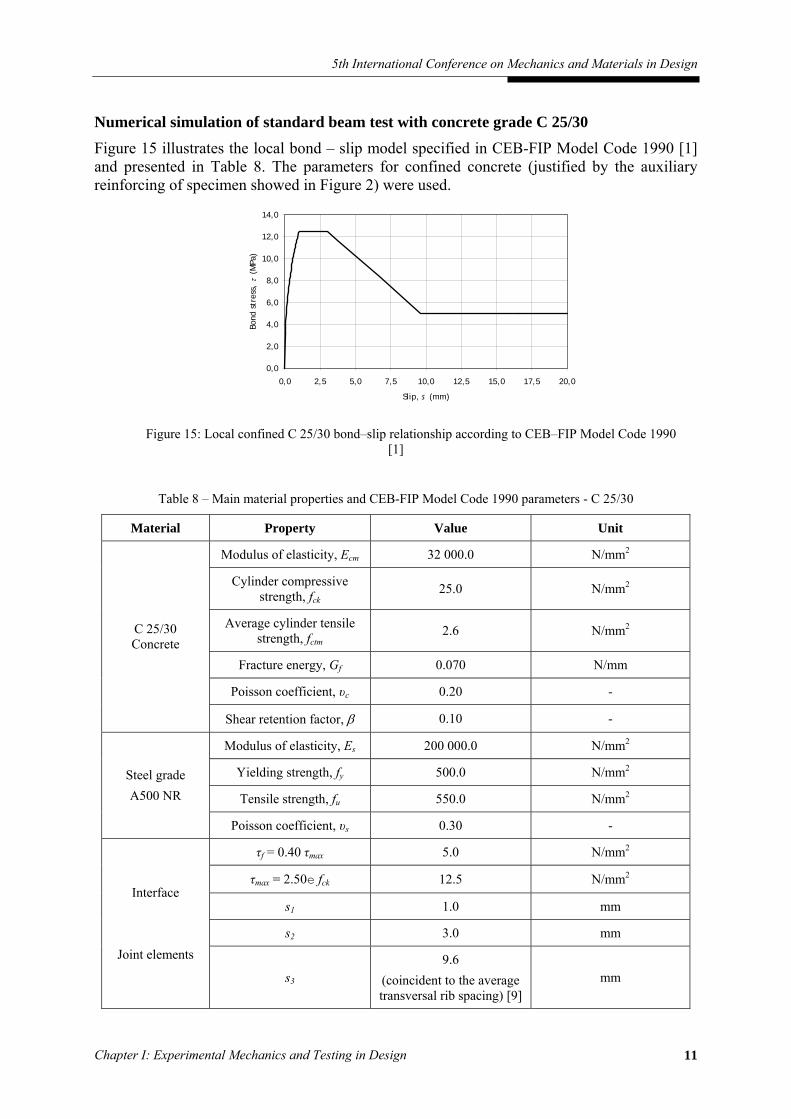
Numerical simulation of standard beam test with concrete grade C 25/30 Figure 15 illustrates the local bond – slip model specified in CEB-FIP Model Code 1990 [1] and presented in Table 8. The parameters for confined concrete (justified by the auxiliary reinforcing of specimen showed in Figure 2) were used.
0,0
2,0
4,0
6,0
8,0
10,0
12,0
14,0
0,0 2,5 5,0 7,5 10,0 12,5 15,0 17,5 20,0
Slip, s (mm)
Bond
str
ess,
τ (
MPa
)
Figure 15: Local confined C 25/30 bond–slip relationship according to CEB–FIP Model Code 1990 [1]
Table 8 – Main material properties and CEB-FIP Model Code 1990 parameters - C 25/30
Material Property Value Unit
Modulus of elasticity, Ecm 32 000.0 N/mm2
Cylinder compressive strength, fck
25.0 N/mm2
Average cylinder tensile strength, fctm 2.6 N/mm2
Fracture energy, Gf 0.070 N/mm
Poisson coefficient, υc 0.20 -
C 25/30 Concrete
Shear retention factor, β 0.10 -
Modulus of elasticity, Es 200 000.0 N/mm2
Yielding strength, fy 500.0 N/mm2
Tensile strength, fu 550.0 N/mm2
Steel grade A500 NR
Poisson coefficient, υs 0.30 -
τf = 0.40 τmax 5.0 N/mm2
τmax = 2.50e fck 12.5 N/mm2
s1 1.0 mm
s2 3.0 mm
Interface
Joint elements
s3 9.6
(coincident to the average transversal rib spacing) [9]
mm
Porto-Portugal, 24-26 July 2006
Editors: J.F. Silva Gomes and Shaker A. Meguid 12
The following equations define the graph’s branches:
( ) 11max 0for ssssττ α ≤≤= (6)
21max for sss ≤<=ττ (7)
( ) 3223
2maxmax for - sss
ssss
f ≤<⎟⎟⎠
⎞⎜⎜⎝
⎛−−
⋅−= ττττ (8)
ssf <= 3for ττ (9)
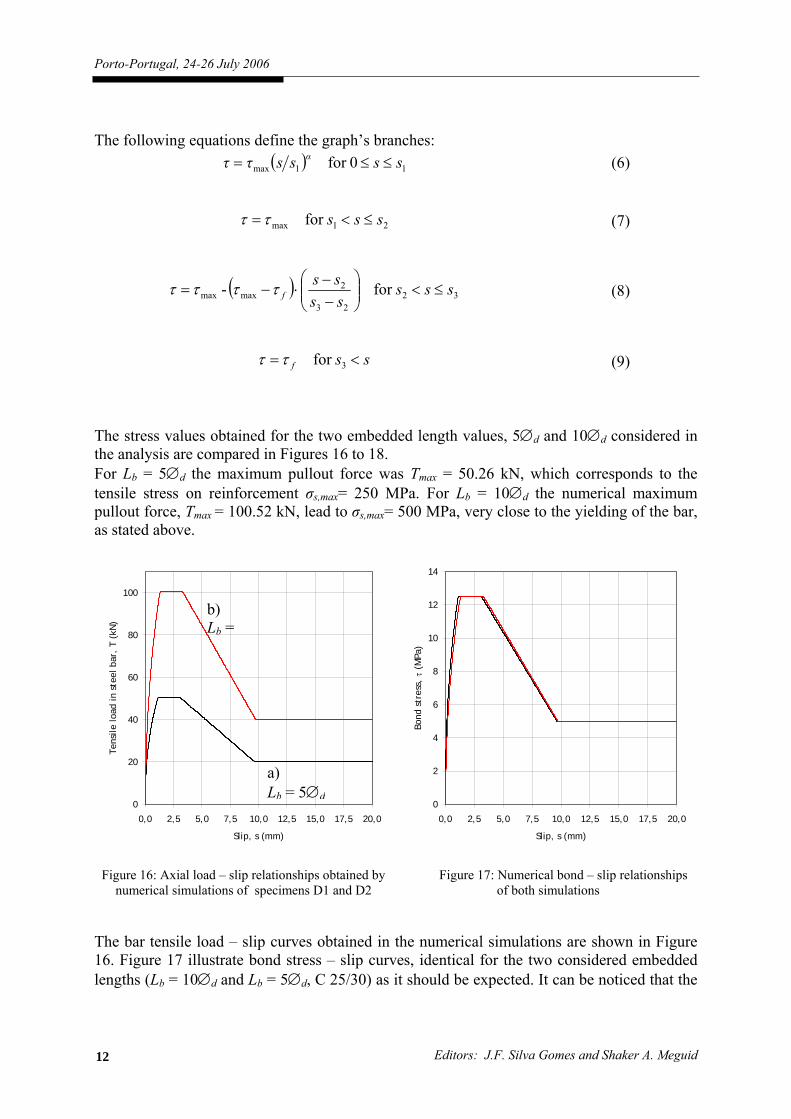
The stress values obtained for the two embedded length values, 5∅d and 10∅d considered in the analysis are compared in Figures 16 to 18. For Lb = 5∅d the maximum pullout force was Tmax = 50.26 kN, which corresponds to the tensile stress on reinforcement σs,max= 250 MPa. For Lb = 10∅d the numerical maximum pullout force, Tmax = 100.52 kN, lead to σs,max= 500 MPa, very close to the yielding of the bar, as stated above.
0
20
40
60
80
100
0,0 2,5 5,0 7,5 10,0 12,5 15,0 17,5 20,0
Slip, s (mm)
Tens
ile lo
ad in
ste
el b
ar,
T (k
N)
0
2
4
6
8
10
12
14
0,0 2,5 5,0 7,5 10,0 12,5 15,0 17,5 20,0
Slip, s (mm)
Bond
str
ess,
τ (
MPa
)
Figure 16: Axial load – slip relationships obtained by numerical simulations of specimens D1 and D2
Figure 17: Numerical bond – slip relationships of both simulations
The bar tensile load – slip curves obtained in the numerical simulations are shown in Figure 16. Figure 17 illustrate bond stress – slip curves, identical for the two considered embedded lengths (Lb = 10∅d and Lb = 5∅d, C 25/30) as it should be expected. It can be noticed that the
a) Lb = 5∅d
b) Lb =
5th International Conference on Mechanics and Materials in Design
Chapter I: Experimental Mechanics and Testing in Design 13
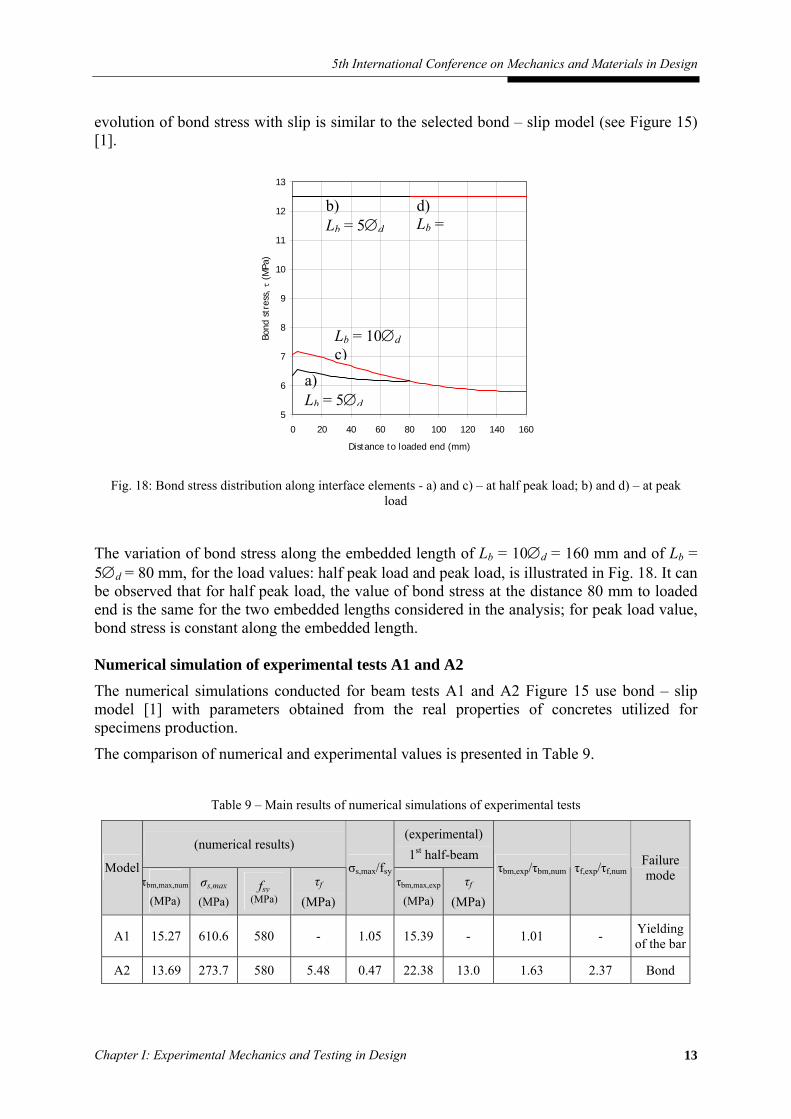
evolution of bond stress with slip is similar to the selected bond – slip model (see Figure 15) [1].
5
6
7
8
9
10
11
12
13
0 20 40 60 80 100 120 140 160
Distance to loaded end (mm)
Bond
str
ess,
τ (
MPa
)
Fig. 18: Bond stress distribution along interface elements - a) and c) – at half peak load; b) and d) – at peak load
The variation of bond stress along the embedded length of Lb = 10∅d = 160 mm and of Lb = 5∅d = 80 mm, for the load values: half peak load and peak load, is illustrated in Fig. 18. It can be observed that for half peak load, the value of bond stress at the distance 80 mm to loaded end is the same for the two embedded lengths considered in the analysis; for peak load value, bond stress is constant along the embedded length. Numerical simulation of experimental tests A1 and A2 The numerical simulations conducted for beam tests A1 and A2 Figure 15 use bond – slip model [1] with parameters obtained from the real properties of concretes utilized for specimens production.
The comparison of numerical and experimental values is presented in Table 9.
Table 9 – Main results of numerical simulations of experimental tests
(numerical results) (experimental) 1st half-beam
Model τbm,max,num
(MPa) σs,max (MPa)
fsy (MPa)
τf (MPa)
σs,max/fsyτbm,max,exp
(MPa) τf
(MPa)
τbm,exp/τbm,num τf,exp/τf,num Failure mode
A1 15.27 610.6 580 - 1.05 15.39 - 1.01 - Yielding of the bar
A2 13.69 273.7 580 5.48 0.47 22.38 13.0 1.63 2.37 Bond
a) Lb = 5∅d
Lb = 10∅d c)
d) Lb =
b) Lb = 5∅d
Porto-Portugal, 24-26 July 2006
Editors: J.F. Silva Gomes and Shaker A. Meguid 14
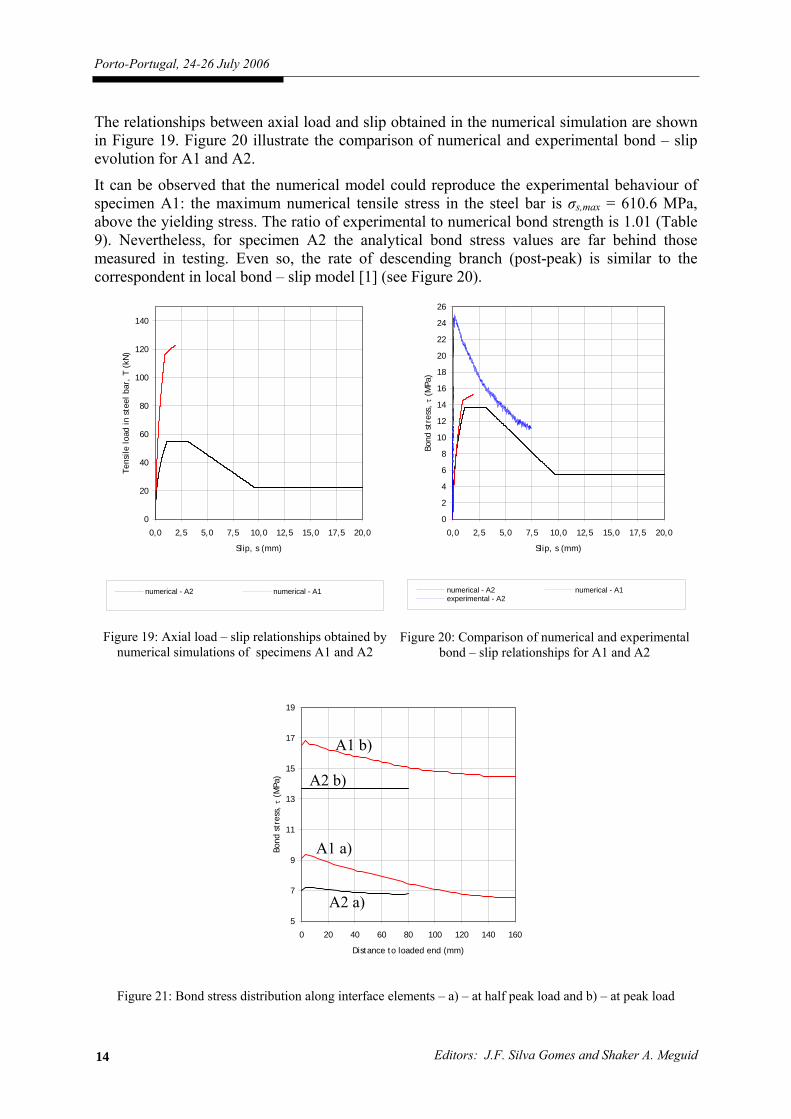
The relationships between axial load and slip obtained in the numerical simulation are shown in Figure 19. Figure 20 illustrate the comparison of numerical and experimental bond – slip evolution for A1 and A2.
It can be observed that the numerical model could reproduce the experimental behaviour of specimen A1: the maximum numerical tensile stress in the steel bar is σs,max = 610.6 MPa, above the yielding stress. The ratio of experimental to numerical bond strength is 1.01 (Table 9). Nevertheless, for specimen A2 the analytical bond stress values are far behind those measured in testing. Even so, the rate of descending branch (post-peak) is similar to the correspondent in local bond – slip model [1] (see Figure 20).
0
20
40
60
80
100
120
140
0,0 2,5 5,0 7,5 10,0 12,5 15,0 17,5 20,0
Slip, s (mm)
Tens
ile lo
ad in
ste
el b
ar,
T (k
N)
0
2
4
6
8
10
12
14
16
18
20
22
24
26
0,0 2,5 5,0 7,5 10,0 12,5 15,0 17,5 20,0
Slip, s (mm)
Bond
str
ess,
τ (
MPa
)
numerical - A2 numerical - A1
Figure 19: Axial load – slip relationships obtained by numerical simulations of specimens A1 and A2
numerical - A2 experimental - A2
numerical - A1
Figure 20: Comparison of numerical and experimental bond – slip relationships for A1 and A2
5
7
9
11
13
15
17
19
0 20 40 60 80 100 120 140 160
Distance to loaded end (mm)
Bond
str
ess,
τ (
MPa
)
Figure 21: Bond stress distribution along interface elements – a) – at half peak load and b) – at peak load
A2 a)
A1 a)
A2 b)
A1 b)
5th International Conference on Mechanics and Materials in Design
Chapter I: Experimental Mechanics and Testing in Design 15
The variation of bond stress along the embedded length of Lb = 10∅d = 160 mm, in specimen A1 (NSC) and of Lb = 5∅d = 80 mm, in specimen A2 (LWAC), for the load values: half peak load and peak load, is illustrated in Figure 21. It can be observed that bond stress decreases from loaded end to free end as it should be expected.
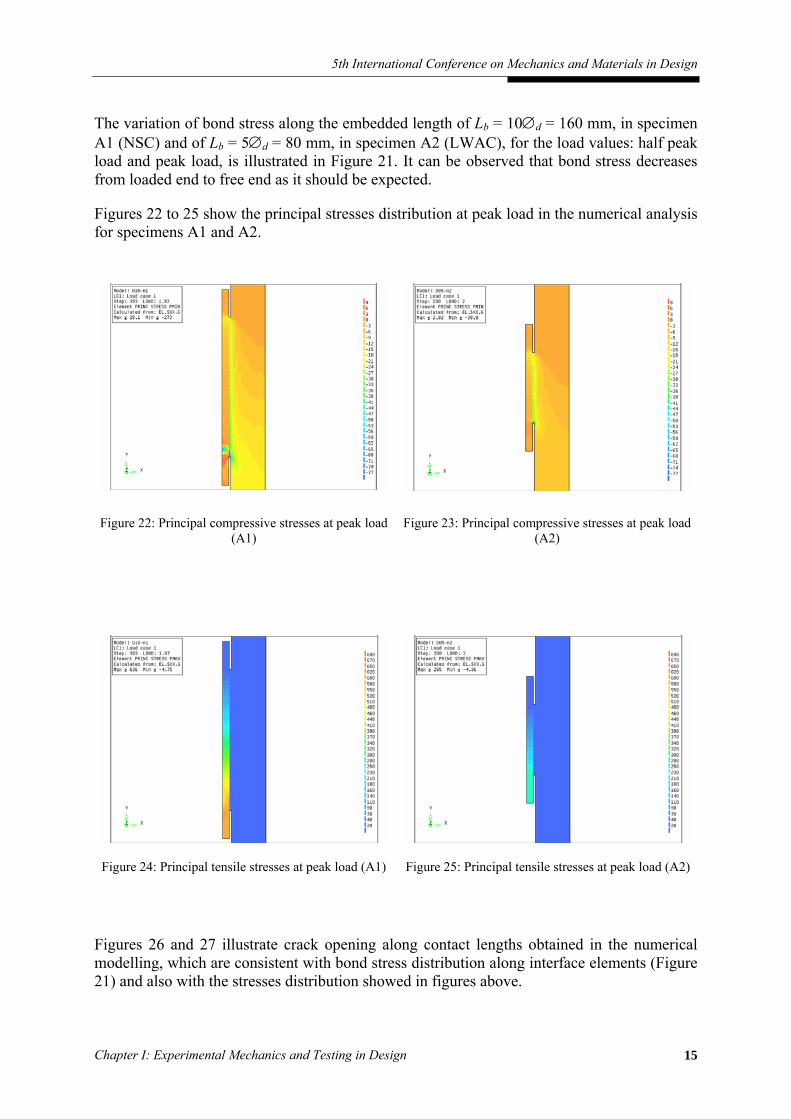
Figures 22 to 25 show the principal stresses distribution at peak load in the numerical analysis for specimens A1 and A2.
Figure 22: Principal compressive stresses at peak load (A1)
Figure 23: Principal compressive stresses at peak load (A2)
Figure 24: Principal tensile stresses at peak load (A1) Figure 25: Principal tensile stresses at peak load (A2)
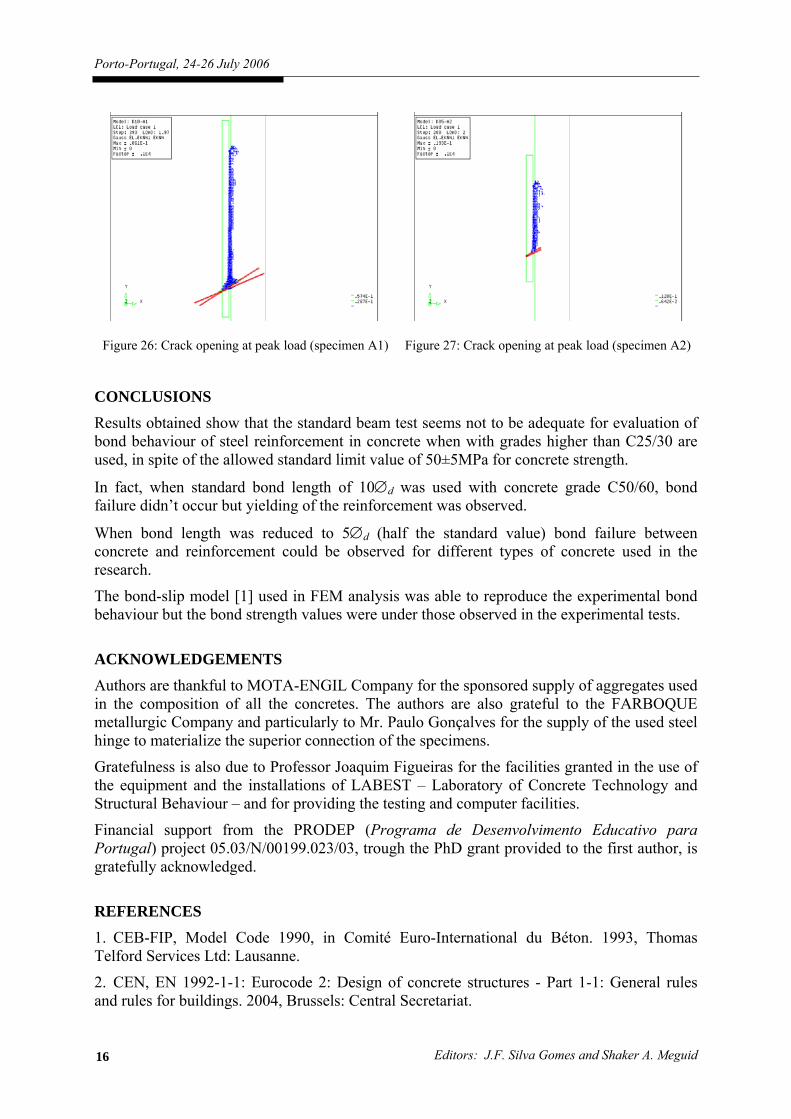
Figures 26 and 27 illustrate crack opening along contact lengths obtained in the numerical modelling, which are consistent with bond stress distribution along interface elements (Figure 21) and also with the stresses distribution showed in figures above.
Porto-Portugal, 24-26 July 2006
Editors: J.F. Silva Gomes and Shaker A. Meguid 16
Figure 26: Crack opening at peak load (specimen A1) Figure 27: Crack opening at peak load (specimen A2)
CONCLUSIONS Results obtained show that the standard beam test seems not to be adequate for evaluation of bond behaviour of steel reinforcement in concrete when with grades higher than C25/30 are used, in spite of the allowed standard limit value of 50±5MPa for concrete strength.
In fact, when standard bond length of 10∅d was used with concrete grade C50/60, bond failure didn’t occur but yielding of the reinforcement was observed.
When bond length was reduced to 5∅d (half the standard value) bond failure between concrete and reinforcement could be observed for different types of concrete used in the research.
The bond-slip model [1] used in FEM analysis was able to reproduce the experimental bond behaviour but the bond strength values were under those observed in the experimental tests.
ACKNOWLEDGEMENTS Authors are thankful to MOTA-ENGIL Company for the sponsored supply of aggregates used in the composition of all the concretes. The authors are also grateful to the FARBOQUE metallurgic Company and particularly to Mr. Paulo Gonçalves for the supply of the used steel hinge to materialize the superior connection of the specimens.
Gratefulness is also due to Professor Joaquim Figueiras for the facilities granted in the use of the equipment and the installations of LABEST – Laboratory of Concrete Technology and Structural Behaviour – and for providing the testing and computer facilities.
Financial support from the PRODEP (Programa de Desenvolvimento Educativo para Portugal) project 05.03/N/00199.023/03, trough the PhD grant provided to the first author, is gratefully acknowledged.
REFERENCES 1. CEB-FIP, Model Code 1990, in Comité Euro-International du Béton. 1993, Thomas Telford Services Ltd: Lausanne.
2. CEN, EN 1992-1-1: Eurocode 2: Design of concrete structures - Part 1-1: General rules and rules for buildings. 2004, Brussels: Central Secretariat.
5th International Conference on Mechanics and Materials in Design
Chapter I: Experimental Mechanics and Testing in Design 17
3. CEN, EN 10080 - Steel for the reinforcement of concrete - Weldable reinforcing steel - General. 2005, Central Secretariat: Brussels.
4. DIANA, Finite Element Analysis, D. o. C. Research, Editor. 2002, TNO Building and Construction Research: Delft, The Netherlands.
5. fib.CEB-FIP, Bond of reinforcement in concrete - Bulletin 10. International Federation for Structural Concrete (fib) ed. Vol. State-of-art report prepared by Task Group Bond Models (former CEB Task Group 2.5). 2000, Lausanne: fib. 427.
6. IPQ, NP ENV 206 European standard - Concrete - performance, production placing and compliance criteria. Instituto Português da Qualidade ed. 1993, Lisboa: Comité Europeu de Normalização. 54 (in Portuguese).
7. IPQ, NP EN 12390-3 European standard: Testing hardened concrete - Part 3: Compressive strength of test specimens. 2003. p. 21 (in Portuguese).
8. IPQ, NP EN 12390-6 European standard: Testing hardened concrete - Part 6: Tensile splitting strength of test specimens. 2003. p. 14 (in Portuguese).
9. LNEC, E 450-1998 - Especificação LNEC - Varões de aço A500 NR para armaduras de betão armado - características, ensaios e marcação. 1998, Lisboa: LNEC. (in Portuguese).