experimental and numerical modeling of solidification...
TRANSCRIPT

1 Think Solidification, LLC., 2033 Gateway Place Suite 500, San Jose, CA, U. S. A. 2 United States Steel Corporation, Research and Technology Center, 800 E. Waterfront Drive, Munhall,
PA, U.S.A. 3 Carnegie Mellon University, Department of Materials Science and Engineering, 5000 Forbes Avenue,
Pittsburgh, PA, U. S. A.
SALEM MOSBAH 1, THINIUM T. NATARAJAN 2, PIYAMANEE KOMOLWIT 2,
BRYAN D. WEBLER 3, RAFAEL C. GIACOMIN 3
EXPERIMENTAL AND NUMERICAL MODELING OF SOLIDIFICATION
GRAIN STRUCTURE AND SEGREGATION IN INGOT CASTING
PROCESS
Abstract
This paper presents an experimental and numerical investigation of the alloying elements
distribution and the evolution of solidification grain structure during ingot casting of carbon-
manganese-silicon steel grades. An experimental setup consisting of a rectangular ingot was
used to study the solidification conditions of an ingot cast steel. The cooling profile of the
system was recorded and used as an input to the solidification model. Metallographic
analyses were carried out to reveal the grain structure, and solute elements distribution. A
comprehensive numerical model was developed to take into account the effect of the
thermosolutal buoyancy forces driving the overall segregation at the casting scale. The
solidification process is simulated using a coupled Finite Volume (FV) and a Discrete
Particle (DP) grain envelope tracking models. The resolution of FV balance equations and the
Lagrangian tracking of the grain structure were implemented using the open source C++
library OpenFOAM. Preliminary comparisons of the modeling results against the
experimental results are presented. The model predictions of the grain structure of the ingot
cast steel were in line with the experimental results. The model highlighted the effect of the
nominal alloy chemistry on the coupled interaction of the solutal and thermal buoyancy
forces on macrosegregation. It is found that the addition of silicon helps smooth out the
strong convection that is primarily controlled by the carbon induced thermal buoyancy force.
Keywords
Casting, Solidification, Segregation, Grain Structure, Modeling.
Introduction
Numerical modeling is a useful tool to improve the quality of as-cast steel products. The
predictions can help guide the casting process design and for greater control of phases and
alloying elements distribution, which is a challenge. Indeed, metallic alloys solidification is
characterized by complex interactions between the fluid flow, heat and mass transfer at two
scales; i.e. the macroscopic (~10-2m) and the grain structure at the microscopic (~10-6m). The
bulk fluid flow, heat and solute exchanges can be studied at the macroscopic scale using
volume averaged models. However, a finer spatial discretization is required to accurately
describe the dendritic features. Phase Field (PF) based numerical models can predict the
solid/liquid interface instability and the resulting dendritic morphology. Still, PF based
numerical models require intensive computational resources for even a cubic millimeter
volume with few grains. The recently developed Dendritic Needle Network (DNN) approach
provides a faster way to study grains boundaries and solute redistribution at a micro-scale,
however its concrete industrial application is inherently limited and fluid flow is often
neglected [1]. Other modeling methodologies focus on predicting the resulting grains
boundaries and are often referred to as mesoscopic tracking models [2]. Again, the inherent

computational resources and time requirements render such methods unsuitable for studying
solidification grain structure in industrial size castings.
With continuous improvement of volume averaging based models, numerous studies of
macrosegregation of alloying elements during solidification of alloys have been published [3-
9]. Beckermann [4] and Pickering [5] reviewed the status of macrosegregation modeling in
cast metals and provided numerous references on this topic. In the area of steel casting, Gu
and Beckermann [7] numerically simulated the macrosegregation of carbon and sulfur in a 46
ton ingot using a two-dimensional model of the coupled advection-diffusion equation. The
effect of alloy segregation behavior on the solutal buoyancy effect was considered. A three-
dimensional model of the same problem was developed by Sundarraj and Miller [9].
However, in all these studies, the solidification grain structure was not included due to the
lack of a scalable modeling scheme of the grain structure.
Species distribution at the scale of the dendrite arm spacing is correlated to the structural
features and is critical to the final product thermomechanical properties [10]. In addition, this
micro-segregation is highly correlated to the cooling rate, a typical process input parameter.
The cooling rates in a continuously cast slab can range from 1°C/min to 10°C/min and can
lead to a secondary dendrite arm spacing on the order of 100 µm to 200 µm. Equally
important is macrosegregation, which is the result of a complex bulk flow driven by solute
enriched interdendritic fluid. Both micro and macro segregation can also be influenced by
thermomechanical deformation of the solidified shell.
The focus of this work is the study of macrosegregation resulting from solutal and thermal
buoyancy forces for a rigid body multicomponent system [9]. A specially designed and
instrumented mold was used to cast a laboratory melt of carbon-manganese-silicon
containing steel. The heat flux at the ingot surface, a key process boundary condition, was
determined by measuring the temperature profile of the mold wall. In addition,
metallographic analysis was carried out on the as-cast ingot. This experimental investigation
is used to test the performance of a scalable meshless solidification grain envelope tracking
scheme, SPrime, to compute the effect of element distribution on the grain structure.
Comparisons of model predictions to the measured alloy segregation, grain structure, and
grain size in the ingots are illustrated.
Experimental Model
The solidification grain structure observed in a slice of a continuous cast strand has
similarities to that in an ingot; i.e. the same grain structure is reproduced in a Lagrangian
frame of reference attached to the continuous cast strand. Based on this assumption, a set of
three carbon-manganese-silicon steel alloys, selected based on the typical composition of
high strength steel published by Demoor et al [10], were melted in an induction furnaces.
Table 1 lists the nominal composition of each experimental alloy, the type of furnace used,
and the dimensions of the ingots. Samples M2 and M3 were melted in a vacuum induction
furnace to reduce nitrogen pickup. Once the temperature of molten steel reached 1923oK, it
was poured into a cast iron ingot mold using a refractory tundish vessel. Chill scrap was used
at the bottom of the mold to quench the liquid steel and prevent leaks, and a hot top cover
was added to minimize shrinkage pipe formation. During the open air melting of M1, a mold
flux cover was used to reduce the pickup of nitrogen from the atmosphere.
The front and left side of the mold walls were instrumented with thermocouples, as shown in
Figure 1a. The collected data was used to calculate the heat flux at the ingot/mold boundary
during solidification of sample M1. The mold was made of two identical L-shaped parts held
together by steel bands. One half of the mold was instrumented with 16 Type K
thermocouples sheathed in stainless steel. The thermocouple positions are shown in Figure 1c
and consisted of a grid of 5 columns by 3 rows. The thermocouple holes were machined so
that the tip of the thermocouple was at a distance of 2 mm from the ingot mold hot face’s.
The thermocouple setup relied on mechanical contact at the thermocouple tip. In addition, the
temperature of the mold surface was measured with an infrared thermal camera. The data
from the infrared camera was recorded every two minutes until the ingot was fully solidified.
Table 1. Nominal steel chemistry, ingot dimensions, and furnace used to melt the steel.
Sample C[wt%] Mn[wt%] Si[wt%] TL[K] Ingot Weight, Dimensions Furnace Type
M1 0.23 2.25 1.5 1758 125 Kg, 125 x 350 x 350 mm3 Open Air
M2 0.19 3.03 0.51 1775 50 Kg, 75 x 200 x 250 mm3 VIM
M3 0.19 3.03 1.6 1757 50 Kg, 75 x 200 x 250 mm3 VIM
Solidification of the M1 ingot was complete in about 20 minutes. The data from the infrared
thermal camera was processed using the open source software R. Thermocouple data were
sampled at a rate of 10 Hz. Based on the distance between the thermocouple tip and the hot
face of the ingot, one-dimensional inverse heat conduction methodology was used to derive
the optimal time step for stable prediction of heat flux. This time step was on the order of one
second. Use of a time step smaller than the calculated time step led to noise in the calculated
heat flux. Therefore, the temperature data from the thermocouples sampled at 10 samples per
second were averaged to provide temperature values every 1.3 seconds.
The ingot was cut along the central planes and then etched with hydrochloric acid heated to
80° C to study the solidification macrostructure. The composition map of manganese in the
as-cast ingot was measured by micro X-ray fluorescence (XRF) composition mapping using a
Bruker M4 Tornado. A 25 µm X-ray beam spot size with a step size of 25 µm was used to get
a good resolution of manganese redistribution in the ingot. The microstructure was
characterized in terms of grain size and secondary dendrite arm spacing (SDAS). Samples
that were used to ascertain the grain size and dendrite arm spacing were mounted in Bakelite
and polished to a 1 µm finish. In order to measure secondary dendrite arm spacing, an etchant
consisting of 170 mL saturated picric acid, 30 mL deionized water, 6 grams of wetting agent
(sodium dodecylbenzene sulfonate) was used. This mixture was heated to 50° to 70° C and
then 1.6 mL of concentrated hydrochloric acid was added [11]. The light optical microscopy
(LOM) images were obtained using a Zeiss Axio Imager M2m upright optical microscope.
Numerical Model
The recorded mold temperature was used to calculate the heat flux extracted from the M1
ingot as a function of time. In addition, a numerical solidification model, SPrime, was
developed to predict the solidification grain structure and the solute distribution as a result of
thermal and solutal buoyancy forces. The model integrates two solvers: Finite Volume (FV)
to simulate the macroscale physics at the representative finite volume scale, and Discrete
Particle (DP), an advanced grain envelope tracking model at the mesoscale (order of
magnitude of the secondary dendrite arms spacing, SDAS). Both approaches are briefly
detailed below.

a-
b- c-
Fig. 1. The experimental setup consisting of two symmetrical L shaped parts cast iron halves
held together by steel bands is shown. (a. and b.) One of the L-shaped ingot walls is
instrumented to allow the monitoring of the temperature close to the ingot surface. The exact
locations of thermocouples are shown in the CAD drawing (c.) where dimensions are in
millimeters.
The FV solver: The model consists of the volume averaged conservation equations valid
under the assumption of fixed solid phase and constant solid density. The solutal and thermal
buoyancy forces are included using the Boussinesq approximation:
𝜌(𝑇) = 𝜌0 [1 − 𝛽𝑇(𝑇 − 𝑇0) − ∑ 𝛽𝑤𝑖(𝑤𝑖
𝑙 − 𝑤𝑖 0𝑙 )
𝑛
𝑖=1] Eq. 1
The mass, energy, momentum, and solute conservation equations are derived following the
approach detailed in reference [11]. It should be noted that extension has been made to the
solute conservation equation to take into account more than one species as follows:
𝜕wi
𝜕t+ v𝛁wi
l − ∇ ∙ (Dilgl∇wi
l) = 0 Eq. 2
where w1
i denotes the average composition for species i, equal to the sum of the solid, ws
i ,
and liquid, wl
i, volume averaged compositions: i.e. w1
i = gs ws
i + gl wl
i with gs being the solid
volume fraction and gl denoting the liquid volume fraction. Other fields present in Equation 2
are: v the average velocity field, and Dl
i is the diffusivity of species i in the liquid. In the
numerical implementation of Equation 2, solid back diffusion was neglected for both
manganese and silicon (Scheil assumption), while assumed to be complete for carbon (Lever
Rule). The Voller-Prakash [12] splitting approach is used to solve the energy conservation

equation in terms of enthalpy. The same numerical scheme is applied to replace w1
i in
Equation 2 and to keep one unknown w1
i .
The DP model based grain structure solver: The development of solidification grain structure
can be subdivided into three highly coupled processes: nucleation, grain growth at the
microscale, and the interaction of the grain with the bulk flow, heat and mass transfer at the
macroscale. Nucleation: A stochastic nucleation model, based on the work of Rappaz and
Gandin [13], is used. The model is used to compute the location of the nuclei based on a
normal distribution throughout the whole domain. For boundaries, a Gaussian distribution is
assumed and this approach generates a random location distribution that fits experimental
measurements of cast ingot grain densities. Similarly, a randomly generated undercooling is
assigned to each seed. These are considered the main input parameters for the DP model
along with the SDAS. Grain Growth: The solidifying melt is divided into a mushy and fully
liquid region. The total liquid phase is the sum of the interdendritic and extra-dendritic liquid.
Interdendritic liquid is assumed to be well mixed, Equation 3, and is present between
dendrites.
𝑇 = 𝑇𝑚 + ∑ 𝑀𝑙𝑖𝑤𝑖𝑙𝑛
𝑖=1 Eq. 3
The envelopes drawn around individual grains enclose the solid phase and the interdendritic
liquid. A scalable tracking algorithm is used to predict individual grain envelope; the same
Lagrangian discrete point based formulation is used to simulate the nucleation. Micro-macro
coupling scheme: The mushy zone defined by the grain envelope is interpolated to the FV
mesh, and used to calculate the volume averaged solid fraction. The comprehensive model,
SPrime, is implemented using the C++ open source OpenFOAM library [14]. The values of
the thermophysical properties used by the solidification solver, SPrime, are shown in Table 2.
Table 2. Thermophysical Properties
Symbol Parameter description Value Symbol C Mn Si
density 7300 Kg m-3
bw
l
i[wt%] 1.1e-2 1.19e-2 1.92e-2
Cp Heat capacity 650 J /kgoK ki[-] 0.34 0.59 0.75
Liquid dynamic viscosity 6e-4 Kgm-1s-1 Mli[wt%-1] -78 -3.32 -17.1
L Latent heat of fusion 270 kJ/kg
Thermal conductivity 30 W/moK
T Thermal expansion coef. 2.0 e-4 K-1
Results and Discussion
This section compares the measured and predicted maps of the grain envelopes and
manganese segregation of the three steel compositions listed in Table 1.
M1 Result: Figure 2a shows the thermal images of the mold surface at 3, 15, 27, and 39
minutes. The left-hand panel of Figure 2b plots the recorded temperature along the center of
the wide face of the mold using the embedded thermocouples collected at 0.1 second
intervals, averaged over 1.3 seconds. The latter average temperatures were used as inputs to
the inverse heat conduction model. The calculated heat flux is shown in the right-hand panel
of Figure 2b, which shows a peak heat flux magnitude of 0.4 MW/m2 to 1.4 MW/m2,
followed by a sharp decrease. The heat extraction can be seen to decay with an approximately
exponential form. The maximum value of 1.4 MW/m2 is in line with that seen in a
continuous caster mold at the meniscus.

a- 2000
0
T [K] 3 [min] 15 [min] 27 [min] 39 [min]
b-
Figure 2: (a) Time lapse snapshots of the measured ingot mold temperature showing the
progress of the steel ingot solidification over time at 3, 15, 27 and 39 minutes. (b) Ingot mold
temperature profile and the calculated heat flux as a function of time at three levels of
thermocouples from one location.
Samples from discrete points along the length of the ingot, midway between the surface and
the center, were used to obtain the secondary dendrite arm spacing, Figure 3. Six
measurements per location were taken and then averaged. In addition, the standard deviation
of the measured arm spacing was also calculated and is shown as error bars. M1 shows an
average SDAS of 130m with a range of 60m. Using Equation 4 (with K =148 /(oC/s)n and
n = -0.38 [15]) and SDAS measurements along the ingot section (100 to 150 m), the cooling
rate is within a typical cooling rate seen in a continuous cast slab (between 1 to 10 °C/s).
nTK 2 Eq. 4

Figure 3: M1 Sample. The left panel plots the secondary dendrite arm spacing measured for
each specimen along the height and the right panel plots the corresponding cooling rate using
Equation 4.
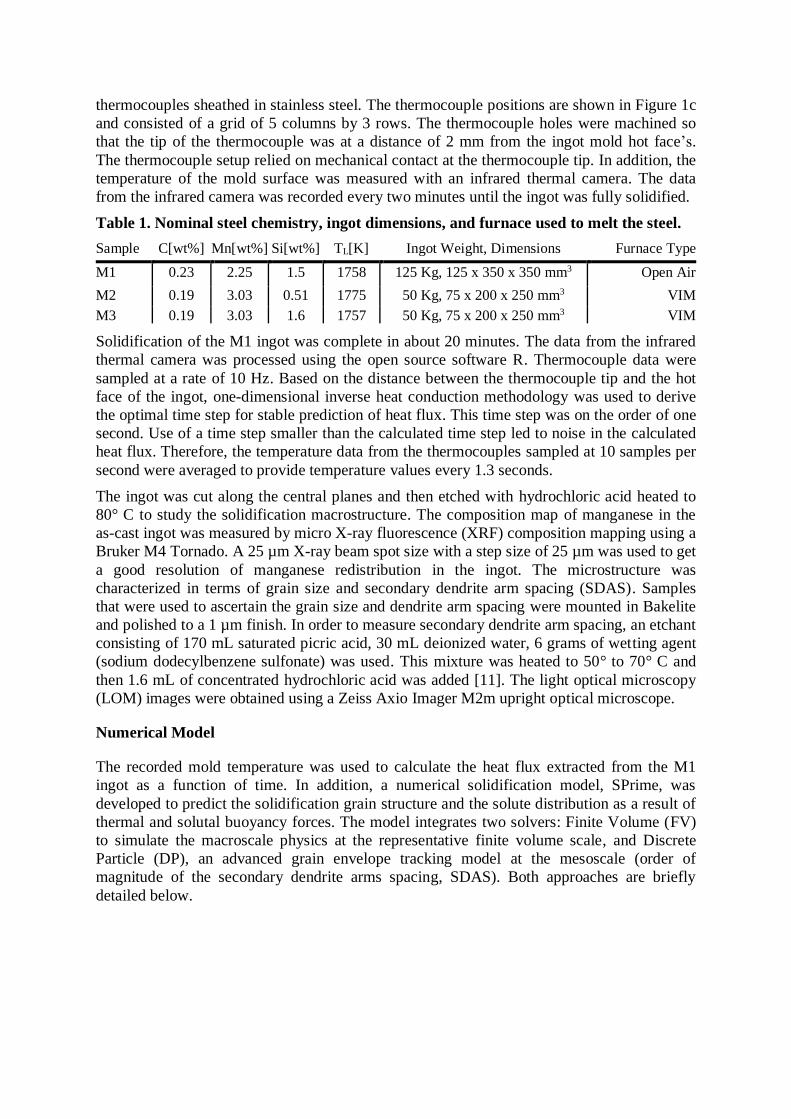
Figure 4 shows the measured/predicted grains envelope and the segregation map of
manganese. The measured grain envelope was obtained by using the diffraction spectra from
the M4 Tornado. The resulting image of the M1 as-cast ingot, Figure 4a, shows the primary
shrinkage pipe and a macrostructure with typical features observed in a continuous cast
product; i.e. it consists of a very small chill zone adjacent to the mold walls; followed by
elongated columnar grains and an equiaxed grain structure at the center. This is mainly due to
the variation of the cooling rate, which also affects the primary and secondary DAS. Figure
4d shows that the composition variation predicted by SPrime. The minimum and maximum
content of manganese predicted by SPrime is 1.817 [wt%] and 2.883 [wt%] respectively. This
compares reasonably well with measured values of manganese at discrete points placed on
the sample at 1 mm spacing which is found to vary between 1.78 weight percent and 2.88
weight percent.
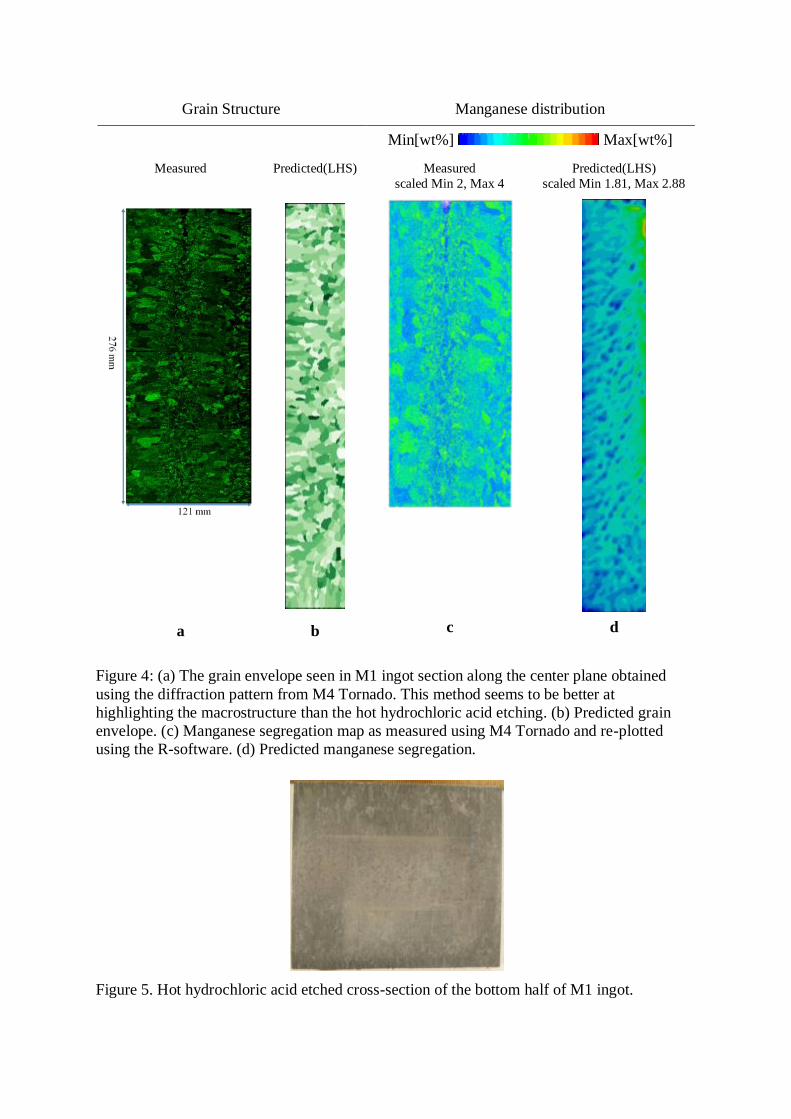
The cross-section of the bottom half of M1 as-cast ingot etched by hot hydrochloric acid is
shown in Figure 5. It can be seen that the M4 diffraction spectra (Figure 4a) has better grain
definition than the photograph of the acid etched sample. In the subsequent sections, only the
M4 measurement of the grain envelope in the ingot cross-section is shown.
Grain Structure Manganese distribution
Min[wt%] Max[wt%]
Measured Predicted(LHS) Measured
scaled Min 2, Max 4
Predicted(LHS)
scaled Min 1.81, Max 2.88
a b c d
Figure 4: (a) The grain envelope seen in M1 ingot section along the center plane obtained
using the diffraction pattern from M4 Tornado. This method seems to be better at
highlighting the macrostructure than the hot hydrochloric acid etching. (b) Predicted grain
envelope. (c) Manganese segregation map as measured using M4 Tornado and re-plotted
using the R-software. (d) Predicted manganese segregation.
Figure 5. Hot hydrochloric acid etched cross-section of the bottom half of M1 ingot.

M2 and M3 Results: M2 and M3 were melted in a vacuum induction furnace and were cast in
a mold that was not instrumented with thermocouples. To estimate the cooling rate,
measurements of the SDAS across the ingot width were performed. SDAS measurements are
plotted in Figure 6 and corresponding cooling rate estimates are plotted in Figure 7.
Comparing these cooling rate values to those seen in the steel cast using the instrumented
mold, the estimated heat transfer coefficient between the ingot and the mold was estimated to
be 350W/m2-K for the simulations.
Figure 6: The secondary arm dendrite spacing measured in the two ingots: (a) M2 containing
0.5% silicon, (b) M3 containing 1.5% silicon.
Figure 7: The cooling rate calculated based on the SDAS for the two ingots: (a) M2
containing 0.51[wt%] silicon, (b) M3 containing 1.6[wt%] silicon.
The numerical model, using the estimated heat transfer coefficient based on the measured
SDAS, predicts wider segregation range for all elements in the M3 ingot (high Si) when
compared to M2 (low Si) as summarized in Table 3. The segregation of manganese is typical
of a well-mixed system with efficient redistribution of the rejected solute by the bulk flow.
The solute being rejected in the interdendritic liquid is transported by the flow due to the high
permeability of the mushy zone in M2. Both M2 and M3 ingots contain 3.0 [wt%]
manganese, however the predicted minimum/maximum content of manganese is lower/higher
respectively in M3 compared to M2. This is mainly due to the higher SDAS in the M2 ingot
compared to M3 ingot as shown in Figures 6a and 6b, which is a key input for the Carman-
Kozeny volumetric frictional force that accounts for the interaction of the solid phase with the

liquid phase [16]. In contrast, the rejected solute is kept in between the grains of M3 due to
the smaller value of SDAS.
Table 3. Numerical prediction of minimum and maximum values of alloying elements
for M2 and M3 Ingot.
M2 Predicted range M3 Predicted Range
C Mn Si C Mn Si
Minimum [wt%] 0.108 1.81 0.313 0.051 1.14 0.313
Maximum [wt%] 0.227 3.26 0.575 0.335 3.80 2.32
Figure 8 presents the measured and predicted grain envelope and manganese segregation
maps for samples M2 and M3. The M4 Tornado was again used to generate the grain
envelope image shown in column 1 of Figure 8. Both experimental measurements and
numerical model results reveal a long columnar zone for ingots M2 and M3. Additionally, the
measured and predicted segregation maps reveal a correlation between the redistribution of
Mn and the solidification grain structure. However, measurements reveal a dominated
negative segregation of Mn in the centerline of the cross section, figures a-3 and b-3, which is
typical of inverse segregation due to shrinkage induced flow. Additional quantitative
comparison is difficult and is evidenced by the smooth variation in the predicted manganese
concentration as compared to that measured by M4 Tornado. This is a result of the difference
in sample size; M4 measures the concentration in a hemispherical cap with a height of 7
microns and a diameter of 25 microns while the numerical model predicts a volume averaged
concentration in a 1 mm3 cubic sample. Improved comparison of the final predicted
segregation map to the measured map can be obtained by chemically analyzing cylindrical
samples (1mm high by 1 mm in diameter) drilled from the ingot.
Conclusions
Three different steel chemistries alloyed with carbon, manganese, and silicon were poured
into cast iron ingot molds which exhibited differing cooling rates. An estimated heat transfer
coefficient based on the measured SDAS was used to numerically model the grain structure
and chemical segregation. Measurements of dendrite arm spacing, using light microscopy,
were correlated to a cooling rate of 1°C/s in the center of the ingot with typical values of
about 6°C/s close to the mold interface. Sample grain structure and Mn segregation was
characterized with the M4 Tornado. The numerical prediction of long columnar grain
envelopes was in good agreement with measurements. Segregation comparison of the
predicted and measured value of manganese is not straight forward since i- solidification
shrinkage induced flow was neglected and ii- M4 Tornado measures the alloying element
concentration in a 25m spot size while the numerical model predicts a volume averaged
composition in a larger volume. Numerical analysis revealed the effect of added silicon on
the overall grain structure and segregation map. It is found that bulk flow is highly affected
by elements with high solutal expansion coefficient and this effect can be more significant
than the carbon thermal buoyancy driven bulk flow.
Disclaimer
The material in this paper is intended for general information only. Any use of this material
in relation to any specific application should be based on independent examination and
verification of its unrestricted availability for such use and a determination of suitability for
the application by professionally qualified personnel. No license under any patents or other
proprietary interests is implied by the publication of this paper. Those making use of or
relying upon the material assume all risks and liability arising from such use or reliance.

Grain Structure Manganese distribution
Min[wt%] Max[wt%] Measured Predicted(LHS) scaled: Min 2, Max 4 scaled: Min 2.27, Max 3.26
a-
a-1 a-2 a-3 (Measured) a-4 Predicted(LHS)
scaled: Min 2, Max 4 scaled: Min 1.14, Max 3.8
b-
b-1 b-2 b-3 (Measured) b-4 (Predicted LHS)
Figure 8: Column 1 shows the grain structure for the M2 and M3 ingot obtained from the
diffraction spectra of M4 Tornado, Column 2 shows the numerically predicted grain
envelopes for M2 and M3, Column 3 shows the Mn segregation map as measured by M4
Tornado, and Column 4 shows the numerically predicted Mn segregation map. Row a is for
M2 ingot and Row b is for M3 ingot.

References
[1] D. Tourret, A. Karma, “Three-Dimensional Dendritic Needle Network Model for Alloy
Solidification,” Acta Materalia, Vol. 120, 2016, pp. 240-254.
[2] M. Zaloznik, Y. Souhar, C. Beckermann, and H. Combeau, “Upscaling from Mesoscopic
to Macroscopic Solidification Models by Volume Averaging,” in: In Frontiers of
Solidification Science, TMS Annual Meeting 2016, 2016, pp. 59-64.
[3] M. C. Flemings, “Our Understanding of Macrosegregation: Past and Present,” ISIJ
International, Vol. 40, 2000, p. 833-841.
[4] C. Beckermann, “Modelling of Macrosegregation: Applications and Future Needs,”
International Materials Review, Vol. 47, 2002, p. 243-261.
[5] E. J. Pickering, “Macrosegregation in Steel Ingots: The Applicability of Modeling and
Characterization Techniques,” ISIJ International, Vol. 53, No. 6, 2013, pp. 935-949.
[6] A. A. Howe, “Segregation and Phase Distribution During Solidification of Carbon,
Alloy, and Stainless Steel,” Commission of the European Communities Technical Steel
Research, EUR 13302, 1989.
[7] J.P. Gu and C. Beckermann, “Simulation of Convection and Macrosegregation in a
Large Steel Ingot,” Metallurgical and Materials Transactions A, Volume 30A, May
1999, p. 1357-1366.
[8] M.C. Schneider and C. Beckermann, “Formation of Macrosegregation by
Multicomponent Thermosolutal Convection during the Solidification of Steel”.
Metallurgical and Materials Transactions A, Volume 26A, September 1995, pp. 2373-
2388.
[9] S. Sundarraj, and G. A. Miller, “Modeling of Macrosegregation During Casting of
HSLA-100 Steel Ingots,” Proceedings of the Merton C. Fleming Symposium on
Solidification and Materials Processing, TMS, Edited R. Abbaschian, H. Brody, and A.
Mortensen, p. 311-316.
[10] E De Moor, J. G. Speer, and D. K. Matlock, “Effect of Retained Austenite on Tensile
Behavior of AHSS Revisited,” Materials Science and Technology 2011, Columbus,
Ohio, October 2011.
[11] G. F. Vandervoort, “Metallography: Principles and Practice,” ASM International,
McGraw-Hill Book Co., NY, 1984.
[12] V. R. Voller and C. Prakash, “A Fixed Grid Numerical Modeling Methodology for
Convection-Diffusion Mushy Region Phase-Change Problems,” International Journal of
Heat and Mass Transfer, Vol. 20, 1987, pp.1709-1719.
[13] M. Rappaz, and C.-A. Gandin, “Probabilistic Modelling of Micro-Structure Formation in
Solidification Processes,” Acta Metallurgica Materialia 41 (2) (1993) pp. 345-360.
[14] OpenFOAM, Version 2.2.2, 2014. www.openfoam.org.
[15] B. G. Thomas and M. El-Bealy, “Prediction of Dendrite Arm Spacing in Low Alloyed
Steel Casting Processes,” Metallurgical and Materials Transactions B, Vol. 27, 1996, pp.
689-693.
[16] T. Carozzani, C. A. Gandin, H. Digonnet, M. Bellet, K. Zaidat, and Y. Fautrelle, “Direct
Simulation of a Solidification Benchmark Experiment,” Metallurgical and Materials
Transactions A, V. 44A, 2013, pp. 873 – 887.
Acknowledgement
The authors would like to thank United States Steel Corporation for permission to publish
this manuscript.