experimental and theoretical explorations on the buckling
TRANSCRIPT

Experimental and Theoretical Explorations on the BucklingPiezoelectric Layer Under Magnetic Excitation
KAYHAN CELIK,1,3 EROL KURT,1 and YUNUS UZUN2
1.—Department of Electrical and Electronics Engineering, Technology Faculty, Gazi University,06500 Besevler, Ankara, Turkey. 2.—Department of Electrical and Electronics Engineering, Engi-neering Faculty, Aksaray University, Aksaray, Turkey. 3.—e-mail: [email protected]
In the present study, experimental and theoretical explorations on the bucklingfeatures of a wind energy harvester have been performed. The harvester con-sists of a piezoelectric layer, which has a certain stiffness and voltage conversionrate. A blade rotates on a shaft carrying a magnet and sweeps the tip of the layercausing a serial buckling effect resulting in energy generation. Since the mod-eling of the buckling under a magnetic strength includes nonlinear terms overdisplacements, one requires a detailed study on the characteristics of bucklingphenomena. It has been proven that the piezoelectric beam having the magnetat its tip can produce regular and chaotic dynamics for different frequencies (i.e.the rotation speed). In addition, there exist a number of quasi-periodic regionson the parameter space. The overall result indicates that the large area ofcomplicated dynamics requires a detailed study in order to stabilize the positionand velocity of the layer tip, thereby a much stabilized energy conversion frommechanical to electrical can be obtained. The present survey on the dynamics ofthe harvester is a new study and is considered as a two-parameter diagram [i.e.the wind speed (frequency) and magnetic strength]. Mainly, single-, double-,triple- and quadruple-type phase space portraits have been observed and theripples on the maximal and minimal values of the beam velocity have beenobserved for certain rotation speeds. These results can be used in order to sta-bilize the harvester in terms of the reduction of total harmonic distortion in thegenerated waveform.
Key words: Piezoelectric, buckling, power, magnetic field, chaos
INTRODUCTION
Energy demand in the community is forcingresearchers to model and implement new andefficient energy harvesting techniques. The har-vesting techniques especially aim to cover the powerrequirements of autonomous sensor nodes, alarmsystems, actuators and other micro- or milliwattconsuming devices. While the harvesters enable theenhancement of the lifetimes of the regenerativesystems and operations, they can also serve as aunique source without a battery.1,2
Portable and wireless devices such as alarmsystems, mobile weather devices and sensors canhave longer battery lives, and thereby require lessrecharging time by applying harvesting mecha-nisms. Among all harvesting mechanisms, the con-version of mechanical energy from backgroundvibrations into electrical energy via a piezoelectric(PZT) layer has the highest power density.1–3 Inrecent studies, the PZT systems can have longerlifetime due to the contactless operation with thehelp of magnetic repelling.4,5 However, parallel tothe literature, a PZT layer can be very effectivewhen it operates at its own resonance frequency.6,7
In that case, the main problem remains the conver-sion of the surrounding excitation frequencies to theresonance frequency, because a wide-band vibration
(Received November 18, 2016; accepted February 18, 2017)
Journal of ELECTRONIC MATERIALS
DOI: 10.1007/s11664-017-5403-2� 2017 The Minerals, Metals & Materials Society

character is encountered in nature and these lead torandom excitations of the harvester and cause avital decay in the power generation.
The discussions above take us to a point wherethe importance of the frequency of the externalstress (i.e. mechanical vibration) exists. The realitythat the background vibrations lead to a wide-bandfrequency spectrum motivates us to explore thecharacteristics of the pendulum-like PZT layers. Bydoing such an exploration, the contactless nature ofmagnetic force can also be utilized in order todetermine the characteristic outputs of the system.Thus, the lifetime of the PZT material is dramati-cally increased.
Excitation by magnetic flux has been explored forsome decades in order to increase the efficiency ofdifferent harvester systems in terms of wide-bandvibrations.8,9 A number of models and designs havebeen proposed in the literature with that inmind.8–10 For example, a harvester with four per-manent magnets in a stable magnetic field wasproposed by Cottone et al.8 Their system operates asan inverted pendulum, and the dynamics of stochas-tically nonlinear vibrations and correspondingenergy outputs were examined. In another paper,Ferrari et al.1 proved that the wide-band vibrationsexerted by the permanent magnets can improve theoutput power up to 250%; indeed, the nonlinearityin their field assists in enhancing the harvestedpower. In addition, in one of our earlier studies,11,12
we have proven that, if a periodic magnetic field isused in place of a stable field, the responses of thePZT layer can entirely differ from the findings ofFerrari et al.1 Strictly speaking, the harvestedpower dramatically decreases. These two resultsfrom different systems have motivated us to explorethe behavior of the buckling PZT layer. The char-acteristics of the field can yield to different resultsin different systems. The reason for such differentresults is considered to be the bistable excitation ofthe system in Ref. 1. If the system has twoequilibrium positions, it can yield to a betterharvesting mechanism. Such a system can beconstructed by either considering only the mechan-ical aspects of the system or introducing an externalnonlinear force as in Ref. 13. Indeed, the bistabilitydrives the system from one state to the other byresulting large amplitudes in position. The inter-mediate regimes of the bistable mode survive forappropriate parameter sets and yield to largeamplitude oscillations. That transition from themonostable to the bistable state causes largerdisplacements, thereby the amount of the obtainedenergy increases dramatically as was also pointedout by Ferrari et al.1 However, in the case of anonautonomous magnetic field, as in our earlierpapers,14,15 the complicated responses of the layerhave been observed experimentally and theoreti-cally. The dynamic responses such as periodic andchaotic states have been observed and evenbistable modes have also been encountered for
certain parameter ranges. Thus, further work onthe matter is required in order to clarify the results.Similar analyses have proved that the nonlinearsystems can generate large-amplitude oscillationsover a wider frequency range with respect to thelinear case,16,17 and thus high amounts of power canbe generated under proper conditions. The charac-teristic feature of an individual system needs to beexamined both theoretically and experimentally inorder to sketch out the overall dynamics and energyconversion mechanism. The conversion mechanismis essentially affected by electrical load, excitationfrequency and the distance to the excitation source,and these have not yet been fully explored.
Energy harvesters can be electromagnetic orelectrostatic, whereas energy densities of PZT sys-tems become much higher around 35 mJ/cm3 com-pared to pure electromagnetic or electrostaticsystems.11,18 In addition, PZT systems can harvesthigher voltages up to 15 V compared to electromag-netic energy converting systems for a small layer.19
Therefore, PZT harvesters become much promisingfor various engineering applications. In addition totheir high energy densities, the compact naturemakes them suitable for many micro-electrome-chanical systems (MEMS).19
In the present paper, we report further effects ofthe periodic magnetic field excitation for a PZT layerin order to carry out an optimization study on theenergy harvesting mechanism. Apart from the pre-vious studies,5,12 the piezoelectric layer has beenmounted on a propeller via a shaft and a varyinghigher magnetic force exerted on the tip of the layerdue to higher magnetic flux density of the permanentmagnet. In addition, a wide parametrical survey hasbeen performed for magnetic force (i.e. coil voltageUc) and rotation frequencyx. The dynamic responsesof the layer have been identified for these parame-ters. The findings can be easily adapted to a harvestersystem, positioned close to a generator, relay orelectric motor, which can exert a periodic magneticambient (see, for instance, Refs. 20–22). The presentwork also includes the description of the nonlinearmagnetic force inat the vicinity of the layer anddescribes the estimated power from a layer by usingthe system parameters. ‘‘Experimental’’ section givesan experimental overview for the proposed windenergy. A detailed analytical description of theharvester is presented in ‘‘Theoretical Background’’section. The main findings from the simulationsbased on the analytical description and the experi-ments are discussed in the next section. Finally, thepaper ends with concluding remarks.
EXPERIMENTAL
The Proposed New Wind Energy Harvester
The new wind harvester consists of four units asshown in Fig. 1. The first unit is a propeller rotatedby the wind. The second unit is the shaft conveyingthe mechanical rotation to the magnet and the third
Celik, Kurt, and Uzun
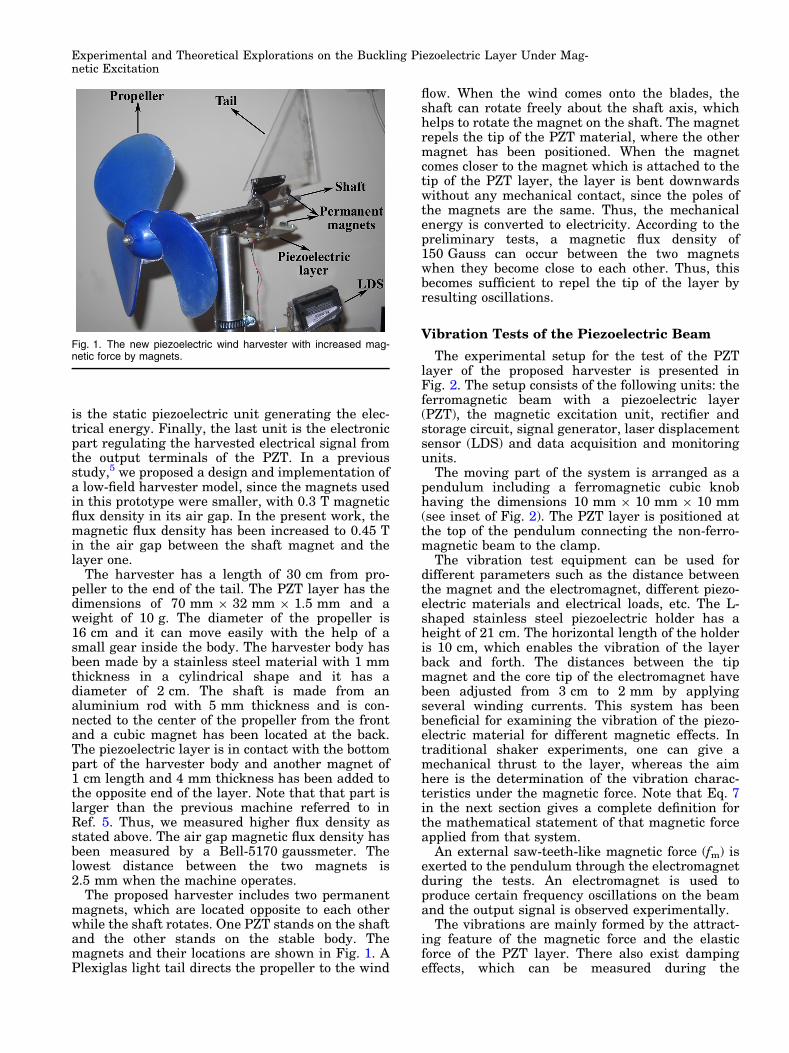
is the static piezoelectric unit generating the elec-trical energy. Finally, the last unit is the electronicpart regulating the harvested electrical signal fromthe output terminals of the PZT. In a previousstudy,5 we proposed a design and implementation ofa low-field harvester model, since the magnets usedin this prototype were smaller, with 0.3 T magneticflux density in its air gap. In the present work, themagnetic flux density has been increased to 0.45 Tin the air gap between the shaft magnet and thelayer one.
The harvester has a length of 30 cm from pro-peller to the end of the tail. The PZT layer has thedimensions of 70 mm 9 32 mm 9 1.5 mm and aweight of 10 g. The diameter of the propeller is16 cm and it can move easily with the help of asmall gear inside the body. The harvester body hasbeen made by a stainless steel material with 1 mmthickness in a cylindrical shape and it has adiameter of 2 cm. The shaft is made from analuminium rod with 5 mm thickness and is con-nected to the center of the propeller from the frontand a cubic magnet has been located at the back.The piezoelectric layer is in contact with the bottompart of the harvester body and another magnet of1 cm length and 4 mm thickness has been added tothe opposite end of the layer. Note that that part islarger than the previous machine referred to inRef. 5. Thus, we measured higher flux density asstated above. The air gap magnetic flux density hasbeen measured by a Bell-5170 gaussmeter. Thelowest distance between the two magnets is2.5 mm when the machine operates.
The proposed harvester includes two permanentmagnets, which are located opposite to each otherwhile the shaft rotates. One PZT stands on the shaftand the other stands on the stable body. Themagnets and their locations are shown in Fig. 1. APlexiglas light tail directs the propeller to the wind
flow. When the wind comes onto the blades, theshaft can rotate freely about the shaft axis, whichhelps to rotate the magnet on the shaft. The magnetrepels the tip of the PZT material, where the othermagnet has been positioned. When the magnetcomes closer to the magnet which is attached to thetip of the PZT layer, the layer is bent downwardswithout any mechanical contact, since the poles ofthe magnets are the same. Thus, the mechanicalenergy is converted to electricity. According to thepreliminary tests, a magnetic flux density of150 Gauss can occur between the two magnetswhen they become close to each other. Thus, thisbecomes sufficient to repel the tip of the layer byresulting oscillations.
Vibration Tests of the Piezoelectric Beam
The experimental setup for the test of the PZTlayer of the proposed harvester is presented inFig. 2. The setup consists of the following units: theferromagnetic beam with a piezoelectric layer(PZT), the magnetic excitation unit, rectifier andstorage circuit, signal generator, laser displacementsensor (LDS) and data acquisition and monitoringunits.
The moving part of the system is arranged as apendulum including a ferromagnetic cubic knobhaving the dimensions 10 mm 9 10 mm 9 10 mm(see inset of Fig. 2). The PZT layer is positioned atthe top of the pendulum connecting the non-ferro-magnetic beam to the clamp.
The vibration test equipment can be used fordifferent parameters such as the distance betweenthe magnet and the electromagnet, different piezo-electric materials and electrical loads, etc. The L-shaped stainless steel piezoelectric holder has aheight of 21 cm. The horizontal length of the holderis 10 cm, which enables the vibration of the layerback and forth. The distances between the tipmagnet and the core tip of the electromagnet havebeen adjusted from 3 cm to 2 mm by applyingseveral winding currents. This system has beenbeneficial for examining the vibration of the piezo-electric material for different magnetic effects. Intraditional shaker experiments, one can give amechanical thrust to the layer, whereas the aimhere is the determination of the vibration charac-teristics under the magnetic force. Note that Eq. 7in the next section gives a complete definition forthe mathematical statement of that magnetic forceapplied from that system.
An external saw-teeth-like magnetic force (fm) isexerted to the pendulum through the electromagnetduring the tests. An electromagnet is used toproduce certain frequency oscillations on the beamand the output signal is observed experimentally.
The vibrations are mainly formed by the attract-ing feature of the magnetic force and the elasticforce of the PZT layer. There also exist dampingeffects, which can be measured during the
Fig. 1. The new piezoelectric wind harvester with increased mag-netic force by magnets.
Experimental and Theoretical Explorations on the Buckling Piezoelectric Layer Under Mag-netic Excitation

experiments. A laser displacement sensor has beenlocated for the measurement of tip displacement.Both the magnetic excitation data (i.e. waveform)and the output signal of the PZT can be recordedsynchronously. Since the main parameters are theamplitude and frequency of the excitation wave-form, the dynamics of PZT can be explored for wideranges from 0.5 Hz to 50 Hz. If much suitable exci-tation strength (i.e. Uc = 4–10 V) is adapted to theelectromagnet, the damping effects can be basicallyignored and the elastic forces can compete with thefield excitation.
In the experiments, a PZT layer made by PiezoSystem has been used. It has the sizes of70 mm 9 32 mm 9 1.5 mm and a weight of0.01 kg. According to the manual, the capacitanceand stiffness of the PZT layer are 232 nF and 188 N/m, respectively. The LDS has an IL-065-type headcontroller IL-1000 which was made by Keyence. Thesensor head can measure the vibrations with thesampling rate of t = 1 ms. In the experiments, arectifier, storage circuit, signal generating circuitfor step pulsed signals and an NI USB-6250 dataacquisition card have been used. The data acquisi-tion card has 16 analog inputs and enables themaking of multiple recordings of quantities such asthe displacement of the layer tip and input/outputvoltages.
The electromagnet has 1050 turns of 0.70-mm-diameter copper wires. The dimension of its core is120 mm 9 20 mm 9 20 mm and it has a relativepermeability of lr = 10,000. The step-pulsed voltageis characterized by its amplitude U and frequency f.All experimental outputs can be collected via theLabVIEW software. To examine the PZT behavior atdifferent distances between the tip and the
electromagnet, the distance d can be adjusted withan appropriate sliding mechanism. The terminals ofthe PZT have been attached to an electrical load RL.
THEORETICAL BACKGROUND
The theoretical statement of the proposed har-vester can be written as follows:
dhdt
¼ x; ð1Þ
md2r
dt2¼ kuðtÞ þ aVðtÞ þ fmdðh� h0Þ; ð2Þ
IðtÞ ¼ aduðtÞ
dt� C
dVðtÞdt
; ð3Þ
where, h, x, d, m, r, u, a, V, fm, h0, C, I and k indicatethe angular position of the magnet, the propellerspeed, Kronecker delta which gives 1 for h = h0 else0, the mass of the layer, the radial position to thecenter of the shaft, the mass displacement of thelayer, the force factor of the layer, the voltagebetween the layer terminals, the magnetic force ofthe magnet, the angular position of the layer, thelayer capacitance, the harvested current and thestiffness constant of the layer, respectively. For amore detailed expression, we refer to our previousstudies.5,6,11
In order to analyze the PZT layer which isdenoted in Eqs. 2 and 3, the layer can be modeledas in Fig. 3. In the present model, an externalmagnetic field obtained by an electromagnet isconsidered to affect a ferromagnet knob attachedto a piezoelectric layer.
Fig. 2. The experimental test setup for the harvester PZT.
Celik, Kurt, and Uzun

The electromagnet generates a saw-teeth-likemagnetic force near the tip. The dynamics of thependulum-like beam consists of a certain elasticforce, gravitational force and magnetic force as inRef. 15. In the present model, the elastic force ismuch higher than the gravitational force, thus thegravitation can be neglected.14,15,21 The algebraicmodeling in Eqs. 1–3 can be clarified by consideringFig. 4.
In that model, a mass-spring, a damper and acapacitor are considered. Here, Fm, which is pro-duced by the magnet with certain periods is mod-eled by the excitation frequency of the oscillatingfield. Here, the rigid mass mp and the stiffnessconstant k determine the mechanical structureunder a damper c giving the mechanical losses. Ifa mass displacement u occurs in the PZT layer, anelectrical current I and a voltage V are produced.
The relationship between the mechanical and elec-trical units is given by the following equationsystem:
FtotalðtÞ ¼ kuðtÞ þ aVðtÞ þ FmðtÞ;
IðtÞ ¼ aduðtÞ
dt� C
dVðtÞdt
:ð4Þ
The equations include the backward piezoelectriccoupling. Here, C is the clamped capacitance and ais the force factor. In addition, V denotes theharvested voltage of the PZT and I gives the currentwhen an electric load RL is attached to the system.Then, the total equation of motion for the displace-ment of mass, u¢(t), as a result of the pendulum tipdisplacement x¢(t) is given as,
ðmþmpÞd2x0ðtÞ
dt02¼ �c
du0ðtÞdt0
�mpd2u0ðtÞ
dt02
� ku0ðtÞ � aVðtÞ � FmðtÞ:ð5Þ
Considering the electrical part and x¢, which hasbeen adjusted to 3 times the displacement u¢ of thePZT layer, one defines u¢ = 0.33x¢. Then, thedynamic equation can be stated as,
d2u0ðtÞdt02
¼ � c3mþ 4mp
du0ðtÞdt0
� ku0ðtÞ3mþ 4mp
� aVðtÞ3mþ 4mp
� FmðtÞ3mþ 4mp
;
dV 0ðtÞdt0
¼ aC
du0ðtÞdt0
� IðtÞC
:
ð6Þ
The resulting equations describe the electrome-chanical model of the harvester problem. Themagnetic force with changing frequency can bedescribed as in Ref. 11. The magnetic force has twomain quantities: the distance d from the electro-magnet to the PZT tip and the winding current asdescribed below:
Fig. 3. The modeling of a PZT layer in the vicinity of an electromagnet.
Fig. 4. The energy harvesting procedure of the PZT layer under avarying magnetic field due to the rotation.
Experimental and Theoretical Explorations on the Buckling Piezoelectric Layer Under Mag-netic Excitation

Here, Uc, Rc, and L represent voltage, resistance andinductance of the electromagnet, respectively. Forclarity, he electromagnet force constants are definedfrom the simulation as a = 8 9 10�8 and b = 10�9.
The dimensionless statement of Eq. 6 is foundwhen t¢ = st, y¢ = yd/s, u¢ = ud and V¢ = V0V areintroduced for the time, velocity, position andvoltage scaling, respectively. Note that s determinesthe natural period of the layer. Then, one arrives at,
du
dt¼ y;
dy
dt¼ � cs
3mþ 4mpy� ks2
3mþ 4mpu
� ðmþmpÞs2FmðtÞð3mþ 4mpÞd
� Vas2V0
ð3mþ 4mpÞd;
dV
dt¼ ad
CV0
du
dt� sVV0CRL
:
ð8Þ
These first-order equations can then be used in thesimulations and time integration via using theRunge–Kutta method. Here, d transfers the coordi-nate system into the equilibrium point of thependulum, since the amplitude of the piezoelectriclayer tip is represented by u. The preliminaryexperimental studies have proven that the naturalfrequency of the PZT layer is f0 = 4.76 Hz, thedamping constant c = 1.48, and the ratio of elasticconstant to mass k/m = 894. By introducing theseparameters and Eq. 8 to MatLab, the solutions havebeen obtained after time integrations via the fourth-order Runge–Kutta method.
In order to discover the averaged harvestedpower, Eq. 8 is initially recalled in the frequencydomain. The voltage equation in Eq. 8 can besolved as,
V ¼ jRLaxCu
1 þ jCRLxC; ð9Þ
in the frequency domain and, by considering thesecond equation in Eq. 8, we arrive at,
V ¼uRLajxC ðmþmpÞx2
C � F0 < I2c > þ F1 < Ic >
� �
�cjxC �mpx2C � k
� �ð1 þ RLCjxCÞ � a2RLjxC
þ h:o:t:; ð10Þafter some arithmetic manipulation for the har-vested voltage. The harvester is driven by thefield frequency xc, therefore the solution shouldinclude xc. The linear terms of the piezoelectricdisplacement function u is included in addition tothe field frequency. Note that <Ic> and <Ic
2>indicate the time-averaged values of the electro-magnet currents defined in Eq. 7 including a andb parameters. The averaged values are asfollows:
< Ic > ¼ Uc
2RcþUcLxC
2pR2c
2e�Rcp
LxC � 1 � e�Rc2p
LxC
� �;
< I2c > ¼ U2
c
2R2c
þU2c LxC
4pR3c
1 � e�Rc4p
LxC
� �þ LxC
pRce�Rcp
LxC � 1� �
;
ð11Þ
during one period with a time integration. Above,the electrical parameters belong to the electromag-net when voltage Uc with an excitation frequency ofxc = 2pf is applied. Thus, power is calculated asfollows:
While using the linear part of Eq. 10 as function of uand its complex conjugate divided by the resistiveload RL (i.e. Ph i ¼ VV�h i=RL), Eq. 12 gives a com-plete relationship between the output power and
FmðxÞ ¼
fð1 � 0:7056=dÞ þ 0:0623ð1 � 3uÞ þ 28026dð1 � 3uÞ2 � 106d2ð1 � 3uÞ3ga Uc
Rcð1 � e�Rct=LÞ
� �2�bUc
Rcð1 � e�Rct=LÞ
� 0< t � T
2
fð1 � 0:7056=dÞ þ 0:0623ð1 � 3uÞ þ 28026dð1 � 3uÞ2 � 106d2ð1 � 3uÞ3ga Uc
Rce�Rct=L
� �2�b Uc
Rce�Rct=L
� T2 < t � T
8>>>>>>><
>>>>>>>:
9>>>>>>>=
>>>>>>>;
ð7Þ
<P>
¼u2RLa2x2
c ðmþmpÞx2c � F0 < I2
c > þ F1 < Ic >� �2
k2 1 þ C2R2Lx
2c
� �þ 2kx2
c mp þ a2CR2L þ C2mpR2
Lx2c
� �þ x2
c 2a2cRL þ a4R2L þ 2a2CmpR2
Lx2c þ c2 1 þ C2R2
Lx2c
� �þm2
px2c 1 þ C2R2
Lx2c
� �n o
ð12Þ
Celik, Kurt, and Uzun

both the electrical and mechanical parameters ofthe system.
RESULTS AND DISCUSSION
Experimental Discussion
In Fig. 5a, b, and c, displacement, velocity andvoltage data are shown. These data have beenreceived from the harvester shown in Fig. 1. Thewind speed is 3.5 m/s for the wind tunnel. Thedisplacement waveform has certain peaks at0.15 cm; however, there exist ripples around theequilibrium point (Fig. 5a). The displacementoccurs at the positive part where the magnet shaft
always repels the tip of the piezoelectric and thelayer cannot find sufficient time to continue itsmotion in the opposite displacement side. Suchbehavior is common for some wind speeds and hasbeen encountered in many studies.1,11,12 Similarly,the voltage waveform also has certain peaks, wherethe displacement becomes maximum as in Fig. 5b.Peak to peak, 1.2 V can be generated at that speed,whereas the waveform includes harmonics, whichaffect the output power of the system. The voltagehas been measured directly from the piezoelectricterminals without any electrical load in order to see
Fig. 5. (a) Displacement of the harvester layer tip from the equilib-rium point. (b) Voltage waveform from piezoelectric terminals. (c)The attractor for the wind speed of 3.5 m/s. Fig. 6. (a) Displacement of the harvester layer tip from the equilib-
rium point. (b) Voltage waveform from piezoelectric terminals. (c)The attractor for the wind speed of 8 m/s.
Experimental and Theoretical Explorations on the Buckling Piezoelectric Layer Under Mag-netic Excitation
the pure waveform. In order to show the dynamicregime, the attractor is shown in Fig. 5c.
Another measurement is depicted in Fig. 6a, b,and c for higher wind speed (i.e. 8 m/s). It is obviousthat displacement of the layer tip changes betweennegative and positive values due to the high speed(Fig. 6a). In addition, the waveform of displacementand corresponding voltage also change. The peak topeak value reaches to 6.5 V with a distorted form ina long time period (Fig. 6b). The voltage has beenobtained directly from the piezoelectric terminalswithout the electrical load. By considering Figs. 5and 6, we aim to show the characteristic outputs ofthe piezoelectric. This distortion can be seen clearlyfrom the attractor in Fig. 6c. The ripples of thatdouble scroll attractor are due to magnetic force asalso encountered at lower speeds. The similardouble scroll attractors have also been found fromthe theory and are presented in the next section.
The attractors above prove that the proposedmodel is sufficient for the determination of theharvester dynamics and power relationships. In
order to test the vibrations at various frequencies,some controlled experiments have been carried outwith the setup in Fig. 2. The results of displacement
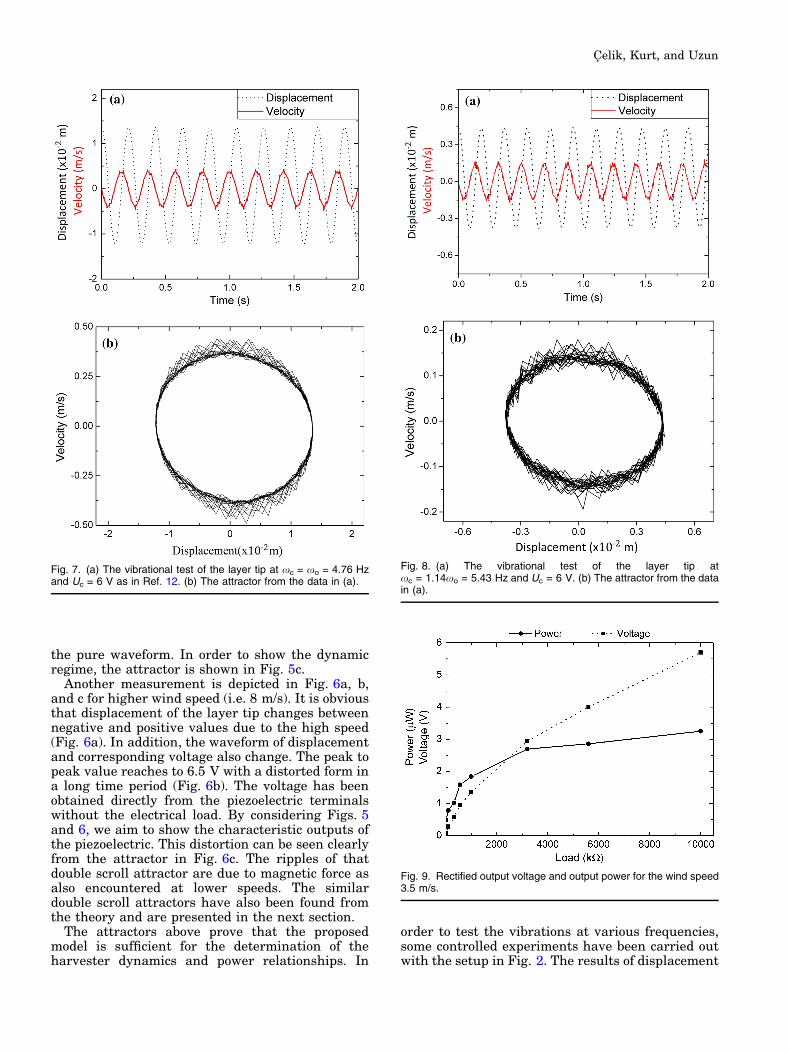
Fig. 7. (a) The vibrational test of the layer tip at xc = xo = 4.76 Hzand Uc = 6 V as in Ref. 12. (b) The attractor from the data in (a).
Fig. 8. (a) The vibrational test of the layer tip atxc = 1.14xo = 5.43 Hz and Uc = 6 V. (b) The attractor from the datain (a).
Fig. 9. Rectified output voltage and output power for the wind speed3.5 m/s.
Celik, Kurt, and Uzun

and velocity are given in Fig. 7a and b at a naturalfrequency (i.e. xo = 4.76 Hz) and Uc = 6 V.
The experimental displacement and velocity timeevolution in Fig. 7a have sinusoidal waveforms inaccordance with our earlier studies.12 As an indica-tor of magnetic force, there exist high-frequencyripples around the minimal and maximal values ofvelocity. This kind of effect will also be shown in thetheory in the next section. In order to see theattractor in the phase space, Fig. 7b is depicted.Here, the ripples are much observable than at the
upper and lower regions, and they govern thedynamics and enhance the irregularities of thewaveforms such as velocity and voltage.
Another displacement and velocity test result forslightly higher excitation frequency is given inFig. 8. While the displacement is still in sinusoidalwaveform, the ripples in the velocity data increasefurther for all waveforms (Fig. 8a). This effect canbe seen clearly from the attractor in Fig. 8b. Thechaos governs the phase space and the peak to peakvalues decrease compared to the case in Fig. 7a and
Fig. 10. The attractors (i.e. phase space representations) from displacement versus velocity data from simulations (a) from the periodic regularregion in Fig. 11 at (Uc, xc) = (4 V, x0 Hz), (b) from the chaotic region in Fig. 11 at (Uc, xc) = (4.27 V, 6x0 Hz), (c) from the saw-teeth chaoticregion in Fig. 11 at (Uc, xc) = (7.21 V, 4x0 Hz), (d) from the double scroll chaotic region in Fig. 11 at (Uc, xc) = (5.61 V, 35x0 Hz), (e) from thetriple scroll chaotic region in Fig. 11 at (Uc, xc) = (3.74 V, 50x0 Hz), and (f) from the multiple scroll chaotic region at (Uc, xc) = (9.35 V, 10x0 Hz.
Experimental and Theoretical Explorations on the Buckling Piezoelectric Layer Under Mag-netic Excitation

b. Thus, that also causes a decrease in the harvestedvoltage.
The harvested voltage and power, which havebeen received from the terminals of the rectifier, areshown in Fig. 9. Note that the generated voltageand power strictly depend on the impedance balancebetween the electrical load at the output and theinternal impedance. According to the technicalfeature of the piezoelectric layer, the maximalpower can be obtained for RL = 10 MX. Beyond thatvalue, the power decreased as also proven in Ref. 11.It has been proven that the proposed piezoelectricharvester can be used for micro-watt consumingsystems such as sensor nodes, alarm devices, etc.
Theoretical Discussion
The vibration analysis of the PZT layer under thesaw-teeth-like force has been carried out mainly fortwo parameters: the excitation frequency (xc) of thefield and the magnetic force strength (i.e. themaximal voltage of electromagnet Uc). Theseparameters have been explored in a wide region.Strictly speaking, the frequency range changes fromxc = 0.1 to 240 Hz and the maximal voltage rangechanges from Uc = 1.5 to 14 V. The buckling of thelayer produces many different dynamical behaviorsfrom periodic to chaotic. There also exist varioustypes of attractors for different parameters. Fig-ure 10 presents sample attractors from thesesimulations.
While Fig. 10a represents the periodic buckling ofthe layer resulting from a simple elliptical trajectoryat (Uc, xc) = (4 V, 119 Hz), Fig. 10b shows thetrajectories at higher frequencies (i.e. 28.6 Hz) andexcitation voltages (i.e. 4.27 V). When the magneticforce is increased further by increasing the voltage(i.e. 7.21 V), the trajectories in Fig. 10c areobtained. The main difference is the increase inthe displacement and velocity at that parameter.Note also that the saw-teeth appearance at thelateral regions of the ellipse trajectory occurs due tothe lower frequency relative to Fig. 10b. The phaseplane becomes more different when the frequency is
increased up to 166.6 Hz. Although the excitationvoltage is adjusted lower than in Fig. 10c, thesystem generates two main attracting centers onthe phase plane. The displacement of the tip alsoincreases and from time to time it skips to the othercenter. Although the velocity becomes lower relativeto the case in Fig. 10c, we expect that the powerproduction can increase due to that larger displace-ment. When the excitation voltage is decreasedfurther and the frequency is increased, the attractorin Fig. 10e is obtained. While the velocity datadouble compared to Fig. 10d, the displacement doesnot change very much. However, when the displace-ment becomes larger than a certain value, the otherattracting point attracts the tip and the tip contin-ues to oscillate around the electromagnet with lowerdisplacement and velocity. If the displacementincreases further, another limit of the displacementis exceeded and the system comes back to theprevious attracting point. If the excitation voltage isincreased much higher and the frequency isdecreased to 47.6 Hz, both the displacement andvelocity are dramatically increased. While thatscenario can be possible in simulations, one shouldbe careful in the real experiments in the sense thatsuch a high voltage (i.e. magnetic force) may breakthe PZT layer. In that case, although theoreticallymuch energy is harvested at this parameter set, itmay be impossible to reach that scenario in the realworld. Thus, careful tests should be carried out inorder to optimize the harvester force. Indeed, thephase space trajectories resemble the case inFig. 10e, although the values become higher.
Fig. 11. The dynamics depending on the excitation voltage (i.e. the indicator of magnetic force) and excitation frequency.
Fig. 12. The corresponding voltages for (a) from the periodic regularregion in Fig. 11 at (Uc, xc) = (4 V, x0 Hz), (b) from the chaoticregion in Fig. 11 at (Uc, xc) = (4.27 V, 6x0 Hz), (c) from the saw-teeth chaotic region in Fig. 11 at (Uc, xc) = (7.21 V, 4x0 Hz), (d) fromthe double scroll chaotic region in Fig. 11 at (Uc, xc) = (5.61 V, 35x0
Hz), (e) from the triple scroll chaotic region in Fig. 11 at (Uc,xc) = (3.74 V, 50x0 Hz), and (f) from the multiple scroll chaotic re-gion at (Uc, xc) = (9.35 V, 10x0 Hz).
c
Celik, Kurt, and Uzun

Experimental and Theoretical Explorations on the Buckling Piezoelectric Layer Under Mag-netic Excitation

Celik, Kurt, and Uzun

In Fig. 11, an overall summary of the dynamicalbehavior is given. This 2D diagram is vital, since itcan estimate the dynamical characteristics of thesystem. In the diagram, all colors correspond todifferent dynamical phase space trajectories fromperiodic ones to various chaotic ones. According tothat figure, the dynamics are governed in mainlytwo regions (i.e. blue and red): double scroll chaotic(as in Fig. 10d) and exponentially increasing circu-lar chaotic regimes. Note that the exponentiallyincreasing circular regime has much larger diverg-ing trajectories, hence it is separated from the saw-teeth chaotic regime. This occurs when the mag-netic force exceeds a limit value (i.e. excitationvoltage Uc = 9.35 V) as expected, because theincreasing magnetic force attracts the dynamicsstrongly as an energy source. Thus, it yields to giveenergy to the system and causes a rapid increase inthe distance of the trajectories. Indeed, the saw-teeth chaotic regime governs the dynamics for lowerfrequencies, namely lower than xc = 90 Hz. How-ever, it survives for all magnetic forces (i.e. excita-tion voltages Uc) from 2.67 V to 13.35 V.
The non-chaotic periodic regime also survives forall excitation strengths, whereas it appears only forlower frequencies (i.e. xc = 24 Hz). Among theabove-mentioned regions, there exist some certainislands for triple scroll chaotic and many scrollchaotic regimes.
In Fig. 12a, b, c, d, e, and f, the correspondingharvested voltages are given for all the attractors inFig. 10. It is obvious that the periodic attractorgives a periodic voltage output on the resistive loadas in Fig. 12a. The chaotic attractor in Fig. 10bgives a random voltage output as in Fig. 12b. Notealso that the peak values become slightly lower thanthe periodic case. The harvested voltage of Fig. 10chas a weak undulation on the main frequency (seeFig. 12c). The reason for the undulation is nothingmore than the low-frequency components which areapparent in Fig. 10c as the ripples. However, theseripples always have different values and lead to aweak chaotic output. The two-well attractor inFig. 10d creates a similar characteristic voltageoutput as in Fig. 12d. The voltage always changesrandomly and the scrolls can sometimes be seen atthe upper and sometimes the lower part of thewaveform.
Figure 12e gives a very chaotic appearance bychangingthe amplitudes. The maximal amplitudecan have values between V = 0.1 V and 0.45 V. Thischaracteristic property can also be seen in the phase
plane shown in Fig. 10e by defining the multiplescrolls. Note that, considering the maximal values ofthe waveforms, there is not much differencebetween the waveforms of the double scroll andthe triple scroll chaos. The same property is alsoseen in the phase space trajectories. The lastwaveform in Fig. 12f has a relatively higher ampli-tude, which yields to a high power output. Thewaveform has several scrolls; however, only a shorttime is sketched in Fig. 12f for clarity.
The output powers for all types of dynamicregimes (from the simulations in Fig. 10) are shownin Fig. 13a, b, c, d, e, and f). The maximal powervalues changes from 380 lW to 16 mW in simula-tions depending on the dynamical regime. While theregular regime can harvest power up to P = 520 lWas in Fig. 13a, the power can increase for highervalues in the chaotic regimes. Such a situation,which proves the increase of power in nonlinearregimes, was also observed by Cottone et al.8 Theyreported in their study that the two-well chaoticstructure, which corresponds to our double scrollregime, can induce larger distances from oneattracting point to the other. Thus, that can resultin an increase in output power. Our simulationresults also support their findings in the sense thatthe power of the double scroll regime in Fig. 10dyields nearly 2 mW, which is much higher than theregular case in Fig. 10a. Another interesting obser-vation from the simulations is that the saw-teethchaotic regime also has higher harvested powerwith 6 mW. In one of our earlier studies,11 we haveproven that the saw-teeth structure in velocity dataoccurs due to the periodic magnetic excitation andthat this regime is observed for lower excitationfrequencies.
Although the frequency is low, small oscillationsin displacement and velocity may produce largerpower ranges. In addition, it can also be stated thatthe displacement in Fig. 10c is large compared toother regimes except for the case in Fig. 10f. Thus,this reason mainly causes the increase in powercompared to the other cases. However, we cannotsay that the ripples like saw-teeth do not influencethe power extraction. In the cases of Fig. 10d and e,the displacements are nearly the same. However,the regime in Fig. 10e is nearly two times fasterthan the other one. However, the regime in Fig. 10dgenerates more power compared to the other case.That can be explained in such a way that the twoscroll regime frequently transitions from oneattracting point to the other. Thus, this transitionon the phase plane causes an increase as in Ref. 8.In the triple scroll regime, there also exist severaltransitions; however, the trajectories stay for longerperiods in each regime and that does not contributeto the power. The last regime, given in Fig. 10f, hasthe highest power result, since both the displace-ment and velocity are high compared to the earliercases. However, that cannot be available in realexperiments, since such a high excitation amplitude
Fig. 13. The harvested power for (a) from the periodic regular regionin Fig. 11 at (Uc, xc) = (4 V, x0 Hz), (b) from the chaotic region inFig. 11 at (Uc, xc) = (4.27 V, 6x0 Hz), (c) from the saw-teeth chaoticregion in Fig. 11 at (Uc, xc) = (7.21 V, 4x0 Hz), (d) from the doublescroll chaotic region in Fig. 11 at (Uc, xc) = (5.61 V, 35x0 Hz), (e)from the triple scroll chaotic region in Fig. 11 at (Uc, xc) = (3.74 V,50x0 Hz), and (f) from the multiple scroll chaotic region at (Uc,xc) = (9.35 V, 10x0 Hz).
b
Experimental and Theoretical Explorations on the Buckling Piezoelectric Layer Under Mag-netic Excitation

can break down the PZT layer. However, it is alsointeresting to know that 16 mW of power can beobtained from the simulations for that system.
CONCLUSIONS
Both experimental and theoretical studies on thebuckling characteristics of a wind energy harvesterhave been carried out. According to the findings, thelayer tip exhibits a rich dynamics depending on themagnetic field strength and magnetic field excita-tion frequency. It has been proven that the periodicresponses take place for the frequencies near thenatural frequency of the layer. There also existquasi-periodic responses for lower frequencies. Thefield strength and frequency directly affect thebuckling and the harvested energy very greatlydepends on these parameters. Indeed, double andmultiple scroll dynamics appear for a large param-eter set and they can produce better energy. Thisproves that the nonlinearities can assist in increas-ing the power for some parameter sets; however, itmay also decrease the harvested energy for someparameters. The suggested model agrees well withthe experiments and that model can predict theharvested power, displacement, velocity, voltageand current with a good accuracy. Thereby, themodel can be utilized to improve the system forbetter power harvesting and the experimentalistscan use the model to adjust the parameters forperiodic excited harvesters. This detailed explo-ration also proves that one needs to design andimplement a good rectifying system in order to solvethe harmonic waveforms and store the energy. Byconsidering the dependence on the electrical load,an efficient maximum power point tracking mech-anism is also required. Further studies should becarried out to make use of the maximal power gainfrom the system.
ACKNOWLEDGEMENT
The authors are grateful to the European UnionMinistry of Turkey, National Agency of Turkey,for the support of this project under the Project
Code: 2015-1-TR01-KA203-021342 entitled Innova-tive European Studies on Renewable Energy Systems.
REFERENCES
1. M. Ferrari, V. Ferrari, M. Guizzettia, B. Ando, S. Baglio,and C. Trigona, Sens. Actuators A 162, 425 (2010).
2. K.A. Cook-Chennault, N. Thambi, and A.M. Sastry, SmartMater. Struct. 17, 1 (2008).
3. Y. Song, C.H. Yang, S.K. Hong, S.J. Hwang, J.H. Kim, J.Y.Choi, S.K. Ryu, and T.H. Sung, Int. J. Hydrog. Energy 41,12563 (2016).
4. M.A. Karami, J.R. Farmer, and D.J. Inman, Renew. Energy50, 977 (2013).
5. Y. Uzun, S. Demirbas, and E. Kurt, Elektron. Elektrotech.20, 35 (2014).
6. Y. Uzun and E. Kurt, in Proceedings of 11 InternationalConference on Applications of Electrical Engineering(2012).
7. L. Mateu and F. Moll, in Proceedings of the SPIEMicrotechnologies for the New Millenium, vol. 359 (2005).
8. F. Cottone, H. Vocca, and L. Gammaitoni, Phys. Rev. Lett.102, 080601 (2009).
9. D. Zhu, M.J. Tudor, and S.P. Beeby, Meas. Sci. Technol. 21,1 (2010).
10. S.C. Stanton, C.C. McGehee, and B.P. Mann, Phys. D 239,640 (2010).
11. Y. Uzun and E. Kurt, Sens. Actuator A Phys. 192, 58(2013).
12. Y. Uzun, E. Kurt, and H.H. Kurt, Sens. Actuator A Phys.224, 119 (2015).
13. J. Qiu, J.H. Lang, and A.H. Slocum, IEEE J. Microelec-tromech. Syst. 13, 137 (2004).
14. E. Kurt, R. Kasap, and S. Acar, Math. Comput. Appl. J. 9,275 (2004).
15. E. Kurt, Nonlinear Dyn. 45, 171 (2006).16. S.M. Shahruz, J. Comput. Nonlinear Dyn. 3, 041001
(2008).17. J.T. Lin, B. Lee, and B. Alphenaar, Smart Mater. Struct.
19, 1 (2010).18. S. Roundy and P.K. Wright, Smart Mater. Struct. 13, 1131
(2004).19. L. Wang and F.G. Yuan, Smart Mater. Struct. 045009, 17
(2008).20. Y. Uzun and E. Kurt, in Proceedings of 3rd International
Conference on Nuclear and Renewable Energy Resources(2012).
21. E. Kurt and Y. Uzun, in Proceedings of 2nd InternationalConference on Nuclear and Renewable Energy Research(2010).
22. Y. Uzun and E. Kurt, Energy Conversat. Manag. 72, 156(2013).
Celik, Kurt, and Uzun