experimental approaches to studying … · of xenobiotics in food animals 1 t. s ... experimental...
TRANSCRIPT
EXPERIMENTAL APPROACHES TO STUDYING METABOLIC FATE OF XENOBIOTICS IN FOOD ANIMALS 1
T. S. Rumsey 2
US Depar tment of Agriculture, Beltsville, MD 20705
Summary
The use of agricultural chemicals is an im- por tant aspect of animal production. Animal scientists have played an active and varied role in the recent and rapidly developed use of these chemicals. Although approval to use agricul- tural chemicals has always been based on both efficacy and end point residues, increased con- sumer concerns during the past one and one- half decades about the safety of these chemicals have caused greater awareness for the latter. In this regard, emphasis on the total residue curve of an agricultural chemical should serve as a tool that will help optimize dose rate on one hand and minimize end point residues on the other hand. Selection against lipophilic mater- ials has resulted in a marked reduction in resi- due load. However, problems with lipophilic residues still exist, and knowledge about how to prevent or manage these residues in animals as well as fundamental knowledge about their absorption is needed. Continued emphasis on reducing residue load of hydrophil ic chemicals through the use of devices such as implants, boluses and ear tags should have high priori ty as should research on the absorption and ex- cretion mechanisms of these chemicals. There are two important areas of research that are needed to help us deal with end point residues in the future. One is better understanding of the toxicology of end point residues so we can move away from the concept of zero tolerance toward basing all of our guidelines for the use of a chemical on biological principles. The other is bet ter understanding of the specific
Invitational paper presented at the Symposium on "Assessing the Hazard of Residues in Food Animals." held on July 28, 1981, during the 73rd Annu. Meet. ASAS, North Carolina State Univ., Raleigh.
2Ruminant Nutrition Laboratory, Anita. Sci. Institute, Agr. Res. Service, USDA, BeltsviUe, MD 20705.
mode of action of the chemicals we use, which will permit more refined management of agri- cultural chemicals and a further assurance of safety. (Key Words: Xenobiotics, Pesticides, Food Animals, Tissue Residues, Agricultural Chemi- cals.)
I ntroduction
The intent of this paper is twofold: (1) to briefly place in perspective the importance of xenobiotics to animal agriculture and the role of animal scientists in the development of this technology, and (2) to highlight areas of tech- nological research needed to sustain the effec- tive use of xenobiotics in animal production. The approach will be general and will a t tempt to use the residue curve as a guide in the dis- cussion of experimental approaches.
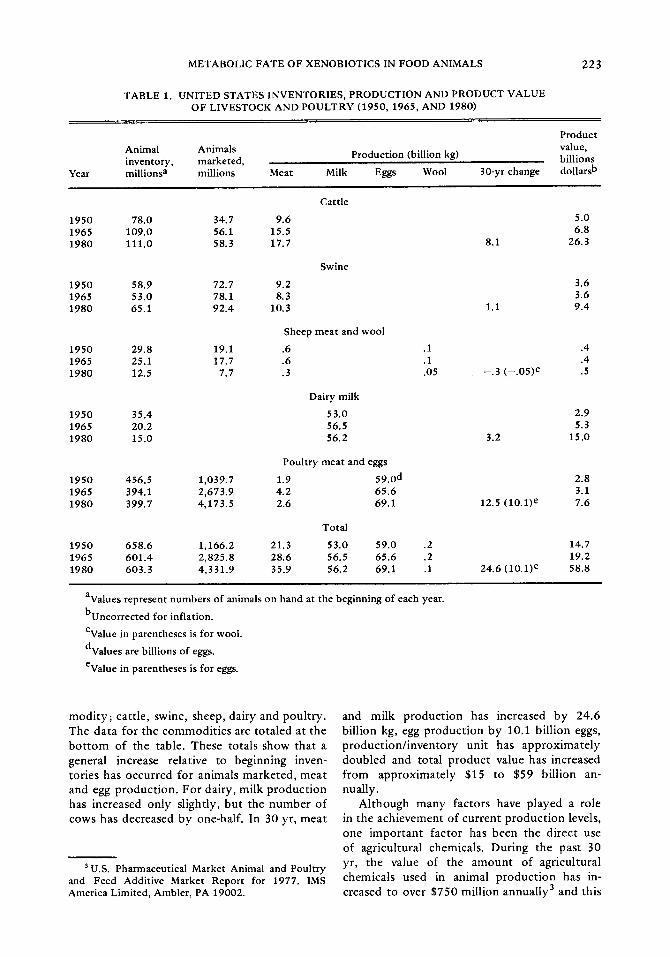
Importance of Xenobiotics. It is well estab- lished in animal agriculture that xenobiotics, "chemicals exogenous to the animal," play a major role in our current product ion systems. In a broad sense, the control of pests and dis- orders with chemicals is centuries old. How- ever, the major role played by agricultural chemicals today in the improvement of pro- duction and product quality is a relatively re- cent development that has occurred primarily during the past 30 yr, particularly in developed countries as part of intensive production sys- tems. The significance of agricultural chemicals to animal agriculture in the United States be- comes more meaningful when viewed relative to the size of the United States animal indus- try. Published statistics on farm animal inven- tories, product ion and value for 1950, 1965 and 1980 are shown in table 1 (USDA, 1950, 1965, 1980) to help visualize product ion trends over the past 30 yr. The table shows for each year, the beginning inventory units, numbers marketed, amount of product marketed and value of the marketed product for each corn-
222
JOURNAL OF ANIMAL SCIENCE, Voi. 56, No. 1, 1983
METABOLIC FATE OF XENOBIOTICS IN FOOD ANIMALS
TABLE 1. UNITED STATES INVENTORIES, PRODUCTION AND PRODUCT VALUE OF LIVESTOCK AND POULTRY (1950, 1965, AND 1980)
223
Year
Animal Animals Production (billion kg) inventory, marketed, millions a millions Meat Milk Eggs Wool 30-yr change
Product value, billions dollars b
1950 78.0 34.7 9.6 1965 109.0 56.1 15.5 1980 111.0 58.3 17.7
1950 58.9 72.7 9.2 1965 53.0 78.1 8.3 1980 65.1 92.4 10.3
1950 1965 1980
1950 1965 1980
1950 1965 1980
1950 1965 1980
Cattle
Swine
Sheep meat and wool
29.8 19.1 .6 .1 25.1 17.7 .6 .1 12.5 7.7 .3 .05
Dairy milk
35.4 53.0 20.2 56.5 15.0 56.2
Poultry meat and eggs
456.5 1,039.7 1.9 59.0 d 394.1 2,673.9 4.2 65.6 399.7 4,173.5 2.6 69.1
Total
658.6 1,166.2 21.3 53.0 59.0 .2 601.4 2,825.8 28.6 56.5 65.6 .2 603.3 4,331.9 35.9 56.2 69.1 .1
8.1
1.1
- . 3 ( - .05) c
3.2
12.5 (10.1) e
24.6 (10.1) e
5.0 6.8
26.3
3.6 3.6 9.4
.4
.4
.5
2.9 5.3
15.0
2.8 3.1 7.6
14.7 19.2 58.8
avalues represent numbers of animals on hand at the beginning of each year.
buncorrected for inflation.
CValue in parentheses is for wool.
dValues are billions of eggs.
evalue in parentheses is for eggs.
m o d i t y ; ca t t le , swine, sheep, dairy and pou l t ry . The da t a for t he c o m m o d i t i e s are t o t a l ed a t the b o t t o m of the table . These to ta l s show t h a t a general increase relat ive to beg inn ing inven- to r ies has occu r r ed for an imals m a r k e t e d , m e a t and egg p r o d u c t i o n . F o r dai ry , mi lk p r o d u c t i o n has increased on ly sl ightly, b u t the n u m b e r o f cows has decreased b y one-half . In 30 yr, m e a t
3 u.s. Pharmaceutical Market Animal and Poultry and Feed Additive Market Report for 1977. IMS America Limited, Ambler, PA 19002.
and mi lk p r o d u c t i o n has increased b y 24 .6 b i l l ion kg, egg p r o d u c t i o n b y 10.1 b i l l ion eggs, p r o d u c t i o n / i n v e n t o r y un i t has a p p r o x i m a t e l y d o u b l e d and to ta l p r o d u c t value has increased f r o m a p p r o x i m a t e l y $15 to $59 b i l l ion an- nual ly .
A l t h o u g h m a n y fac to r s have p layed a role in t he a c h i e v e m e n t of c u r r e n t p r o d u c t i o n levels, one i m p o r t a n t f ac to r has b e e n the d i rec t use of agr icu l tura l chemicals . Dur ing the pas t 30 yr, t he value of the a m o u n t of agr icu l tura l chemica l s used in an imal p r o d u c t i o n has in- creased to over $750 mi l l ion annua l ly 3 and th i s
224 RUMSEY
figure does not include those chemicals used for sarfitation or for the product ion of animal feed. The importance of chemicals used for the product ion of animal feed is exemplified by the current estimate that 50% of our grain, in addi- t ion to our harvested forages and pasture, is consumed by food producing animals.
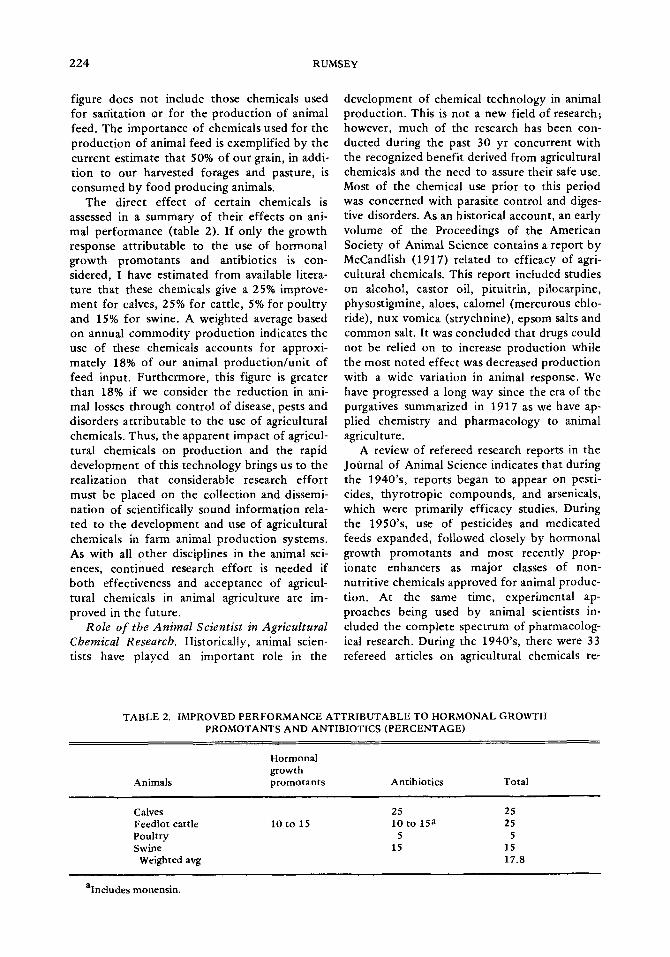
The direct effect of certain chemicals is assessed in a summary of their effects on ani- mal performance (table 2). If only the growth response at tr ibutable to the use of hormonal growth promotants and antibiotics is con- sidered, I have estimated from available litera- ture that these chemicals give a 25% improve- ment for calves, 25% for cattle, 5% for poul t ry and 15% for swine. A weighted average based on annual commodi ty product ion indicates the use of these chemicals accounts for approxi- mately 18% of our animal product ion/uni t of feed input. Furthermore, this figure is greater than 18% if we consider the reduction in ani- mal losses through control of disease, pests and disorders at t r ibutable to the use of agricultural chemicals. Thus, the apparent impact of agricul- tural chemicals on product ion and the rapid development of this technology brings us to the realization that considerable research effort must be placed on the collection and dissemi- nation of scientifically sound information rela- ted to the development and use of agricultural chemicals in farm animal product ion systems. As with all other disciplines in the animal sci- ences, continued research effort is needed if both effectiveness and acceptance of agricul- tural chemicals in animal agriculture are im- proved in the future.
Role of tbe Animal Scientist in Agricultural Chemical Researcb. Historically, animal scien- tists have played an important role in the
development of chemical technology in animal production. This is not a new field of research; however, much of the research has been con- ducted during the past 30 yr concurrent with the recognized benefit derived from agricultural chemicals and the need to assure their safe use. Most of the chemical use prior to this period was concerned with parasite control and diges- tive disorders. As an historical account, an early volume of the Proceedings of the American Society of Animal Science contains a report by McCandlish (1917) related to efficacy of agri- cultural chemicals. This report included studies on alcohol, castor oil, pituitr in, pilocarpine, physostigmine, aloes, calomel (mercurous chlo- ride), nux vomica (strychnine), epsom salts and common salt. It was concluded that drugs could not be relied on to increase production while the most noted effect was decreased production with a wide variation in animal response. We have progressed a long way since the era of the purgatives summarized in 1917 as we have ap- plied chemistry and pharmacology to animal agriculture.
A review of refereed research reports in the Journal of Animal Science indicates that during the 1940's, reports began to appear on pesti- cides, thyrotropic compounds, and arsenicals, which were primarily efficacy studies. During the 1950's, use of pesticides and medicated feeds expanded, followed closely by hormonal growth promotants and most recently prop- ionate enhancers as major classes of non- nutritive chemicals approved for animal produc- tion. At the same time, experimental ap- proaches being used by animal scientists in- cluded the complete spectrum of pharmacolog- ical research. During the 1940's, there were 33 refereed articles on agricultural chemicals re-
TABLE 2. IMPROVED PERFORMANCE ATTRIBUTABLE TO HORMONAL GROWTH PROMOTANTS AND ANTIBIOTICS (PERCENTAGE)
Hormonal growth
Animals promotants Antibiotics Total
Calves 25 25 Feedlot cattle 10 to 15 10 to 15 a 25 Poultry 5 5 Swine 15 15
Weighted avg 17.8
alncludes monensin.
METABOLIC FATE OF XENOBIOTICS IN FOOD ANIMALS 2 2 5
ported in the Journal of Animal Science. How- ever, during the 1950's there were 253 articles, including 154 generally classified as reports on efficacy, 75 on physiology and biochemistry, 24 on residues and metabolism and four on toxicology. During the 1970's, there were 289 articles; 114 on efficacy, 117 on physiology and biochemistry, 51 on residues and metabo- lism and seven on toxicology. Furthermore, this represents only a part of the total xenobio- tic research reported by animal scientists in a myriad of journals and other media from which complete statistics were not compiled. The recent formation of a pharmacology and toxi- cology section in the Journal of Animal Science represents a new era, which one hopes will stimulate reports of studies on agricultural chemicals for evaluation and review alongside fundamental studies in nutri t ion and physiology.
This brief historical account shows that ani- mal scientists have not hesitated in the develop- ment of research programs in all areas of agri- cultural chemical research, but we have a long way to go if we are to generate the body of knowledge needed to satisfy producer needs and consumer desires of the future. As stated at the outset, this paper will deal with experi- mental approaches for the study of agricultural chemicals in farm animals. The approach, how- ever, will not be a review of detailed research but a discussion of a few general concepts and approaches that I think need emphasis during the near future. The discussion is developed around agricultural chemicals in the broadest sense and not limited to a specific class of chemicals.
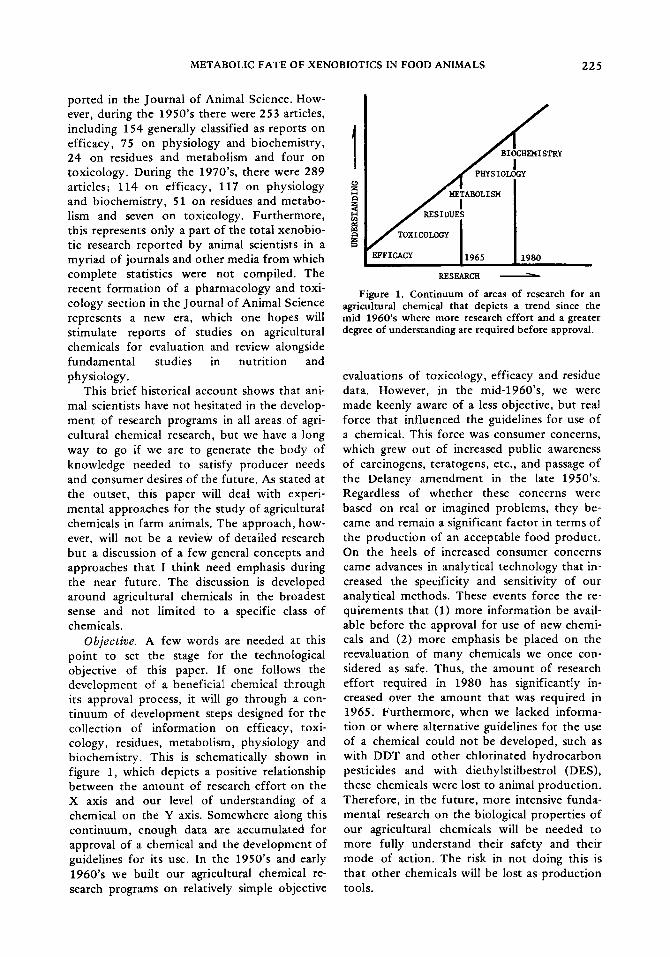
Objective. A few words are needed at this point to set the stage for the technological objective of this paper. If one follows the development of a beneficial chemical through its approval process, it will go through a con- t inuum of development steps designed for the collection o f information on efficacy, toxi- cology, residues, metabolism, physiology and biochemistry. This is schematically shown in figure 1, which depicts a positive relationship between the amount of research effort on the X axis and our level of understanding of a chemical on the Y axis. Somewhere along this cont inuum, enough data are accumulated for approval of a chemical and the development of guidelines for its use. In the 1950's and early 1960's we built our agricultural chemical re- search programs on relatively simple objective
/ oxi oL Y ] 119,5 1980
RESEARCH
Figure 1. Continuum of areas of research for an agricultural chemical that depicts a trend since the mid 1960's where more research effort and a greater degree of understanding are required before approval.
evaluations of toxicology, efficacy and residue data. However, in the mid-1960's, we were made keenly aware of a less objective, but real force that influenced the guidelines for use of a chemical. This force was consumer concerns, which grew out of increased public awareness of carcinogens, teratogens, etc., and passage of the Delaney amendment in the late 1950's. Regardless of whether these concerns were based on real or imagined problems, they be- came and remain a significant factor in terms of the production of an acceptable food product. On the heels of increased consumer concerns came advances in analytical technology that in- creased the specificity and sensitivity of our analytical methods. These events force the re- quirements that (1) more information be avail- able before the approval for use of new chemi- cals and (2) more emphasis be placed on the reevaluation of many chemicals we once con- sidered as safe. Thus, the amount of research effort required in 1980 has significantly in- creased over the amount that was required in 1965. Furthermore, when we lacked informa- tion or where alternative guidelines for the use of a chemical could not be developed, such as with DDT and other chlorinated hydrocarbon pesticides and with diethylstilbestrol (DES), these chemicals were lost to animal production. Therefore, in the future, more intensive funda- mental research on the biological properties of our agricultural chemicals will be needed to more fully understand their safety and their mode of action. The risk in not doing this is that other chemicals will be lost as production tools.
226 RUMSEY
Pharmacodynamic research
- Toxicological processes~ - Metabolic processes
Efficacy - Biochemical p ........ l / ~End-po in t ,~ ApprOVal - Fate V residues - Mode of action
Figure 2. Scope of research that leads to approval of an agricultural chemical.
Because consumer concerns exert a strong influence on our food producing system and result in more intense evaluation of the use of agricultural chemicals, I think there is need for more emphasis on "fine tuning" the guidelines for use of chemicals that now exist. Fine tuning our current guidelines in terms of dose rate, method of exposure, and time of exposure as new information becomes available is im- por tant for the achievement of maximum pro- duction benefits, safety, and acceptabil i ty of chemicals we now use. Hopefully, this fine tuning will help us focus more sharply on the exact end products of animal product ion and the specific means of affecting these end pro- ducts as we develop new chemicals. Therefore, the specific purpose of this paper is to focus on some areas of fine tuning relative to the ap- proaches we take in agricultural chemical research.
Residue Curve
General. At the outset, we should review in general terms the procedures for approval of agricultural chemicals for use in livestock. A chemical is approved on the basis of research data on efficacy (usefulness to producer) and end point residues (safety to the consumer) as depicted in figure 2. The body of knowledge needed for the evaluation of efficacy and end point residues is derived from research encom- passed by the broad field of pharmacology. An excellent description of the many phases and concepts related to the pharmacodynamics of xenobiotics has been compiled in a book by Baggot (1977). The important point depicted by figure 2 is that efficacy and end point resi- dues are the primary factors for consideration of approval, but efficacy and residue consi- derations have a very broad and overlapping pharmacological basis.
With this in mind, let us review a typical residue curve associated with an agricultural
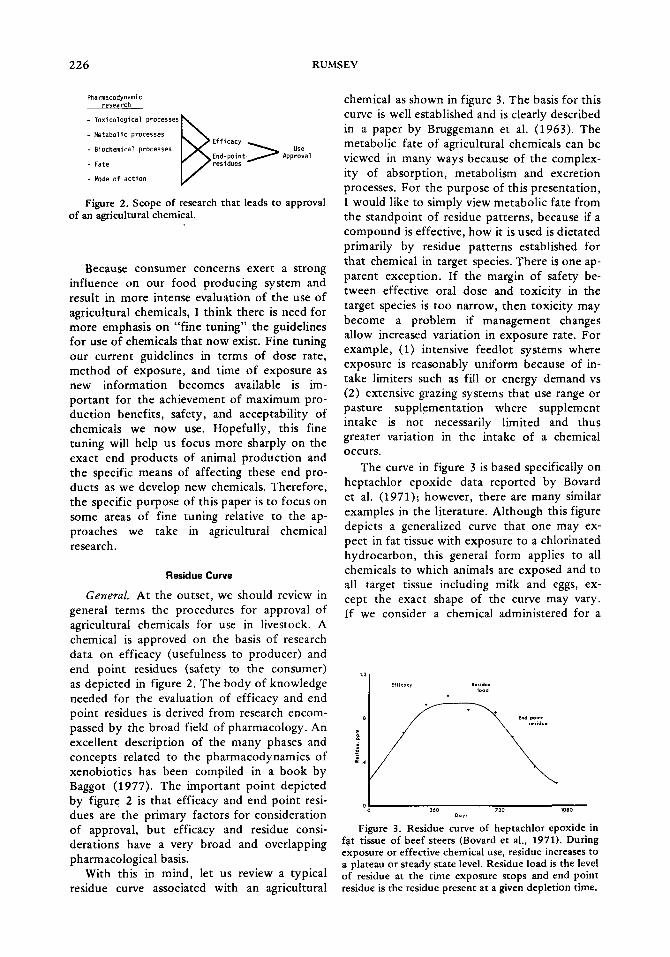
chemical as shown in figure 3. The basis for this curve is well established and is clearly described in a paper by Bruggemann et al. (1963). The metabolic fate of agricultural chemicals can be viewed in many ways because of the complex- ity of absorption, metabolism and excretion processes. For the purpose of this presentation, I would like to simply view metabolic fate from the standpoint of residue patterns, because if a compound is effective, how it is used is dictated primarily by residue patterns established for that chemical in target species. There is one ap- parent exception. If the margin of safety be- tween effective oral dose and toxici ty in the target species is too narrow, then toxici ty may become a problem if management changes allow increased variation in exposure rate. For example, (1) intensive feedlot systems where exposure is reasonably uniform because of in- take limiters such as fill or energy demand vs (2) extensive grazing systems that use range or pasture supplementation where supplement intake is not necessarily limited and thus greater variation in the intake of a chemical O c c u r s .
The curve in figure 3 is based specifically on heptachlor epoxide data reported by Bovard et al. (1971); however, there are many similar examples in the literature. Although this figure depicts a generalized curve that one may ex- pect in fat tissue with exposure to a chlorinated hydrocarbon, this general form applies to all chemicals to which animals are exposed and to all target tissue including milk and eggs, ex- cept the exact shape of the curve may vary. If we consider a chemical administered for a
~8
- ' .4
Effir Re*idue
360 720 1,080 O=y~
Figure 3. Residue curve of heptachlor epoxide in fat tissue of beef steers (Bovard et al., 1971). During exposure or effective chemical use, residue increases to a plateau or steady state level. Residue load is the level of residue at the time exposure stops and end point residue is the residue present at a given depletion time.
METABOLIC FATE OF XENOBIOTICS IN FOOD ANIMALS 227
. . . . . . . . . . . . . o : ' ' . 3 0 . . . . . . . . . . . ; - 'A5
. . . . . . . . . . . :80
6 i �9 11
c O �9
|
I
2
/ 11
0 2 ,~ 6 8 D o s e
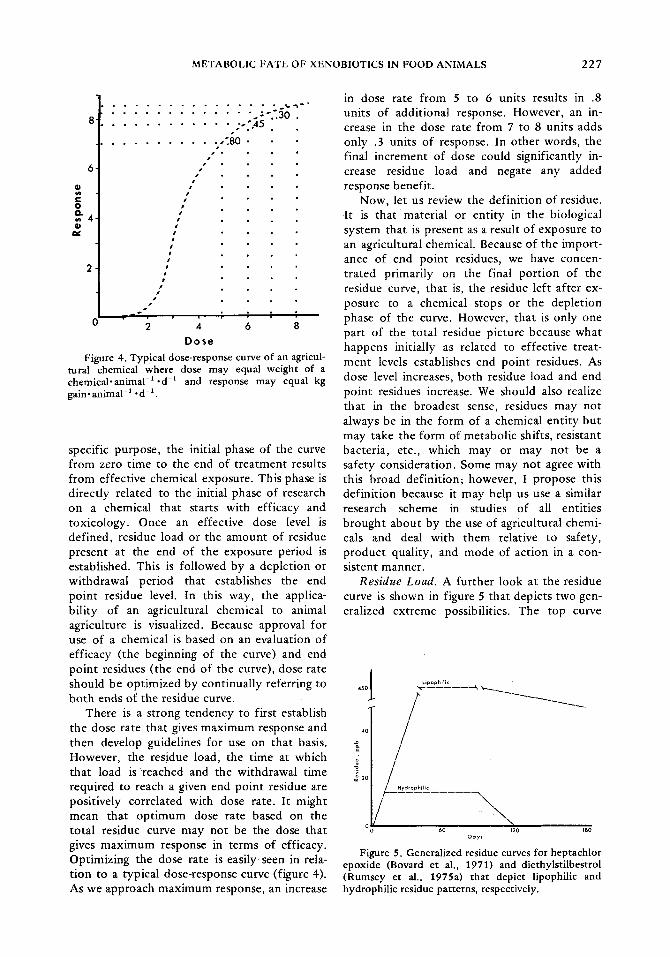
Figure 4. Typical dose-response curve of an agricul- tural chemical where dose may equal weight of a chemical.animal -1 -d -1 and response may equal kg gain. animal- 1 . d - 1.
specific purpose, the initial phase of the curve from zero time to the end of treatment results from effective chemical exposure. This phase is directly related to the initial phase of research on a chemical that starts with efficacy and toxicology. Once an effective dose level is defined, residue load or the amount of residue present at the end of the exposure period is established. This is followed by a depletion or withdrawal period that establishes the end point residue level. In this way, the applica- bility of an agricultural chemical to animal agriculture is visualized. Because approval for use of a chemical is based on an evaluation of efficacy (the beginning of the curve) and end point residues (the end of the curve), dose rate should be optimized by continually referring to both ends of the residue curve.
There is a strong tendency to first establish the dose rate that gives maximum response and then develop guidelines for use on that basis. However, the residue load, the time at which that load is ~reached and the withdrawal time required to reach a given end point residue are positively correlated with dose rate. It might mean that opt imum dose rate based on the total residue curve may not be the dose that gives maximum response in terms of efficacy. Optimizing the dose rate is easily seen in rela- tion to a typical dose-response curve (figure 4). As we approach maximum response, an increase
in dose rate from 5 to 6 units results in .8 units of additional response. However, an in- crease in the dose rate from 7 to 8 units adds only .3 units of response. In other words, the final increment of dose could significantly in- crease residue load and negate any added response benefit.
Now, let us review the definition of residue. It is that material or entity in the biological system that is present as a result of exposure to an agricultural chemical. Because of the import- ance of end point residues, we have concen- trated primarily on the final portion of the residue curve, that is, the residue left after ex- posure to a chemical stops or the depletion phase of the curve. However, that is only one part of the total residue picture because what happens initially as related to effective treat- ment levels establishes end point residues. As dose level increases, both residue load and end point residues increase. We should also realize that in the broadest sense, residues may not always be in the form of a chemical entity but may take the form of metabolic shifts, resistant bacteria, etc., which may or may not be a safety consideration. Some may not agree with this broad definition; however, I propose this definition because it may help us use a similar research scheme in studies of all entities brought about by the use of agricultural chemi- cals and deal with them relative to safety, product quality, and mode of action in a con- sistent manner.
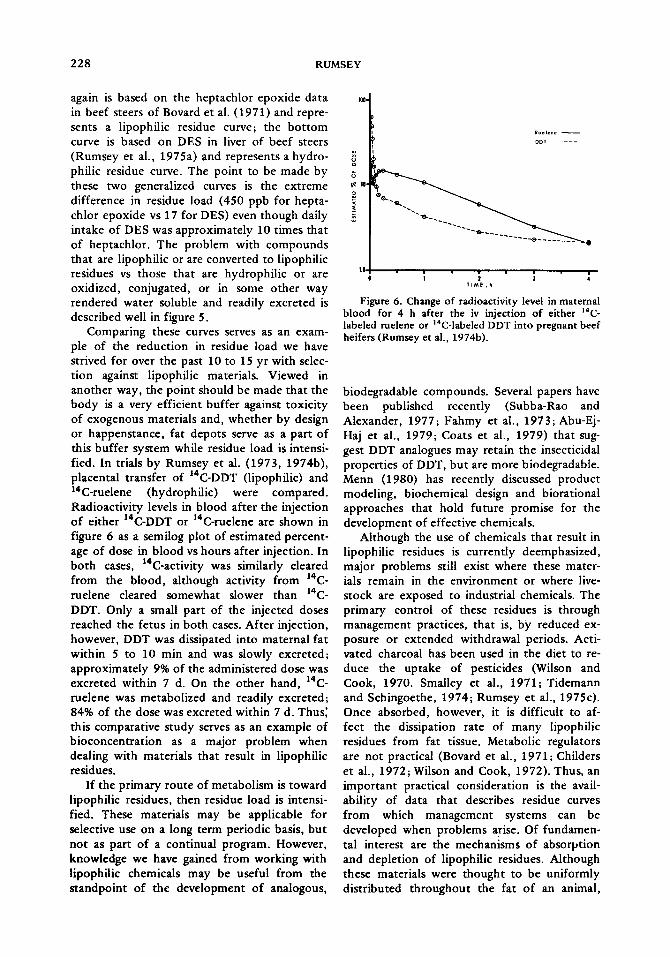
Residue Load. A further look at the residue curve is shown in figure 5 that depicts two gen- eralized extreme possibilities. The top curve
4G
2o
Lipophilir
Hydrophilir \
\ \
\ 60 120 180
Doys
Figure 5. Generalized residue curves for heptachlor epo• (Bovard et al., 1971) and diethylst i lbestrol (Rumsey et al., 1975a) that depict l ipophi l ic and hydrophilic residue patterns, respectively.
228 RUMSEY
again is based on the heptachlor epoxide data in beef steers of Bovard et al. (1971) and repre- sents a lipophilic residue curve; the bot tom curve is based on DES in liver of beef steers (Rumsey et al., 1975a) and represents a hydro- philic residue curve. The point to be made by these two generalized curves is the extreme difference in residue load (450 ppb for hepta- chlor epoxide vs 17 for DES) even though daily intake of DES was approximately 10 times that of heptachlor. The problem with compounds that are lipophilic or are converted to lipophilic residues vs those that are hydrophilic or are oxidized, conjugated, or in some other way rendered water soluble and readily excreted is described well in figure 5.
Comparing these curves serves as an exam- ple of the reduction in residue load we have strived for over the past 10 to 15 yr with selec- tion against lipophilic materials. Viewed in another way, the point should be made that the body is a very efficient buffer against toxicity of exogenous materials and, whether by design or happenstance, fat depots serve as a part of this buffer system while residue load is intensi- fied. In trials by Rumsey et al. (1973, 1974b), placental transfer of 14C-DDT (lipophilic) and 14C-ruelene (hydrophilic) were compared. Radioactivity levels in blood after the injection of either 14C-DDT or 14C-ruelene are shown in figure 6 as a semilog plot of estimated percent- age of dose in blood vs hours after injection. In both cases, 14C-activity was similarly cleared from the blood, although activity from 14C- ruelene cleared somewhat slower than 14C- DDT. Only a small part of the injected doses reached the fetus in both cases. After injection, however, DDT was dissipated into maternal fat within 5 to 10 rain and was slowly excreted; approximately 9% of the administered dose was excreted within 7 d. On the other hand, 14C- ruelene was metabolized and readily excreted; 84% of the dose was excreted within 7 d. Thus~ this comparative study serves as an example of bioconcentration as a major problem when dealing with materials that result in lipophilic residues.
If the primary route of metabolism is toward lipophilic residues, then residue load is intensi- fied. These materials may be applicable for selective use on a long term periodic basis, but not as part of a continual program. However, knowledge we have gained from working with lipophilic chemicals may be useful from the standpoint of the development of analogous,
c J
IE
RueJene
DDT . . . . .
~ O T IME,h
Figure 6. Change of radioactivity level in maternal blood for 4 h after the iv injection of either ~4C- labeled ruelene or lac-labeled DDT into pregnant beef heifers (Rumsey et al., 1974b).
biodegradable compounds. Several papers have been published recently (Subba-Rao and Alexander, 1977; Fahmy et al., 1973; Abu-Ej- Haj et al., 1979; Coats et al., 1979) that sug- gest DDT analogues may retain the insecticidal properties of DDT, but are more biodegradable. Menn (1980) has recently discussed product modeling, biochemical design and biorational approaches that hold future promise for the development of effective chemicals.
Although the use of chemicals that result in lipophilic residues is currently deemphasized, major problems still exist where these mater- ials remain in the environment or where live- stock are exposed to industrial chemicals. The primary control of these residues is through management practices, that is, by reduced ex- posure or extended withdrawal periods. Acti- vated charcoal has been used in the diet to re- duce the uptake of pesticides (Wilson and Cook, 1970. Smalley et al., 1971; Tidemann and Sehingoethe, 1974; Rumsey et al., 1975c). Once absorbed, however, it is difficult to af- fect the dissipation rate of many lipophilic residues from fat tissue. Metabolic regulators are not practical (Bovard et al., 1971; Childers et al., 1972; Wilson and Cook, 1972). Thus, an important practical consideration is the avail- ability of data that describes residue curves from which management systems can be developed when problems arise. Of fundamen- tal interest are the mechanisms of absorption and depletion of lipophilic residues. Although these materials were thought to be uniformly distributed throughout the fat of an animal,
M E T A B O L I C F A T E O F X E N O B I O T I C S I N F O O D A N I M A L S 229
tx
~ 30" <
0 u
Z 20,
t3 w 7,
~.0 a
- c
16.7
Fat tissue , ppm in el~trocted {a~ 0
Fat tissue, ppm ir~ whole tissue
Organ , " . . . . ~ ]
Mu Lc',e , ' . . . . . [ ]
I0~
3.2 3.5 2.0 1.7
,7, ~ z z D z ~ ~ z = ' ~ 2 ~
~' o_ x ~ '~ ~ z -~ ~ ~ > ~ - 0 *2-
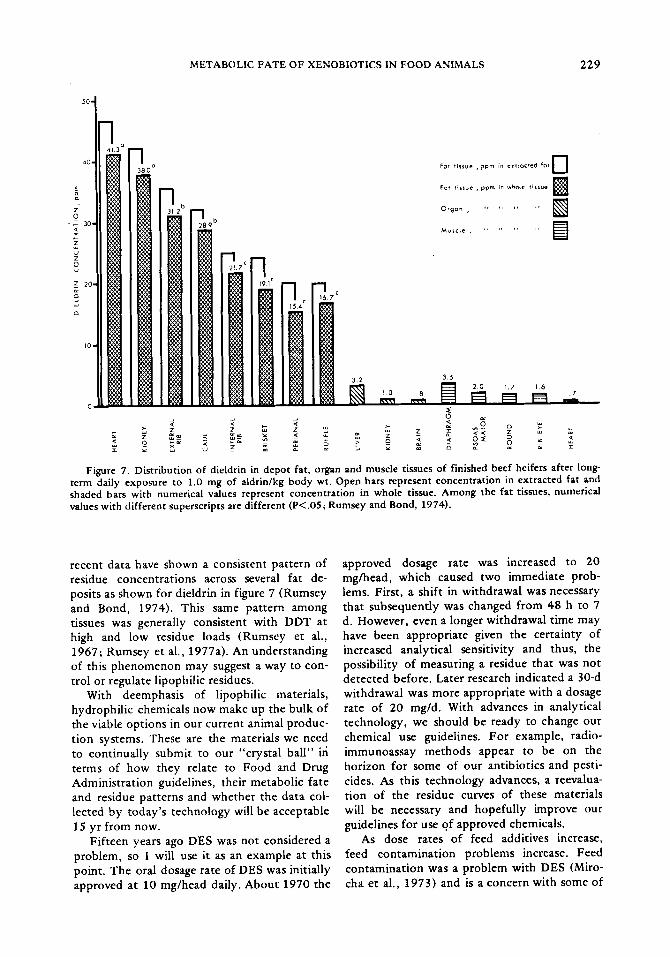
Figure 7. Distribution of dieldrin in depot fat, organ and muscle tissues of finished beef heifers after long- term daily exposure to 1.0 mg of aldrin/kg body wt. Open bars represent concentration in extracted fat and shaded bars with numerical values represent concentration in whole tissue. Among the fat tissues, numerical values with different superscripts are different (P<.05; Rumsey and Bond, 1974).
recent data have shown a consistent pattern of residue concentrations across several fat de- posits as shown for dieldrin in figure 7 (Rumsey and Bond, 1974). This same pattern among tissues was generally consistent with DDT at high and low residue loads (Rumsey et al., 1967; Rumsey et al., 1977a). An understanding of this phenomenon may suggest a way to con- trol or regulate lipophilic residues.
With deemphasis of lipophilic materials, hydrophilic chemicals now make up the bulk of the viable options in our current animal produc- tion systems. These are the materials we need to continually submit to our "crystal ball" iri terms of how they relate to Food and Drug Administration guidelines, their metabolic fate and residue patterns and whether the data col- lected by today's technology will be acceptable 15 yr from now.
Fifteen years ago DES was not considered a problem, so I will use it as an example at this point. The oral dosage rate of DES was initially approved at 10 mg/head daily. About 1970 the
approved dosage rate was increased to 20 mg/head, which caused two immediate prob- lems. First, a shift in withdrawal was necessary that subsequently was changed from 48 h to 7 d. However, even a longer withdrawal time may have been appropriate given the certainty of increased analytical sensitivity and thus, the possibility of measuring a residue that was not detected before. Later research indicated a 30-d withdrawal was more appropriate with a dosage rate of 20 mg/d. With advances in analytical technology, we should be ready to change our chemical use guidelines. For example, radio- immunoassay methods appear to be on the horizon for some of our antibiotics and pesti- cides. As this technology advances, a reevalua- tion of the residue curves of these materials will be necessary and hopefully improve our guidelines for use of approved chemicals.
As dose rates of feed additives increase, feed contamination problems increase. Feed contamination was a problem with DES (Miro- cha et al., 1973) and is a concern with some of
230 RUMSEY
our antibiotics. This subject will not be dis- cussed in this paper, but it should be men- tioned that recently the use of antibiotic granu- les have effectively reduced cross contamina- tion of antibiotics in feed mills.
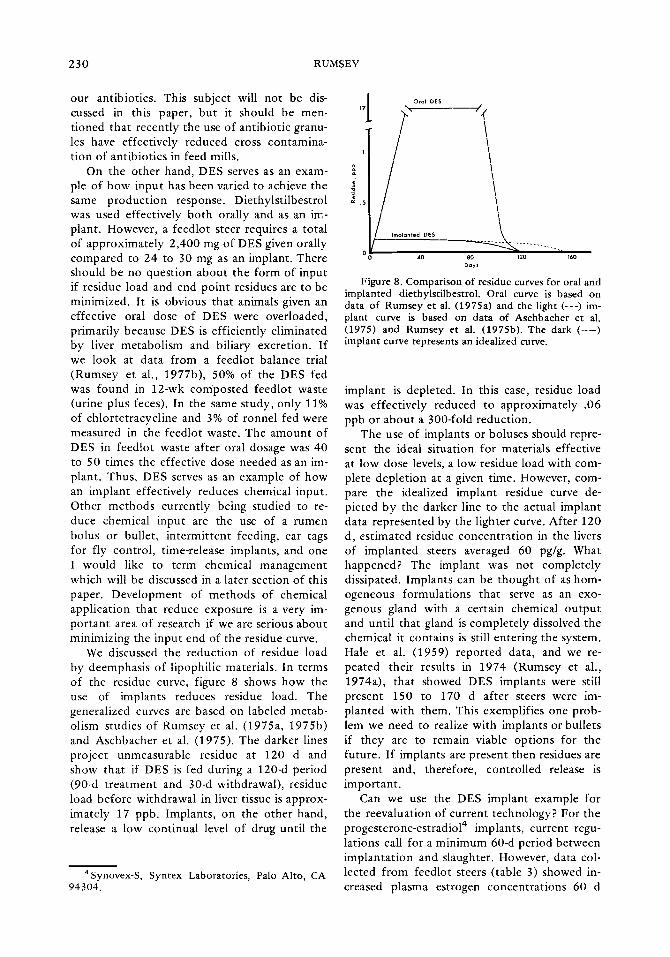
On the other hand, DES serves as an exam- ple of how input has been varied to achieve the same production response. Diethylstilbestrol was used effectively both orally and as an im- plant. However, a feedlot steer requires a total of approximately 2,400 mg of DES given orally compared to 24 to 30 mg as an implant. There should be no question about the form of input if residue load and end point residues are to be minimized. It is obvious that animals given an effective oral dose of DES were overloaded, primarily because DES is efficiently eliminated by liver metabolism and biliary excretion. If we look at data from a feedlot balance trial (Rumsey et al., 1977b), 50% of the DES fed was found in 12-wk composted feedlot waste (urine plus feces). In the same study, only 11% of chlortetracycline and 3% of ronnel fed were measured in the feedlot waste. The amount of DES in feedlot waste after oral dosage was 40 to 50 times the effective dose needed as an im- plant. Thus, DES serves as an example of how an implant effectively reduces chemical input. Other methods currently being studied to re- duce chemical input are the use of a rumen bolus or bullet, intermittent feeding, ear tags for fly control, time-release implants, and one I would like to term chemical management which will be discussed in a later section of this paper. Development of methods of chemical application that reduce exposure is a very im- portant area of research if we are serious about minimizing the input end of the residue curve.
We discussed the reduction of residue load by deemphasis of lipophilic materials. In terms of the residue curve, figure 8 shows how the use of implants reduces residue load. The generalized curves are based on labeled metab- olism studies of Rumsey et al. (1975a, 1975b) and Aschbacher et al. (1975). The darker lines project unmeasurable residue at 120 d and show that if DES is fed during a 120-d period (90-d treatment and 30-d withdrawal), residue load before withdrawal in liver tissue is approx- imately 17 ppb. Implants, on the other hand, release a low continual level of drug until the
4Synovex-S, Syntex Laboratories, Palo Alto, CA 943O4.
�9
Implanted DES
0 40 80 120 Days
Figure 8. Comparison of residue curves for oral and implanted diethylstilbestrol. Oral curve is based on data of Rumsey et al. (1975a) and the light (---) im- plant curve is based on data of Aschbacher et al. (1975) and Rumsey et al. (1975b). The dark ( - - ) implant curve represents an idealized curve.
implant is depleted. In this case, residue load was effectively reduced to approximately .06 ppb or about a 300-fold reduction.
The use of implants or boluses should repre- sent the ideal situation for materials effective at low dose levels, a low residue load with com- plete depletion at a given time. However, com- pare the idealized implant residue curve de- picted by the darker line to the actual implant data represented by the lighter curve. After 120 d, estimated residue concentration in the livers of implanted steers averaged 60 pg/g. What happened? The implant was not completely dissipated. Implants can be thought of as hom- ogeneous formulations that serve as an exo- genous gland with a certain chemical output and until that gland is completely dissolved the chemical it contains is still entering the system. Hale et al. (1959) reported data, and we re- peated their results in 1974 (Rumsey et al., 1974a), that showed DES implants were still present 150 to 170 d after steers were im- planted with them. This exemplifies one prob- lem we need to realize with implants or bullets if they are to remain viable options for the future. If implants are present then residues are present and, therefore, controlled release is important.
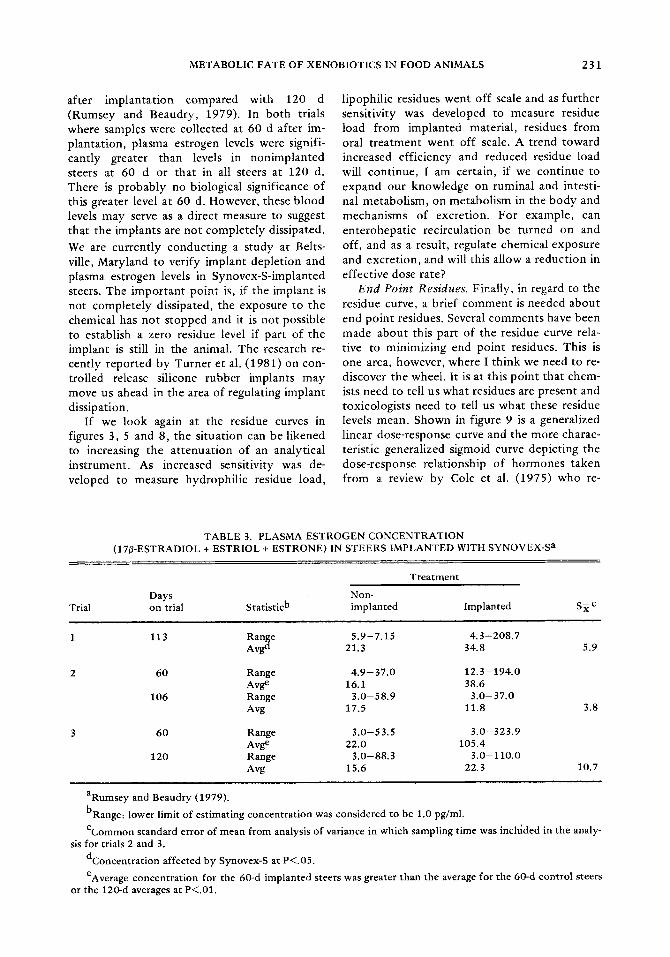
Can we use the DES implant example for the reevaluation of current technology? For the progesterone-estradiol 4 implants, current regu- lations call for a minimum 60-d period between implantation and slaughter. However, data col- lected from feedlot steers (tabl e 3) showed in- creased plasma estrogen concentrations 60 d
METABOLIC FATE OF XENOBIOTICS IN FOOD ANIMALS 23 1
after implan ta t ion compared with 120 d (Rumsey and Beaudry, 1979). In both trials where samples were col lected at 60 d after im- plantat ion, plasma estrogen levels were signifi- cantly greater than levels in non implan ted steers at 60 d or that in all steers at 120 d. There is probably no biological significance of this greater level at 60 d. However , these b lood levels may serve as a direct measure to suggest that the implants are no t comple te ly dissipated.
We are current ly conduct ing a s tudy at Belts- ville, Maryland to verify implant deple t ion and plasma estrogen levels in Synovex-S- implanted steers. The impor t an t po in t is, if the implant is not comple te ly dissipated, the exposure to the chemical has no t s topped and it is not possible to establish a zero residue level if part of the implant is still in the animal. The research re- cently repor ted by Turner et al. (1981) on con- t rol led release silicone rubber implants may move us ahead in the area of regulating implant dissipation.
If we look again at the residue curves in figures 3, 5 and 8, the s i tuat ion can be l ikened to increasing the a t tenua t ion of an analyt ical ins t rument . As increased sensitivity was de- veloped to measure hydrophi l ic residue load,
l ipophil ic residues went of f scale and as fur ther sensitivity was developed to measure residue load f rom implanted material , residues f rom oral t r ea tment went of f scale. A t rend toward increased eff ic iency and reduced residue load will cont inue , I am certain, if we cont inue to expand our knowledge on ruminal and intesti- nal metabol i sm, on metabol i sm in the body and mechanisms of excret ion. Fo r example , can en te rohepa t ic reci rcula t ion be turned on and off , and as a result, regulate chemical exposure and excre t ion , and will this al low a reduc t ion in effect ive dose rate?
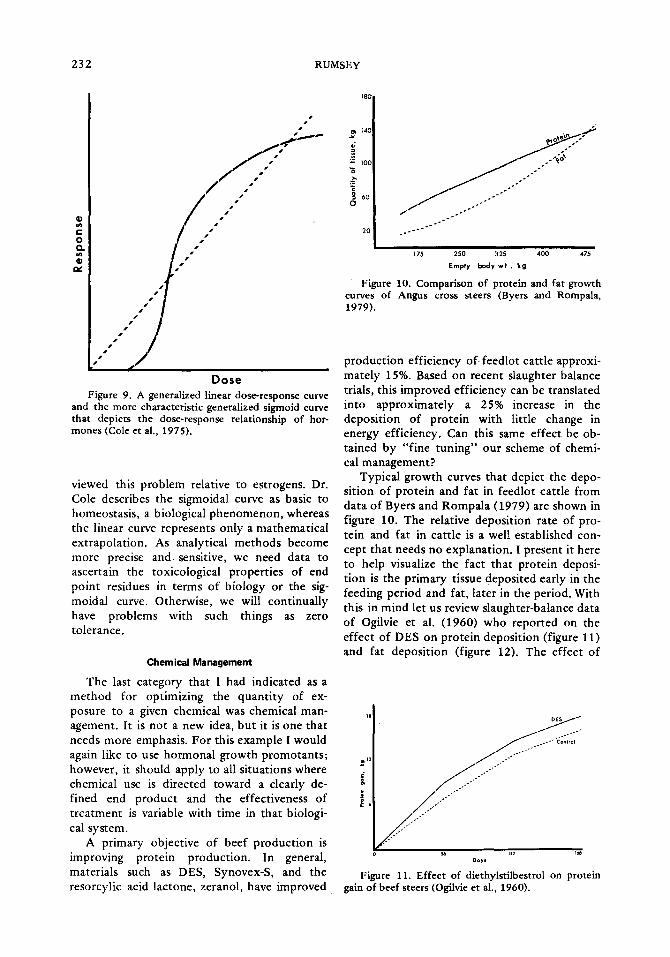
End Point Residues. Finally, in regard to the residue curve, a br ief c o m m e n t is needed about end po in t residues. Several c o m m e n t s have been made about this part of the residue curve rela- t ive to min imiz ing end po in t residues. This is one area, however , where I th ink we need to re- discover the wheel . It is at this po in t that chem- ists need to tell us what residues are present and toxicologis ts need to tell us what these residue levels mean. Shown in figure 9 is a general ized l inear dose-response curve and the more charac- terist ic general ized sigmoid curve depict ing the dose-response relat ionship of ho rmones taken f rom a review by Cole et al. (1975) who re-
TABLE 3. PLASMA ESTROGEN CONCENTRATION (17/3-ESTRADIOL + ESTRIOL + ESTRONE) IN STEERS IMPLANTED WITH SYNOVEX-S a
Treatment
Days Non- Trial on trial Statistic b implanted Implanted S~ c
1 113 Range 5.9-7.15 4.3--208.7 Avg u 21.3 34.8 5.9
60 Range 4.9--37.0 12.3--194.0 Avg e 16.1 38.6
106 Range 3.0--58.9 3.0--37.0 Avg 17.5 11.8
60 Range 3.0--53.5 3.0-323.9 Avg e 22.0 105.4
120 Range 3.0--88.3 3.0-- 110.0 Avg 15.6 22.3
3.8
10.7
aRumsey and Beaudry (1979).
bRange: lower limit of estimating concentration was considered to be 1.0 pg/ml.
ecommon standard error of mean from analysis of variance in which sampling time was inchJded in the analy- sis for trials 2 and 3.
dconcentration affected by Synovex-S at P<.05.
eAverage concentration for the 60-d implanted steers was greater than the average for the 60-d control steers or the 120-d averages at P<.01.
23 2 RUMSEY
~ / /..-'" i I �9
l l l l l j i IIIII /
Dose Figure 9. A generalized linear dose-response c u r v e
and the more characteristic generalized sigmoid curve that depicts the dose-response relationship of hor- mones (Cole et al., 1975).
viewed this problem relative to estrogens. Dr. Cole describes the sigmoidal curve as basic to homeostasis, a biological phenomenon, whereas the linear curve represents only a mathematical extrapolation. As analytical methods become more precise a n d sensitive, we need data to ascertain the toxicological propert ies of end point residues in terms of biology or the sig- moidal curve. Otherwise, we will continually have problems with such things as zero tolerance.
Chemical Management
The last category that I had indicated as a method for optimizing the quant i ty of ex- posure to a given chemical was chemical man- agement. It is not a new idea, but it is one that needs more emphasis. For this example I would again like to use hormonal growth promotants ; however, it should apply to all situations where chemical use is directed toward a clearly de- fined end product and the effectiveness of t reatment is variable with time in that biologi- cal system.
A primary objective of beef product ion is improving protein production. In general, materials such as DES, Synovex-S, and the resorcylic acid lactone, zeranol, have improved
18c
.~ 14C
e"
10C
._,-
a 60 O t i j .--"" """
. . ~ 1 7 6
175 950 325 400 475
Empty body w t , kg
Figure 10. Comparison of protein and fat growth curves of Angus cross steers (Byers and Rompala, 1979).
product ion efficiency of feedlot cattle approxi- mately 15%. Based on recent slaughter balance trials, this improved efficiency can be translated into approximately a 25% increase in the deposit ion of protein with little change in energy efficiency. Can this same effect be ob- tained by "fine tuning" our scheme of chemi- cal management?
Typical growth curves that depict the depo- sition of protein and fat in feedlot cattle from data of Byers and Rompala (1979) are shown in figure 10. The relative deposition rate of pro- tein and fat in cattle is a wel! established con- cept that needs no explanation. I present it here to help visualize the fact that protein deposi- t ion is the primary tissue deposited early in the feeding period and fat, later in the period. With this in mind let us review slaughter-balance data of Ogilvie et al. (1960) who reported on the effect of DES on protein deposit ion (figure 11) and fat deposit ion (figure 12). The effect of
.... ' ' " "
S6 "2 I~a Do~s
Figure 11. Effect of diethylstilbestrol on protein gain of beef steers (Ogilvie et al., 1960).

METABOLIC FATE OF XENOBIOTICS IN FOOD ANIMALS 233
60
2O
DES . -
Ooys
Figure 12. Effect of diethylstilbestrol (DES) on fat gain of beef steers (Ogilvie et al., 1960).
DES o n p ro t e in gain occu r red w i t h i n t he f irst 56 d o f the t r ia l and f r o m t h e n on p r o t e i n gain in b o t h con t ro l and DES steers was parallel . Fa t depos i t i on dur ing the f irst 56 d was depressed by DES, bu t t h e n exceeded t h a t o f con t ro l s f rom 56 to 168 d. These da ta d e m o n s t r a t e the posi t ive e f fec t of h o r m o n a l g r o w t h p r o m o - t a n t s on p ro t e in d e p o s i t i o n and c o n c u r r e n t l y suggest t h a t th is e f fec t t akes place p r imar i ly in the ear ly pa r t of the feed ing per iod . T he cur- r en t chemica l m a n a g e m e n t prac t ice is to ex- pose f eed lo t ca t t le to a g r o w t h p r o m o t a n t for t he en t i r e f eed lo t pe r iod to m a x i m i z e average daily gain or feed convers ion , However , as we descr ibe the bene f i t s of h o r m o n a l g r o w t h pro- t a n t s in t e rms o f p r o t e i n p r o d u c t i o n , the real bene f i t m a y occur ear ly in the feeding pe r iod and m a y allow for a chemica l m a n a g e m e n t change t h a t re ta ins t he p r o d u c t i o n bene f i t , b u t f u r t h e r m in imizes end p o i n t residues.
We need to pur sue th i s t y p e of research wi th cu r r en t h o r m o n a l g r o w t h p r o m o t a n t s as well as o t h e r chemicals . Fo r exam p l e the r ecen t CAST (1981) r e p o r t on A n t i b i o t i c s in A n i m a l Feeds s ta tes t h a t y o u n g e r swine, i r respect ive of dis- ease level, r e spond m o r e to an t ib io t i c s t h a n older , heavier swine. Thus , k n o w l e d g e a b o u t t he specific m o d e of ac t ion of an t ib io t i c s o t h e r t h a n disease c o n t r o l m a y help us ref ine t he use of these mater ia l s . F u r t h e r m o r e , I feel the example p u t f o r t h o f the specif ic ac t ion o f DES is basic to all of ou r agr icul tura l chemicals .
Literature Cited
Abu-El-Haj, S., M.A.H. Fahmy and T. R. Fukuto. 1979. Insecticide activity of 1,1,1-trichloro-
2,2-bis(p-chlorophenyl)ethane (DDT) analogues. J. Agr. Food Chem. 27:258.
Aschbacher, P. W., E. J. Thatcher and T. S. Rumsey. 1975. Metabolic fate of diethylstilbestrol im- planted in the ear of steers. J. Anim. Sci. 40: 530.
Baggot, J. D. 1977. Principles of Drug Disposition in Domestic Animals: The Basis of Veterinary Clini- cal Pharmacology. W. B. Saunders Co., Philadel- phia, PA.
Bovard, K. P., J. P, Fontenot and B. M. Priode. 1971. Accumulation and dissipation of heptachlor resi- dues in fattening steers. J. Anim. Sci. 33:127.
Bmggemann, J., J. Schole and J. Tiews. 1963. Are ani- mal feed additives hazardous to human health? J. Agr. Food Chem. 11:367.
Byers, F. M. and R. E. Rompala. 1979. Rate of pro- tein deposition in beef cattle as a function of mature size and weight and rate of empty body growth. Ohio Beef Cattle Res. Prog. Rep. No. 79- 1, Ohio Agr. Res. and Develop. Center, Wooster.
CAST. 1981. Antibiotics in Animal Feeds. Council for Agr. Sci. Technol. Rep. No. 88. 250 Memorial Union, Ames, IA.
Childers, A. B., C. A. Carlson and W. A. Landmann. 1972. DDT residue depletion in sheep using die- tary energy restriction and administration of glu- cagon. J. Agr. Food Chem. 20:878.
Coats, J. R., R. L. Metcalf, I. P. Kapoor, Li-Chun Chio and P. A. Boyle. 1979. Physical-chemical and biological degradation studies on DDT analogues with altered aliphatic moieties. J. Agr. Food Chem. 27:1016.
Cole, H. H., G. H. Gass, R. J. Gerrits, H. D. Hafs, W. H. Hale, R. L. Preston and L. C. Ulberg. 1975. On the safety of estrogenic hormone residues in edible animal products. Bioscience 25:19.
Fahmy, M.A.H., T. R. Fukuto, R. L. Metcalf and R. L. Holmstead. 1973. Structure-activity correlations in DDT analogues. J. Agr. Food Chem. 21:584.
Hale, W. H., W. C. Sherman, E. A. White, G. Kuhn, R. B. Schnell, W. M. Reynolds and H. G. Luther. 1959. Absorption of diethylstilbestrol pellets in steers. J. Anim. Sci. 18:1201.
McCandlish, A. C. 1917. The influence of drugs on milk and butterfat production. Amer. Soc. of Anim. Prod. Proc. of Annu. Meet. for December 1917, 1918 and 1919. p 1-6 .
Menn, J. H. 1980. Contemporary frontiers in chemi- cal pesticide research. J. Agr. Food Chem. 28:2.
Mirocha, C. J., C. M. Christienson, G. Davis and G. H. Nelson. 1973. Detection of diethylstilbestrol con- tamination in swine feedstuff. J. Agr. Feed Chem. 21:135.
Ogilvie, M. L., E. C. Faltin, E. R. Hauser, R. W..Bray and W. G. Hoekstra. 1960. Effects of stilbestrol in altering carcass composition and feed lot per- formance of beef steers. J. Anita. Sci. 19:991.
Rumsey, T. S. and N. Beaudry. 1979. Plasma estro- gen concentrations in non-implanted and Syno- vex-S implanted feedlot steers. Bull. Environ. Contam. Toxicol. 23:405.
Rumsey, T. S. and J. Bond. 1974. Effect of urea, di- ethylstilbestrol, and type of diet on the distribu- tion of aldrin and dieldrin residues in finished beef heifers. J. Agr. Food Chem. 22:664.
Rumsey, T. S., K. P. Bovard, J. P. Fontenot, R. R.
2 3 4 RUMSEY
Oltjen and B. M. Priode. 1977a. Supplementa- t ion of apple pomace with nonprote in nitrogen for gestating beef cows. IV. Pesticide accumula- t ion in cows. J. Anita. Sci. 46:543.
Rumsey , T. S., R. W. Miller and D. A. Dinius. 1977b. Residue content of beef feedlot manure after feeding diethylstilbestrol, chlortetracycline, and ronnel and the use of st irofus to reduce popula- t ion of fly larvae in feedlot manure. Arch. En- viron. Toxicol. 6:203.
Rumsey , T. S., R. R. Oltjen, F. L. Daniels and A. S. Kozak. 1975a. Deplet ion pat terns of radio- activity and tissue residues in beef cattle after the withdrawal of oral 14C-diethylstilbestrol. J. Anim. Sci. 40:539.
Rumsey, T. S., R. R. Oltjen and A. S. Kozak. 1974a. Implant absorption, performance and tissue analysis for beef steers implanted with diethyl- stilbestrol and fed an all-concentrate diet. J. Anim. Sci. 39:1193.
Rumsey , T. S., R. R. Oltjen, A. S. Kozak, F. L. Dan- iels and P. W. Aschbacher. 1975b. Fate of radio- carbon in beef steers implanted with 14C-diethyl- stilbestrol. J. Anim. Sci. 40:550.
Rumsey, T. S., P. A. Pu tnam, R. E. Davis and C. Cor- ley. 1967. Distr ibution of p,p-DDT residues in adipose and muscle tissues of beef cattle. J. Agr. Food Chem. 15:898.
R u m m y , T. S., G. Samuelson, J. Bond and F. L. Dan- iels. 1974b. Teratogenici ty to 35-day fetuses, excret ion pat terns and placental t ransfer in beef heifers administered 4-tert-butyl-2-chlorophenyl methyl methyl -phesphoramida te (Ruelene| J. Anita. Sci. 37:1974.
Rumsey , T. S.~ G. Samuelson, K. P. Bovard and B. M. Prloae. 1973. Placental transfer of DDT in beef
cattle. J. Anim. Sci. 37:1186. Rumsey, T. S., E. E. Williams and A. D. Evans. 1975c.
Tissue residues, performance and ruminal and blood characteristics of steers fed ronnel and activated carbon. J. Anim. Sci. 40:743.
Smalley, H. E., H. R. Crookshank and R. D. Kadeleff. 1971. Use of activated charcoal in preventing residues of ronnel in sheep. J. Agr. Food Chem. 19:331.
Subba-Rao, R. V. and M. Alexander. 1977. Effect of chemical structure on the biodegradability of 1,1,1-trichloro-2,2-bis (p-chlorophenyl) ethane (DDT). J. Agr. Food Chem. 25:327.
T idemann , L. J. and D. J. Schingoethe. 1974. The use o f activated charcoal to remove or inactive mouse growth inhibitors present in soybean whey. J. Agr. Food Chem. 22:1059.
Turner , H. A., R. L. Phillips, M. Vavra and D. C. Young. 1981. The efficacy of an estradiol-sili- cone rubber removable implant in suckling, growing, and finishing steers. J. Anim. Sci. 52: 939.
USDA. 1950. Agricultural Statistics. US Government Printing Office, Washington, DC.
USDA. 1965. Agricultural Statistics. US Government Printing Office, Washington, DC.
USDA. 1980. Agricultural Statistics. US Government Printing Office, Washington, DC.
Wilson, K. A. and R. M. Cook. 1970. Metabolism of xenobiot ics in ruminants . Use of activated car- bon as an antidote for pesticide poisoning in ruminants . J. Agr. Food Chem. 18:437.
Wilson, K. A. and R. M. Cook. 1972. Metabolism of xenobiot ics in ruminants . Storage and excretion of HEOD in Holstein cows. J. Agr. Food Chem. 20:391.