experimental assessment of r134a and its lower gwp
TRANSCRIPT

Journal of Engineering
journal homepage: www.joe.uobaghdad.edu.iq
Number 12 Volume 25 December 2019
*Corresponding author
Peer review under the responsibility of University of Baghdad.
https://doi.org/10.31026/j.eng.2019.12.1
2520-3339 © 2019 University of Baghdad. Production and hosting by Journal of Engineering.
This is an open access article under the CC BY4 http://creativecommons.org/licenses/by /4.0/).
Article received: 27/11/2018
Article accepted: 17/1/2019
Article published: 1/12/2019
1
Mechanical and Energy Engineering
Experimental Assessment of R134a and Its Lower GWP Alternative R1234yf
in an Automobile Air Conditioning System
Rafah Hussein Zaidan Dr. Issam Mohammed Ali*
College of Engineering- University of Baghdad College of Engineering- University of Baghdad
email: [email protected] email: [email protected]
ABSTRACT
Reducing global warming potential (GWP) of refrigerants is needed to the decrease of ozone-
depleting of refrigeration systems leakages. Refrigerant R1234yf is now used to substitute R134a
inside mobile air conditioning systems. Thermodynamic properties of R1234yf are similar to
R134a. Also, it has a very low GWP of 4, compared to 1430 for R134a, making it a proper
choice for future automobile refrigerants. The purpose of this research is to represent the main
operating and performance differences between R1234yf and R134a. Experimental analysis was
carried out on the automotive air conditioning system (AACS) with 3 kW nominal capacity, to
test and compare the performance of R134a with R1234yf. Experiments were accomplished for
both refrigerants in almost the same working conditions and procedure with a range of ambient
temperature varied from 26oC to 50oC. Parameters studied were ambient temperature, type of
refrigerant in the system at compressor speed 1450 rpm, and internal thermal loads of passenger
room. The performance characteristics of the system, including COP and cooling capacity, were
studied by changing different parameters. The results show that COP of R134a is higher than
R1234yf by 12.6%, while the refrigeration effect of R134a is higher than R1234yf by 25%. This
shows that R1234yf is a suitable and good candidate for drop-in replacement of R134a in AACS.
Keywords: automotive air conditioning, Global Warming Potential, R134a, R1234yf, energy
analysis.
سيارةفي نظام تكييف هواء R1234yfالبديل منخفض الاحترار العالمي مع R134a التقييم التجريبي لـ
*د. عصام محمد علي رفاه حسين زيدان
جامعة بغداد –الهندسة كلية جامعة بغداد –الهندسة كلية
الخلاصة
يستخدم .التثليج أنظمة في الأوزون طبقة استنفاد لتقليل ضروري التثليج لموائع( GWP) العالمي الاحترار إمكانات من الحد
R1234yf مائع التثليج الخصائص الحرارية ان المتنقلة. والتثليج داخل أنظمة تكييف الهواء R134a كبديل عنحاليا
، 4 يقارب معامل احتباس حراري قليل هذه الموائع الجديدة تملك، كذلك. R134aتشبه R1234yf مائع التثايجالديناميكية لـ

Journal of Engineering Volume 25 December 2019 Number 12
2
سيارات في لل التثليجمائع وبديل ملائم ليار مناسب تخاعتباره ا يؤدي الى، مما 1430 والذي يعادل R134a قيمته لـ مقارنة مع
. R134aو R1234yfداء بين الأكذلك معامل الغرض من هذا البحث هو تمثيل الاختلافات التشغيلية الرئيسية وأن المستقبل.
. R1234yf مع R134aلتقييم ومقارنة أداء كيلو واط ، 3 بسعة تبريدسيارات النظام تكييف هواء لتجريبي التحليل التم إجراء
درجة مئوية إلى 26درجات الحرارة المحيطة من تغييرفي نفس ظروف العمل تقريبا مع الممائعين لكلاالتجارب اجريتوقد
الداخلي لغرفة والحمل الحراريدورة في الدقيقة ، 1450عند سرعة الضاغط درجة حرارة المحيط تم تغييردرجة مئوية. 50
تغيير وقدرة التبريد ، من خلال COP. تمت دراسة خصائص الأداء للنظام ، بما في ذلك واط 1300تم تثبيته عند الركاب
، في حين أن ٪ 12.6بنسبة R1234yfأعلى من R134a لـ معامل الاداء. أظهرت النتائج أن اعلاه المختلفة المتغيرات
هو مرشح مناسب وجيد لاستبدال R1234yf. هذا يدل على أن ٪ 25بنسبة R1234yfأعلى من R134a لـ يتأثير التبريدال
R134a نظام تكييف السياراتفي.
تحليل ، ،R1234yfمائع التثليج ، R134aمائع التثليج ، GWPالاحترار العالميتكييف هواء السيارات ، الرئيسية:الكلمات
الطاقة.
1. INTRODUCTION
Refrigeration and the components that work on this principle have indeed made the human life
easier, the cooling system in the vehicle is designed to keep cold, comfortable, and safe when the
temperature outside is high. Most automobile air conditioning systems in Iraq operate with
R134a refrigerant. Research has revealed that this refrigerant is harmful to the environment.
Today, there are many refrigerants alternatives of R134a, but the question which is of utmost
importance is and which refrigerant works the best. So, the current vehicle air conditioning
system refrigerant (R134a), which is used in all motor vehicles since the early nineties, will be
phased out in the coming years. Fig. 1 shows the refrigerant improvement.
Figure 1. Refrigerant Improvement.
Many researchers investigated experimentally and numerically the performance of R1234yf as a
replacement for R134a in the automotive air conditioning system. Zilio et al., 2011 analysed
experimentally and numerically the performance of R1234yf as a replacement for R134a in the
automobile air conditioning system. The system consists of four main components compressor,

Journal of Engineering Volume 25 December 2019 Number 12
3
condenser, thermal expansion valve (TXV), and the evaporator. It has a cooling capacity of 5.8
kW and volumetric flow rate of compressor 7.8 m3/h and applied some modification on the
system. The experimental results showed that the coefficient of performance (COP) and cooling
capacity for the R134a system was higher than R1234yf. While the numerical simulation showed
that they enhance the front area for the condenser and the evaporator moreover the COP for
R1234yf was more than of R134a at same cooling capacities. Lee and Jung, 2012 used
experimentally R1234yf as an alternative for R134a in the heat pump bench (HPB) in winter and
summer weather environments. The tested calculations showed that it is possible to use R1234yf
as the alternative of R134a due to very low global warming potential (GWP) and zero ozone
depletion (ODP), as well the coefficient of performance (COP) for R134a was 0.8 - 2.7% higher
than R1234yf. While the capacity of R134a was about 4% higher than of R1234yf. As for charge
of R134a, it was 10-11% greater than that of R1234yf. The temperature of compressor discharge
for R134a was 6.4 °C - 6.7 °C higher than that of R134a. Cho et al. 2013 studied experimentally
the performance of automotive air conditioning (AAC) evaluated by charging the R1234yf and
R134a. Then they installed an internal heat exchanger (IHX) to improve system performance.
R1234yf showed lower cooling capacity by 7% and the power consumption up to 4%. When
comparing the performance between two refrigerants, it revealed that the cooling capacity
decreased about 7% while COP lowered by 4.5% at the R1234yf system without the IHX, but
when IHX was used, those reduced by up to 2.9% and 1.8%, sequentially. Ansari et al. 2013
used a mathematical computational model to calculate a coefficient of performance (COP),
exergy efficiency, exergy destruction and efficiency in the vapor compression refrigerant system
operated on the working fluid R1234yf and R1234ze as a replacement of R134a was developed.
They found that the exergy efficiency and COP for R1234ze and R134a were the same; it
decreased by 5% when increasing the evaporator temperature, while with R1234yf it was
increased by 5%- 14.5% respectively. The exergy destruction occurred in the condenser,
compressor, expansion valve and evaporator, respectively. Molés et al., 2014 studied a single
stage vapour compression system evaluated theoretically by using R1234ze (E) and R1234yf.
They observed that the COP increased from 11% to 20% of R1234ze and incremented of 9% to
15% for R1234yf compared with the R134a. Using an IHX in a cycle led to COP of HFO1234yf
of 4% to 8% smaller than R134a and thermal power evaporator (Qe) about 4% to 7% lower. With
R1234ze the Qe was about 25% to 27% lower but COP equal the R134a. Finally, the value of
IHX effectiveness was above 45%. Sethi et al. 2016 studied experimentally the performance of
the GWP as R1234ze(E) and HFO1234yf as alternative for HFC134a evaluated in the vending
machine. The theoretical comparison showed that the pressure for R1234yf was approximately
similar to R134a while the pressure of R1234ze (E) was lower than R134a; that affected on the
decreased capacity about 25%. While the experiments indicated that the performance of R1234yf
and R134a was equal. R1234ze (E) had a lower cooling capacity about 25%. Shi et al., 2016
studied the performance of R1234yf system experimentally, and the improvement of the system
through the thermal expansion valve (TEV). The results indicated that the performance of
R1234yf system improved significantly by adjusting the setting of the TEV. The TEV charged
with R134a the system showed the optimal system. Therefore, when comparing with the original
TEV, for the R1234yf system the COP increased by 8% and cooling capacity increased by
11.3%. Direk et al. 2017a studied experimentally the performance of R1234yf as a replacement
to R134a in the AACS studied. The results indicated that the COP and cooling capacity for
R1234yf was 7.5 % to 16.5 % and 13.9 % to 20.4 lower than that of R134a, sequentially. As well
as determine the effect of internal heat exchanger (IHX) on the experimental system with
HFO1234yf. Also, they found that the cooling capacity of R1234yf was increased by 6.3 % to
8.6 % and 6.4 % to 9.9 % when raising the temperature of airstream about (27 °C and 35 °C)
Journal of Engineering Volume 25 December 2019 Number 12
4
sequentially. Moreover, the COP of the system was raised by 2.8 % to 7.4 % and 2.4 % to 4.8 %
when raising the temperature of airstream about (27oC and 35oC) sequentially. Vaghela, 2017
studied theoretically the alternative refrigerants substitute for R134a evaluated in the automotive
air conditioning system (AACS), as R1234yf, R404A, R152a, R407C, R600a, R290, R410A and
compared it with the R134a. Using the software REFPROP and engineering equation solver
(EES) acquired the thermodynamic properties. The results indicated that R600a and R290
couldn't be the replacement of R134a in the AACS because of high flammability. The saturation
pressure for R410A, R407C and R404A was very large subsequently it couldn't be used in AAC
system. Finally, R1234yf had the COP 6.3% smaller than R134a, so it was a suitable alternative
refrigerant as a drop-in replacement of R134a in AAC system due to very small GWP.
Wherefore, could be replaced in the AACS with the smallest modification. Sethi and Hrnjak,
2014 studied and compared the oil retention and pressure drop characteristics of refrigerants
R1234yf and R134a with POE32 oil. They used high-speed videos to identify the flow regimes
as the mass flux varied. Results showed that R1234yf have the same cooling capacity with
R134a, as well as very similar oil retention. In the present research, the energy analyses for an
AACS originally working with R134a was experimentally carried out at the ambient temperature
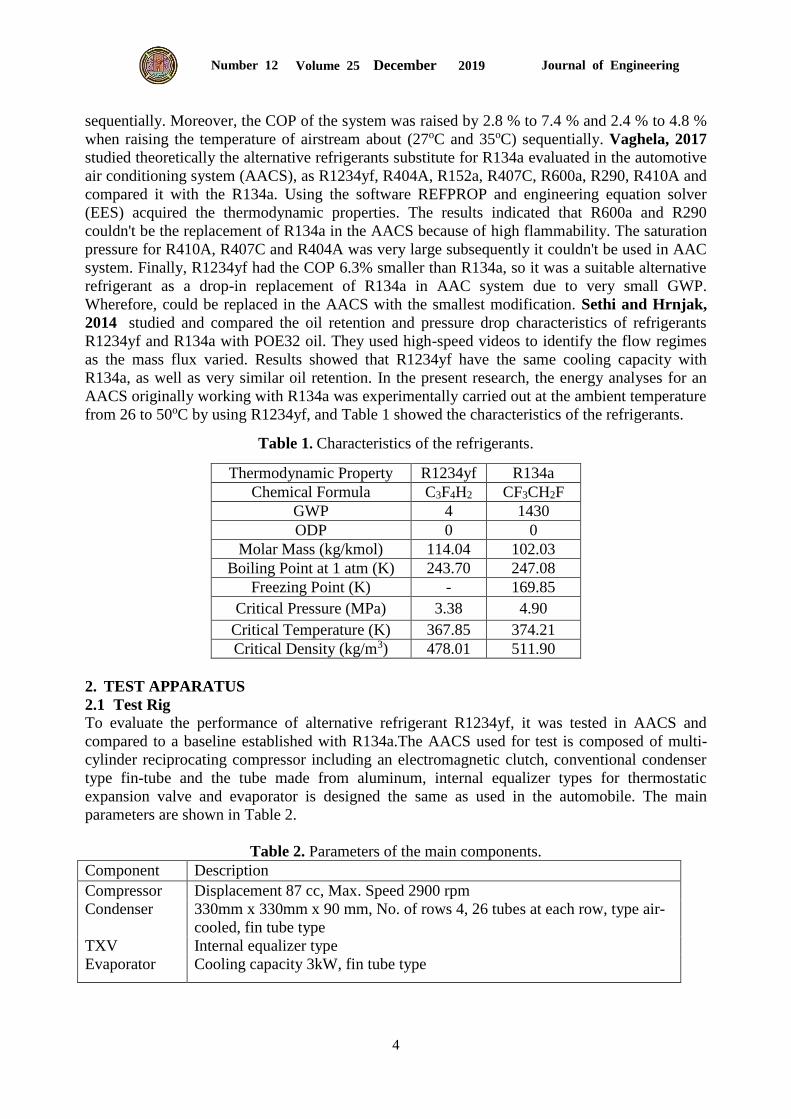
from 26 to 50oC by using R1234yf, and Table 1 showed the characteristics of the refrigerants.
Table 1. Characteristics of the refrigerants.
Thermodynamic Property R1234yf R134a
Chemical Formula C3F4H2 CF3CH2F
GWP 4 1430
ODP 0 0
Molar Mass (kg/kmol) 114.04 102.03
Boiling Point at 1 atm (K) 243.70 247.08
Freezing Point (K) - 169.85
Critical Pressure (MPa) 3.38 4.90
Critical Temperature (K) 367.85 374.21
Critical Density (kg/m3) 478.01 511.90
2. TEST APPARATUS
2.1 Test Rig
To evaluate the performance of alternative refrigerant R1234yf, it was tested in AACS and
compared to a baseline established with R134a.The AACS used for test is composed of multi-
cylinder reciprocating compressor including an electromagnetic clutch, conventional condenser
type fin-tube and the tube made from aluminum, internal equalizer types for thermostatic
expansion valve and evaporator is designed the same as used in the automobile. The main
parameters are shown in Table 2.
Table 2. Parameters of the main components.
Component Description
Compressor Displacement 87 cc, Max. Speed 2900 rpm
Condenser 330mm x 330mm x 90 mm, No. of rows 4, 26 tubes at each row, type air-
cooled, fin tube type
TXV Internal equalizer type
Evaporator Cooling capacity 3kW, fin tube type
Journal of Engineering Volume 25 December 2019 Number 12
5
The experiment tests were carried out to specify the performance of the AACS for different
conditions. Therefore, the test procedure is described by the following steps and the condition of
operating as shown in Table 3 :
1. Charging the system in the refrigerant.
2. The ambient temperature varied from 26 to 50 oC by 4 increments.
3. The compressor rotational speed was 1450 rpm.
4. The thermal load inside the passengers' compartment was set on 1300 W.
5. Data from all thermocouples were recorded every 15 minutes.
6. The steps from (1) to (5) were repeated for a new refrigerant.
Table 3. Condition of operating
Description Range
Ambient Temperature 26 to 50oC
Compressor Speed 1450 rpm
Thermal Load 1300 Watt
Refrigerant R134a – R1234yf
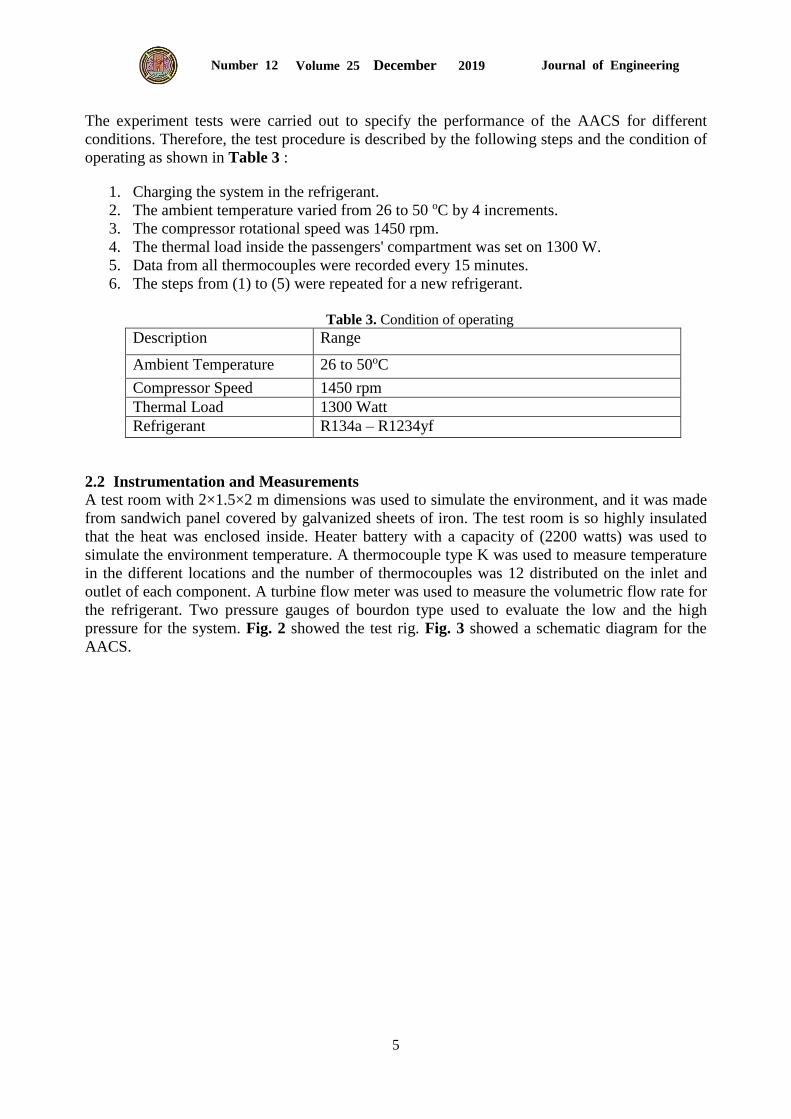
2.2 Instrumentation and Measurements
A test room with 2×1.5×2 m dimensions was used to simulate the environment, and it was made
from sandwich panel covered by galvanized sheets of iron. The test room is so highly insulated
that the heat was enclosed inside. Heater battery with a capacity of (2200 watts) was used to
simulate the environment temperature. A thermocouple type K was used to measure temperature
in the different locations and the number of thermocouples was 12 distributed on the inlet and
outlet of each component. A turbine flow meter was used to measure the volumetric flow rate for
the refrigerant. Two pressure gauges of bourdon type used to evaluate the low and the high
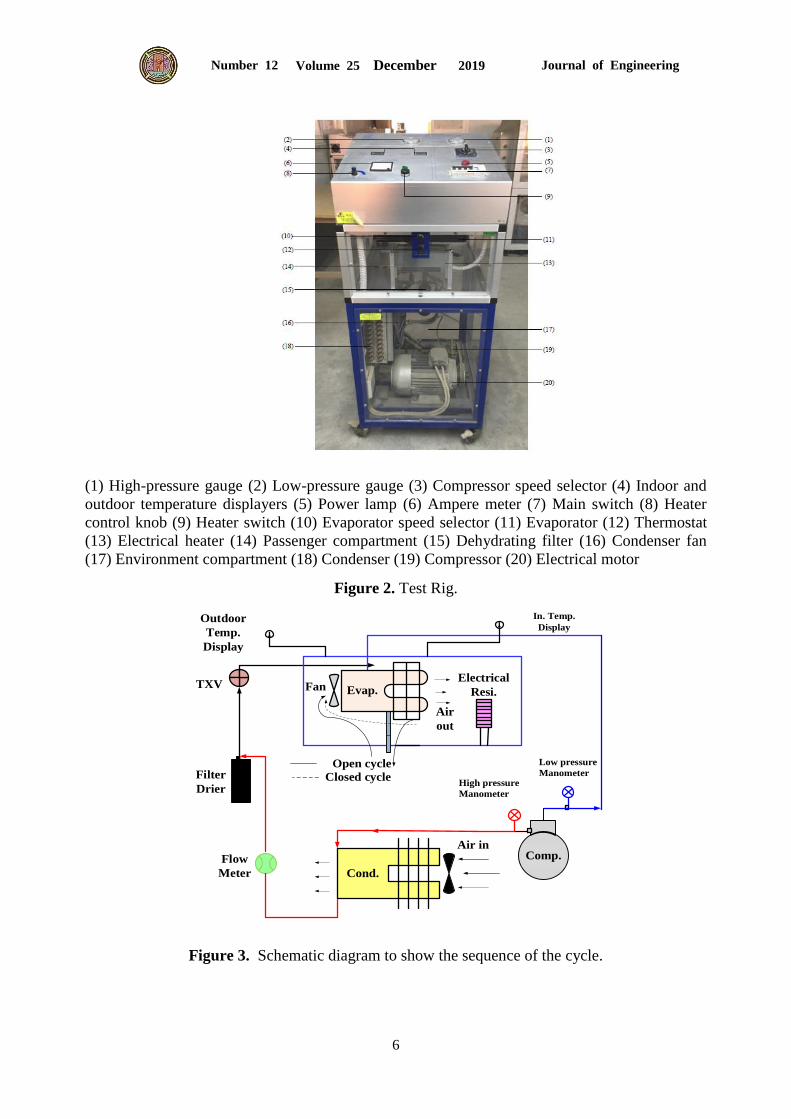
pressure for the system. Fig. 2 showed the test rig. Fig. 3 showed a schematic diagram for the
AACS.
Journal of Engineering Volume 25 December 2019 Number 12
6
(1) High-pressure gauge (2) Low-pressure gauge (3) Compressor speed selector (4) Indoor and
outdoor temperature displayers (5) Power lamp (6) Ampere meter (7) Main switch (8) Heater
control knob (9) Heater switch (10) Evaporator speed selector (11) Evaporator (12) Thermostat
(13) Electrical heater (14) Passenger compartment (15) Dehydrating filter (16) Condenser fan
(17) Environment compartment (18) Condenser (19) Compressor (20) Electrical motor
Figure 2. Test Rig.
5
Closed cycle
Open cycle
In. Temp.
Display Outdoor
Temp.
Display
Evap.Electrical
Resi. TXV
Filter
Drier
Cond.
Air in
Low pressure
ManometerHigh pressure
Manometer
Flow
Meter
Comp.
Fan
Air
out
Figure 3. Schematic diagram to show the sequence of the cycle.
Journal of Engineering Volume 25 December 2019 Number 12
7
2.3 Experimental Data
To determine the performance parameters such as COP, cooling capacity, heat rejection, pressure
ratio, and compressor work, it is required to find the thermodynamic properties of the refrigerant
at selected points on the cycle. The experimental results are calculated based on the refrigerant
enthalpy at the inlet and outlet of each component. Enthalpy values are calculated using the
average measured temperature and pressure of the refrigerant at each state point. Properties of
refrigerants are extracted from the engineering equation solver (EES) software. The volume flow
rate of refrigerant is measured directly by a turbine flowmeter.
3. ASSUMPTIONS
1. Steady-state
2. The fan work is so small that can be neglected.
3. Changes in potential and kinetic energies are neglected.
4. Adiabatic process in expansion valve and compressor.
5. No heat loss over the rubber tubes.
6. The pressure drop across the discharge valve is isenthalpic process.
7. The oil effects on the refrigerant properties are neglected.
4. ENERGY ANALYSIS
A mathematical model was developed in this study to predict the performance for AACS
charged with R134a and its alternative refrigerants R1234yf and compare between them.
Depending on the conservation of energy equation or the first law of thermodynamics for steady-
state flow given by Çengel and Boles, 2005 needs only input and output states to begin analytic
calculations.
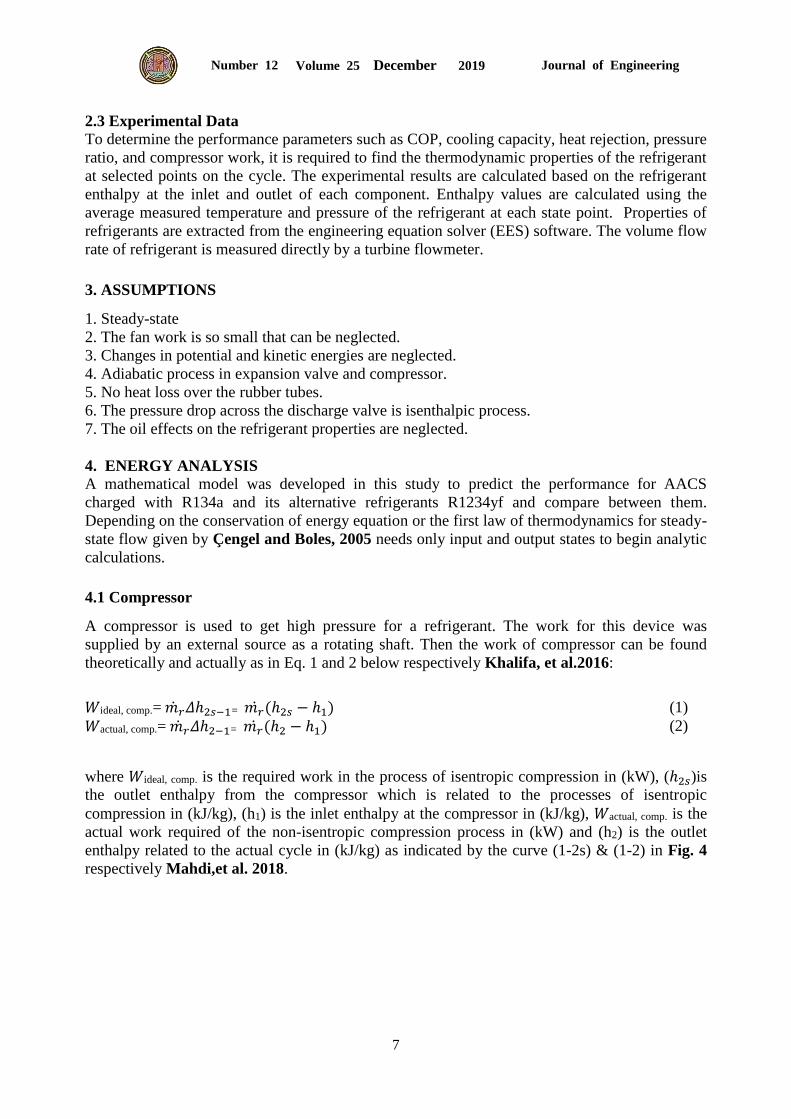
4.1 Compressor
A compressor is used to get high pressure for a refrigerant. The work for this device was
supplied by an external source as a rotating shaft. Then the work of compressor can be found
theoretically and actually as in Eq. 1 and 2 below respectively Khalifa, et al.2016:
where 𝑊ideal, comp. is the required work in the process of isentropic compression in (kW), (ℎ2𝑠)is
the outlet enthalpy from the compressor which is related to the processes of isentropic
compression in (kJ/kg), (h1) is the inlet enthalpy at the compressor in (kJ/kg), 𝑊actual, comp. is the
actual work required of the non-isentropic compression process in (kW) and (h2) is the outlet
enthalpy related to the actual cycle in (kJ/kg) as indicated by the curve (1-2s) & (1-2) in Fig. 4
respectively Mahdi,et al. 2018.
𝑊ideal, comp.= 𝑚𝑟 𝛥ℎ2𝑠−1= 𝑚𝑟 (ℎ2𝑠 − ℎ1) (1)
𝑊actual, comp.= 𝑚𝑟 𝛥ℎ2−1= 𝑚𝑟 (ℎ2 − ℎ1) (2)

Journal of Engineering Volume 25 December 2019 Number 12
8
Figure 4. Vapour Compression Refrigerant Cycle.
To find the compression ratio for a compressor which is defined as the ratio of discharge
pressure to suction pressure at saturated conditions, expressed in Pa or kPa as in Eq. 4, Dincer
and Kanoglu, 2010.
where CR is a compression ratio, Pd and Ps the pressure at discharge and suction line
respectively.
4.2 Condenser
The condenser, as any heat exchanger does not require any work to operate. Therefore, Eq. 4 will
be:
Thus, to find the heat rejected by the condenser, Eq. 5 is applied.
where 𝑄cond. represents the heat rejected in (kW) and (h3) is the outlet enthalpy at the condenser
in (kJ/kg). It is indicated by the curve (2-3) in Fig. 4.
4.3 Thermostatic Expansion Valve
The purpose of the expansion valve is to control the flow of refrigerant from the high pressure at
condenser of the cycle to the low pressure at the evaporator by throttling process as shown the
vertical line (3-4) in Fig.4. So, the energy equation shows that the enthalpy is constant across the
expansion valve as Eq. 6.
where h4 is the enthalpy at the evaporator inlet in (kJ/kg).
CR =𝑃𝑑
𝑃𝑠 (3)
𝑄 =𝑚𝑟 𝛥ℎ (4)
𝑄cond. =𝑚𝑟 (ℎ2 -ℎ3) (5)
ℎ3 = ℎ4 (6)

Journal of Engineering Volume 25 December 2019 Number 12
9
4.4 Evaporator
The purpose of the evaporator is to get low-pressure and low-temperature refrigerant from the
expansion valve. Then analysis of the evaporator is almost the same as that of the condenser. The
refrigeration effect or the heat absorption process inducted via the straight line (4-1) in Fig. 4.
So, Eq. 7 will be:
where 𝑄evap. represents the heat absorbed in (kW) and (h4) is the outlet enthalpy at the evaporator
in (kJ/kg). To find RE, which is the refrigerant effect in (kJ/kg), Eq. 8n was used.
4.5 Coefficient of Performance
The seasonal coefficient of performance COP considers the influence of changing outside
temperatures on the performance of the cycle. Therefore, for a complete cycle COP which
signifies the ratio of the absorbed heat to the work of the compressor is given by Eq. 9:
where Wactual,comp. is representing the work per unit mass of refrigerant in (kJ/kg) and RE
represents the refrigerant effect in (kJ/kg).
To compare the performance for the actual cycle with the ideal cycle, the Carnot cycle was used
and the COP of it was calculated as shown by Eq. 10, which is considered a first way for
comparing:
where Tcond., and Tevap. are the saturated temperatures at condensing pressure and evaporating
pressure respectively in K.
5. RESULTS AND DISCUSSION
Fig. (6) indicates the effect of ambient temperature on the COP. This phenomenon is clarified by
analysing the effect of ambient temperature on the condensing temperature and pressure. As the
ambient temperature increased, the saturation pressure in the condenser also increased.
Consequently, the discharge pressure in the compressor increased. As a result, the compressor
needed more power, resulting in a decrease in COP. Results showed that the COP of R134a
becomes 24% higher than of R1234yf.
Fig. (7) shows the variation of compression ratio with different values of ambient temperature.
It’s clear that when the ambient temperature increased, the compressor work increased, it means
that the discharge pressure in the compressor increased which leads to an increase in the
compression ratio. So, it’s found that compression ratio of R1234yf becomes 3.3% lower than of
R134a.
𝑄evap.= 𝑚𝑟 (ℎ1-h4) (7)
RE.= ℎ1-h4 (8)
COP actual=𝑄𝑒𝑣𝑎𝑝.
𝑊𝑎𝑐𝑡𝑢𝑎𝑙,𝑐𝑜𝑚𝑝. =
RE
𝑤𝑎𝑐𝑡𝑢𝑎𝑙,𝑐𝑜𝑚𝑝.=
ℎ1−ℎ4
ℎ2−ℎ1 (9)
COPCarnot =𝑇𝑒𝑣𝑎𝑝.
𝑇𝑐𝑜𝑛𝑑−𝑇𝑒𝑣𝑎𝑝. (10)

Journal of Engineering Volume 25 December 2019 Number 12
10
Figure 6. The effect of ambient temperature
on the COP.
Figure 7. The effect of ambient temperature
on the compression ratio.
Fig. (8) represents the effect of condenser inlet air temperature on compressor work at constant
compressor speed and thermal load inside passenger room (1450 rpm and Th load 1300W).
Results showed that when Taic increased, the discharge pressure increased resulting in an
increase in the compressor work. Therefore, When Taic is 26 °C, the work of R1234yf becomes
23.4% lower than of R134a.
While Fig. (9) shows the effect of ambient temperature on heat rejection for both refrigerants.
The rate of heat rejected from condenser decreased when increasing the ambient temperature
because the compressor discharge temperature is increased. So, when Taic is 26 °C, it’s found
that the heat rejection of R134a becomes 32% higher than of R1234yf, while when Taic is 50 °C
the heat rejection for R134a becomes 26% higher than R1234yf.
Figure 8. The effect of ambient temperature
on the Work.
Figure 9. The effect of ambient temperature
on heat rejection.
Journal of Engineering Volume 25 December 2019 Number 12
11
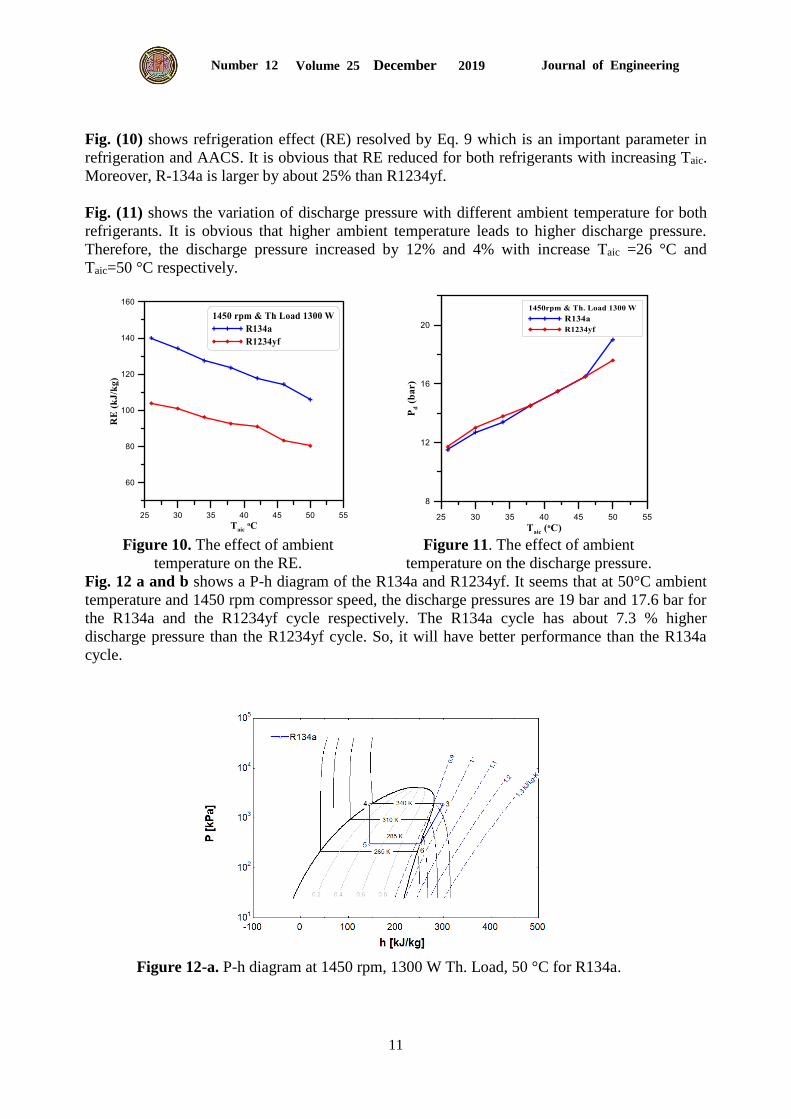
Fig. (10) shows refrigeration effect (RE) resolved by Eq. 9 which is an important parameter in
refrigeration and AACS. It is obvious that RE reduced for both refrigerants with increasing Taic.
Moreover, R-134a is larger by about 25% than R1234yf.
Fig. (11) shows the variation of discharge pressure with different ambient temperature for both
refrigerants. It is obvious that higher ambient temperature leads to higher discharge pressure.
Therefore, the discharge pressure increased by 12% and 4% with increase Taic =26 °C and
Taic=50 °C respectively.
Figure 10. The effect of ambient
temperature on the RE.
Figure 11. The effect of ambient
temperature on the discharge pressure.
Fig. 12 a and b shows a P-h diagram of the R134a and R1234yf. It seems that at 50°C ambient
temperature and 1450 rpm compressor speed, the discharge pressures are 19 bar and 17.6 bar for
the R134a and the R1234yf cycle respectively. The R134a cycle has about 7.3 % higher
discharge pressure than the R1234yf cycle. So, it will have better performance than the R134a
cycle.
Figure 12-a. P-h diagram at 1450 rpm, 1300 W Th. Load, 50 °C for R134a.

Journal of Engineering Volume 25 December 2019 Number 12
12
Figure 12-b. P-h diagram at 1450 rpm, 1300 W Th. Load, 50 °C for R1234yf.
Figure 12. P-h diagram of the R134a and R1234yf.
6. CONCLUSIONS
The results of this study showed that the COP values are close to each other for R1234yf and
R134a refrigerants. Consequently, R1234yf, which yields a reduced COP, can be used for
refrigerating systems operating with R134a without any modification. The condenser heat rejects
with R134a greater than R1234yf by about 28.1%. Regarding the refrigerant effect, it was found
that it decreased with increasing the ambient temperature. It was found that R134a was greater
than R1234yf by 24.3 %. But it can be recommended that choosing a compressor with greater
capacity should compensate the decrease of COP. It is important also to note that pressure
discharge values for both refrigerants were nearly the same. This points out that R1234yf is a
suitable refrigerant as an alternative for R134a and it can be securely used in the systems
operating with R134a.
7. REFRENCE
Ankit Sethi, Elizabet Vera Becerra, S. Y. M., 2016, ‘Low GWP R134a replacements for
small refrigeration (plug-in) applications’, International Journal of Refrigeration, Vol.
66, pp. 64–72.
Ansari, N. A., Yadav, B., and Kumar, J., 2013, ‘Theoretical Exergy Analysis of HFO-
1234yf and HFO-1234ze as an Alternative Replacement of HFC-134a in Simple Vapour
Compression Refrigeration System’, International Journal of Scientific & Engineering
Research, Vol. 4, pp. 137–144.
Çengel, Y. A. and Boles, M. A., 2005, ‘Thermodynamics An Engineering Approach’. 5th
ed.
Cho, H., Lee, H. and Park, C., 2013, ‘Performance characteristics of an automobile air
conditioning system with internal heat exchanger using refrigerant R1234yf’, Applied
Thermal Engineering. Elsevier Ltd, Vol. 61,No. 2, pp. 563–569.

Journal of Engineering Volume 25 December 2019 Number 12
13
Dincer, I. and Kanoglu, M., 2010, Refrigeration systems and applications. 2nd ed.
Direk, M., Kelesoglu, A. and Akin, A., 2017a, ‘Drop-in performance analysis and effect
of ihx for an automotive air conditioning system with R1234yf as a replacement of
R134a’, Strojniski Vestnik/Journal of Mechanical Engineering, Vol. 63, No.5, pp. 314–
319.
Khalifa, A. H. N., Faraj, J. J. and Hasan, H. K., 2016, ‘Energy and exergy analyses of
heat pump Cycle with Refrigerant Injection Technology’, Journal of Engineering,
Vol.22, No. 11, pp. 101–110.
Lee, Y. and Jung, D., 2012, ‘A brief performance comparison of R1234yf and R134a in a
bench tester for automobile applications’, Applied Thermal Engineering. Elsevier Ltd,
Vol.35, No.1, pp. 240–242.
Mahdi, A. L, Mohammad, W. S. and Mahmood, S. A., 2018 ‘Exergy Analysis of a
Domestic Refrigerator’, Journal of Chemical and Engineering Data, Vol.24, No.9, pp. 1–
20.
Molés, F. et al. ,2014, ‘Theoretical energy performance evaluation of different single
stage vapour compression refrigeration configurations using R1234yf and R1234ze(E) as
working fluids’, International Journal of Refrigeration. Elsevier Ltd, Vol.44, pp. 141–
150.
Shi, J. et al. ,2016, ‘Experimental research and optimization on the environmental
friendly R1234yf refrigerant in automobile air conditioning system’, Journal of Shanghai
Jiaotong University (Science), Vol.21, No.5, pp. 548–556.
Sethi, A. and Hrnjak, P. (2014) ‘Oil retention and pressure drop of R1234yf and R134a
with POE ISO 32 in suction lines’, HVAC and R Research, vol. 20, No.6, pp. 703–720.
Vaghela, J. K., 2017,‘Comparative Evaluation of an Automobile Air - Conditioning
System Using R134a and Its Alternative Refrigerants’, Energy Procedia. Vol .109, pp.
153-160.
Zilio, C., Brown, Schiochet, G., Cavallini, A., 2011, ‘The refrigerant R1234yf in air
conditioning systems’, Energy. Pergamon, Vol. 36, No.10, pp. 6110–6120.
NOMENCLATURE
AACS = automoative air conditioning system.
COP = coefficent of performance, dimensionless.
CR = compression ratio.
EES = engineering equation solver.
HFO1234yf= R1234yf.
GWP = global warming potential.
IHX = internal heat exchanger.
ODP = ozone depletion potential.
TXV = thermal expansion valve.
Journal of Engineering Volume 25 December 2019 Number 12
14
VCRC = vapor compression refrigerant cycle.
RE = refriherant effect kJ/kg.
��𝑟= mass flow rate of refrigerant, kg/s.
h = enthalpy, kJ/kg.
P = pressure, bar.
Qc = Heat reject from condenser kW.
Qevap. = heat absorbed in the evaporator, kW.
rpm = revolution per min.
Th. Load= thermal load, kW.
W actual = actual work, kW.
W ideal = ideal work, kW.
aic = air inlet condenser.
comp.= compressor.
cond.=condenser.
d = discharge line.
evap.=evaporator.
s = suction line.
Tevap.= Evaporatore temperature, (oC).
Tcond.= Condenser temperature, (oC).