experimental design and data analysis anwar ahmad
TRANSCRIPT

Experimental Design and
Data Analysis
Anwar Ahmad
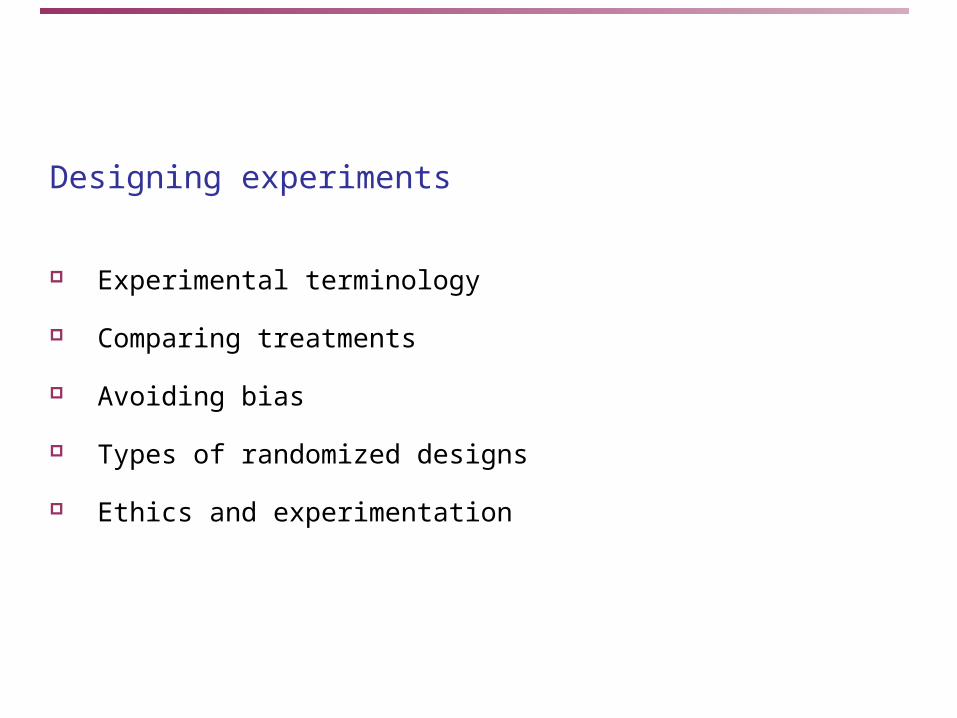
Designing experiments
Experimental terminology
Comparing treatments
Avoiding bias
Types of randomized designs
Ethics and experimentation

Terminology The individuals in an experiment are the experimental units. If they are
human, we call them subjects.
The explanatory variables in an experiment are often called factors.
A treatment is any specific experimental condition applied to the subjects.
If an experiment has several factors, a treatment is a combination of specific
values of each factor.
The factor may be the administration of a drug.
One group of people may be placed on a diet/exercise program for 6 months
(treatment), and their blood pressure (response variable) would be compared with
that of people who did not diet or exercise.

If the experiment involves giving two different doses of a drug, we
say that we are testing two levels of the factor.
A response to a treatment is statistically significant if it is larger
than you would expect by chance (due to random variation among
the subjects). We will learn how to determine this later.
In a study of sickle cell anemia, 150 patients were given the drug
hydroxyurea, and 150 were given a placebo (dummy pill). The researchers
counted the episodes of pain in each subject. Identify:
•The subjects (patients, all 300)
•The factors/treatments (hydroxyurea and placebo)
•And the response variable (episodes of pain)

Comparing treatmentsExperiments are comparative in nature: We compare the response to a
treatment versus to: another treatment no treatment (a control) a placebo or any combination of the above
A control is a situation in which no treatment is administered. It serves
as a reference mark for an actual treatment (e.g., a group of subjects
does not receive any drug or pill of any kind).
A placebo is a fake treatment, such as a sugar pill. It is used to test the
hypothesis that the response to the treatment is due to the actual
treatment and not to how the subject is being taken care of.

About the placebo effect
The “placebo effect” is an improvement in health due not to any
treatment but only to the patient’s belief that he or she will improve.
The placebo effect is not understood, but it is believed to have
therapeutic results on up to a whopping 35% of patients.
It can sometimes ease the symptoms of a variety of ills, from asthma to
pain to high blood pressure and even to heart attacks.
An opposite, or “negative placebo effect,” has been observed when
patients believe their health will get worse.
The most famous and perhaps most powerful placebo is the “kiss,”
blow, or hug—whatever your technique.
Unfortunately, the effect gradually disappears once children
figure out that they sometimes get better without help, and
vice versa.

Is the treatment appropriate for the response you want to study?
Is studying the effects of eating red meat on cholesterol values in a group of
middle-aged men a realistic way to study factors affecting heart disease
problem in humans?
What about studying the effects of hair spray
on rats to determine what will happen
to women with big hair?
Lack of realism
Random sampling is meant to gain
information about the larger
population from which we sample.
population
sample

The best way to exclude bias in an experiment is to randomize the
design. Both the individuals and treatments are assigned randomly.
Bacterial resistance to antibiotics is studied at several temperatures.
Which plates are grown at which temperature is assigned randomly.
When a potentially confounding variable cannot be randomized, it can
be fixed or controlled instead.
All experiments on bacterial resistance to antibiotics are performed at
the same temperature. Temperature is controlled and will not influence
results. However, results may not apply to other temperatures.
Avoiding bias
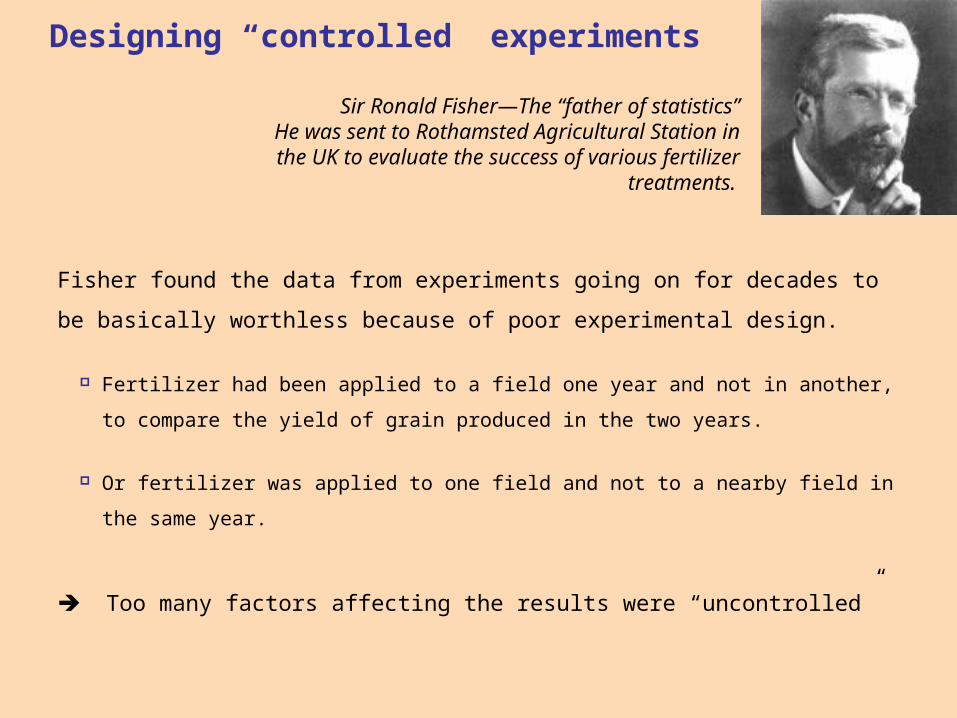
Designing “controlled” experiments
Sir Ronald Fisher—The “father of statistics”He was sent to Rothamsted Agricultural Station
in the UK to evaluate the success of various fertilizer treatments.
Fisher found the data from experiments going on for decades to be basically
worthless because of poor experimental design.
Fertilizer had been applied to a field one year and not in another, to compare the yield
of grain produced in the two years.
Or fertilizer was applied to one field and not to a nearby field in the same year.
Too many factors affecting the results were “uncontrolled”

Fisher’s solution:
In the same field and same year, apply
fertilizer to randomly spaced plots
within the field. Analyze plants from
similarly treated plots together.
This minimizes the effect of variation of
drainage and soil composition within
the field on yield as well as controlling
for weather.
F F F F F F
F F F F F F F F
F F F F F
F F F F F F F F
F F F F F
F F F F
Randomized comparative experiments

Bias is a particularly challenging problem when dealing with human
subjects because of the placebo effect. A double-blind experiment is
one in which neither the subjects nor the experimenter know which
individuals got which treatment until the experiment is completed.
However, subjects must be informed that they will get one of a
number of treatments and must consent to that condition (it
would be unethical otherwise).
Another way to make sure your conclusions are robust is to replicate
your experiment—do it over. Replication ensures that particular results
are not due to uncontrolled factors or errors of manipulation.

In a completely randomized experimental design, individuals are
randomly assigned to groups, then the groups are randomly assigned
to treatments.
Types of randomized designsCompletely randomized experimental designs

Choose pairs of subjects that are closely matched (like
twins). Within each pair, randomly assign who will receive
which treatment.
Or give the two treatments to a single person over time, in random
order. In this case the “matched pair” is just the same person at
different points in time.
Matched pairs designs
Generics are brand-name drugs manufactured by a different
company but with identical active ingredients and properties.
Individuals are given either Brand X or its generic version one day so that drug
absorption can be measured. One week later, each individual receives the other
drug to measure drug absorption. A difference in absorption extent between
Brand X and its generic is then calculated for each individual.
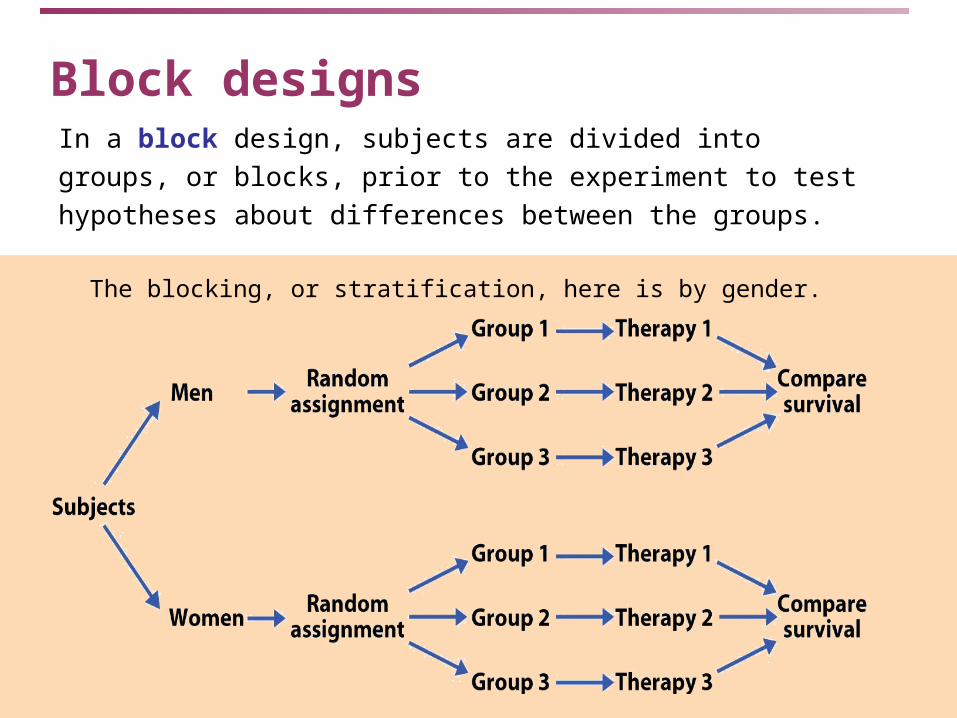
In a block design, subjects are divided into groups, or blocks, prior
to the experiment to test hypotheses about differences between the
groups.
The blocking, or stratification, here is by gender.
Block designs

A researcher wants to see if there is a significant difference in
resting pulse rates for men and women. Twenty-eight men
and twenty-four women had their pulse rate measured at rest
in the lab.
One factor, two levels (male and female) Stratified/block design (by gender)
Many dairy cows now receive injections of BST, a hormone intended to spur
greater milk production. The milk production of 60 Ayrshire dairy cows was
recorded before and after they received a first injection of BST.
Random sample of 60 cows
Match pair design (before and after)
What experimental design?

Issues: Ethics Biology deals with life. Experimentations have an impact on live
subjects and ecosystems.
Where do we place the difference between what can physically be
done and what can ethically be done.
What rights do subjects have? Humans, animals, plants, microbes…
Personal standards vary, and extreme
experimentations have been seen.
Committees have been established
to review all research proposals.
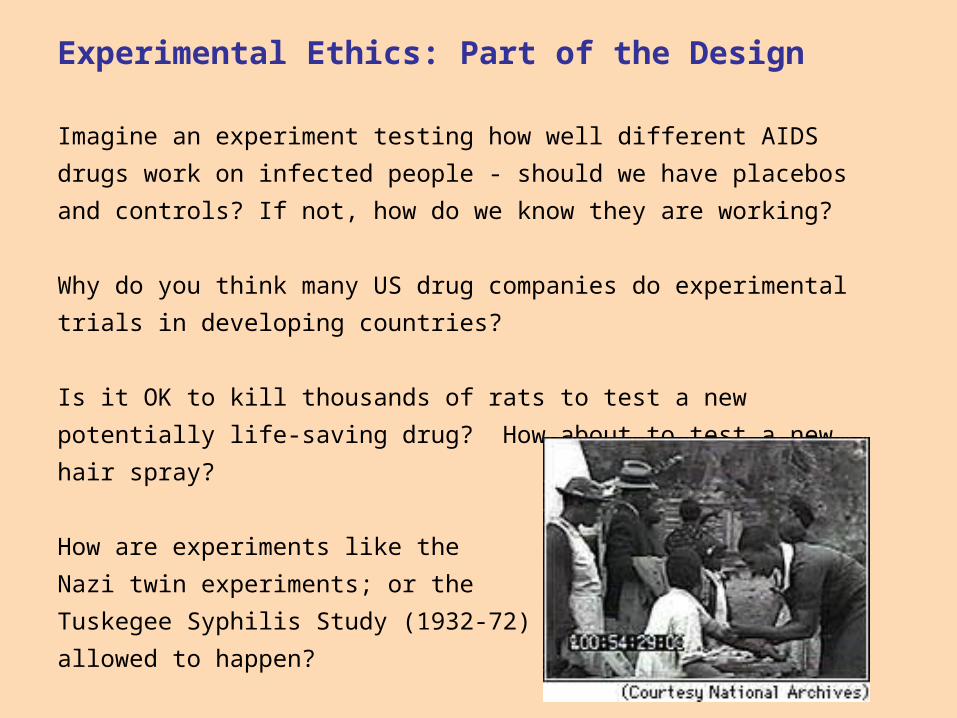
Experimental Ethics: Part of the Design
Imagine an experiment testing how well different AIDS drugs work on infected
people - should we have placebos and controls? If not, how do we know they
are working?
Why do you think many US drug companies do experimental trials in
developing countries?
Is it OK to kill thousands of rats to test a new potentially life-saving drug? How
about to test a new hair spray?
How are experiments like the
Nazi twin experiments; or the
Tuskegee Syphilis Study (1932-72)
allowed to happen?

Types of Studies SurveysSurveys: describe population characteristics
(e.g., a study of the prevalence of hypertension in a population)
Comparative studies:Comparative studies: determine relationships between variables (e.g., a study to address whether weight gain causes hypertension)

Surveys Goal: to describe population characteristics Studies a subset (sample) of the population Uses sample to make inferences about population Sampling :
Saves time Saves money Allows resources to be devoted to greater scope and accuracy


Comparative Studies Comparative designs study the relationship
between an explanatory variable and response variable.
Comparative studies may be experimental or non-experimental.
In experimental designs, the investigator assign the subjects to groups according to the explanatory variable (e.g., exposed and unexposed groups)
In nonexperimental designs, the investigator does not assign subjects into groups; individuals are merely classified as “exposed” or “non-exposed.”

Study Design Outlines

Example of an Experimental DesignThe Women's Health Initiative study randomly assigned about half its subjects to a group that received hormone replacement therapy (HRT).
Subjects were followed for ~5 years to ascertain various health outcomes, including heart attacks, strokes, the occurrence of breast cancer and so on.
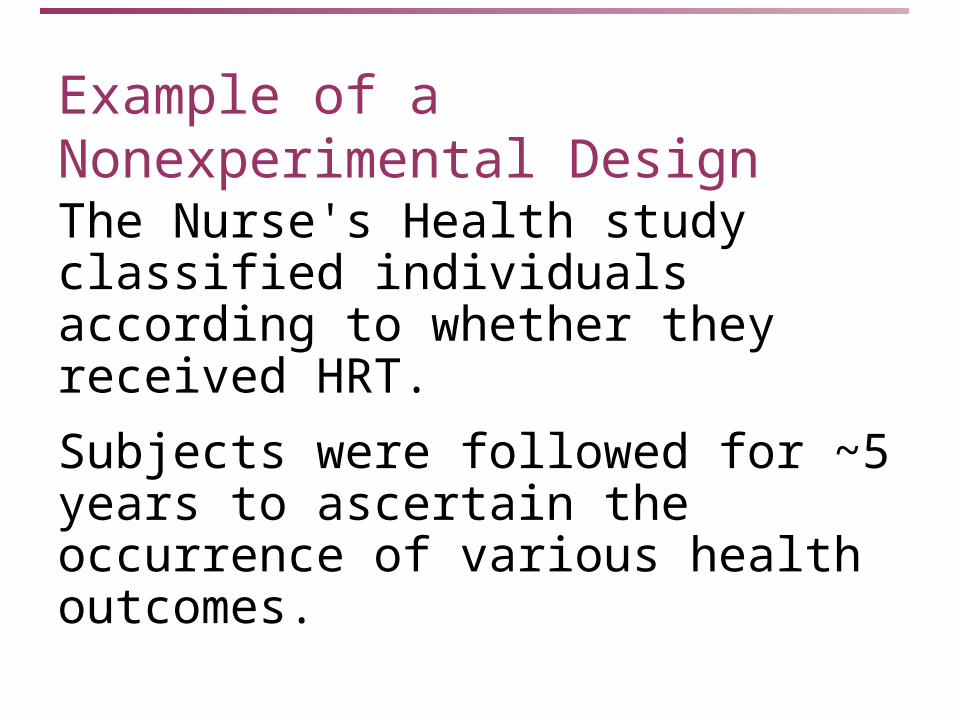
Example of a Nonexperimental DesignThe Nurse's Health study classified individuals according to whether they received HRT.
Subjects were followed for ~5 years to ascertain the occurrence of various health outcomes.

Comparison of Experimental and Nonexperimental Designs In both the experimental (WHI) study and
nonexperimental (Nurse’s Health) study, the relationship between HRT (explanatory variable) and various health outcomes (response variables) was studied.
In the experimental design, the investigators controlled who was and who was not exposed.
In the nonexperimental design, the study subjects (or their physicians) decided on whether or not subjects were exposed.

Subjects, Factors, Treatments (Illustration)

Subjects = 100 individuals who participated in the study Factor A = Health education (active, passive) Factor B = Medication (Rx A, Rx B, or placebo) Treatments = the six specific combinations of factor A
and factor B
Subjects, Factors, Treatments, Example, cont.
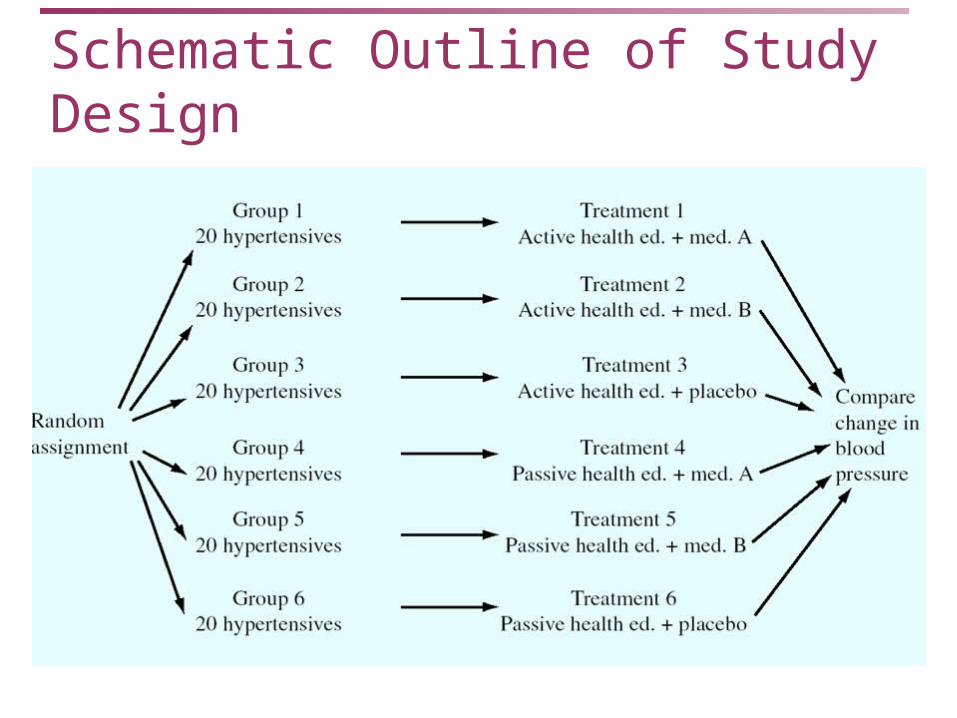
Schematic Outline of Study Design

Three Important Experimentation Principles:Controlled comparisonRandomized Blinded

“Controlled” Trail The term “controlled” in this context means there
is a non-exposed “control group” Having a control group is essential because the
effects of a treatment can be judged only in relation to what would happen in its absence
You cannot judge effects of a treatment without a control group because: Many factors contribute to a response Conditions change on their own over time The placebo effect and other passive intervention
effects are operative
Randomization Randomization is the second principle of experimentation Randomization refers to the use of chance mechanisms to assign
treatments Randomization balances lurking variables among treatments groups,
mitigating their potentially confounding effects

Randomization - Example
Consider this study (JAMA 1994;271: 595-600) Explanatory variable: Nicotine or placebo patch 60 subjects (30 each group) Response: Cessation of smoking (yes/no)
Random Assignment
Group 130 smokers
Treatment 1 Nicotine Patch
CompareCessation
ratesGroup 2
30 smokers
Treatment 2 Placebo Patch

Randomization – Example Number subjects 01,…,60 Use Table A (or a random number generator) to select 30 two-tuples
between 01 and 60 If you use Table A, arbitrarily select a different starting point each time For example, if we start in line 19, we see
04247 38798 73286

Randomization, cont. We identify random two-tuples, e.g., 04, 24, 73, 87,
etc. Random two-tuples greater than 60 are ignored The first three individuals in the treatment group are
01, 24, and 29 Keep selecting random two-tuples until you identify
30 unique individuals The remaining subjects are assigned to the control
group
Blinding Blinding is the third principle of experimentation Blinding refers to the measurement of the
response of a response made without knowledge of treatment type
Blinding is necessary to prevent differential misclassification of the response
Blinding can occur at several levels of a study designs Single blinding - subjects are unaware of specific
treatment they are receiving Double blinding - subjects and investigators are
blinded

Empirical Examples and Mistakes
1. FEEDING FULL FAT OIL SEEDS TO LAYING HENS: EFFECT ON PRODUCTION PARAMETERS, EGG QUALITY, CHOLESTEROL AND EGG FATTY ACIDS. Zafar Hayat. PhD Dissertation, UVAS
An experiment was conducted to evaluate the effects of different dietary sources of poly unsaturated fatty acids (PUFA) on yolk cholesterol, fatty acid profile, egg quality and production performance of layers. Different PUFA sources, such as flax, canola or sunflower seed at three different levels, were fed to 300 white leghorn laying hens from 53 to 62 weeks of age.

Experiment DesignAn experiment was conducted, as completely randomized; experimental units were the replicates consisting of ten layers/gp. The production performance and egg quality data thus obtained were analyzed using one way analyses of variance (ANOVA). Analysis of variance was performed by Proc GLM (SAS version 9.1, SAS Institute, USA) for a completely randomized design where treatments were taken as main effects and replicates within treatment as error term.
The following model was used:
Yij = μ + τi + εij
Where; Yij = variable measured for the jth replicate, μ = overall mean, τi = effect as a result of the ith treatment and εij = CRD error component.

Effect of feeding different full fat oilseeds on production
performance of layers Dietary
Egg prod Egg wt. Egg mass Feed intake Feed
Treatment1(%) (g) (g/d) (g/d/h) Conversion
Control 79.26 60.45 47.91 113.38abc 2.367
Flax 5 82.14 61.42 50.42 114.30ab 2.267
Flax 10 81.91 60.37 49.44 109.87d 2.223
Flax 15 81.43 60.33 49.13 110.14cd 2.243
Canola 5 80.14 60.97 48.86 111.89bcd 2.287
Canola 10 82.73 59.74 49.43 111.19bcd 2.253
Canola 15 81.72 61.2 50.01 115.42a 2.307
Sunflower 5 81.9 61.34 50.3 111.84bcd 2.233
Sunflower 10 81.5 61.19 49.87 114.42ab 2.297
Sunflower 15 80.48 60.71 48.86 112.81abcd 2.31
SEM 1.414 0.512 1.044 1.018 0.046
P Value 0.822 0.385 0.825 0.011 0.556
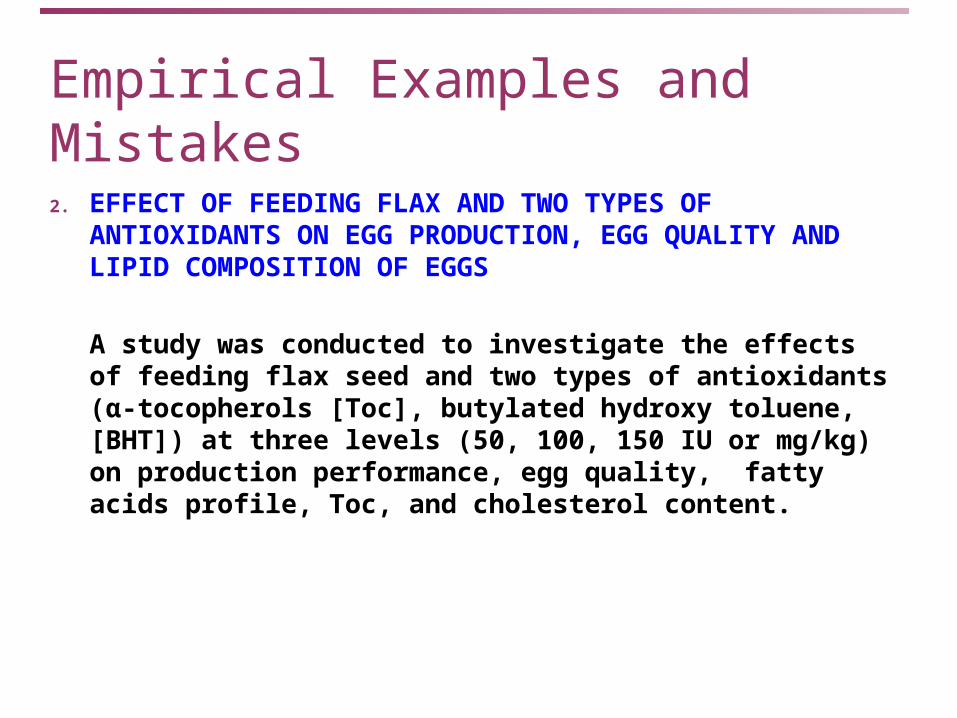
Empirical Examples and Mistakes2. EFFECT OF FEEDING FLAX AND TWO TYPES OF
ANTIOXIDANTS ON EGG PRODUCTION, EGG QUALITY AND LIPID COMPOSITION OF EGGS
A study was conducted to investigate the effects of feeding flax seed and two types of antioxidants (α-tocopherols [Toc], butylated hydroxy toluene, [BHT]) at three levels (50, 100, 150 IU or mg/kg) on production performance, egg quality, fatty acids profile, Toc, and cholesterol content.
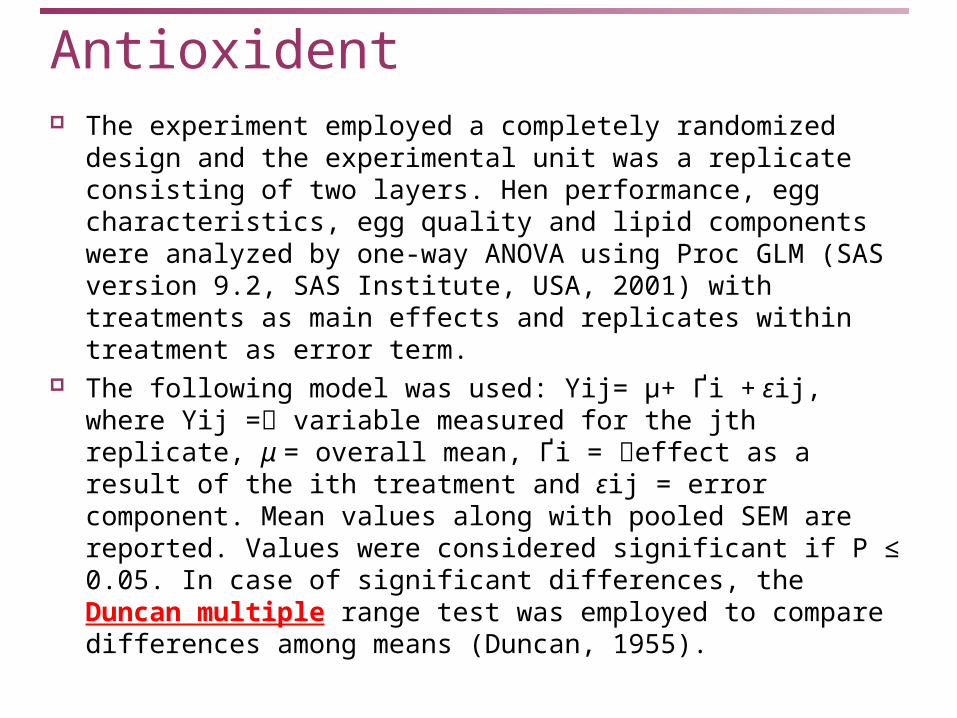
Antioxident The experiment employed a completely randomized design and the
experimental unit was a replicate consisting of two layers. Hen performance, egg characteristics, egg quality and lipid components were analyzed by one-way ANOVA using Proc GLM (SAS version 9.2, SAS Institute, USA, 2001) with treatments as main effects and replicates within treatment as error term.
The following model was used: Yij= µ+ Ґi + εij, where Yij = variable measured for the jth replicate, μ = overall mean, Ґi = effect as a result of the ith treatment and εij = error component. Mean values along with pooled SEM are reported. Values were considered significant if P ≤ 0.05. In case of significant differences, the Duncan multiple range test was employed to compare differences among means (Duncan, 1955).
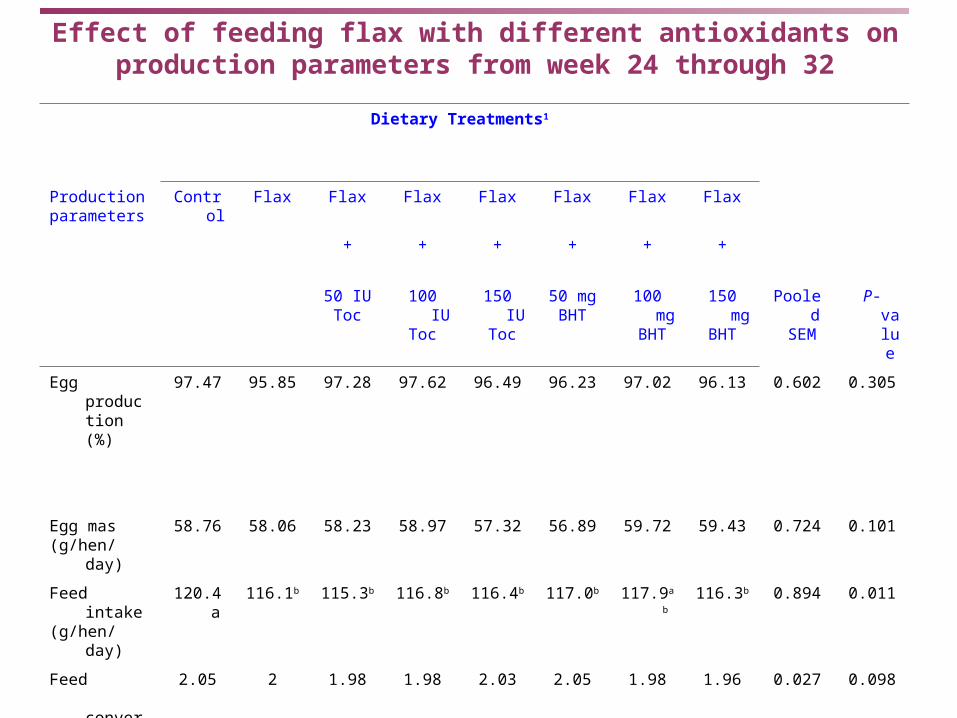
Effect of feeding flax with different antioxidants on production parameters from week 24 through 32
Dietary Treatments1
Productionparameters
Control Flax Flax Flax Flax Flax Flax Flax
+ + + + + +
50 IUToc
100 IU Toc
150 IU Toc
50 mg BHT
100 mg BHT
150 mg BHT
Pooled SEM
P-value
Egg production (%)
97.47 95.85 97.28 97.62 96.49 96.23 97.02 96.13 0.602 0.305
Egg mas(g/hen/day)
58.76 58.06 58.23 58.97 57.32 56.89 59.72 59.43 0.724 0.101
Feed intake (g/hen/day)
120.4a 116.1b 115.3b 116.8b 116.4b 117.0b 117.9ab 116.3b 0.894 0.011
Feed conversion2
2.05 2 1.98 1.98 2.03 2.05 1.98 1.96 0.027 0.098

Empirical Examples and Mistakes3. EFFECT OF INCORPORATING DESIGNER EGGS IN HUMAN
DIET ON LIPID PROFILE, BLOOD GLUCOSE AND BLOOD PRESSURE
Twenty volunteers were selected from the healthy normolipidemic and normotensive students of University of……. All volunteers were female undergraduate students residing in a dorm. Same diet was given to all subjects throughout the experiment. Personal data of volunteers is summarized in the Table…
Data was analyzed by analysis of variance (ANOVA) by using the statistical analysis system (SAS) to check whether there were any significant effects of feeding control or/and designer eggs on the serum lipid profile, blood glucose, and blood pressure (Steel et al. 1997).

Female Volunteers Group A Group B Group C Group D
day 0 day 21 day 0 day 21 day 0 day 21 day 0 day 21
mg/dl
Serum 163.4 166.6 168.2 176.8 162 167.2 166.4 169.6
Cholest ±18.72 ±24.28 ±22.35 ±23.76 ±24.35 ±22.39 ±7.83 ±21.66
HDL 51.4 52 52.2 51.6 50 55.8 49.8 54
Cholest ±6.47 ±4.85 ±6.46 ±3.13 ±6.12 ±6.42 ±10.66 ±4.85
LDL 92 95.4 95.6 108 93.2 95 91.2 92.4
Cholest ±22.30 ±20.09 ±19.92 ±21.97 ±22.43 ±16.96 ±3.27 ±14.21
Serum 119 122.8 112.2 121 118.4 103.8 116.2 99.6
Triglyc ±16.66 ±7.29 ±14.01 ±14.93 ±15.95 ±18.30* ±11.21 ±12.86*
Blood 81.6 83.8 84.2 83 82.4 85.4 83 80.4
Glucose ±4.34 ±3.49 ±7.19 ±4.00 ±5.55 ±4.77 ±6.20 ±3.91