experimental evaluation of modified sulfur concrete for
TRANSCRIPT

sustainability
Article
Experimental Evaluation of Modified Sulfur Concretefor Achieving Sustainability in Industry Applications
Margareth Dugarte 1,*, Gilberto Martinez-Arguelles 1 and Jaime Torres 2
1 Department of Civil and Environmental Engineering, Universidad del Norte, Barranquilla 80020, Colombia;[email protected]
2 Department of Mechanical Engineering, Universidad del Norte, Barranquilla 80020, Colombia;[email protected]
* Correspondence: [email protected]; Tel.: +57-318-514-72671
Received: 10 November 2018; Accepted: 11 December 2018; Published: 23 December 2018 �����������������
Abstract: Portland cement concrete (PCC) has been the most widely used concrete in the constructionindustry. However, PCC has a short service life under some aggressive environments, leadingto the need of costly repairs. The purpose of this research was to implement local materials toproduce a modified sulfur concrete (MSC) with better performance in industrial applications. Severalmodified sulfur concrete mixtures were prepared using natural aggregates from the northern regionof Colombia, and sulfur cement by combination of sulfur with a modifier, with the objective ofachieving the best performance based on mechanical strength and chemical resistance. To achievethis purpose, an experimental program based on a k-factorial design was used to determine theoptimal mix design based on the results of the compressive strength. The mixture presenting thebest results was then examined further with standardized tests to determine its physical, mechanical,and chemical properties (compressive strength, abrasion resistance, bulk density, absorption, andchemical resistance). Final results showed that the sulfur concrete mixture is very resistant to chemicalattack and an outstanding substitute for PCC. The results indicated that there is no significant lossin weight and no relevant variation in compressive strength after the specimens were immersed insulfuric acid and sulfate solutions. In addition, similar results were obtained for the slabs located inchemicals plants whose conditions were assessed during a 60-day period of exposure.
Keywords: modified sulfur concrete; sulfur cement; compressive strength; abrasion resistance;chemical attack
1. Introduction
Sulfur and its derivatives are considered as being among the most important elements used asindustrial raw materials all over the world [1]. The main use of sulfur includes agricultural industryas fertilizer and other chemical processes, but it also has potential applications in the manufacturingindustry (pharmaceuticals, personal care products, cosmetics, water treatment, etc.). Sulfur is foundnaturally in the environment and has been ranked between the tenth to fourteenth most abundantelements in the Earth’s crust [1–3]. Despite that, during the last century, as consequence of technologicalprogress and industrial developments, sulfur production from petroleum and gas resources hasgenerated large accumulation of this mineral [4]. Since 2011, the global production of sulfur in allforms has been around 69 million tons [5]. China, for instance, produced 8.8 million tons in 2015,while Colombia produced 69,000 tons during the same period [6]. As fossil fuel consumption isincreasing all over the world, petroleum and gas production are yielding sulfur as a by-product, whichis being applied as a binder in composite construction materials such as asphalt and concrete [7].In fact, sulfur cements have been recognized for providing good resistance to chemical attack, quick
Sustainability 2019, 11, 70; doi:10.3390/su11010070 www.mdpi.com/journal/sustainability

Sustainability 2019, 11, 70 2 of 16
hardening, i.e., reaching the required properties in only 24 h, high strength and fatigue resistance,very low water permeability, and exceptional resistance to acid and salt agents, which allows its usein highly aggressive environments [4,7,8]. In addition, the mechanical properties of sulfur cementsmay be improved by the inclusion of a variety of admixtures to produce what is known as modifiedsulfur cements.
On the other hand, modified sulfur concrete (MSC) is a thermoplastic material composed ofaggregates, sulfur cement, and additives, which, upon solidifying, rapidly gains resistance in aboutone day of curing; consequently, the early strength gain is one of the most important and desiredproperties of MSC as a construction material [9,10]. Sulfur is usually heated and mixed with additivesand aggregates to produce MSC. During the cooling process, the sulfur changes from a liquid state tomonoclinic sulfur crystals (Sβ-phase) at ~114 ◦C; then, when the temperature reaches approximately96 ◦C, the Sβ-phase transforms to orthorhombic sulfur (Sα-phase), which is the stable phase of sulfurat room temperature [4,7,11]. As this transformation occurs in less than 24 h and Sα-phase has greaterdensity than the Sβ-phase, inducing high internal stresses in the material due to the solidification ofsulfur, this allows for premature failure, cracks, or defects at early ages. As the total volume contractionupon solidification is about 7%, it is necessary to modify the sulfur to ensure the durability of elementsconstructed with MSC [4,11].
Alternately, if unmodified sulfur (elemental) is used as a binder, concrete may present someproblems regarding durability and stability; in particular, sulfur concrete degradation and failureshave been reported after exposure to repeated freezing cycles. This phenomenon occurs because sulfurtransformation occurs during concrete preparation, which induces high internal stresses and microcracking within the material [8]. From a mechanical point of view, elemental sulfur provides lowerresistance to water and higher brittleness than PCC [12–15]. To overcome these problems, and seekingto enhance mechanical properties and long-term performance, sulfur concrete needs to be modified.However, MSC may still present some disadvantages. For instance, the thermal expansion of MSCspecimens is substantially larger than has been reported for PCC. Indeed, this high thermal expansioncoefficient may imply significant expansion and contraction of concrete due to temperature changeseventually promoting micro-cracks in the concrete [7]. The most common modifiers used in order toavoid the transformation of sulfur from monoclinic to orthorhombic states are dicyclopentadiene, or acombination of (a) dicyclopentadiene, cyclopentadiene, and dipentene, and (b) olefinic polysulfideadditives [12,15]. However, the limited use of MSC in industry applications has been ascribed tothe fact that the reaction between sulfur and dicyclopentadiene is exothermic and requires closetemperature control; in addition, dicyclopentadiene-modified sulfur cement is unstable when exposedto high temperature conditions [12].
One of the main advantages of MSC over PCC is its durability to most acid and salt environments,especially in industrial plants where conventional PCC has a short service life. Besides industryapplications, other uses of MSC include structures under freezing and thawing cycles, food industryfacilities, sewage pipes, drainage channels, and marine structures. Regarding sustainability, MSC maybe considered an eco-friendly material as it can replace Portland cement in several constructionapplications. In fact, among several causes of global warming, the construction industry is responsiblefor a significant portion of greenhouse gases emissions (GHG) [7]. In fact, PCC is responsible of about5% of global CO2 generation, which is usually linked to the heating process of raw materials in kilnsat temperatures higher than 1400 ◦C [10]. On the other hand, since a large amount of sulfur usedin the industry is obtained from the distillation of oil as a by-product, using the sulfur as binderin concrete mixtures will reduce the use of water and environmental impacts related with Portlandcement production. Finally, in order to quantify the potential environmental benefits of MSC, furtheranalysis must consider life cycle assessment comparing production and use phases of PCC andMSC respectively.
MSC has been massively implemented in United States, Canada, and recently in Europe, but notin South America [4], so the developments of this material in Colombia have been limited. This paper

Sustainability 2019, 11, 70 3 of 16
aims to propose an optimal mix design of MSC by implementing a factorial experiment in order tostudy the effects each design factor on the response variable (compressive strength). Based on theoptimal mix formulation, a complete characterization of MSC was performed, including compressivestrength, density, abrasion resistance, chemical attack, and durability.
2. Materials and Methods
Elemental sulfur with 99.9% purity, a specific weight of 1.032 g/cm3, and other components asshown in Table 1 were used as a binder. The sulfur was modified using an additive with a specificweight of 1.69 g/cm3; this additive is made of olefinic hydrocarbon polymers such as Excopol toproduce modified sulfur cement that allows the sulfur to stabilize in an orthorhombic form (Sα phase).The aggregates were sand and siliceous river gravel as fine and coarse aggregates respectively, andwere obtained from local stone quarries with maximum particle size of 3
4 ”. Several test methodswere implemented in order to examine the physical, chemical, and mechanical properties of thefine and coarse aggregate sources, including bulk specific gravity, water absorption, sieve analysis,abrasion, and chemical resistance, which are in accordance with specifications established on theASTM C33/33M standard [16]. Results are shown in Table 2.
Table 1. Chemical Analysis of Sulfur.
S (%) 99.9Ash (%) 0.0004H2O (%) 2.4
H2SO4 (%) 0.007Apparent density g/cc 1.032
Organic Content 0.002

Sustainability 2019, 11, 70 4 of 16
Table 2. Aggregates Characterization Summary.
Test Standard Units Fine AggregateType A
Fine AggregateType B Coarse Aggregate Acceptance Limits
Physical properties
Sieve analysis ASTM C136 [17] – – – – –Water Absorption, ASTM C 127, C128 [18,19] % 2.78 1.64 1.64 <2%
Bulk density by rodding
ASTM C29/C29M [20]
kg/m3 1660 1780 1570 –Voids (compacted by rodding) % 35 28 37.9 –
Loose bulk density kg/m3 1370 1600 1420 –Voids (loose aggregate) % 46.3 35.2 43.9 –
Specific gravity
ASTM C 127, C128 [18,19]SSD 2.62 2.52 2.57 –Dry 2.55 2.47 2.53 –
Apparent 2.74 2.60 2.64 –Clay lumps and friable particle ASTM C142 [21] <2%
Mechanical Properties
Los Angeles Abrasion, LA ASTM C535 [22] % – – 13.18 <40%
Chemical Properties
Corrosion Resistance ASTM C1370H2SO4 [23] % 1.8 1.9 1.8 <2%
SO4(NH4)2 1.7 1.7 0.5 <2%

Sustainability 2019, 11, 70 5 of 16
Based on ACI 548-2R standard [24], in order to reduce sulfur cement content on the mixturedesign, well graded aggregates should be used. In this research, three aggregate sources were used:fine aggregate type A (17.6%), fine aggregate type B (21.4%) and a coarse aggregate (61%). Theselected aggregate gradation was based on reducing voids in the mineral aggregates and consideringdense-graded aggregate gradation limits given by ASTM D 3515 standard [25]. Sieve analysis wereconducted based on the ASTM C136 standard [17] for all aggregate sources and results are shown inFigure 1. The selected gradation corresponds to a combination of three aggregate sources to obtain adense gradation meeting the specified limits.
Sustainability 2018, 10, x FOR PEER REVIEW 6 of 18
A chemical resistance test for the three aggregate sources was performed based on the ASTM C 1370 standard [23], which aimed to establish the acceptability of the aggregates for use in MSC. The aggregates were exposed to sulfuric acid (H2SO4) and ammonium sulfate SO4 (NH4)2 solutions at a concentration of 40% in order to simulate industrial environment conditions. Weight loss of below 2% was obtained for all samples after being immersed for 24 h in the test solutions at an elevated temperature (60 ± 2 °C), as shown in Table 2.
Figure 1. Particle size distribution for 25.4 mm aggregate used in this study.
2.1. Sample Preparation
Sample specimens were prepared according to the ACI 548.2R guide [24]. The aggregates were preheated to 135° C in a mixer with temperature control, then the sulfur and sulfur modifier additive were added and the mixture was mechanically homogenized for approximately 20 min. The temperature in the mixer was always controlled to be in the range of 130 to 140 °C and the mixing energy was 28 rpm. Once this temperature was reached, the MSC mixture was ready and placed in the molds for casting. For specimen preparation, cylindrical steel molds 15 cm in diameter and 30 cm in height were used and preheated at 120 °C before the mixture was poured. Then, the specimens were manually compacted in three layers using a steel rod following the ASTM C-39 standard [26]. The specimens were allowed to cool to room temperature before being removed from the molds, and after 24 h, demolded, and subsequently, the specimen weight and compressive strength were determined, as shown in Figure 2.
0
20
40
60
80
100
120
0.01 0.10 1.00 10.00 100.00
Cum
ulat
ive
perc
enta
je p
assi
ng (%
)
Sieve opening (mm)
Fine Aggregate Type AFine Aggregate Type BCoarse aggregateUpper limit (ASTM D 3515)Lower limit (ASTM D 3515)Dense gradation
Figure 1. Particle size distribution for 25.4 mm aggregate used in this study.
A chemical resistance test for the three aggregate sources was performed based on the ASTM C1370 standard [23], which aimed to establish the acceptability of the aggregates for use in MSC. Theaggregates were exposed to sulfuric acid (H2SO4) and ammonium sulfate SO4 (NH4)2 solutions at aconcentration of 40% in order to simulate industrial environment conditions. Weight loss of below2% was obtained for all samples after being immersed for 24 h in the test solutions at an elevatedtemperature (60 ± 2 ◦C), as shown in Table 2.
2.1. Sample Preparation
Sample specimens were prepared according to the ACI 548.2R guide [24]. The aggregateswere preheated to 135◦ C in a mixer with temperature control, then the sulfur and sulfur modifieradditive were added and the mixture was mechanically homogenized for approximately 20 min.The temperature in the mixer was always controlled to be in the range of 130 to 140 ◦C and the mixingenergy was 28 rpm. Once this temperature was reached, the MSC mixture was ready and placed inthe molds for casting. For specimen preparation, cylindrical steel molds 15 cm in diameter and 30 cmin height were used and preheated at 120 ◦C before the mixture was poured. Then, the specimenswere manually compacted in three layers using a steel rod following the ASTM C-39 standard [26].The specimens were allowed to cool to room temperature before being removed from the molds,and after 24 h, demolded, and subsequently, the specimen weight and compressive strength weredetermined, as shown in Figure 2.

Sustainability 2019, 11, 70 6 of 16Sustainability 2018, 10, x FOR PEER REVIEW 7 of 18
Figure 2. MSC specimens before and after compressive strength test.
2.2. Trial Mix Designs
This study aimed at determining the optimal mixture proportions of MSC for industry applications. Several preliminary mixtures were prepared based on the variation of total aggregates content and sulfur cement, given as a percentage of the total volume of concrete. These variables were used for conducting a 3^k factorial experiment with 2 factors, to model the influence of mixture components on the compressive strength of the MSC in order to optimize the mixture design. These two factors were aggregate content and additive/sulfur ratio.
During the selection of levels for the analysis, i.e., maximum, intermediate, and minimum for the two variables, two conditions were implemented: condition 1 varying the aggregate content as 50, 60%, 70%, and 80% without changing sulfur cement proportions (% additive/sulfur = 0.05), and condition 2 varying the sulfur cement proportions with % additive/sulfur of 0.05, 0.10, 0.15 and 0.20. In both cases, two specimens were tested to determine the one-day compressive strength according to the ASTM C39 standard [26]. The range of sulfur cement and aggregate content in which the MSC mixtures performed satisfactorily was identified considering (i) good workability, (ii) high compressive strength, and (iii) sample finishing. Tables 3 and 4 below show the results for average compressive strength for condition 1 and 2 respectively.
Table 3. Compressive strength results–Condition 1.
Aggregate Content (% Volume)
Sulfur Cement (% Volume)
Average Compressive
Strength (MPa)
Standard Deviation (MPa)
80% 20% 14.48 0.31 70% 30% 27.07 0.21 60% 40% 24.28 1.09 50% 50% 12.12 1.79
As shown in Table 3, an aggregate content of 70% in the MSC showed the highest compressive strength; conversely, increasing the aggregate content up to 80% reduced the compressive strength, and the workability and handling experienced during placement were also significantly affected. Therefore, the range of this variable for the factorial design was selected as 60% to 70%, with 65% as an intermediate value. Also, as shown in Table 4, the additive/sulfur ratio showing the highest compressive strength was between 0.05 and 0.10; therefore, the range of values to be used in the factorial design were selected as 0.05, 0.10, and 0.075 as the minimum, maximum, and intermediate value respectively.
Figure 2. MSC specimens before and after compressive strength test.
2.2. Trial Mix Designs
This study aimed at determining the optimal mixture proportions of MSC for industryapplications. Several preliminary mixtures were prepared based on the variation of total aggregatescontent and sulfur cement, given as a percentage of the total volume of concrete. These variableswere used for conducting a 3ˆk factorial experiment with 2 factors, to model the influence of mixturecomponents on the compressive strength of the MSC in order to optimize the mixture design. Thesetwo factors were aggregate content and additive/sulfur ratio.
During the selection of levels for the analysis, i.e., maximum, intermediate, and minimum for thetwo variables, two conditions were implemented: condition 1 varying the aggregate content as 50, 60%,70%, and 80% without changing sulfur cement proportions (% additive/sulfur = 0.05), and condition 2varying the sulfur cement proportions with % additive/sulfur of 0.05, 0.10, 0.15 and 0.20. In both cases,two specimens were tested to determine the one-day compressive strength according to the ASTMC39 standard [26]. The range of sulfur cement and aggregate content in which the MSC mixturesperformed satisfactorily was identified considering (i) good workability, (ii) high compressive strength,and (iii) sample finishing. Tables 3 and 4 below show the results for average compressive strength forcondition 1 and 2 respectively.
Table 3. Compressive strength results–Condition 1.
Aggregate Content(% Volume)
Sulfur Cement(% Volume)
Average CompressiveStrength (MPa)
Standard Deviation(MPa)
80% 20% 14.48 0.3170% 30% 27.07 0.2160% 40% 24.28 1.0950% 50% 12.12 1.79
Table 4. Compressive strength results—Condition 2.
Additive/Sulfur Ratio Average Compressive Strength (MPa) Standard Deviation (MPa)
0.05 29.23 2.860.10 33.14 0.780.15 12.85 0.280.20 10.87 0.16
As shown in Table 3, an aggregate content of 70% in the MSC showed the highest compressivestrength; conversely, increasing the aggregate content up to 80% reduced the compressive strength,and the workability and handling experienced during placement were also significantly affected.Therefore, the range of this variable for the factorial design was selected as 60% to 70%, with 65%as an intermediate value. Also, as shown in Table 4, the additive/sulfur ratio showing the highest

Sustainability 2019, 11, 70 7 of 16
compressive strength was between 0.05 and 0.10; therefore, the range of values to be used in thefactorial design were selected as 0.05, 0.10, and 0.075 as the minimum, maximum, and intermediatevalue respectively.
2.3. Factorial Experiment
In order to optimize the mix design of MSC, a 3ˆk factorial experiment with 2 factors wasimplemented. This statistical approach was used to evaluate the interaction between different treatmentfactors with the compressive strength as the experimental response. In this case, the two factorswere aggregates content (A) and additive/sulfur ratio (B). Therefore, a 3ˆ2 factorial experiment wasdeveloped and each factor contained a high, low, and middle level, as shown in Table 5. The designmatrix for the experiment including the nine mixture proportions and the response data obtained fromfour replicates tested at 3 days are shown in Tables 6 and 7. Specimen dimensions of 15 cm in diameterand 30 cm in height were used in all cases.
Table 5. Factor Levels for factorial experiment.
Factor Level
Low Middle High
Aggregate content 60 65 70Additive/sulfur ratio 0.05 0.075 0.010
Table 6. Mixture proportions for the factorial experiment.
Additive/SulfurRatio
AggregateContent(%vol)
SulfurCement(%vol)
Sulfur(kg)
Additive(kg)
CoarseAggregate
(kg)
FineAggregate
A (kg)
FineAggregate
B (kg)
0.050 60% 40% 6.22 0.52 15.46 4.63 5.400.050 65% 35% 5.44 0.45 16.75 5.02 5.850.050 70% 30% 4.66 0.39 18.04 5.40 6.300.075 60% 40% 6.07 0.75 15.46 4.63 5.400.075 65% 35% 5.31 0.66 16.75 5.02 5.850.075 70% 30% 4.55 0.57 18.04 5.40 6.300.100 60% 40% 5.93 0.98 15.46 4.63 5.400.100 65% 35% 5.19 0.86 16.75 5.02 5.850.100 70% 30% 4.45 0.74 18.04 5.40 6.30
Table 7. Compressive strength test results for the factorial experiment (MPa).
Additive/SulfurAdditive/Sulfur
60 65 70
0.05025.06 23.05 27.54 32.56 24.26 27.0739.86 30.85 21.48 19.15 31.61 30.36
0.07536.11 30.36 23.57 27.52 29.84 33.8346.28 41.92 24.3 26.89 32.91 32.98
0.10035.80 32.55 31.96 29.55 34.83 36.8232.68 35.30 31.71 29.71 33.69 36.08
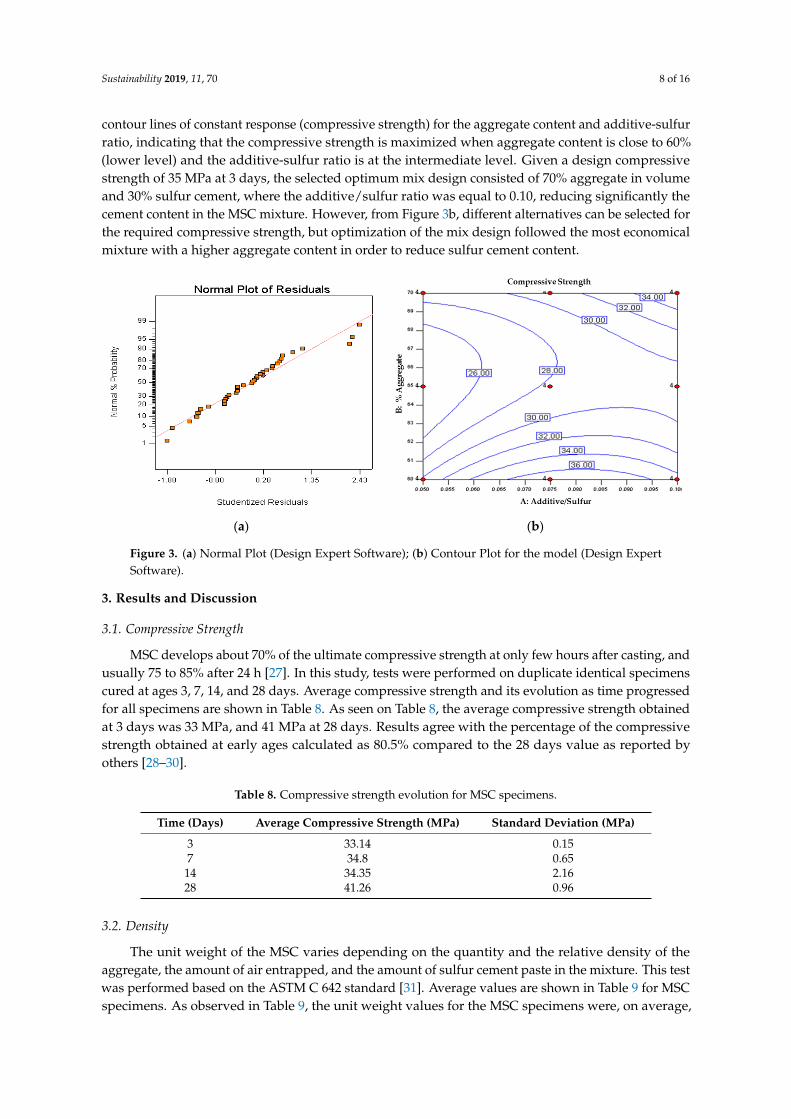
Analysis of the data is presented as a normal probability plot of the residuals, as shown inFigure 3a. The data in this plot lies reasonably close to the straight line, and only three residuals areshowing a value higher than 2, lending support to our hypothesis that the underlying assumptions ofthe analysis are satisfied. In order to better interpret the model and use the results to optimize the mixdesign of MSC, a graphic representation of the relationship between compressive strength and thetwo factors, aggregate content and additive/sulfur ratio, is shown in Figure 3b. This figure shows the
Sustainability 2019, 11, 70 8 of 16
contour lines of constant response (compressive strength) for the aggregate content and additive-sulfurratio, indicating that the compressive strength is maximized when aggregate content is close to 60%(lower level) and the additive-sulfur ratio is at the intermediate level. Given a design compressivestrength of 35 MPa at 3 days, the selected optimum mix design consisted of 70% aggregate in volumeand 30% sulfur cement, where the additive/sulfur ratio was equal to 0.10, reducing significantly thecement content in the MSC mixture. However, from Figure 3b, different alternatives can be selected forthe required compressive strength, but optimization of the mix design followed the most economicalmixture with a higher aggregate content in order to reduce sulfur cement content.
Sustainability 2018, 10, x FOR PEER REVIEW 9 of 18
Table 7. Compressive strength test results for the factorial experiment (MPa).
Additive/Sulfur Additive/Sulfur
60 65 70
0.050 25.06 23.05 27.54 32.56 24.26 27.07 39.86 30.85 21.48 19.15 31.61 30.36
0.075 36.11 30.36 23.57 27.52 29.84 33.83 46.28 41.92 24.3 26.89 32.91 32.98
0.100 35.80 32.55 31.96 29.55 34.83 36.82 32.68 35.30 31.71 29.71 33.69 36.08
Analysis of the data is presented as a normal probability plot of the residuals, as shown in Figure 3a. The data in this plot lies reasonably close to the straight line, and only three residuals are showing a value higher than 2, lending support to our hypothesis that the underlying assumptions of the analysis are satisfied. In order to better interpret the model and use the results to optimize the mix design of MSC, a graphic representation of the relationship between compressive strength and the two factors, aggregate content and additive/sulfur ratio, is shown in Figure 3b. This figure shows the contour lines of constant response (compressive strength) for the aggregate content and additive-sulfur ratio, indicating that the compressive strength is maximized when aggregate content is close to 60% (lower level) and the additive-sulfur ratio is at the intermediate level. Given a design compressive strength of 35 MPa at 3 days, the selected optimum mix design consisted of 70% aggregate in volume and 30% sulfur cement, where the additive/sulfur ratio was equal to 0.10, reducing significantly the cement content in the MSC mixture. However, from Figure 3b, different alternatives can be selected for the required compressive strength, but optimization of the mix design followed the most economical mixture with a higher aggregate content in order to reduce sulfur cement content.
(a)
(b)
Figure 3. (a) Normal Plot (Design Expert Software); (b) Contour Plot for the model (Design Expert Software).
3. Results and Discussion
3.1. Compressive Strength
MSC develops about 70% of the ultimate compressive strength at only few hours after casting, and usually 75 to 85% after 24 h [27]. In this study, tests were performed on duplicate identical specimens cured at ages 3, 7, 14, and 28 days. Average compressive strength and its evolution as time progressed for all specimens are shown in Table 8. As seen on Table 8, the average compressive strength obtained at 3 days was 33 MPa, and 41 MPa at 28 days. Results agree with the percentage of
Figure 3. (a) Normal Plot (Design Expert Software); (b) Contour Plot for the model (Design ExpertSoftware).
3. Results and Discussion
3.1. Compressive Strength
MSC develops about 70% of the ultimate compressive strength at only few hours after casting, andusually 75 to 85% after 24 h [27]. In this study, tests were performed on duplicate identical specimenscured at ages 3, 7, 14, and 28 days. Average compressive strength and its evolution as time progressedfor all specimens are shown in Table 8. As seen on Table 8, the average compressive strength obtainedat 3 days was 33 MPa, and 41 MPa at 28 days. Results agree with the percentage of the compressivestrength obtained at early ages calculated as 80.5% compared to the 28 days value as reported byothers [28–30].
Table 8. Compressive strength evolution for MSC specimens.
Time (Days) Average Compressive Strength (MPa) Standard Deviation (MPa)
3 33.14 0.157 34.8 0.65
14 34.35 2.1628 41.26 0.96
3.2. Density
The unit weight of the MSC varies depending on the quantity and the relative density of theaggregate, the amount of air entrapped, and the amount of sulfur cement paste in the mixture. This testwas performed based on the ASTM C 642 standard [31]. Average values are shown in Table 9 for MSCspecimens. As observed in Table 9, the unit weight values for the MSC specimens were, on average,

Sustainability 2019, 11, 70 9 of 16
between 2513–2594 kg/m3. For conventional PCC, the unit weight ranges from 2240–2400 kg/m3,making the MSC denser than conventional concrete as reported by others [11,29,30].
Table 9. Density for MSC specimens.
Time (Days) Average Density (kg/m3) Coeffıcient of Variation (CV)
3 2580 4%7 2594 4%
14 2529 2%28 2513 2%
3.3. Abrasion Resistance
Extensive literature reports have focused on the investigation of the abrasion resistance of PCC butfew data is available for MSC. The abrasion resistance of MSC is one of the most relevant advantagesof this material and it has been reported as twice that of the PCC [32]. Given that one of the majorapplications of MSC are industrial floors and pavements, this procedure aims to simulate the abrasiveservice loads under traffic, impact by equipment and other abrasive actions or chemicals on concretesurfaces by the sandblasting method using a sand that meets the type and size distribution givenin ASTM C 778 standard [33]. The abrasion test on MSC specimens was performed according tothe ASTM C 418 Standard [34]. For the test, the specimens were first immersed in water for 24 h,then the abrasion resistance of the test specimens was determined based on the volume loss of concretefrom a sandblasted area expressed in cubic centimeters per square centimeter, known as the abrasioncoefficient. The mass or volume loss on the concrete surface of the specimen after the test gives anindication about its resistance to abrasion (See Figure 4). An example of the results of the abrasion testare shown in Table 10, with an average abrasion coefficient of 0.22 cm3/cm2.Sustainability 2018, 10, x FOR PEER REVIEW 11 of 18
Figure 4. Appearance of MSC specimen surface after abrasion test.
Table 10. Example of abrasion test results for MSC specimens.
Cavity Volume (cm3) Affected Surface Area
(cm2)
Abrasion Coefficient (cm3/cm2)
1 14.87 44.34 0.34 2 9.91 52.26 0.19 3 9.91 46.91 0.21 4 14.87 56.19 0.26 5 9.91 42.33 0.23 6 14.87 55.62 0.27 7 9.91 109.49 0.09 8 14.87 77.25 0.19
Average abrasion coefficient (cm3/cm2) 0.22
3.4. Mass loss and Durability of MSC
The resulting durability of MSC samples was assessed by measuring the mass of the specimen at 3, 7, 14, and 28 days and comparing it with the initial value (before the immersion), as shown in Figure 5. The mass loss was calculated for MSC cylinders immersed in a sulfuric acid and ammonium sulfate solution of 40% H2SO4 and SO4 (NH4)2 respectively following the ASTM C 579 standard [35], and the results are shown in Table 11. Reported values of change of mass due to immersion were low, indicating that the samples, after being exposed to acid and sulfate environments, did not show any deterioration, as reported by others [7,36].
In order to further evaluate the effect of the acid- and sulfate-containing environments on the durability of MSC, two approaches were used: evaluation of the compressive strength test results after immersion in two solutions as time progressed, and in situ performance test of MSC slabs subjected to real industrial environment in a petrochemical plant located in the city of Barranquilla. The resulting deterioration of MSC was assessed by comparing the compressive strength results at different immersion times in the solutions evaluated in this study, as shown in Figure 6, and the compressive strength of control specimens immersed in regular water. The compressive strength loss was calculated, and results are shown in Table 11. The compressive strength results seem to be slightly affected by the immersion in the aggressive media, and the control specimens are showing similar behavior to the other samples as the immersion time increases, demonstrating the high chemical resistance of the MSC. The average mass values after immersion in solution were a little higher in both cases, but remained within expected values. Additionally, no cracks or deterioration were observed after specimens were subjected to the extreme exposure conditions of the test. Regarding the compressive strength results as shown in Table 11, average values decreased by 3–6%
Figure 4. Appearance of MSC specimen surface after abrasion test.
Table 10. Example of abrasion test results for MSC specimens.
Cavity Volume (cm3) Affected Surface Area (cm2) Abrasion Coefficient (cm3/cm2)
1 14.87 44.34 0.342 9.91 52.26 0.193 9.91 46.91 0.214 14.87 56.19 0.265 9.91 42.33 0.236 14.87 55.62 0.277 9.91 109.49 0.098 14.87 77.25 0.19
Average abrasion coefficient (cm3/cm2) 0.22

Sustainability 2019, 11, 70 10 of 16
3.4. Mass loss and Durability of MSC
The resulting durability of MSC samples was assessed by measuring the mass of the specimenat 3, 7, 14, and 28 days and comparing it with the initial value (before the immersion), as shown inFigure 5. The mass loss was calculated for MSC cylinders immersed in a sulfuric acid and ammoniumsulfate solution of 40% H2SO4 and SO4 (NH4)2 respectively following the ASTM C 579 standard [35],and the results are shown in Table 11. Reported values of change of mass due to immersion were low,indicating that the samples, after being exposed to acid and sulfate environments, did not show anydeterioration, as reported by others [7,36].
Sustainability 2018, 10, x FOR PEER REVIEW 12 of 18
in the 40% H2SO4 solution and 0.4–1.3% in the 40% SO4(NH4)2, similar to the results reported by others [4,7,8].
Figure 5. Change of mass due to immersion in chemical solutions.
12,500
12,750
13,000
13,250
13,500
13,750
14,000
14,250
14,500
3 7 14 28
Mas
s (g)
Inmersion time in chemical solution (days)
Before inmersion
After inmersion
40% H2SO4
Figure 5. Change of mass due to immersion in chemical solutions.
In order to further evaluate the effect of the acid- and sulfate-containing environments on thedurability of MSC, two approaches were used: evaluation of the compressive strength test resultsafter immersion in two solutions as time progressed, and in situ performance test of MSC slabssubjected to real industrial environment in a petrochemical plant located in the city of Barranquilla.

Sustainability 2019, 11, 70 11 of 16
The resulting deterioration of MSC was assessed by comparing the compressive strength results atdifferent immersion times in the solutions evaluated in this study, as shown in Figure 6, and thecompressive strength of control specimens immersed in regular water. The compressive strength losswas calculated, and results are shown in Table 11. The compressive strength results seem to be slightlyaffected by the immersion in the aggressive media, and the control specimens are showing similarbehavior to the other samples as the immersion time increases, demonstrating the high chemicalresistance of the MSC. The average mass values after immersion in solution were a little higherin both cases, but remained within expected values. Additionally, no cracks or deterioration wereobserved after specimens were subjected to the extreme exposure conditions of the test. Regardingthe compressive strength results as shown in Table 11, average values decreased by 3–6% in the 40%H2SO4 solution and 0.4–1.3% in the 40% SO4(NH4)2, similar to the results reported by others [4,7,8].Sustainability 2018, 10, x FOR PEER REVIEW 13 of 18
Figure 6. Compressive strength of MSC under different exposure conditions.
Prism-shaped samples with dimensions 40 × 40 × 7 cm3, as shown in Figure 7a, were prepared and located in an industrial environment where such chemical attacks usually take place (See Figure 7b). The specimens were monitored every 15 days for a month and then after 2 months of exposure in each test environment. Visual examination and qualitative description of the evolution of physical parameters such as color change, voids, or defects and appearance, were recorded at 1, 15, 30, and 60 days of exposure. In Figure 8, the surface condition of the test specimens after exposure to sulfuric acid and ammonium sulfate in chemical plants are shown as an indication of durability of MSC as time progresses.
The results indicate that after 60 days of exposure, the appearance of the slabs was slightly affected, revealing the exceptional durability of the MSC (See Figure 8a and 8b). Under these exposure conditions, a certain change in surface coloring was noted, although it was washed out easily. However, the slabs located at the ammonium sulfate plant (Figure 8b) revealed small defects as small cracks and local dissolution of the sulfur cement paste in areas where the surface presented initial defects such as pores and voids, which may be from poor compaction; however, this was limited and insignificant compared to the total area exposed. Additionally, given that the chemical concentrations at site locations are expected to be close to 100% and at higher temperatures than those of the laboratory specimens, the aggressiveness for these slabs was higher than for the laboratory test. Furthermore, under site conditions, the test solutions are changing with time; thus, more severe conditions are expected as a new solution is in direct contact with the specimen over time. Further confirmation of trends will be useful for future analyses and long-term performance evaluation of MSC structures in the case of in situ exposure, as such information is limited.
Figure 6. Compressive strength of MSC under different exposure conditions.
Prism-shaped samples with dimensions 40 × 40 × 7 cm3, as shown in Figure 7a, were preparedand located in an industrial environment where such chemical attacks usually take place (See Figure 7b).The specimens were monitored every 15 days for a month and then after 2 months of exposure ineach test environment. Visual examination and qualitative description of the evolution of physicalparameters such as color change, voids, or defects and appearance, were recorded at 1, 15, 30, and 60days of exposure. In Figure 8, the surface condition of the test specimens after exposure to sulfuricacid and ammonium sulfate in chemical plants are shown as an indication of durability of MSC astime progresses.

Sustainability 2019, 11, 70 12 of 16
Table 11. Durability test results by immersion of specimens in chemical solutions: Mass loss and compressive strength loss after immersion.
Time (Days) Solution Weight beforeImmersion (kg)
Weight afterImmersion (kg)
Mass Loss(%)
CompressiveStrength Control
(Mpa)
Compressive StrengthImmersion in Solution
(Mpa)
CompressiveStrength Loss (%)
3
40% H2SO4
13,515 13,518 0.02% 31.155 33.135 −5.97%7 13,305 13,355 0.38% 33.71 34.8 −3.01%
14 13,280 13,405 0.94% 36.75 34.345 6.91%28 13,530 13,555 0.19% 42.305 41.26 2.58%
3
40% SO4(NH4)2
13,260 13,288 0.21% 33.14 33.00 −0.41%7 13,580 13,665 0.63% 34.80 34.38 −1.27%
14 13,505 13,655 1.10% 34.35 34.58 1.09%28 13,745 13,855 0.80% 41.26 43.11 4.50%

Sustainability 2019, 11, 70 13 of 16Sustainability 2018, 10, x FOR PEER REVIEW 15 of 18
(a) (b) Figure 7. (a) Specimen configuration for in-situ durability test; (b) Specimen at test location.
Figure 8. (a) Specimen at test location –SO4 (NH4)2; (b) Specimen at test location –H2SO4.
4. Conclusions
The following conclusions can be made based on the experimental research results:
Figure 7. (a) Specimen configuration for in-situ durability test; (b) Specimen at test location.
Sustainability 2018, 10, x FOR PEER REVIEW 15 of 18
(a) (b) Figure 7. (a) Specimen configuration for in-situ durability test; (b) Specimen at test location.
Figure 8. (a) Specimen at test location –SO4 (NH4)2; (b) Specimen at test location –H2SO4.
4. Conclusions
The following conclusions can be made based on the experimental research results:
Figure 8. (a) Specimen at test location –SO4 (NH4)2; (b) Specimen at test location –H2SO4.
The results indicate that after 60 days of exposure, the appearance of the slabs was slightly affected,revealing the exceptional durability of the MSC (See Figure 8a,b). Under these exposure conditions, acertain change in surface coloring was noted, although it was washed out easily. However, the slabslocated at the ammonium sulfate plant (Figure 8b) revealed small defects as small cracks and local

Sustainability 2019, 11, 70 14 of 16
dissolution of the sulfur cement paste in areas where the surface presented initial defects such as poresand voids, which may be from poor compaction; however, this was limited and insignificant comparedto the total area exposed. Additionally, given that the chemical concentrations at site locations areexpected to be close to 100% and at higher temperatures than those of the laboratory specimens,the aggressiveness for these slabs was higher than for the laboratory test. Furthermore, under siteconditions, the test solutions are changing with time; thus, more severe conditions are expected as anew solution is in direct contact with the specimen over time. Further confirmation of trends will beuseful for future analyses and long-term performance evaluation of MSC structures in the case of insitu exposure, as such information is limited.
4. Conclusions
The following conclusions can be made based on the experimental research results:
• The optimal mix design of modified sulfur concrete consisted of an aggregate content of 70%of the total volume, with 61% of coarse aggregate, 17.6% of fine aggregate A, and 21.4% of fineaggregate B, and with an additive/sulfur ratio of 0.100.
• Statistical analysis of the mix design showed a threshold value for the additive/sulfur ratio andaggregate content at which the compressive strength and the workability of the MSC mixturereaches an optimum balance. Based on the factorial design, the threshold value is about 30% ofmodified sulfur cement, with an additive/sulfur ratio of 0.05.
• On the basis of the results obtained from the factorial experiment, different mixture designs ofMSC can be formulated depending on the desired compressive strength and to minimize cost.Results can be used to project optimal mix design for similar applications.
• Modified sulfur concrete reaches approximately 73% of the ultimate strength at one day of casting.This resistance continues to increase with time but at a lower rate. No significant change in theunit weight or compressive strength was observed for the specimens after the durability testin two aggressive media, demonstrating the high chemical resistance of the MSC. Compressivestrength results decreased by 3–6% in the 40% H2SO4 solution and 0.4–1.3% in the 40% SO4(NH4)2
similar to results reported by others.• In situ performance of MSC was assessed by exposure of prism-shaped samples to two aggressive
media located in chemical plants. Results indicate good performance of MSC elements up to60-days. Long-term performance is pending.
Author Contributions: The authors confirm contribution to the paper as follows: study concept and design: M.D.,J.T.; data collection: M.D.; analysis and interpretation of results: M.D., J.T., G.M.-A.; draft manuscript preparation:M.D., G.M.-A. All authors reviewed the results and approved the final version of the manuscript.
Funding: This research was funded by Departamento Administrativo de Ciencia, Tecnología e Innovación, grantnumber 745/2016.
Acknowledgments: The authors are grateful for the cooperation of the Company Monomeros ColomboVenezolanos S.A in providing the sulfur, additives and chemical solutions.
Conflicts of Interest: The authors declare no conflict of interest.
References
1. Available online: https://minerals.usgs.gov/minerals/pubs/commodity/sulfur/myb1-2015-sulfu.pdf(accessed on 24 August 2018).
2. Charlson, R.J.; Anderson, T.L.; McDuff, R.E. The sulfur cycle. Earth Syst. Sci. From biogeochem. Cycles Glob.Chang. 2000, 72, 343–359.
3. Available online: https://www.sulphurinstitute.org/learnmore/sulphur101.cfm (accessed on 24 August2018).
4. Vlahovic, M.M.; Martinovic, S.P.; Boljanac, T.D.; Jovanic, P.B.; Volkov-Husovic, T.D. Durability of sulfurconcrete in various aggressive environments. Constr. Build. Mater. 2011, 25, 3926–3934. [CrossRef]

Sustainability 2019, 11, 70 15 of 16
5. Available online: https://www.indexmundi.com/en/commodities/minerals/sulfur/sulfur_t11.html.(accessed on 24 August 2018).
6. Available online: http://www1.upme.gov.co/simco/Reportes_SIMCO/Paginas/MSPA1.aspx. (accessed on24 August 2018).
7. Shin, M.; Kim, K.; Gwon, S.W.; Cha, S. Durability of sustainable sulfur concrete with fly ash and recycledaggregate against chemical and weathering environments. Constr. Build. Mater. 2014, 69, 167–176. [CrossRef]
8. Vlahovic, M.M.; Savic, M.M.; Martinovic, S.P.; Boljanac, T.Đ.; Volkov-Husovic, T.D. Use of image analysis fordurability testing of sulfur concrete and Portland cement concrete. Mater. Des. 2012, 34, 346–354. [CrossRef]
9. Mc Bee, W.C.; Weber, H.H. Sulfur polymer cement concrete. In Proceedings of the Twelfth AtinualDepartment of Energy Low-Level Waste Management Conference, CONF-9008119, National Low-LevelWaste Management Program, Chicago, IL, USA, 28–29 August 1990; Idaho Natl. Engineering Lab.: IdahoFalls, ID, USA, 1990.
10. Moon, J.; Kalb, P.D.; Milian, L.; Northrup, P.A. Characterization of a sustainable sulfur polymer concreteusing activated fillers. Cem. Concr. Compos. 2016, 67, 20–29. [CrossRef]
11. Mohamed, A.M.O.; El-Gamal, M. Sulfur Concrete for the Construction Industry: A Sustainable DevelopmentApproach; J. Ross Publishing: Fort Lauderdale, FL, USA, 2010.
12. Mohamed, A.M.O.; El Gamal, M. Hydro-mechanical behavior of a newly developed sulfur polymer concrete.Cem. Concr. Compos. 2009, 31, 186–194. [CrossRef]
13. Bordoloi, B.K.; Pierce, E.M. Plastic Sulfur Stabilization by Copolymerization of Sulfur with Dicyclopentadiene;Advances in Chemistry Series no. 165; American Chemical Society: Washington, DC, USA, 1978; pp. 31–53.
14. Beaudoin, J.J.; Feldmant, R.F. Durability of porous systems impregnated with dicyclopentadiene-modifiedsulfur. Int. J. Cem. Compos. Lightweight Concr. 1984, 6, 13–17. [CrossRef]
15. Lin, S.L.; Lai, J.S.; Chian, E.S. Modifications of sulfur polymer cement (SPC) stabilization and solidification(S/S) process. Waste Manag. 1995, 15, 441–447. [CrossRef]
16. ASTM C 33: 2016. Standard Specification for Concrete Aggregates. Annual Book of ASTM Standards; ASTMInternational: West Conshohocken, PA, USA, 2003.
17. ASTM C 136: 2014. Standard Test Method for Sieve Analysis of Fine and Coarse Aggregates. Annual Book of ASTMStandards; ASTM International: West Conshohocken, PA, USA, 2014.
18. ASTM C 127: 2015. Standard Test Method for Density, Relative Density (Specific Gravity), and Absorption of CoarseAggregate. Annual Book of ASTM Standards; ASTM International: West Conshohocken, PA, USA, 2015.
19. ASTM C 128: 2015. Standard Test Method for Density, Relative Density (Specific Gravity), and Absorption of FineAggregate. Annual Book of ASTM Standards; ASTM International: West Conshohocken, PA, USA, 2015.
20. ASTM C 29: 2017. Standard Test Method for Bulk Density (“Unit Weight”) and Voids in Aggregate. Annual Book ofASTM Standards; ASTM International: West Conshohocken, PA, USA, 2017.
21. ASTM C 142/C 142M: 2017. Standard Test Method for Clay Lumps and Friable Particles in Aggregates. AnnualBook of ASTM Standards; ASTM International: West Conshohocken, PA, USA, 2017.
22. ASTM C 535: 2016. Standard Test Method for Resistance to Degradation of Large-Size Coarse Aggregate byAbrasion and Impact in the Los Angeles Machine. Annual Book of ASTM Standards; ASTM International: WestConshohocken, PA, USA, 2017.
23. ASTM C 1370: 2012. Standard Test Method for Determining Chemical Resistance of Aggregates for Use inChemical-Resistant Sulfur Polymer Cement Concrete and Other Chemical-Resistant Polymer Concretes. Annual Bookof ASTM Standards; ASTM International: West Conshohocken, PA, USA, 2012.
24. Fontana, J.J.; Farrell, L.J.; Alexanderson, J.; Ball, H.P., Jr.; Bartholomew, J.J.; Biswas, M.; DePuy, G.W. Guidefor Mixing and Placing Sulfur Concrete in Construction. 1998. Available online: http://civilwares.free.fr/ACI/MCP04/5482r_93.pdf (accessed on 23 December 2018).
25. ASTM D 3515: 1996. Standard Specification for Hot-Mixed, Hot-Laid Bituminous Paving Mixtures. Annual Book ofStandards. Annual Book of ASTM Standards; ASTM International: West Conshohocken, PA, USA, 1996.
26. ASTM C 39/C 39M: 2017. Standard Test Method for Compressive Strength of Cylindrical Concrete Specimens.Annual Book of Standards; ASTM International: West Conshohocken, PA, USA, 2017.
27. El Gamal, M.M.; El-Dieb, A.S.; Mohamed, A.M.O.; El Sawy, K.M. Performance of modified sulfur concreteexposed to actual sewerage environment with variable temperature, humidity and gases. J. Build. Eng. 2017,11, 1–8. [CrossRef]

Sustainability 2019, 11, 70 16 of 16
28. Loov, R.E.; Vroom, A.H.; Ward, M.A. Sulfur Concrete–A New Construction Material. J. Prestress. Concr. Inst.1974, 19, 86–95. [CrossRef]
29. Khademi, A.G.; Imani, H. Comparison of Sulfur Concrete, Cement Concrete and Cement-sulfur Concreteand their Properties and Application. Curr. World Environ. 2015, 10. [CrossRef]
30. Ciak, N.; Jankowski, D.; Ciak, M.J. The role of microfillers in shaping the sulphur concrete performance. Tech.Sci./Univ. Warmia Mazury Olsztyn 2015, 18, 171–178.
31. ASTM C 642: 2013. Standard Test Method for Density, Absorption, and Voids in Hardened Concrete. Annual Book ofStandards; ASTM International: West Conshohocken, PA, USA, 2013.
32. Crick, S.M.; Whitmore, D.W. Using sulfur concrete on a commercial scale. Concr. Int. 1998, 20, 83–86.33. ASTM C 778: 2012. Standard Specification for Standard Sand. Annual Book of Standards; ASTM International:
West Conshohocken, PA, USA, 2012.34. ASTM C 418: 2012. Standard Test Method for Abrasion Resistance of Concrete by Sandblasting. Annual Book of
Standards; ASTM International: West Conshohocken, PA, USA, 2012.35. ASTM C 579-01: 2012. Standard Test Methods for Compressive Strength of Chemical-Resistant Mortars,
Grouts, Monolithic Surfacings and Polymer Concretes. Annual Book of Standards; ASTM International: WestConshohocken, PA, USA, 2012.
36. Mohamed, A.-M.O.; El-Dieb, A.; El Sawy, K.M.L.; El Gamal, M.M. Durability of modified sulfur concrete insewerage environment. Environ. Geotech. 2015, 2, 95–103. [CrossRef]
© 2018 by the authors. Licensee MDPI, Basel, Switzerland. This article is an open accessarticle distributed under the terms and conditions of the Creative Commons Attribution(CC BY) license (http://creativecommons.org/licenses/by/4.0/).