experimental investigation of wind loads on multi span ... · types of roofs that are generally...
TRANSCRIPT
International Journal of Applied Engineering Research ISSN 0973-4562 Volume 13, Number 10 (2018) pp. 8413-8425
© Research India Publications. http://www.ripublication.com
8413
Experimental Investigation of Wind Loads on Multi Span Pitched Roof
Buildings
M.Rajiv
1Assistant professor, Department of Civil Engineering,
Saranathan College of Engineering, Trichy, Tamil Nadu, India.
Abstract
Structures of various types like bridges, towers, chimneys etc.
are designed for primary loads such as self weight,
superimposed loads, wind loads, earthquake forces. Some
structures are also designed for secondary loads/stresses such
as snow loads, creep and shrinkage effects, temperature
effects, soil and fluid pressures, and impact/erection loads etc
(IS: 456, IS:875 and IS: 1893).The evaluation of design wind
loads on various surfaces of a building requires information
about pressure coefficients and design wind speed. The values
of pressure coefficients on surfaces of canopies, roofs and
walls are normally determined by model studies performed in
wind tunnels or from the measurement on prototype. Roof is
the essential part of the building which provides protection to
the users from sunrays, wind, snow, dust and rain. Parameters
like wind velocity, wind direction, shape of building, its
height, slope of roof and permeability affect wind loads on
roofs. In this study, single, double and three span pitched roof
building models are taken and kept in open boundary layer
wind tunnel and the pressure coefficients on the surface of the
pitched roofs are calculated and compared with the
corresponding values prescribed in IS 875(Part 3).
INTRODUCTION
Evaluation of Wind Loads
The basic wind speed(Vb) for any locality is obtained from
Fig.1 of IS:875(Part 3) and shall be modified to include the
following effects to get design wind velocity at any height
(Vz) for the chosen structure:
a) Risk Level
b) Terrain roughness, height and size of structure; and
c) Local topography
It can be mathematically expressed as follows:
Vz=Vb k1 k2 k3
where
Vz=design wind speed at any height z in m/s;
k1=probability factor (risk coefficient)
k2=terrain, height and structure size factor
k3=topography factor
The design wind pressure at any particular altitude above
mean ground level is calculated by the following relationship
between wind pressure and wind velocity:
pd=0.6 Vz2
The wind load, F, acting in a direction normal to the
individual structural element or cladding unit is:
F=(Cpe-Cpi) A pd
where
Cpe=external pressure coefficient,
Cpi=internal pressure coefficient,
A=surface area of structural element or cladding unit,
pd=design wind pressure.
In the above formula, positive wind load signifies the force
acting towards the strucutral element and negative away from
it.
Internal pressure coefficients (Cpi) for a building or part of it
depends upon the degree of permeability of cladding to the
flow of air. The internal air pressure can be positive or
negative which depends on the direction of flow of air in
relation to openings in the buildings.
For openings upto 5% , Cpi = ± 0.2
For openings upto 20% , Cpi =± 0.5
For openings above 20% , Cpi =± 0.7
Parameters Affecting Wind Loads
Various parameters affecting wind loads on structures can be
broadly classified into two groups:
(i) Flow parameters
(ii) Structural parameters
(iii) Flow parameters
International Journal of Applied Engineering Research ISSN 0973-4562 Volume 13, Number 10 (2018) pp. 8413-8425
© Research India Publications. http://www.ripublication.com
8414
Flow parameters that affect wind loads on structures are as
follows:
(a) Wind Velocity
The design wind pressure or design wind loads on any
structure is directly proportional to the square of the design
wind velocity which in turn is determined from the basic wind
velocity after applying suitable modification factors as already
discussed.
(b) Direction of wind
The angle at which wind attacks a structure also affects the
wind pressure distribution on surfaces of the structure.
(c) Ground roughness or Turbulence
Ground roughness causes turbulence in the flow which in turn
affects the wind pressure values on surfaces of the structures.
(ii) Structural parameters
Various structural parameters which affect the wind loads on
structures are as follows:
(a) Shape of building
Shape of the building is influenced by the ratio of its
dimensions in plan, its height and roofing system.Various
types of roofs that are generally adopted are pitched roofs,
monoslope roofs, canopy roofs and curved roofs. Greater is
the height of the building, greater will be the wind load acting
on it.
(b) Slope of the roof
For a given span, if the slope of the roof is increased, surface
area of roof also increases and hence wind load on roof
member increases.
(c) Flexibility of building
If a building or structure or any part of it is flexible, it will
show large deformations under wind. It will inturn change the
shape of the building or structure resulting in change in wind
loads on it.
(d) Permeability
Internal air pressure in the building depends upon the degree
of permeability of the cladding to the flow of air. The internal
air pressure may be positive or negative depending upon the
direction of flow of air in relation to % of openings in the
buildings.
(e) Solidity ratio
It is equal to the effective area (projected area of all individual
elements) of a frame normal to the wind direction divided by
the area enclosed by the boundary of the frame normal to the
wind direction.Higher is the solidity ratio, greater will be the
wind load acting on it.
(f) Breadth and depth of the building
Greater is the breadth and depth of building, greater will be
the wind load acting on the structure.
(g) Shielding effect
High rise buildings are frequently constructed in groups with
the result that downstream building may be shielded by an
upstream one. The steady shear force and overturning moment
are usually reduced by the presence of a building on
windward side. Due to shielding, local wind velocities may be
increased.
(h) Effect of parapets
The addition of parapets reduces the magnitude of roof peak
suction coefficients but lower suction values remain
unaffected or increased only slightly. On the other hand,
parapets tend to increase the mean suction locally close to
roof corners.
PROPOSED RESEARCH WORK
In the present study, rigid models of multi span pitched roof
buildings are made and tested in wind tunnel to find wind
pressure distribution on such roofs. Models are tested as
single building block, two building blocks and up to three
building blocks placed adjacently. Rise to span ratio and
height to span ratio are kept constant and only the wind
incidence angle is varied. Results of the experimental program
are given in the form of tables, contours of wind pressure
coefficients in chapter three.
Recent Research Work
Many researchers all over the world are carrying out research
in the area of wind effects on low-rise and high-rise building
including those in India. However, no research publication is
available in the area of wind effects/loads on multi-span
pitched roof buildings.

International Journal of Applied Engineering Research ISSN 0973-4562 Volume 13, Number 10 (2018) pp. 8413-8425
© Research India Publications. http://www.ripublication.com
8415
Figure 1.1 Wind pressure coefficients on multi span pitched roof as per IS875(Part-3)
EXPERIMENTAL PROGRAMME
General
Experimental measurements of wind loads on structures can
be made either by testing full scale models or prototype in the
field or reduced scale models in the wind tunnels.
Measurement of the wind loads on structures in the field is
difficult but the wind tunnel technique is comparatively easier.
The present study involves testing of rigid scale models of
multi-span pitched roof building in the open circuit boundary
layer wind tunnel at Indian Institute of Technology Roorkee.
Details of Wind Tunnel
The wind tunnel used for the present study is an open circuit
type boundary layer wind tunnel with no thermal
stratification. It has a test section of 2mx2m cross section with
15 m length. Near the downstream edge of the test section, a
natural boundary layer of approximate depth 50 cm develops
due to the long length of the wind tunnel without any floor
roughening device. However, presence of barrier wall, vortex
generators and blocks help in obtaining the flow fields of
different velocity profiles and turbulence.
International Journal of Applied Engineering Research ISSN 0973-4562 Volume 13, Number 10 (2018) pp. 8413-8425
© Research India Publications. http://www.ripublication.com
8416
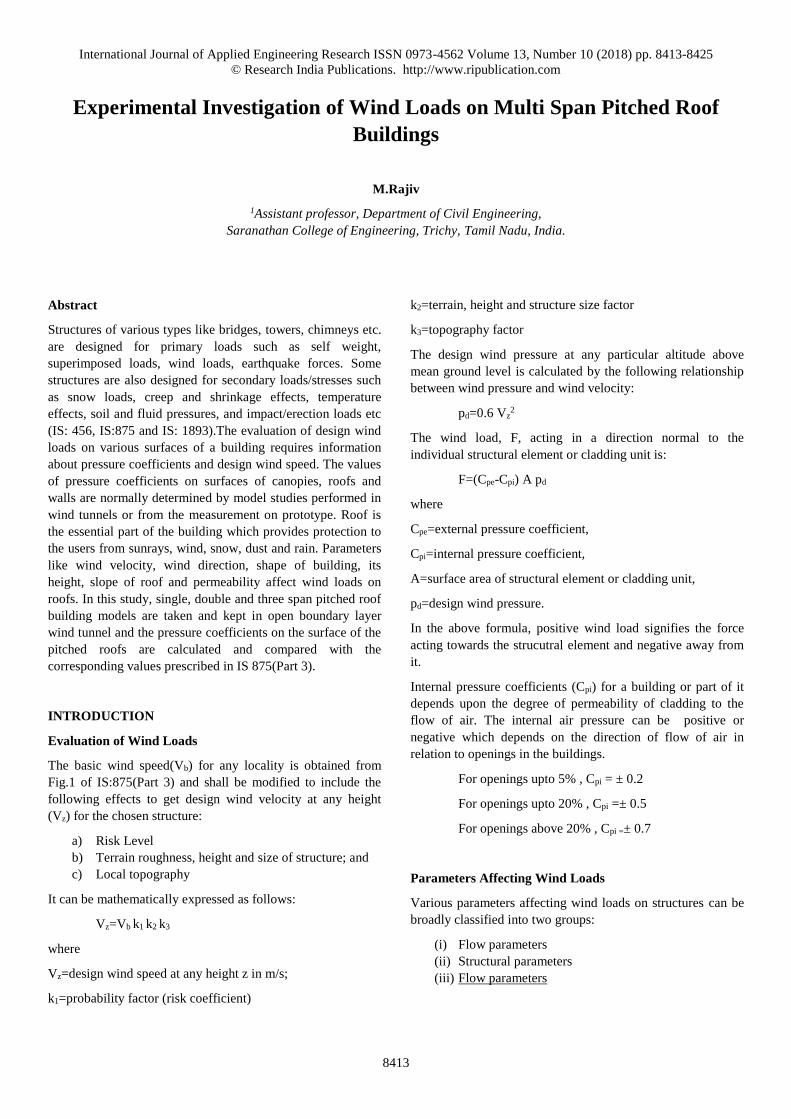
Details of Models
Models are made of Perspex sheet of thickness 5 mm. 45
pressure tapping points are there in each face A and B.
Stainless steel tube is inserted in the pressure tapping hole and
is covered by long PVC tube whose other end is connected to
the U-tube manometer. First a single model is tested followed
by two models and finally three models case. Models were of
length 300 mm, breadth 150 mm and height 100 mm. Roof
angle of the model is kept as 20.
Instrumentation
Pitot tube used in the present study is known as Prandtl-Pitot
tube. It is a combination of a total head tube and a static tube,
the latter measuring the piezometric head at the given point.
The head of the tube is well rounded to avoid separation of
flow and holes are provided on its shaft at such a place that
static pressure endures there. The two tubes are enclosed in
the same tube and are then connected to a differential
manometer which measures velocity head.
Manometers are devices used for measuring the fluid
pressures by balancing the pressure against a column of liquid
in static equilibrium. In the present study single U tube
manometer is used to measure the velocity and pressure
respectively. It is used to measure the velocity head by
connecting it to pitot tube or to measure the pressures on the
surfaces of model. Accuracy of pressure measurement can be
increased by inclining the measuring limb of the manometer.
Evaluation of wind Velocity and Pressure Coefficient
The wind velocity in the tunnel using the pitot tube and
inclined U-tube manometer is determined by the following
expression
V =√2𝑔. 𝛥ℎ𝑎𝑖𝑟
=√2𝑔. 𝛥ℎ𝑠𝑝𝑖𝑟𝑖𝑡 √𝜌𝑠𝑝𝑖𝑟𝑖𝑡
𝜌𝑎𝑖𝑟√sin 𝜑
Vm/sec=5.76√𝛥ℎ𝑠𝑝𝑖𝑟𝑖𝑡
where,
V=wind velocity in tunnel (m/sec)
Δhair=air head in U-tube manometer(cm)
Δhspirit=spirit head in U-tube manometer(cm)
Φ=inclination of manometer (15°)
ρspirit=density of spirit (789 kg/m3)
ρair=density of air (1.208 kg/m3)
Cp=33.16 𝛥ℎ𝑠𝑝𝑖𝑟𝑖𝑡
𝑉𝑟𝑒𝑓2
where Vref=reference wind velocity (m/sec)
Figure 2.1 Plan and Side Elevation of model
International Journal of Applied Engineering Research ISSN 0973-4562 Volume 13, Number 10 (2018) pp. 8413-8425
© Research India Publications. http://www.ripublication.com
8417
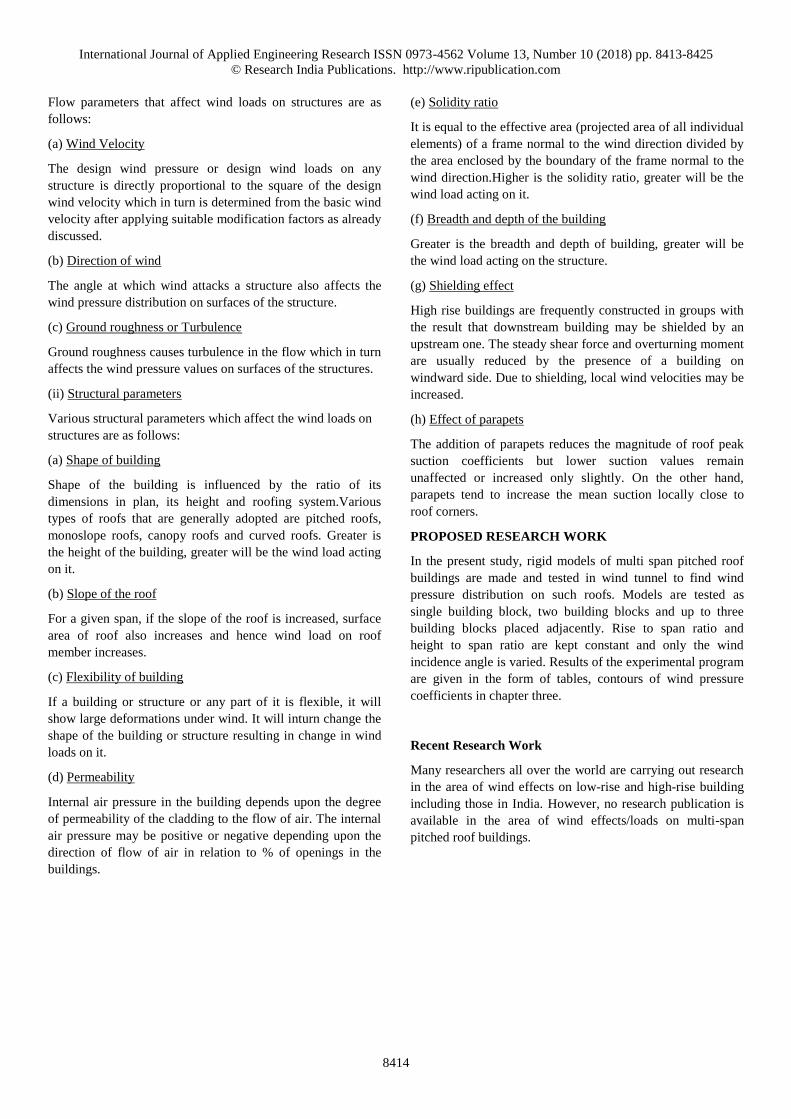
Figure 2.2 Flow Roughening Devices
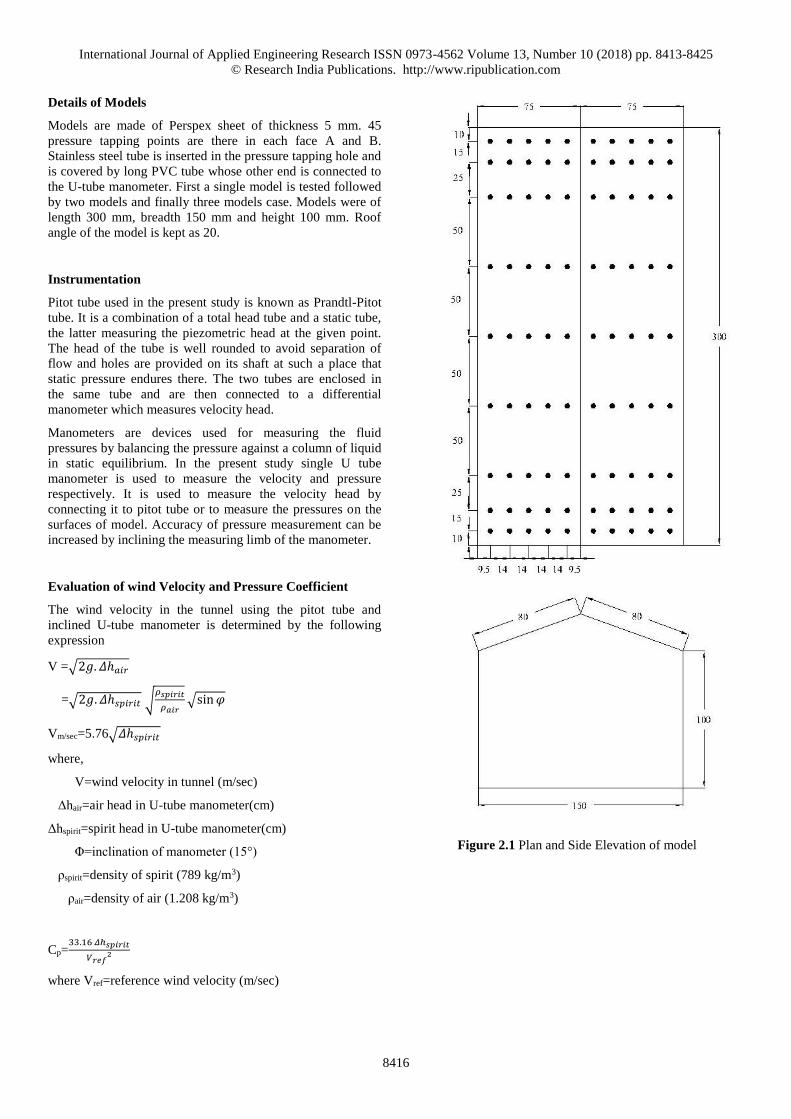
Figure 2.4 Turbine
Figure 2.3 Model of three span pitched roof building
Figure 2.5 Prandtl-Pitot tube
RESULTS AND DISCUSSIONS
General
This chapter deals with the results of wind tunnel tests on
rigid models of multi span pitched roof buildings. These
models have been tested in the boundary layer wind tunnel.
Mean value of the wind pressures on the roof surface of the
models have been calculated and presented in the form of
tables and contours.
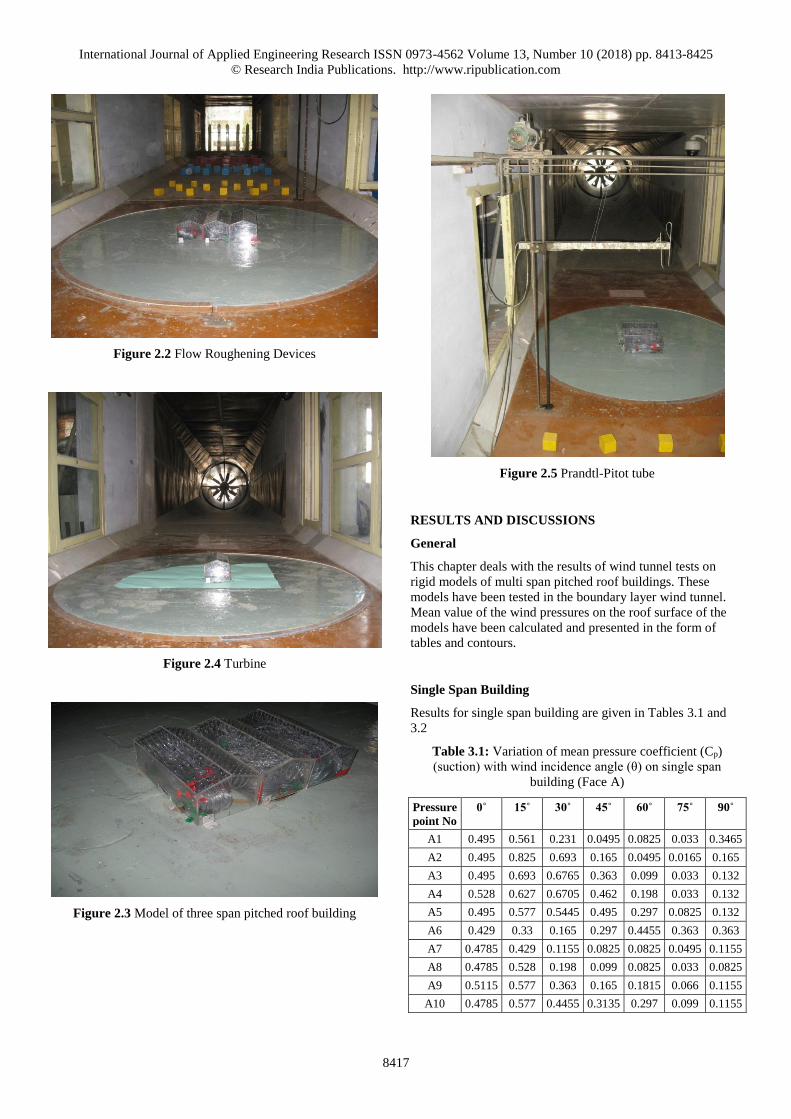
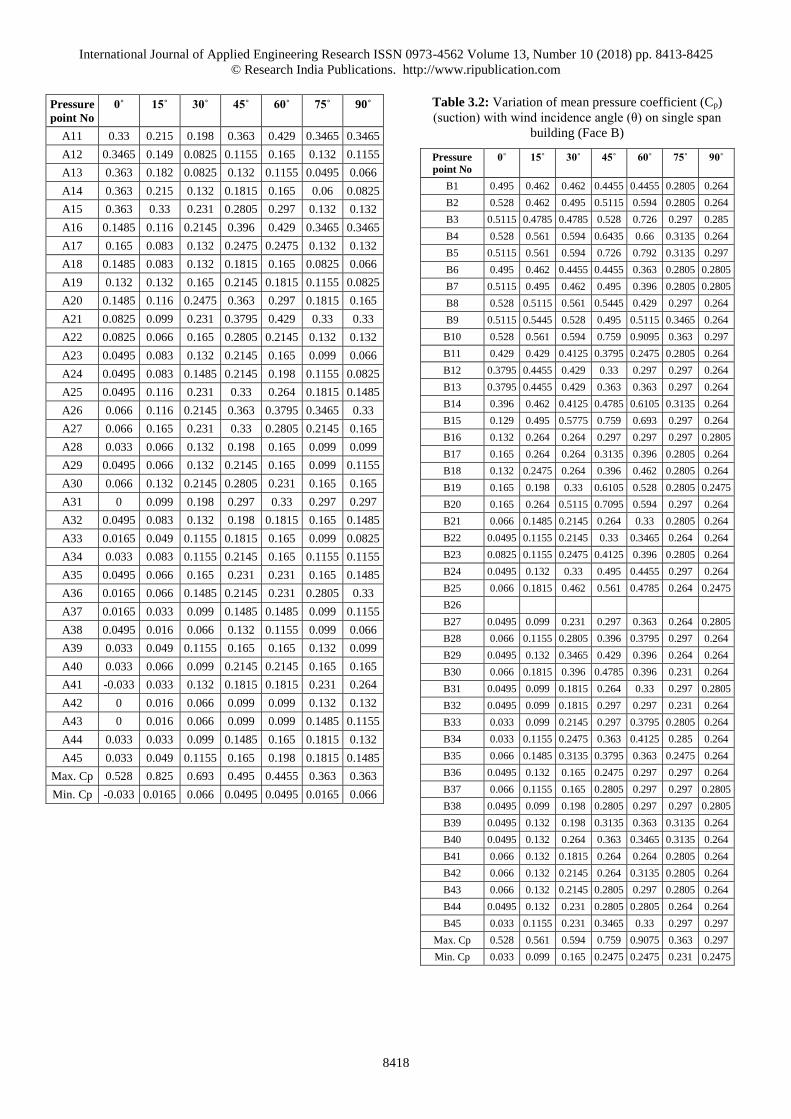
Single Span Building
Results for single span building are given in Tables 3.1 and
3.2
Table 3.1: Variation of mean pressure coefficient (Cp)
(suction) with wind incidence angle (θ) on single span
building (Face A)
Pressure
point No
0˚ 15˚ 30˚ 45˚ 60˚ 75˚ 90˚
A1 0.495 0.561 0.231 0.0495 0.0825 0.033 0.3465
A2 0.495 0.825 0.693 0.165 0.0495 0.0165 0.165
A3 0.495 0.693 0.6765 0.363 0.099 0.033 0.132
A4 0.528 0.627 0.6705 0.462 0.198 0.033 0.132
A5 0.495 0.577 0.5445 0.495 0.297 0.0825 0.132
A6 0.429 0.33 0.165 0.297 0.4455 0.363 0.363
A7 0.4785 0.429 0.1155 0.0825 0.0825 0.0495 0.1155
A8 0.4785 0.528 0.198 0.099 0.0825 0.033 0.0825
A9 0.5115 0.577 0.363 0.165 0.1815 0.066 0.1155
A10 0.4785 0.577 0.4455 0.3135 0.297 0.099 0.1155
International Journal of Applied Engineering Research ISSN 0973-4562 Volume 13, Number 10 (2018) pp. 8413-8425
© Research India Publications. http://www.ripublication.com
8418
Pressure
point No
0˚ 15˚ 30˚ 45˚ 60˚ 75˚ 90˚
A11 0.33 0.215 0.198 0.363 0.429 0.3465 0.3465
A12 0.3465 0.149 0.0825 0.1155 0.165 0.132 0.1155
A13 0.363 0.182 0.0825 0.132 0.1155 0.0495 0.066
A14 0.363 0.215 0.132 0.1815 0.165 0.06 0.0825
A15 0.363 0.33 0.231 0.2805 0.297 0.132 0.132
A16 0.1485 0.116 0.2145 0.396 0.429 0.3465 0.3465
A17 0.165 0.083 0.132 0.2475 0.2475 0.132 0.132
A18 0.1485 0.083 0.132 0.1815 0.165 0.0825 0.066
A19 0.132 0.132 0.165 0.2145 0.1815 0.1155 0.0825
A20 0.1485 0.116 0.2475 0.363 0.297 0.1815 0.165
A21 0.0825 0.099 0.231 0.3795 0.429 0.33 0.33
A22 0.0825 0.066 0.165 0.2805 0.2145 0.132 0.132
A23 0.0495 0.083 0.132 0.2145 0.165 0.099 0.066
A24 0.0495 0.083 0.1485 0.2145 0.198 0.1155 0.0825
A25 0.0495 0.116 0.231 0.33 0.264 0.1815 0.1485
A26 0.066 0.116 0.2145 0.363 0.3795 0.3465 0.33
A27 0.066 0.165 0.231 0.33 0.2805 0.2145 0.165
A28 0.033 0.066 0.132 0.198 0.165 0.099 0.099
A29 0.0495 0.066 0.132 0.2145 0.165 0.099 0.1155
A30 0.066 0.132 0.2145 0.2805 0.231 0.165 0.165
A31 0 0.099 0.198 0.297 0.33 0.297 0.297
A32 0.0495 0.083 0.132 0.198 0.1815 0.165 0.1485
A33 0.0165 0.049 0.1155 0.1815 0.165 0.099 0.0825
A34 0.033 0.083 0.1155 0.2145 0.165 0.1155 0.1155
A35 0.0495 0.066 0.165 0.231 0.231 0.165 0.1485
A36 0.0165 0.066 0.1485 0.2145 0.231 0.2805 0.33
A37 0.0165 0.033 0.099 0.1485 0.1485 0.099 0.1155
A38 0.0495 0.016 0.066 0.132 0.1155 0.099 0.066
A39 0.033 0.049 0.1155 0.165 0.165 0.132 0.099
A40 0.033 0.066 0.099 0.2145 0.2145 0.165 0.165
A41 -0.033 0.033 0.132 0.1815 0.1815 0.231 0.264
A42 0 0.016 0.066 0.099 0.099 0.132 0.132
A43 0 0.016 0.066 0.099 0.099 0.1485 0.1155
A44 0.033 0.033 0.099 0.1485 0.165 0.1815 0.132
A45 0.033 0.049 0.1155 0.165 0.198 0.1815 0.1485
Max. Cp 0.528 0.825 0.693 0.495 0.4455 0.363 0.363
Min. Cp -0.033 0.0165 0.066 0.0495 0.0495 0.0165 0.066
Table 3.2: Variation of mean pressure coefficient (Cp)
(suction) with wind incidence angle (θ) on single span
building (Face B)
Pressure
point No
0˚ 15˚ 30˚ 45˚ 60˚ 75˚ 90˚
B1 0.495 0.462 0.462 0.4455 0.4455 0.2805 0.264
B2 0.528 0.462 0.495 0.5115 0.594 0.2805 0.264
B3 0.5115 0.4785 0.4785 0.528 0.726 0.297 0.285
B4 0.528 0.561 0.594 0.6435 0.66 0.3135 0.264
B5 0.5115 0.561 0.594 0.726 0.792 0.3135 0.297
B6 0.495 0.462 0.4455 0.4455 0.363 0.2805 0.2805
B7 0.5115 0.495 0.462 0.495 0.396 0.2805 0.2805
B8 0.528 0.5115 0.561 0.5445 0.429 0.297 0.264
B9 0.5115 0.5445 0.528 0.495 0.5115 0.3465 0.264
B10 0.528 0.561 0.594 0.759 0.9095 0.363 0.297
B11 0.429 0.429 0.4125 0.3795 0.2475 0.2805 0.264
B12 0.3795 0.4455 0.429 0.33 0.297 0.297 0.264
B13 0.3795 0.4455 0.429 0.363 0.363 0.297 0.264
B14 0.396 0.462 0.4125 0.4785 0.6105 0.3135 0.264
B15 0.129 0.495 0.5775 0.759 0.693 0.297 0.264
B16 0.132 0.264 0.264 0.297 0.297 0.297 0.2805
B17 0.165 0.264 0.264 0.3135 0.396 0.2805 0.264
B18 0.132 0.2475 0.264 0.396 0.462 0.2805 0.264
B19 0.165 0.198 0.33 0.6105 0.528 0.2805 0.2475
B20 0.165 0.264 0.5115 0.7095 0.594 0.297 0.264
B21 0.066 0.1485 0.2145 0.264 0.33 0.2805 0.264
B22 0.0495 0.1155 0.2145 0.33 0.3465 0.264 0.264
B23 0.0825 0.1155 0.2475 0.4125 0.396 0.2805 0.264
B24 0.0495 0.132 0.33 0.495 0.4455 0.297 0.264
B25 0.066 0.1815 0.462 0.561 0.4785 0.264 0.2475
B26
B27 0.0495 0.099 0.231 0.297 0.363 0.264 0.2805
B28 0.066 0.1155 0.2805 0.396 0.3795 0.297 0.264
B29 0.0495 0.132 0.3465 0.429 0.396 0.264 0.264
B30 0.066 0.1815 0.396 0.4785 0.396 0.231 0.264
B31 0.0495 0.099 0.1815 0.264 0.33 0.297 0.2805
B32 0.0495 0.099 0.1815 0.297 0.297 0.231 0.264
B33 0.033 0.099 0.2145 0.297 0.3795 0.2805 0.264
B34 0.033 0.1155 0.2475 0.363 0.4125 0.285 0.264
B35 0.066 0.1485 0.3135 0.3795 0.363 0.2475 0.264
B36 0.0495 0.132 0.165 0.2475 0.297 0.297 0.264
B37 0.066 0.1155 0.165 0.2805 0.297 0.297 0.2805
B38 0.0495 0.099 0.198 0.2805 0.297 0.297 0.2805
B39 0.0495 0.132 0.198 0.3135 0.363 0.3135 0.264
B40 0.0495 0.132 0.264 0.363 0.3465 0.3135 0.264
B41 0.066 0.132 0.1815 0.264 0.264 0.2805 0.264
B42 0.066 0.132 0.2145 0.264 0.3135 0.2805 0.264
B43 0.066 0.132 0.2145 0.2805 0.297 0.2805 0.264
B44 0.0495 0.132 0.231 0.2805 0.2805 0.264 0.264
B45 0.033 0.1155 0.231 0.3465 0.33 0.297 0.297
Max. Cp 0.528 0.561 0.594 0.759 0.9075 0.363 0.297
Min. Cp 0.033 0.099 0.165 0.2475 0.2475 0.231 0.2475

International Journal of Applied Engineering Research ISSN 0973-4562 Volume 13, Number 10 (2018) pp. 8413-8425
© Research India Publications. http://www.ripublication.com
8419
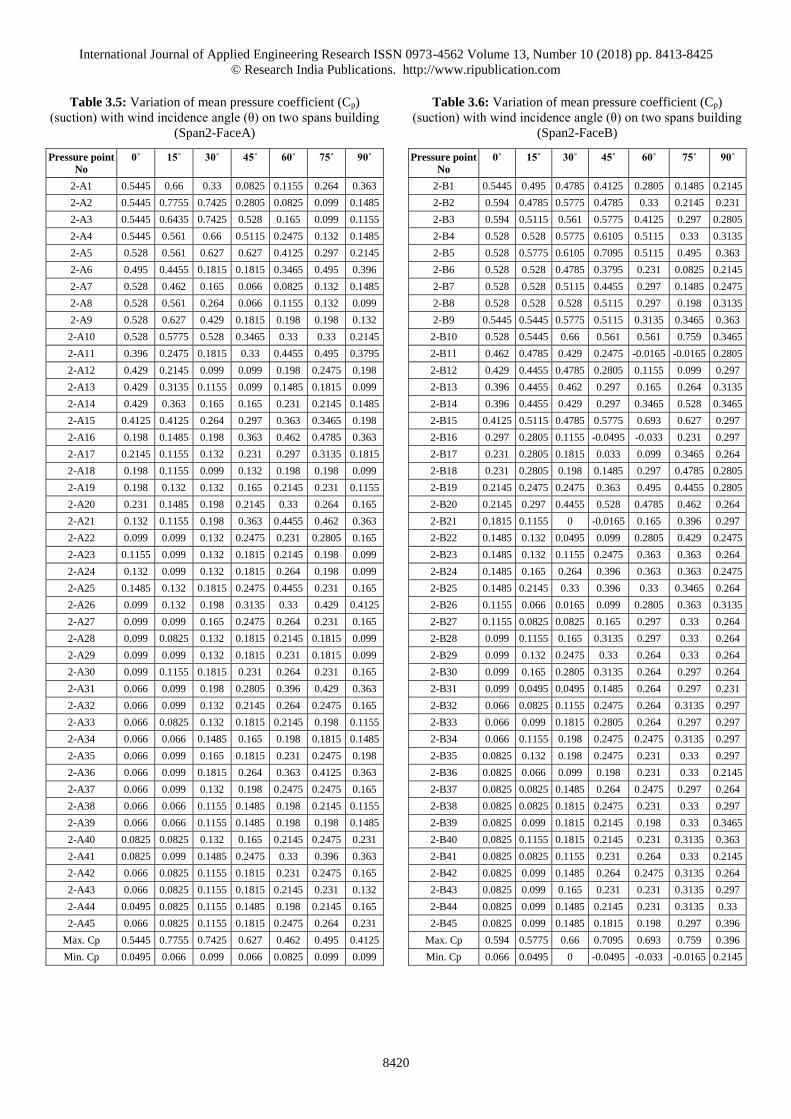
Two Span Building
Results for two span building are given in Tables 3.3 to 3.6
Table 3.3: Variation of mean pressure coefficient (Cp)
(suction) with wind incidence angle (θ) on two spans building
(Span1-FaceA)
Pressure
point No
0˚ 15˚ 30˚ 45˚ 60˚ 75˚ 90˚
1-A1 0.5445 0.561 0.462 0.3795 0.231 0.0825 0.1815
1-A2 0.594 0.726 0.561 0.33 0.198 0.0165 0.0825
1-A3 0.5775 0.7755 0.66 0.4125 0.198 0.0165 0.066
1-A4 0.561 0.6435 0.6105 0.396 0.264 0.066 0.066
1-A5 0.561 0.5775 0.495 0.363 0.33 0.132 0.066
1-A6 0.5445 0.5115 0.462 0.3465 0.2475 0.0165 0.1198
1-A7 0.5115 0.462 0.4125 0.297 0.198 0 0.132
1-A8 0.528 0.4785 0.363 0.231 0.198 0.033 0.066
1-A9 0.528 0.528 0.396 0.231 0.2145 0.066 0.0495
1-A10 0.5115 0.5445 0.429 0.264 0.297 0.165 0.0825
1-A11 0.4785 0.4785 0.4455 0.2145 -0.0495 -0.165 0.2475
1-A12 0.396 0.4125 0.3465 0.231 0.099 -0.1155 0.165
1-A13 0.396 0.363 0.2805 0.231 0.1815 -0.066 0.099
1-A14 0.396 0.3465 0.2805 0.231 0.2475 0 0.0495
1-A15 0.4125 0.396 0.3135 0.264 0.3465 0.115 0.0825
1-A16 0.2805 0.33 0.132 -0.0495 0 0.099 0.264
1-A17 0.2475 0.264 0.198 0.033 -0.0165 -0.0495 0.264
1-A18 0.231 0.2475 0.2475 0.099 0.0165 -0.066 0.2145
1-A19 0.198 0.2475 0.2805 0.1485 0.115 -0.0165 0.165
1-A20 0.231 0.264 0.3135 -0.033 0.264 0.099 0.165
1-A21 0.1815 0.198 0.0165 0 0.1485 0.2475 0.2475
1-A22 0.132 0.1485 0.033 -0.033 0.0165 0.165 0.2475
1-A23 0.132 0.1815 0.1155 0.033 0.0495 0.066 0.231
1-A24 0.132 0.1815 0.165 0.099 0.1155 0.0495 0.198
1-A25 0.1485 0.2145 0.2805 0.231 0.264 0.099 0.1815
1-A26 0.1155 0.0825 0.033 0.0495 0.2475 0.297 0.2805
1-A27 0.132 0.1485 0.1155 0.099 0.2805 0.33 0.264
1-A28 0.099 0.1155 0.0825 0.033 0.099 0.198 0.198
1-A29 0.099 0.1155 0.1155 0.099 0.1155 0.1485 0.1485
1-A30 0.099 0.1815 0.2145 0.231 0.231 0.1815 0.1815
1-A31 0.0825 0.0495 0.033 0.099 0.297 0.2805 0.198
1-A32 0.0825 0.0825 0.0495 0.099 0.2475 0.264 0.1155
1-A33 0.0825 0.0825 0.0495 0.033 0.1815 0.2145 0.099
1-A34 0.0825 0.1155 0.099 0.066 0.165 0.198 0.0495
1-A35 0.0825 0.132 0.1485 0.1485 0.2145 0.198 0.1155
1-A36 0.066 0.0495 0.0495 0.132 0.2475 0.2475 0.1485
1-A37 0.0825 0.0495 0.0495 0.099 0.2475 0.231 0.0825
1-A38 0.0825 0.0825 0.066 0.066 0.198 0.198 0.0495
1-A39 0.0825 0.0825 0.0825 0.099 0.1815 0.165 0.0495
1-A40 0.0825 0.1155 0.132 0.132 0.2145 0.198 0.1155
1-A41 0.066 0.066 0.0825 0.165 0.2475 0.264 0.1485
1-A42 0.0825 0.0825 0.0825 0.099 0.231 0.2475 0.0825
1-A43 0.0825 0.0825 0.066 0.099 0.1815 0.198 0.033
1-A44 0.0825 0.0825 0.1155 0.099 0.1815 0.1815 0.033
1-A45 0.0825 0.1155 0.1155 0.132 0.1815 0.165 0.099
Max. Cp 0.594 0.7755 0.66 0.4125 0.3465 0.33 0.2805
Min. Cp 0.066 0.0495 0.0165 -0.0495 -0.0495 -0.165 0.033
Table 3.4: Variation of mean pressure coefficient (Cp)
(suction) with wind incidence angle (θ) on two spans building
(Span1-FaceB)
Pressure point
No
0˚ 15˚ 30˚ 45˚ 60˚ 75˚ 90˚
1-B1 0.5445 0.5115 0.4455 0.4125 0.363 0.198 0.132
1-B2 0.495 0.5115 0.4455 0.3795 0.3795 0.2475 0.1485
1-B3 0.5115 0.495 0.4455 0.396 0.528 0.33 0.2145
1-B4 0.5115 0.495 0.4455 0.396 0.5445 0.3135 0.2475
1-B5 0.5115 0.528 0.4455 0.4455 0.627 0.5445 0.396
1-B6 0.495 0.4785 0.4125 0.3795 0.3465 0.1485 0.0825
1-B7 0.528 0.5115 0.4455 0.3465 0.3795 0.1815 0.132
1-B8 0.5445 0.528 0.4455 0.4125 0.4125 0.231 0.1815
1-B9 0.5115 0.528 0.3465 0.396 0.495 0.363 0.2805
1-B10 0.5115 0.5115 0.264 0.528 0.7425 0.528 0.363
1-B11 0.4125 0.4125 0.396 0.3465 0.297 0.1485 0.099
1-B12 0.4125 0.429 0.396 0.33 0.3135 0.198 0.1155
1-B13 0.462 0.4455 0.4125 0.3465 0.363 0.3135 0.1815
1-B14 0.4455 0.4455 0.4125 0.396 0.528 0.396 0.2475
1-B15 0.495 0.528 0.462 0.4455 0.7095 0.396 0.33
1-B16 0.2145 0.3465 0.3135 0.2805 0.2805 0.1815 0.099
1-B17 0.2145 0.33 0.3465 0.2970 0.3135 0.2475 0.1155
1-B18 0.198 0.3135 0.3135 0.3135 0.4125 0.3135 0.1155
1-B19 0.2145 0.3135 0.3465 0.396 0.5445 0.3135 0.1815
1-B20 0.2475 0.33 0.4125 0.5115 0.726 0.3465 0.231
1-B21 0.1155 0.2475 0.2475 0.5115 0.264 0.165 0.0825
1-B22 0.1155 0.2145 0.264 0.264 0.33 0.2145 0.099
1-B23 0.1155 0.2277 0.2805 0.297 0.4125 0.264 0.1155
1-B24 0.1155 0.231 0.3135 0.3795 0.5115 0.264 0.165
1-B25 0.132 0.2475 0.4455 0.5775 0.6105 0.33 0.1815
1-B26
1-B27 0.099 0.1815 0.2145 0.231 0.3135 0.1815 0.1155
1-B28 0.099 0.1815 0.2475 0.297 0.3795 0.198 0.1155
1-B29 0.099 0.198 0.3135 0.396 0.462 0.2475 0.165
1-B30 0.099 0.2475 0.429 0.561 0.5445 0.2805 0.2145
1-B31 0.099 0.1485 0.1485 0.1815 0.2475 0.1485 0.0825
1-B32 0.0825 0.1485 0.1815 0.2145 0.264 0.1485 0.1155
1-B33 0.066 0.1485 0.1815 0.264 0.3135 0.1815 0.165
1-B34 0.099 0.1485 0.2475 0.33 0.3465 0.2145 0.2145
1-B35 0.0825 0.2145 0.3465 0.3795 0.4125 0.264 0.33
1-B36 0.0825 0.1485 0.1485 0.1815 0.2145 0.1485 0.099
1-B37 0.0825 0.1485 0.1485 0.1815 0.2475 0.1485 0.099
1-B38 0.066 0.1485 0.165 0.2145 0.2475 0.1815 0.1485
1-B39 0.066 0.1485 0.2145 0.2475 0.297 0.198 0.2475
1-B40 0.0825 0.1815 0.2805 0.297 0.363 0.264 0.363
1-B41 0.0825 0.1485 0.165 0.1815 0.231 0.1485 0.1155
1-B42 0.099 0.132 0.165 0.198 0.264 0.165 0.132
1-B43 0.099 0.132 0.165 0.198 0.264 0.1815 0.1815
1-B44 0.099 0.1485 0.165 0.231 0.2805 0.2145 0.2145
1-B45 0.099 0.1485 0.231 0.297 0.3135 0.231 0.3465
Max. Cp 0.5445 0.528 0.462 0.5775 0.7425 0.5445 0.396
Min. Cp 0.066 0.132 0.1485 0.1815 0.2145 0.1485 0.0825
International Journal of Applied Engineering Research ISSN 0973-4562 Volume 13, Number 10 (2018) pp. 8413-8425
© Research India Publications. http://www.ripublication.com
8420
Table 3.5: Variation of mean pressure coefficient (Cp)
(suction) with wind incidence angle (θ) on two spans building
(Span2-FaceA)
Pressure point
No
0˚ 15˚ 30˚ 45˚ 60˚ 75˚ 90˚
2-A1 0.5445 0.66 0.33 0.0825 0.1155 0.264 0.363
2-A2 0.5445 0.7755 0.7425 0.2805 0.0825 0.099 0.1485
2-A3 0.5445 0.6435 0.7425 0.528 0.165 0.099 0.1155
2-A4 0.5445 0.561 0.66 0.5115 0.2475 0.132 0.1485
2-A5 0.528 0.561 0.627 0.627 0.4125 0.297 0.2145
2-A6 0.495 0.4455 0.1815 0.1815 0.3465 0.495 0.396
2-A7 0.528 0.462 0.165 0.066 0.0825 0.132 0.1485
2-A8 0.528 0.561 0.264 0.066 0.1155 0.132 0.099
2-A9 0.528 0.627 0.429 0.1815 0.198 0.198 0.132
2-A10 0.528 0.5775 0.528 0.3465 0.33 0.33 0.2145
2-A11 0.396 0.2475 0.1815 0.33 0.4455 0.495 0.3795
2-A12 0.429 0.2145 0.099 0.099 0.198 0.2475 0.198
2-A13 0.429 0.3135 0.1155 0.099 0.1485 0.1815 0.099
2-A14 0.429 0.363 0.165 0.165 0.231 0.2145 0.1485
2-A15 0.4125 0.4125 0.264 0.297 0.363 0.3465 0.198
2-A16 0.198 0.1485 0.198 0.363 0.462 0.4785 0.363
2-A17 0.2145 0.1155 0.132 0.231 0.297 0.3135 0.1815
2-A18 0.198 0.1155 0.099 0.132 0.198 0.198 0.099
2-A19 0.198 0.132 0.132 0.165 0.2145 0.231 0.1155
2-A20 0.231 0.1485 0.198 0.2145 0.33 0.264 0.165
2-A21 0.132 0.1155 0.198 0.363 0.4455 0.462 0.363
2-A22 0.099 0.099 0.132 0.2475 0.231 0.2805 0.165
2-A23 0.1155 0.099 0.132 0.1815 0.2145 0.198 0.099
2-A24 0.132 0.099 0.132 0.1815 0.264 0.198 0.099
2-A25 0.1485 0.132 0.1815 0.2475 0.4455 0.231 0.165
2-A26 0.099 0.132 0.198 0.3135 0.33 0.429 0.4125
2-A27 0.099 0.099 0.165 0.2475 0.264 0.231 0.165
2-A28 0.099 0.0825 0.132 0.1815 0.2145 0.1815 0.099
2-A29 0.099 0.099 0.132 0.1815 0.231 0.1815 0.099
2-A30 0.099 0.1155 0.1815 0.231 0.264 0.231 0.165
2-A31 0.066 0.099 0.198 0.2805 0.396 0.429 0.363
2-A32 0.066 0.099 0.132 0.2145 0.264 0.2475 0.165
2-A33 0.066 0.0825 0.132 0.1815 0.2145 0.198 0.1155
2-A34 0.066 0.066 0.1485 0.165 0.198 0.1815 0.1485
2-A35 0.066 0.099 0.165 0.1815 0.231 0.2475 0.198
2-A36 0.066 0.099 0.1815 0.264 0.363 0.4125 0.363
2-A37 0.066 0.099 0.132 0.198 0.2475 0.2475 0.165
2-A38 0.066 0.066 0.1155 0.1485 0.198 0.2145 0.1155
2-A39 0.066 0.066 0.1155 0.1485 0.198 0.198 0.1485
2-A40 0.0825 0.0825 0.132 0.165 0.2145 0.2475 0.231
2-A41 0.0825 0.099 0.1485 0.2475 0.33 0.396 0.363
2-A42 0.066 0.0825 0.1155 0.1815 0.231 0.2475 0.165
2-A43 0.066 0.0825 0.1155 0.1815 0.2145 0.231 0.132
2-A44 0.0495 0.0825 0.1155 0.1485 0.198 0.2145 0.165
2-A45 0.066 0.0825 0.1155 0.1815 0.2475 0.264 0.231
Max. Cp 0.5445 0.7755 0.7425 0.627 0.462 0.495 0.4125
Min. Cp 0.0495 0.066 0.099 0.066 0.0825 0.099 0.099
Table 3.6: Variation of mean pressure coefficient (Cp)
(suction) with wind incidence angle (θ) on two spans building
(Span2-FaceB)
Pressure point
No
0˚ 15˚ 30˚ 45˚ 60˚ 75˚ 90˚
2-B1 0.5445 0.495 0.4785 0.4125 0.2805 0.1485 0.2145
2-B2 0.594 0.4785 0.5775 0.4785 0.33 0.2145 0.231
2-B3 0.594 0.5115 0.561 0.5775 0.4125 0.297 0.2805
2-B4 0.528 0.528 0.5775 0.6105 0.5115 0.33 0.3135
2-B5 0.528 0.5775 0.6105 0.7095 0.5115 0.495 0.363
2-B6 0.528 0.528 0.4785 0.3795 0.231 0.0825 0.2145
2-B7 0.528 0.528 0.5115 0.4455 0.297 0.1485 0.2475
2-B8 0.528 0.528 0.528 0.5115 0.297 0.198 0.3135
2-B9 0.5445 0.5445 0.5775 0.5115 0.3135 0.3465 0.363
2-B10 0.528 0.5445 0.66 0.561 0.561 0.759 0.3465
2-B11 0.462 0.4785 0.429 0.2475 -0.0165 -0.0165 0.2805
2-B12 0.429 0.4455 0.4785 0.2805 0.1155 0.099 0.297
2-B13 0.396 0.4455 0.462 0.297 0.165 0.264 0.3135
2-B14 0.396 0.4455 0.429 0.297 0.3465 0.528 0.3465
2-B15 0.4125 0.5115 0.4785 0.5775 0.693 0.627 0.297
2-B16 0.297 0.2805 0.1155 -0.0495 -0.033 0.231 0.297
2-B17 0.231 0.2805 0.1815 0.033 0.099 0.3465 0.264
2-B18 0.231 0.2805 0.198 0.1485 0.297 0.4785 0.2805
2-B19 0.2145 0.2475 0.2475 0.363 0.495 0.4455 0.2805
2-B20 0.2145 0.297 0.4455 0.528 0.4785 0.462 0.264
2-B21 0.1815 0.1155 0 -0.0165 0.165 0.396 0.297
2-B22 0.1485 0.132 0.0495 0.099 0.2805 0.429 0.2475
2-B23 0.1485 0.132 0.1155 0.2475 0.363 0.363 0.264
2-B24 0.1485 0.165 0.264 0.396 0.363 0.363 0.2475
2-B25 0.1485 0.2145 0.33 0.396 0.33 0.3465 0.264
2-B26 0.1155 0.066 0.0165 0.099 0.2805 0.363 0.3135
2-B27 0.1155 0.0825 0.0825 0.165 0.297 0.33 0.264
2-B28 0.099 0.1155 0.165 0.3135 0.297 0.33 0.264
2-B29 0.099 0.132 0.2475 0.33 0.264 0.33 0.264
2-B30 0.099 0.165 0.2805 0.3135 0.264 0.297 0.264
2-B31 0.099 0.0495 0.0495 0.1485 0.264 0.297 0.231
2-B32 0.066 0.0825 0.1155 0.2475 0.264 0.3135 0.297
2-B33 0.066 0.099 0.1815 0.2805 0.264 0.297 0.297
2-B34 0.066 0.1155 0.198 0.2475 0.2475 0.3135 0.297
2-B35 0.0825 0.132 0.198 0.2475 0.231 0.33 0.297
2-B36 0.0825 0.066 0.099 0.198 0.231 0.33 0.2145
2-B37 0.0825 0.0825 0.1485 0.264 0.2475 0.297 0.264
2-B38 0.0825 0.0825 0.1815 0.2475 0.231 0.33 0.297
2-B39 0.0825 0.099 0.1815 0.2145 0.198 0.33 0.3465
2-B40 0.0825 0.1155 0.1815 0.2145 0.231 0.3135 0.363
2-B41 0.0825 0.0825 0.1155 0.231 0.264 0.33 0.2145
2-B42 0.0825 0.099 0.1485 0.264 0.2475 0.3135 0.264
2-B43 0.0825 0.099 0.165 0.231 0.231 0.3135 0.297
2-B44 0.0825 0.099 0.1485 0.2145 0.231 0.3135 0.33
2-B45 0.0825 0.099 0.1485 0.1815 0.198 0.297 0.396
Max. Cp 0.594 0.5775 0.66 0.7095 0.693 0.759 0.396
Min. Cp 0.066 0.0495 0 -0.0495 -0.033 -0.0165 0.2145
International Journal of Applied Engineering Research ISSN 0973-4562 Volume 13, Number 10 (2018) pp. 8413-8425
© Research India Publications. http://www.ripublication.com
8421
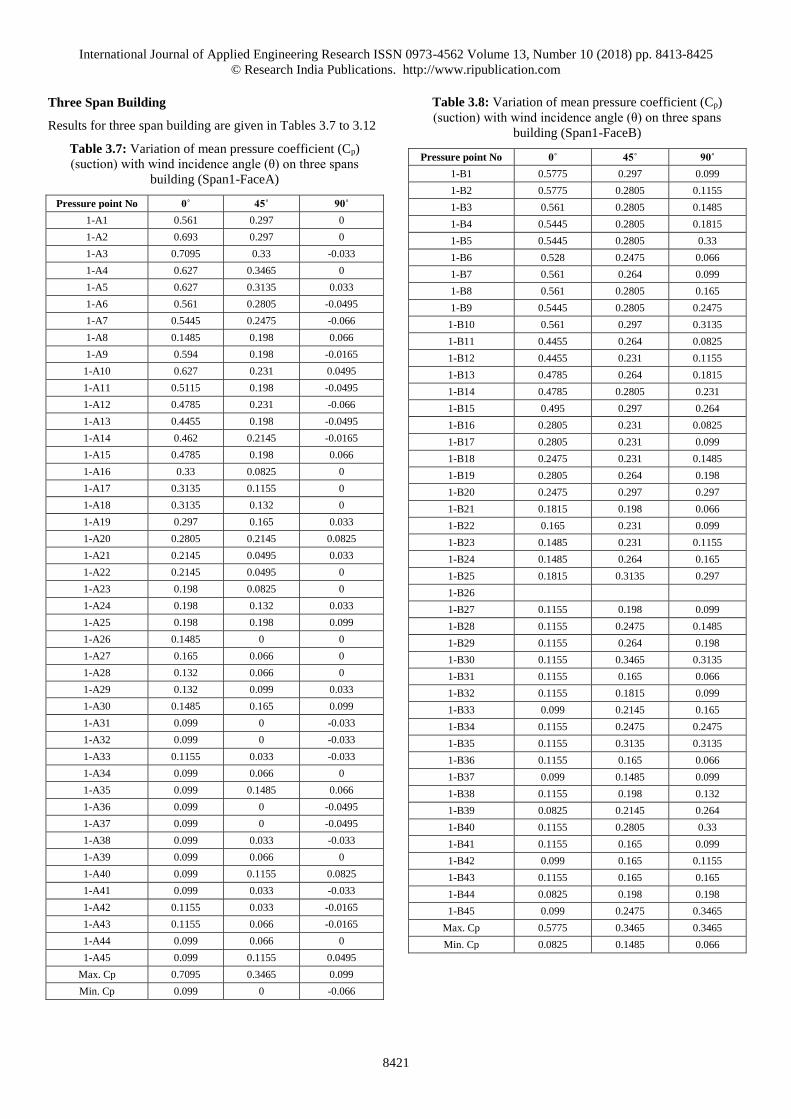
Three Span Building
Results for three span building are given in Tables 3.7 to 3.12
Table 3.7: Variation of mean pressure coefficient (Cp)
(suction) with wind incidence angle (θ) on three spans
building (Span1-FaceA)
Pressure point No 0˚ 45˚ 90˚
1-A1 0.561 0.297 0
1-A2 0.693 0.297 0
1-A3 0.7095 0.33 -0.033
1-A4 0.627 0.3465 0
1-A5 0.627 0.3135 0.033
1-A6 0.561 0.2805 -0.0495
1-A7 0.5445 0.2475 -0.066
1-A8 0.1485 0.198 0.066
1-A9 0.594 0.198 -0.0165
1-A10 0.627 0.231 0.0495
1-A11 0.5115 0.198 -0.0495
1-A12 0.4785 0.231 -0.066
1-A13 0.4455 0.198 -0.0495
1-A14 0.462 0.2145 -0.0165
1-A15 0.4785 0.198 0.066
1-A16 0.33 0.0825 0
1-A17 0.3135 0.1155 0
1-A18 0.3135 0.132 0
1-A19 0.297 0.165 0.033
1-A20 0.2805 0.2145 0.0825
1-A21 0.2145 0.0495 0.033
1-A22 0.2145 0.0495 0
1-A23 0.198 0.0825 0
1-A24 0.198 0.132 0.033
1-A25 0.198 0.198 0.099
1-A26 0.1485 0 0
1-A27 0.165 0.066 0
1-A28 0.132 0.066 0
1-A29 0.132 0.099 0.033
1-A30 0.1485 0.165 0.099
1-A31 0.099 0 -0.033
1-A32 0.099 0 -0.033
1-A33 0.1155 0.033 -0.033
1-A34 0.099 0.066 0
1-A35 0.099 0.1485 0.066
1-A36 0.099 0 -0.0495
1-A37 0.099 0 -0.0495
1-A38 0.099 0.033 -0.033
1-A39 0.099 0.066 0
1-A40 0.099 0.1155 0.0825
1-A41 0.099 0.033 -0.033
1-A42 0.1155 0.033 -0.0165
1-A43 0.1155 0.066 -0.0165
1-A44 0.099 0.066 0
1-A45 0.099 0.1155 0.0495
Max. Cp 0.7095 0.3465 0.099
Min. Cp 0.099 0 -0.066
Table 3.8: Variation of mean pressure coefficient (Cp)
(suction) with wind incidence angle (θ) on three spans
building (Span1-FaceB)
Pressure point No 0˚ 45˚ 90˚
1-B1 0.5775 0.297 0.099
1-B2 0.5775 0.2805 0.1155
1-B3 0.561 0.2805 0.1485
1-B4 0.5445 0.2805 0.1815
1-B5 0.5445 0.2805 0.33
1-B6 0.528 0.2475 0.066
1-B7 0.561 0.264 0.099
1-B8 0.561 0.2805 0.165
1-B9 0.5445 0.2805 0.2475
1-B10 0.561 0.297 0.3135
1-B11 0.4455 0.264 0.0825
1-B12 0.4455 0.231 0.1155
1-B13 0.4785 0.264 0.1815
1-B14 0.4785 0.2805 0.231
1-B15 0.495 0.297 0.264
1-B16 0.2805 0.231 0.0825
1-B17 0.2805 0.231 0.099
1-B18 0.2475 0.231 0.1485
1-B19 0.2805 0.264 0.198
1-B20 0.2475 0.297 0.297
1-B21 0.1815 0.198 0.066
1-B22 0.165 0.231 0.099
1-B23 0.1485 0.231 0.1155
1-B24 0.1485 0.264 0.165
1-B25 0.1815 0.3135 0.297
1-B26
1-B27 0.1155 0.198 0.099
1-B28 0.1155 0.2475 0.1485
1-B29 0.1155 0.264 0.198
1-B30 0.1155 0.3465 0.3135
1-B31 0.1155 0.165 0.066
1-B32 0.1155 0.1815 0.099
1-B33 0.099 0.2145 0.165
1-B34 0.1155 0.2475 0.2475
1-B35 0.1155 0.3135 0.3135
1-B36 0.1155 0.165 0.066
1-B37 0.099 0.1485 0.099
1-B38 0.1155 0.198 0.132
1-B39 0.0825 0.2145 0.264
1-B40 0.1155 0.2805 0.33
1-B41 0.1155 0.165 0.099
1-B42 0.099 0.165 0.1155
1-B43 0.1155 0.165 0.165
1-B44 0.0825 0.198 0.198
1-B45 0.099 0.2475 0.3465
Max. Cp 0.5775 0.3465 0.3465
Min. Cp 0.0825 0.1485 0.066
International Journal of Applied Engineering Research ISSN 0973-4562 Volume 13, Number 10 (2018) pp. 8413-8425
© Research India Publications. http://www.ripublication.com
8422
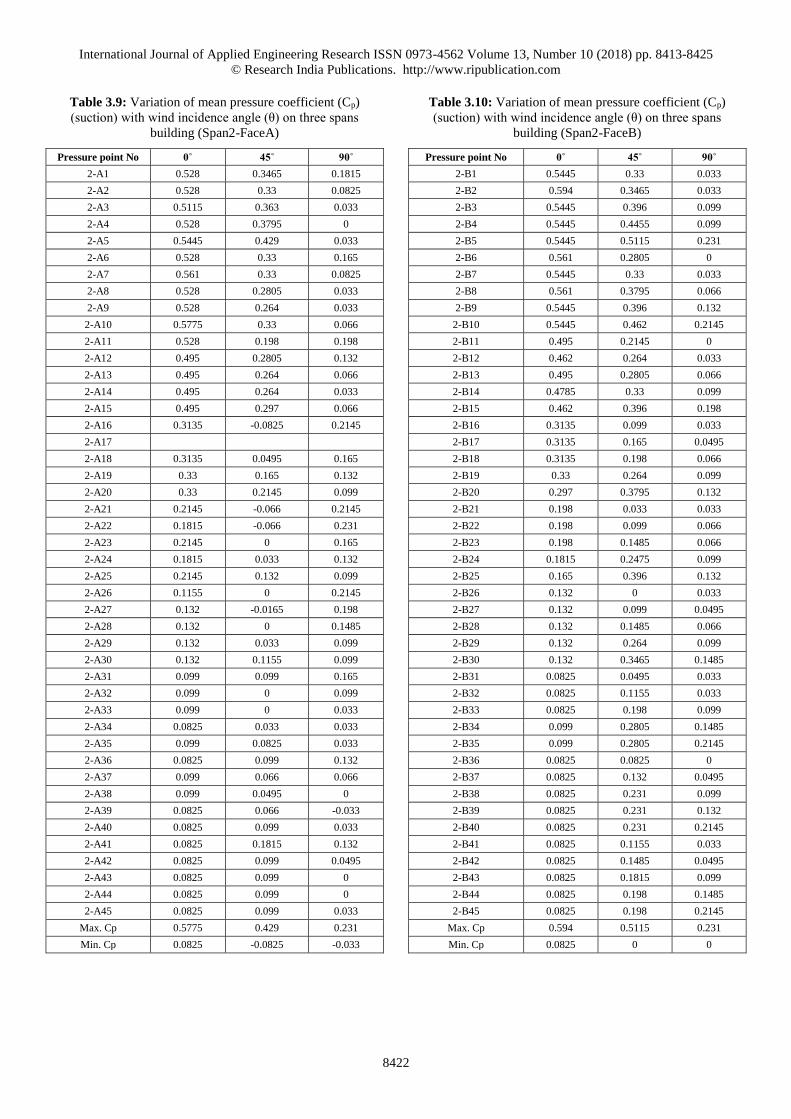
Table 3.9: Variation of mean pressure coefficient (Cp)
(suction) with wind incidence angle (θ) on three spans
building (Span2-FaceA)
Pressure point No 0˚ 45˚ 90˚
2-A1 0.528 0.3465 0.1815
2-A2 0.528 0.33 0.0825
2-A3 0.5115 0.363 0.033
2-A4 0.528 0.3795 0
2-A5 0.5445 0.429 0.033
2-A6 0.528 0.33 0.165
2-A7 0.561 0.33 0.0825
2-A8 0.528 0.2805 0.033
2-A9 0.528 0.264 0.033
2-A10 0.5775 0.33 0.066
2-A11 0.528 0.198 0.198
2-A12 0.495 0.2805 0.132
2-A13 0.495 0.264 0.066
2-A14 0.495 0.264 0.033
2-A15 0.495 0.297 0.066
2-A16 0.3135 -0.0825 0.2145
2-A17
2-A18 0.3135 0.0495 0.165
2-A19 0.33 0.165 0.132
2-A20 0.33 0.2145 0.099
2-A21 0.2145 -0.066 0.2145
2-A22 0.1815 -0.066 0.231
2-A23 0.2145 0 0.165
2-A24 0.1815 0.033 0.132
2-A25 0.2145 0.132 0.099
2-A26 0.1155 0 0.2145
2-A27 0.132 -0.0165 0.198
2-A28 0.132 0 0.1485
2-A29 0.132 0.033 0.099
2-A30 0.132 0.1155 0.099
2-A31 0.099 0.099 0.165
2-A32 0.099 0 0.099
2-A33 0.099 0 0.033
2-A34 0.0825 0.033 0.033
2-A35 0.099 0.0825 0.033
2-A36 0.0825 0.099 0.132
2-A37 0.099 0.066 0.066
2-A38 0.099 0.0495 0
2-A39 0.0825 0.066 -0.033
2-A40 0.0825 0.099 0.033
2-A41 0.0825 0.1815 0.132
2-A42 0.0825 0.099 0.0495
2-A43 0.0825 0.099 0
2-A44 0.0825 0.099 0
2-A45 0.0825 0.099 0.033
Max. Cp 0.5775 0.429 0.231
Min. Cp 0.0825 -0.0825 -0.033
Table 3.10: Variation of mean pressure coefficient (Cp)
(suction) with wind incidence angle (θ) on three spans
building (Span2-FaceB)
Pressure point No 0˚ 45˚ 90˚
2-B1 0.5445 0.33 0.033
2-B2 0.594 0.3465 0.033
2-B3 0.5445 0.396 0.099
2-B4 0.5445 0.4455 0.099
2-B5 0.5445 0.5115 0.231
2-B6 0.561 0.2805 0
2-B7 0.5445 0.33 0.033
2-B8 0.561 0.3795 0.066
2-B9 0.5445 0.396 0.132
2-B10 0.5445 0.462 0.2145
2-B11 0.495 0.2145 0
2-B12 0.462 0.264 0.033
2-B13 0.495 0.2805 0.066
2-B14 0.4785 0.33 0.099
2-B15 0.462 0.396 0.198
2-B16 0.3135 0.099 0.033
2-B17 0.3135 0.165 0.0495
2-B18 0.3135 0.198 0.066
2-B19 0.33 0.264 0.099
2-B20 0.297 0.3795 0.132
2-B21 0.198 0.033 0.033
2-B22 0.198 0.099 0.066
2-B23 0.198 0.1485 0.066
2-B24 0.1815 0.2475 0.099
2-B25 0.165 0.396 0.132
2-B26 0.132 0 0.033
2-B27 0.132 0.099 0.0495
2-B28 0.132 0.1485 0.066
2-B29 0.132 0.264 0.099
2-B30 0.132 0.3465 0.1485
2-B31 0.0825 0.0495 0.033
2-B32 0.0825 0.1155 0.033
2-B33 0.0825 0.198 0.099
2-B34 0.099 0.2805 0.1485
2-B35 0.099 0.2805 0.2145
2-B36 0.0825 0.0825 0
2-B37 0.0825 0.132 0.0495
2-B38 0.0825 0.231 0.099
2-B39 0.0825 0.231 0.132
2-B40 0.0825 0.231 0.2145
2-B41 0.0825 0.1155 0.033
2-B42 0.0825 0.1485 0.0495
2-B43 0.0825 0.1815 0.099
2-B44 0.0825 0.198 0.1485
2-B45 0.0825 0.198 0.2145
Max. Cp 0.594 0.5115 0.231
Min. Cp 0.0825 0 0
International Journal of Applied Engineering Research ISSN 0973-4562 Volume 13, Number 10 (2018) pp. 8413-8425
© Research India Publications. http://www.ripublication.com
8423
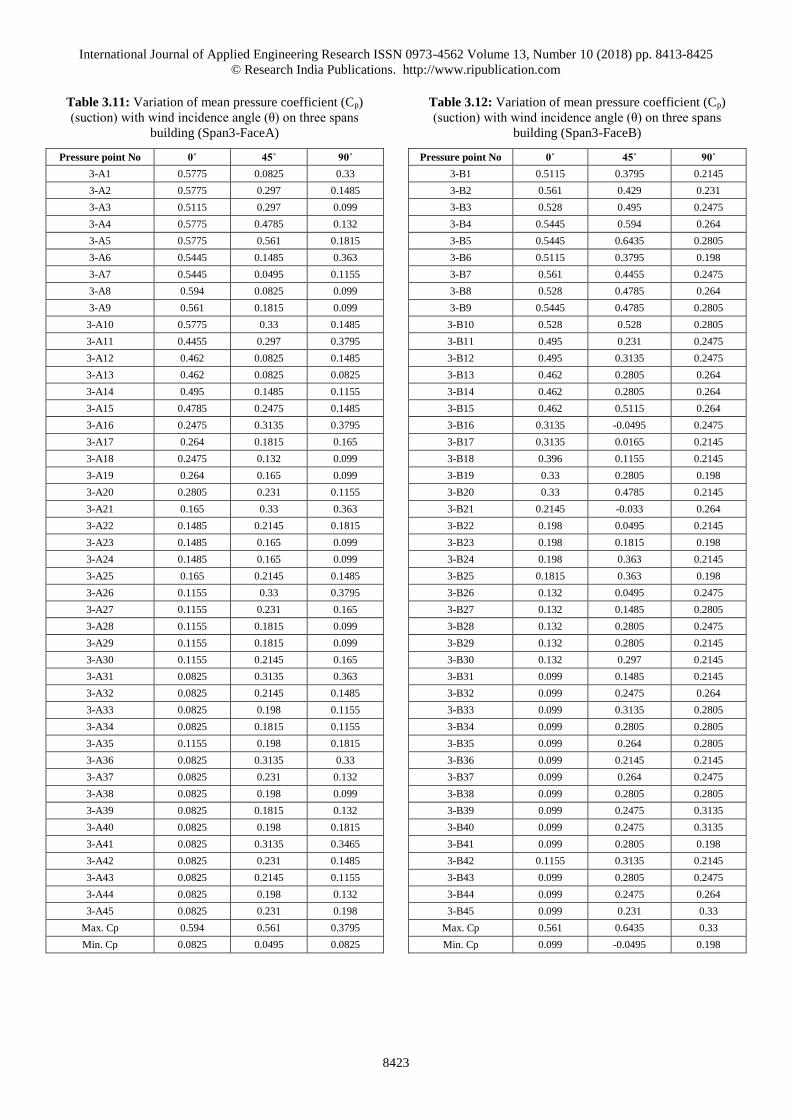
Table 3.11: Variation of mean pressure coefficient (Cp)
(suction) with wind incidence angle (θ) on three spans
building (Span3-FaceA)
Pressure point No 0˚ 45˚ 90˚
3-A1 0.5775 0.0825 0.33
3-A2 0.5775 0.297 0.1485
3-A3 0.5115 0.297 0.099
3-A4 0.5775 0.4785 0.132
3-A5 0.5775 0.561 0.1815
3-A6 0.5445 0.1485 0.363
3-A7 0.5445 0.0495 0.1155
3-A8 0.594 0.0825 0.099
3-A9 0.561 0.1815 0.099
3-A10 0.5775 0.33 0.1485
3-A11 0.4455 0.297 0.3795
3-A12 0.462 0.0825 0.1485
3-A13 0.462 0.0825 0.0825
3-A14 0.495 0.1485 0.1155
3-A15 0.4785 0.2475 0.1485
3-A16 0.2475 0.3135 0.3795
3-A17 0.264 0.1815 0.165
3-A18 0.2475 0.132 0.099
3-A19 0.264 0.165 0.099
3-A20 0.2805 0.231 0.1155
3-A21 0.165 0.33 0.363
3-A22 0.1485 0.2145 0.1815
3-A23 0.1485 0.165 0.099
3-A24 0.1485 0.165 0.099
3-A25 0.165 0.2145 0.1485
3-A26 0.1155 0.33 0.3795
3-A27 0.1155 0.231 0.165
3-A28 0.1155 0.1815 0.099
3-A29 0.1155 0.1815 0.099
3-A30 0.1155 0.2145 0.165
3-A31 0.0825 0.3135 0.363
3-A32 0.0825 0.2145 0.1485
3-A33 0.0825 0.198 0.1155
3-A34 0.0825 0.1815 0.1155
3-A35 0.1155 0.198 0.1815
3-A36 0.0825 0.3135 0.33
3-A37 0.0825 0.231 0.132
3-A38 0.0825 0.198 0.099
3-A39 0.0825 0.1815 0.132
3-A40 0.0825 0.198 0.1815
3-A41 0.0825 0.3135 0.3465
3-A42 0.0825 0.231 0.1485
3-A43 0.0825 0.2145 0.1155
3-A44 0.0825 0.198 0.132
3-A45 0.0825 0.231 0.198
Max. Cp 0.594 0.561 0.3795
Min. Cp 0.0825 0.0495 0.0825
Table 3.12: Variation of mean pressure coefficient (Cp)
(suction) with wind incidence angle (θ) on three spans
building (Span3-FaceB)
Pressure point No 0˚ 45˚ 90˚
3-B1 0.5115 0.3795 0.2145
3-B2 0.561 0.429 0.231
3-B3 0.528 0.495 0.2475
3-B4 0.5445 0.594 0.264
3-B5 0.5445 0.6435 0.2805
3-B6 0.5115 0.3795 0.198
3-B7 0.561 0.4455 0.2475
3-B8 0.528 0.4785 0.264
3-B9 0.5445 0.4785 0.2805
3-B10 0.528 0.528 0.2805
3-B11 0.495 0.231 0.2475
3-B12 0.495 0.3135 0.2475
3-B13 0.462 0.2805 0.264
3-B14 0.462 0.2805 0.264
3-B15 0.462 0.5115 0.264
3-B16 0.3135 -0.0495 0.2475
3-B17 0.3135 0.0165 0.2145
3-B18 0.396 0.1155 0.2145
3-B19 0.33 0.2805 0.198
3-B20 0.33 0.4785 0.2145
3-B21 0.2145 -0.033 0.264
3-B22 0.198 0.0495 0.2145
3-B23 0.198 0.1815 0.198
3-B24 0.198 0.363 0.2145
3-B25 0.1815 0.363 0.198
3-B26 0.132 0.0495 0.2475
3-B27 0.132 0.1485 0.2805
3-B28 0.132 0.2805 0.2475
3-B29 0.132 0.2805 0.2145
3-B30 0.132 0.297 0.2145
3-B31 0.099 0.1485 0.2145
3-B32 0.099 0.2475 0.264
3-B33 0.099 0.3135 0.2805
3-B34 0.099 0.2805 0.2805
3-B35 0.099 0.264 0.2805
3-B36 0.099 0.2145 0.2145
3-B37 0.099 0.264 0.2475
3-B38 0.099 0.2805 0.2805
3-B39 0.099 0.2475 0.3135
3-B40 0.099 0.2475 0.3135
3-B41 0.099 0.2805 0.198
3-B42 0.1155 0.3135 0.2145
3-B43 0.099 0.2805 0.2475
3-B44 0.099 0.2475 0.264
3-B45 0.099 0.231 0.33
Max. Cp 0.561 0.6435 0.33
Min. Cp 0.099 -0.0495 0.198
International Journal of Applied Engineering Research ISSN 0973-4562 Volume 13, Number 10 (2018) pp. 8413-8425
© Research India Publications. http://www.ripublication.com
8424
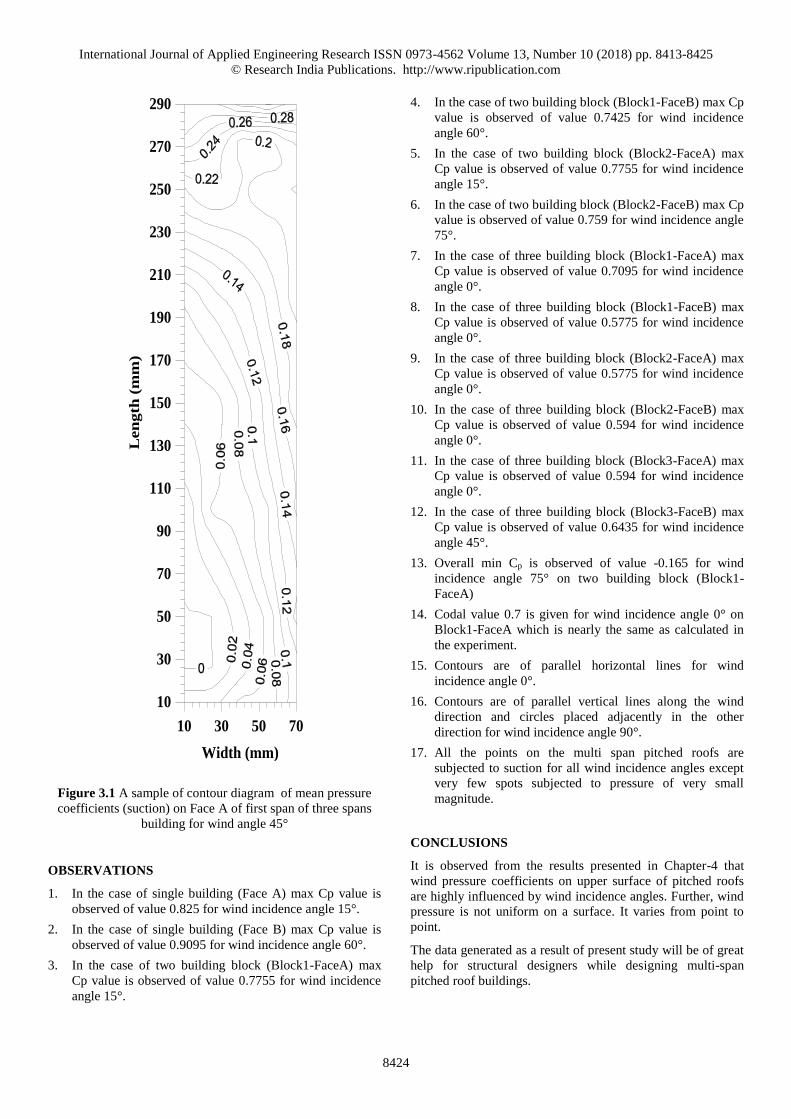
Figure 3.1 A sample of contour diagram of mean pressure
coefficients (suction) on Face A of first span of three spans
building for wind angle 45°
OBSERVATIONS
1. In the case of single building (Face A) max Cp value is
observed of value 0.825 for wind incidence angle 15°.
2. In the case of single building (Face B) max Cp value is
observed of value 0.9095 for wind incidence angle 60°.
3. In the case of two building block (Block1-FaceA) max
Cp value is observed of value 0.7755 for wind incidence
angle 15°.
4. In the case of two building block (Block1-FaceB) max Cp
value is observed of value 0.7425 for wind incidence
angle 60°.
5. In the case of two building block (Block2-FaceA) max
Cp value is observed of value 0.7755 for wind incidence
angle 15°.
6. In the case of two building block (Block2-FaceB) max Cp
value is observed of value 0.759 for wind incidence angle
75°.
7. In the case of three building block (Block1-FaceA) max
Cp value is observed of value 0.7095 for wind incidence
angle 0°.
8. In the case of three building block (Block1-FaceB) max
Cp value is observed of value 0.5775 for wind incidence
angle 0°.
9. In the case of three building block (Block2-FaceA) max
Cp value is observed of value 0.5775 for wind incidence
angle 0°.
10. In the case of three building block (Block2-FaceB) max
Cp value is observed of value 0.594 for wind incidence
angle 0°.
11. In the case of three building block (Block3-FaceA) max
Cp value is observed of value 0.594 for wind incidence
angle 0°.
12. In the case of three building block (Block3-FaceB) max
Cp value is observed of value 0.6435 for wind incidence
angle 45°.
13. Overall min Cp is observed of value -0.165 for wind
incidence angle 75° on two building block (Block1-
FaceA)
14. Codal value 0.7 is given for wind incidence angle 0° on
Block1-FaceA which is nearly the same as calculated in
the experiment.
15. Contours are of parallel horizontal lines for wind
incidence angle 0°.
16. Contours are of parallel vertical lines along the wind
direction and circles placed adjacently in the other
direction for wind incidence angle 90°.
17. All the points on the multi span pitched roofs are
subjected to suction for all wind incidence angles except
very few spots subjected to pressure of very small
magnitude.
CONCLUSIONS
It is observed from the results presented in Chapter-4 that
wind pressure coefficients on upper surface of pitched roofs
are highly influenced by wind incidence angles. Further, wind
pressure is not uniform on a surface. It varies from point to
point.
The data generated as a result of present study will be of great
help for structural designers while designing multi-span
pitched roof buildings.
10 30 50 70
Width (mm)
10
30
50
70
90
110
130
150
170
190
210
230
250
270
290
Len
gth
(m
m)
International Journal of Applied Engineering Research ISSN 0973-4562 Volume 13, Number 10 (2018) pp. 8413-8425
© Research India Publications. http://www.ripublication.com
8425
REFERENCES
[1] IS:875(Part 3)-1987 “Code of Practice for Design
loads (other than earthquake) for Buildings and
Structures”, BIS, New Delhi.
[2] ASCE 7-05 “Minimum Design Loads for buildings
and other Structures”, American Society of Civil
Engineers, New York.
[3] AUS,NZ 1170.2:2002, “Structural Design Actions,
Part 2:Wind Actions”, Australia/NewZealand.
[4] BS 6399(1997) Part2 Loading for Buildings-Code of
practice for wind loads.
[5] Eurocode 1 Actions on structures_General
actions_Part 1_4 _Wind
[6] Kumar,Ram(1991), “Mean Wind Pressure
Distribution on Convex Cylindrical Roofs”,
M.E.Thesis, Deptt of Civil Engg., University of
Roorkee, Roorkee, India.
[7] Jain,Mukesh(1991), “Influence of Neighbouring
Buildings on Wind Loads on Tall Buildings”,
M.E.Thesis, Deptt of Civil Engg., University of
Roorkee, Roorkee, India.
[8] Amareshwar,K.(2005), “Wind Pressure Distribution
on Elevated Structures with Curved Roofs”,
M.Tech.Thesis, Deptt of Civil Engg., Indian Institute
of Technology Roorkee, Roorkee, India.