experimental investigation on the ... online-first...experimental investigation on the performance...
TRANSCRIPT

EXPERIMENTAL INVESTIGATION ON THE PERFORMANCE OF
THERMOSYPHON SOLAR WATER HEATER IN THE SOUTH CASPIAN SEA
Abdollah Riahi, Hessam Taherian
Abstract
In the present study, a natural circulation closed thermosyphon flat plate solar water heater
has been tested at the Faculty of Engineering of University of Mazandaran located in Babol
city (36N, 52E). Data were collected for several sunny and cloudy days. Dynamic response of
the system to variations in solar insolation was studied and analyzed. It was found that such
systems can provide ample energy to satisfy the demand for hot water, contrary to
misperception among locals.
Keywords: Solar water heater, Thermosyphon, Caspian Sea
1. Introduction
Solar water heating systems (SWHS) can either be open loop (also called "direct") or closed loop (also called "indirect"). An open-loop system circulates household (potable) water through the collector. This design is efficient and lowers the operating cost but is not appropriate if water is hard or acidic because scale and corrosion will gradually disable the system. Overnight freezing is also an important problem. Open-loop systems are popular in regions that do not experience subzero temperatures.
A closed-loop system uses a heat-transfer fluid (water or diluted antifreeze) to collect heat and a heat exchanger (usually of mantle type) to transfer the heat to domestic water supply. A disadvantage of closed looped system is that heat is lost during the heat exchange process. Sitzmann [1] recommended
utilization of such systems and provided basic information to manufacture and use closed-loop
systems.
SWHS are also characterized as active or passive. An active system uses an electric pump to circulate the fluid through the collector. A passive system moves supply water or a heat-transfer fluid through the system without any pumps and relies on thermo-syphoning to circulate water. This phenomenon is often made use of in the design of solar water heaters, particularly of small capacities. In these systems, heat transfer fluid rises up from the solar energy collector to the hot water store due to the action of buoyancy forces and is replaced by colder water from the bottom of the tank. A continuous circulation is thus established between the collectors to the tank which helps in heating up water in the storage tank.
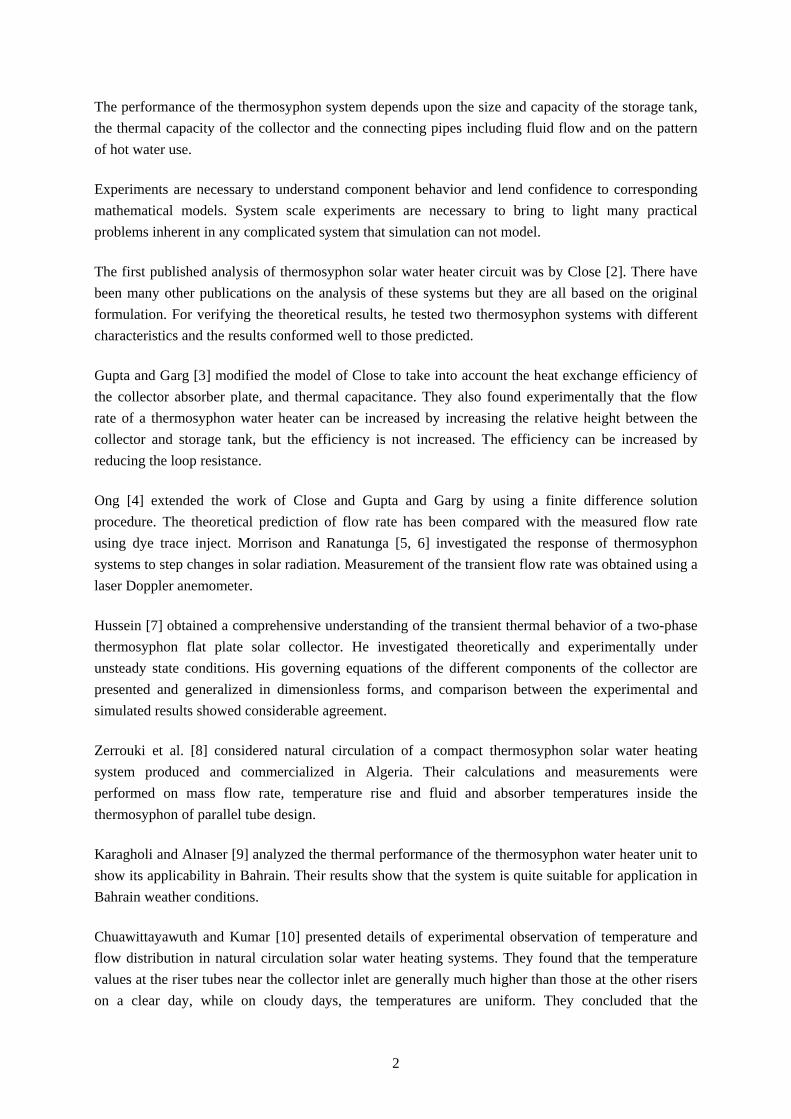
The performance of the thermosyphon system depends upon the size and capacity of the storage tank, the thermal capacity of the collector and the connecting pipes including fluid flow and on the pattern of hot water use.
Experiments are necessary to understand component behavior and lend confidence to corresponding mathematical models. System scale experiments are necessary to bring to light many practical problems inherent in any complicated system that simulation can not model.
The first published analysis of thermosyphon solar water heater circuit was by Close [2]. There have been many other publications on the analysis of these systems but they are all based on the original formulation. For verifying the theoretical results, he tested two thermosyphon systems with different characteristics and the results conformed well to those predicted.
Gupta and Garg [3] modified the model of Close to take into account the heat exchange efficiency of the collector absorber plate, and thermal capacitance. They also found experimentally that the flow rate of a thermosyphon water heater can be increased by increasing the relative height between the collector and storage tank, but the efficiency is not increased. The efficiency can be increased by reducing the loop resistance.
Ong [4] extended the work of Close and Gupta and Garg by using a finite difference solution procedure. The theoretical prediction of flow rate has been compared with the measured flow rate using dye trace inject. Morrison and Ranatunga [5, 6] investigated the response of thermosyphon systems to step changes in solar radiation. Measurement of the transient flow rate was obtained using a laser Doppler anemometer.
Hussein [7] obtained a comprehensive understanding of the transient thermal behavior of a two-phase thermosyphon flat plate solar collector. He investigated theoretically and experimentally under unsteady state conditions. His governing equations of the different components of the collector are presented and generalized in dimensionless forms, and comparison between the experimental and simulated results showed considerable agreement.
Zerrouki et al. [8] considered natural circulation of a compact thermosyphon solar water heating system produced and commercialized in Algeria. Their calculations and measurements were performed on mass flow rate, temperature rise and fluid and absorber temperatures inside the thermosyphon of parallel tube design.
Karagholi and Alnaser [9] analyzed the thermal performance of the thermosyphon water heater unit to show its applicability in Bahrain. Their results show that the system is quite suitable for application in Bahrain weather conditions.
Chuawittayawuth and Kumar [10] presented details of experimental observation of temperature and flow distribution in natural circulation solar water heating systems. They found that the temperature values at the riser tubes near the collector inlet are generally much higher than those at the other risers on a clear day, while on cloudy days, the temperatures are uniform. They concluded that the
2

temperature of water in the riser depends on its flow rate. They also carried out the measurements of the glass temperature.
As far as analytical studies concern, they only can predict the overall performance of the system in
whole and no detailed information can be obtained from them. Belessiotis and Mathioulakis [11]
performed analytical study of a thermosyphon solar water heater with horizontal storage tank and
verified the results by experiments.
The only journal articles that report study of a solar collector system in the climate region of South
Caspian Sea are the one by Mohseni et al. [12] which is done on a solar air heater system and that by
Fooladi and Taherian [13] which is a report on integrated solar collector storage (ICS) system. ICS
systems’ performance in humid climate has been also reported by Varghese et al. [14]. The mentioned
articles proved that employment of solar collectors in those regions is in fact feasible.
The climate in Iran is diverse. The central part is arid. Hot and humid weather prevails in the Persian Gulf region south of the country. The humidity in the south Caspian Sea region is high with lots of precipitation and cloudy days, while the winters are mild. There has always been present a misperception among residents of South Caspian Sea region that thermosyphon systems would not work properly as the humidity is high and solar insolation is inadequate. This has severely obstructed extensive use of thermosyphon systems in the mentioned region. The current experiments were conducted to study the performance of nationally made thermosyphon solar water heaters as shown in Figure 1 in the said region and to prove otherwise. The work reported in the paper is new in the
sense that it is the only study that demonstrates performance of the entire system. All
previous studies on thermosyphon water heater systems with horizontal mantle tank (which
are extremely scarce) either focus on the performance of the collector or the tank. Other
significances are that it shows utilization of a non intrusive method for measurement of flow
rate which is always a challenge for thermosyphon systems since any flow obstruction will
alter the actual performance of the system. It shows the length of time delays in the collector
and the tank. It demonstrates level of thermal stratification in the horizontal tank.
2. Experimental setup and test procedure
The tests were conducted on a commercial thermosyphon solar water heater that was manufactured by Kian Energy Company and donated to the University of Mazandaran. The system was installed at the Faculty of Mechanical Engineering of University of Mazandaran located in Babol city (36E, 52N) and mounted facing south at a tilt angle of 45o to the horizontal which is the appropriate tilt angle corresponding to the location latitude.
3

Fig 1. Picture of the tested system in location
The system consists of two flat plate collectors, a horizontal storage tank equipped with mantle heat exchanger, an up-riser and a down-comer pipe (3/4” diameter). Collectors were of single glazed aluminum flat-plate absorber type formed from 7 copper finned tubes. Each riser has an inside diameter of 12 [mm] with a 140 [mm] center to center spacing. The cross-section of the risers is of rhombic shape with round corners. Other specifications are given in Table 1.
Table 1. Specification of the system tested in the study
The monitoring campaign consisted of several measurements of temperatures and mass flow rates. Temperature measurements were done on the surface of absorber plate (which were placed at 8
4
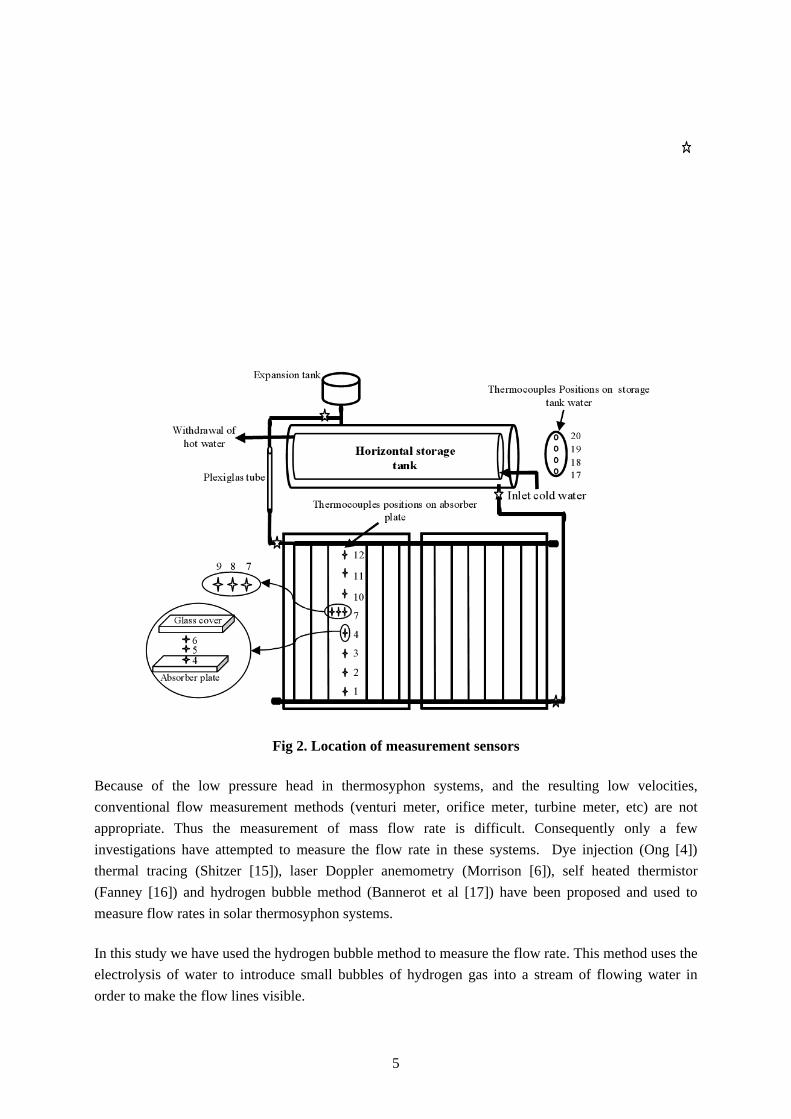
Fig 2. Location of measurement sensors
Because of the low pressure head in thermosyphon systems, and the resulting low velocities, conventional flow measurement methods (venturi meter, orifice meter, turbine meter, etc) are not appropriate. Thus the measurement of mass flow rate is difficult. Consequently only a few investigations have attempted to measure the flow rate in these systems. Dye injection (Ong [4]) thermal tracing (Shitzer [15]), laser Doppler anemometry (Morrison [6]), self heated thermistor (Fanney [16]) and hydrogen bubble method (Bannerot et al [17]) have been proposed and used to measure flow rates in solar thermosyphon systems.
In this study we have used the hydrogen bubble method to measure the flow rate. This method uses the electrolysis of water to introduce small bubbles of hydrogen gas into a stream of flowing water in order to make the flow lines visible.
5
In a typical hydrogen bubble flow visualization installation, a very fine wire is stretched across the region of flow which is to be investigated. A pulse of electrical energy is fed to the wire and the hydrogen formed is swept of the wire by the passing water. Oxygen is of course formed at the anode which is located elsewhere. In general, hydrogen bubbles are smaller and are easier to see so they are used instead of the oxygen bubbles as the flow tracer. The time of the bubbles displacement is measured. Hence, using the measured time of the fluid and the dimension of the pipe, the mass flow rate can be determined.
In this work, a 12 [mm] length of 0.3 [mm] nickel-chromium wire was used. The wire was insulated with a thin coat of water proof paint along its entire length except at the tip where the hydrogen bubbles were produced. The cathode wire was inserted into an 80 [cm] section of a 26 [mm] diameter clear Plexiglas tube through a 1 [mm] opening in the wall and then sealed with glue. The circuit was completed by simply attaching the anode to the metal piping. The electrical supply was capable of providing 0-300 VDC continuously. The calibration of the hydrogen bubble device as a flow meter was carried out in the fluid mechanics laboratory with the aid of a hydraulic bench.
3. Results and discussion
Experiments were conducted at the Faculty of Mechanical Engineering of the University of Mazandaran located in Babol city (36E, 52N) for several days of summer.
To study the temperature and flow distribution in the system during its daily operation, experiments were conducted by filling the storage tank with cold water every morning. The period of testing for each run was from 6 A.M to 21 P.M. and during the tests, no water was withdrawn from the storage.
The variation of temperatures of different locations along the absorber plate during a sunny day is shown in Figure 3. The measured solar irradiation on the plane of the collector is also shown in the Figure. It can be seen that a sudden drop in solar insolation at about 12:30 has been sensed on the absorber plate with a one-hour delay. The maximum temperature on the absorber plate occurs at 14:00 when it reaches 88[°C]. On this day the maximum incident energy on the plane of the absorber is 1050 [W/m2 ] which only lasts for a short period of time. After 13:00, although incident radiation starts dropping, the absorber temperature continues rising for two more hours. The curve labeled by the letter “S” in Figure 3, represents the measured solar insolation.
A comparison with the temperature profiles of the central riser of the collector reported by
Chuawittayawuth and Kumar [10] confirms current measurements. They reported that the maximum
temperature of the central riser of the collector plate occurred at 15:00 which is consistent with
Figure 3. The magnitude of the maximum temperature observed in their collector is lower than the
current study. This is attributed to more efficient design of the current collector which uses risers
manufactured by sandwiching a copper tube between two aluminum plates as opposed to their
design which introduces larger contact resistance between absorber plate and water tubing.
6

Fig 3. Time Variation of absorber plate temperatures on a sunny day
Fig 4. Temperature variation along absorber plate at different times of day
The time variation of temperature along the absorber plate has been shown in a different way in Figure 4. At 8:00 a.m. when the solar insolation is 413.1 [W/m2], the top two locations of the absorber are still cold. At 10:00 a.m. a linear temperature distribution is well established with the lowest point at 40.3 [°C] and the highest one at 59.4 [°C]. The linear distribution then begins to be disturbed at 2:00 p.m. with a break in the mid-height of the collector. Afterwards, the temperature distribution starts to
7

flatten while moving downwards to the lower temperatures where finally at 8:00 p.m. the situation is similar to that at 8:00 a.m. except for the top two locations which are warmer.
Fig 5. Time variation of storage tank temperature on a sunny day
As shown in Figure 5, the temperature was also measured at 4 points along the height of the storage tank. Our results can be compared to those by Sako et al. [18] for generally the same system tested in
Côte D’ Ivoire, Africa. Their system incorporated 2 [m2] of solar collector and a horizontal storage
tank. However, they do not elaborate on the type of heat exchanger used in their storage tank. They
found that the average storage temperature reaches 60 [°C] at 16:00. As can be seen in Figure 5, the
average water temperature in our storage tank is slightly higher than 60 [°C] at 16:00. The larger
collector surface area of our system is expected to deliver more energy and thus higher average water
temperature. Zerrouki et al. [8] found that the average tank temperature reaches its maximum of 54
[°C] at 18:00 in the climate of Algiers, Algeria. The system they used had 1.8 [m2] of solar collectors
and 120 [L] of water storage capacity. However, their system is not a closed system. The system tested
by Belessiotis and Mathioulakis [11] was a closed system.
The time variation of temperature for these points is shown in Figure 6 for a sunny day. Thermal stratification is evident in the tank such that the temperature difference between the bottom layer and the top layer is 23 [°C] at noon. It can also be seen that the temperature of the top of the tank starts to increase rapidly from the early morning hours while the lower parts do not experience a considerable temperature rise. When time passes 16:00, the temperature at point 20 starts to decrease, whereas at other locations it stays unchanged. That is due to a lack of sufficient energy input that causes the water inside the tank to transfer heat within itself, i.e. from upper layers to the ones beneath. At 8:00 p.m. the temperature difference between the top layer and the bottom layer of the tank is small indicative of an almost isothermal storage tank at a temperature of 62 [˚C] available for hot water consumption.
8

Fig 6. Storage tank temperatures at different times in a sunny day
Figure 7 shows the temperatures in the air gap between the absorber plate and the transparent cover of the collector. As it can be seen, there is a sensible temperature gradient in this area at noon. The difference between the plate temperature and temperature in the air gap is the highest (13 [°C]) at 3:00 p.m. When the sun goes down, the plate and the air above it quickly reach equal temperatures. Comparing this to Figure 3 it is evident that the drop in solar irradiation is sensed in the air above the plate with 1.5 hours delay.
Fig 7. Time variation of Air temperature between absorber plate and glass cover
Figure 8 indicates that there is a transverse temperature gradient on the fin such that as we move away from the tube in the center of the fin, the temperature increases. This is in accord with what one should normally expect to happen. The gradient starts to be of noticeable value at around 9:30 in the morning and vanishes again at 17:00 in the evening.
9

Fig 8. Time variation of absorber plate temperature along the fin width
The collector loop mass flow rate was measured using a hydrogen bubble flow visualization technique. The result is shown in Figure 9 for a sunny day. At noon the flow rate has reached its peak value of 16.5 [g/sec] while at 7:00 the value is 3 [g/sec]. It can be seen that the mass flow rate changes according to the drop in solar insolation with a half-hour delay. The maximum mass flow rate reported
by Zerrouki et al. [8] was 8.5 [g/s] at 13:30 which in terms of time of occurrence corresponds to the
time obtained in the current study. The lower value of the mass flow rate in their study is due to their
smaller collector area because, increasing collector area will increase flow potential. The data reported
by Belessiotis and Mathioulakis [11] is more consistent with current results. They observed a
maximum flow rate of 18 [g/s] at 13:15 local time, which is very close to what is visible in Figure 9.
Fig 9. Time variation of mass flow rate on a sunny day
In Figure 10 the temperature of the liquid leaving the collector, entering the mantle heat exchanger and exiting it is shown. The collector liquid temperature follows the changes in solar insolation with a one-
10

hour time lag. It has reached a maximum temperature of 80 [°C] at 14:00 when the maximum receiving solar energy flux for the day is 1050 [W/m2]. There is a small difference between the collector outlet temperature and the temperature of the liquid entering the mantle of the storage tank i.e. the latter slightly lower than the former. This is due to a lack of insulation on the up riser of the system since the flow measuring system is of visual type. Sako et al. [18] recorded a temperature of ~85
[°C] at 14:15 hours where the maximum solar insolation is slightly less than 1000 [W/m2] at noon.
Their reported results confirm the results reported in the current study. The collector water outlet
temperature was 58 [°C] in the research reported by Belessiotis and Mathioulakis [11]. The reason for
lower water temperature compared to the current results is their collector’s higher flow rate and
smaller surface area.
At around 17:30 the mentioned temperature difference is reversed i.e. the liquid temperature measured in the entrance to the mantle is quite higher than that at the outlet of the collector. The authors’ conclusion is that this is so due to tube wall conduction from the hot water stored in the tank compared to the liquid temperature at the outlet of the collector at times that the incoming heat flux from the sun is low. The temperature leaving the mantle side of the storage tank follows a different trend. It does not closely follow the variations of the solar irradiation flux. The fact that it continues rising well after the sun starts losing power is due to mixing of hot and cold layers inside the storage tank. When the sun sets, the mantle outlet temperature starts to increase after a while.
Fig 10. Time variation of input and output temperatures of collector at storage tank
It is worth mentioning that all of the measured data were at the day that had the ambient temperature as the following graph.
11

Fig 11. Time Variation of ambient temperatures on a sunny day
In order to study the performance of the system under changing climate measurements were taken on a cloudy day having a maximum of 950 [W/m2] insulation at 10:15 with periods going down as low as 200 [W/m2] for example at 13:50. Figure 12 shows the collected data of absorber plate temperatures for such a day. The time lag in following ups and downs of solar influx is evident from the figure. When the time has passed 15:00, the solar flux has declined considerably whereas the absorber plate temperature stays well above 50 [°C] for quite some time after that.
Fig 12. Time Variation of absorber plate temperatures on a cloudy day
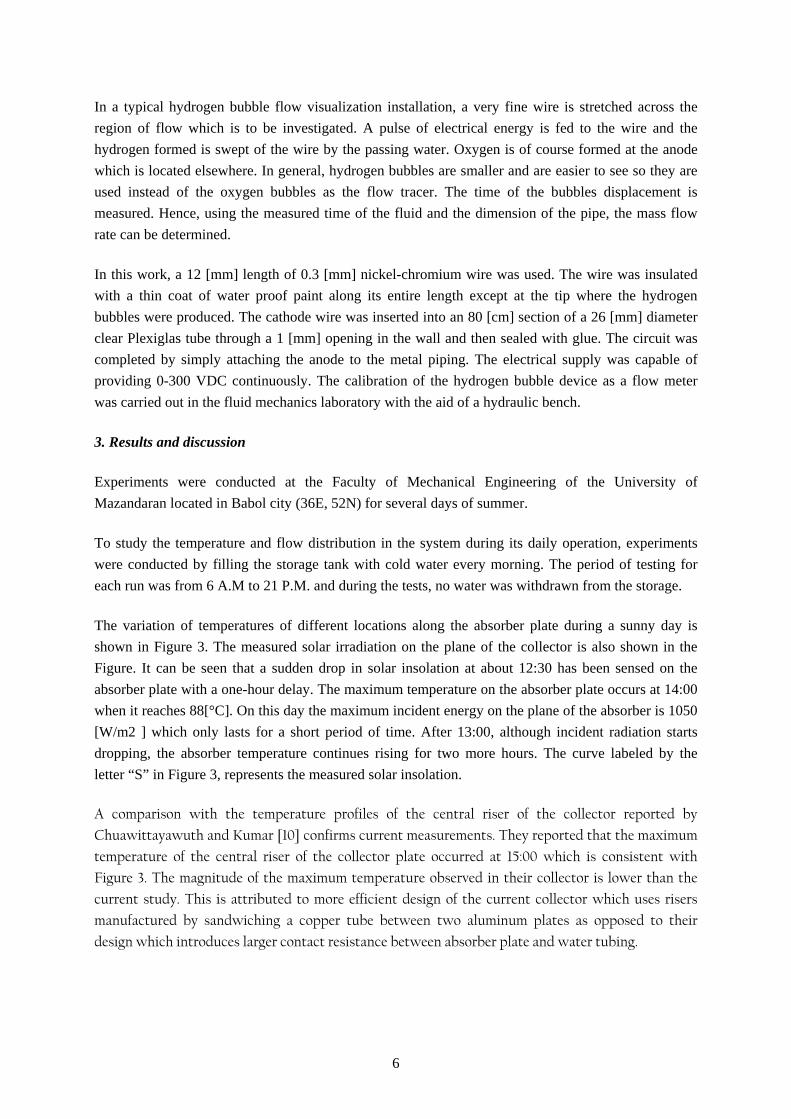
Variation of temperature of the water stored in the tank with height is shown in Figure 13 for a cloudy day. The maximum temperature still reaches about 68 [°C] at 14:00. The thermal stratification is evident even in such a day. The drop in the tank temperatures at different layers is also evident after
12
the sunset. Also it can be seen in the Figure that the upper layers do transfer heat through conduction to each other.
Fig 13. Time Variation of storage tank temperatures on a cloudy day
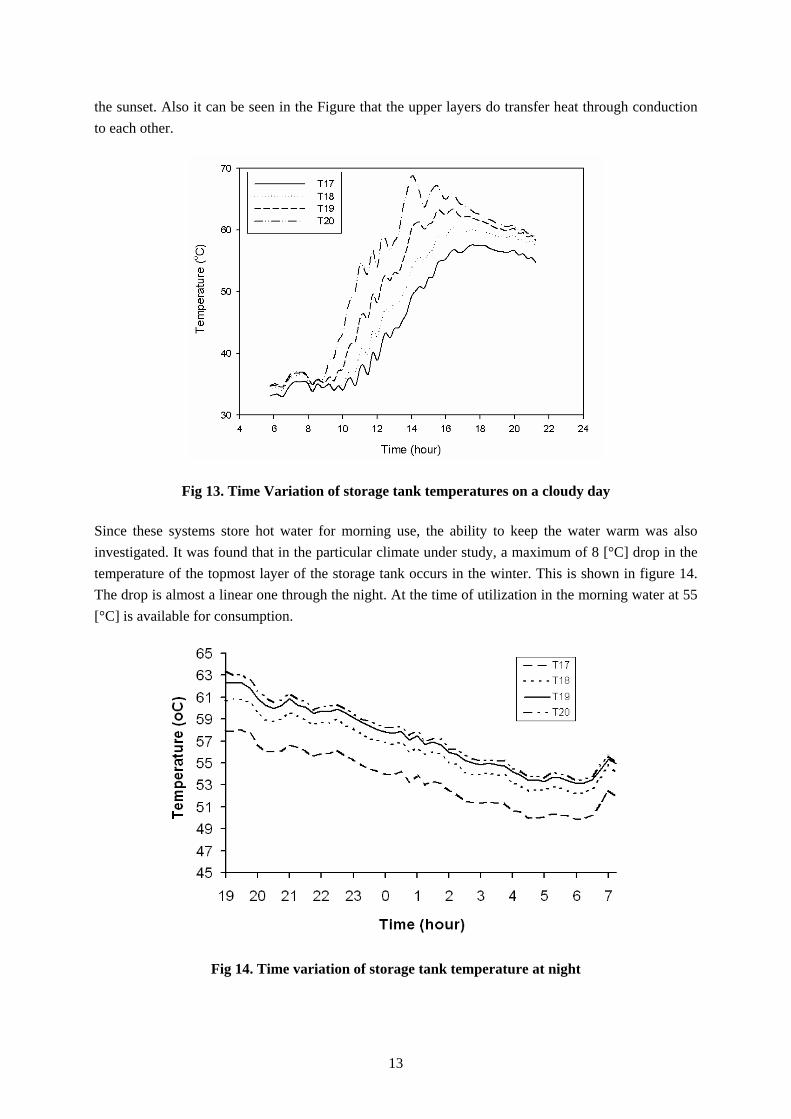
Since these systems store hot water for morning use, the ability to keep the water warm was also investigated. It was found that in the particular climate under study, a maximum of 8 [°C] drop in the temperature of the topmost layer of the storage tank occurs in the winter. This is shown in figure 14. The drop is almost a linear one through the night. At the time of utilization in the morning water at 55 [°C] is available for consumption.
Fig 14. Time variation of storage tank temperature at night
13

4. Conclusion
Performance of a thermosyphon solar water heater equipped with a horizontal mantle storage tank in the mild winter of the south Caspian Sea region was studied experimentally. The system was equipped with several thermocouples to measure and collect data via a data logger. The collector temperature reached 90 [°C] and the time that maximum temperature occurred was about one hour after the point of maximum solar irradiation flux. A quite satisfactory state of thermal stratification was observed in the storage tank and the temperature of the top layer of water was 72 [°C] on a sunny day. It was shown that these systems work well in the climate under consideration even in days with cloudy periods. The measured thermal performance of the system compares well with the data reported by
other researchers for relatively similar systems.
5. References
[1] B. Sitzmann, Solar water heater with thermosyphon circulation, Appropriate Technology, vol. 31
(1), pp. 66-70, 2004.
[2] D. J. Close, The performance of solar water heaters with natural circulation, Solar Energy, vol. 6, pp. 30–40, 1962.
[3] C. L. Gupta and H. P. Garg, System design in solar water heaters with natural circulation, Solar Energy, vol. 12, pp.163–82, 1968.
[4] K. S. Ong, A finite-difference method to evaluate the thermal performance of a solar water heater, Solar Energy, vol. 16, pp. 137–47, 1974.
[5] G. L. Morrison and D. B. J. Ranatunga, Transient Response of thermosyphon solar collectors, Solar Energy, vol. 24, pp. 55-61, 1980
[6] G. L. Morrison and D. B. J. Ranatunga, Thermosyphon circulation in solar collectors, Solar Energy, vol. 24, pp. 191-198, 1980.
[7] H. M. S. Hussein, Optimization of a natural circulation two phase closed thermosyphon flat plate solar water heater, Energy Conversion and Management, vol. 44, pp. 2341-2352, 2003.
[8] A. Zerrouki, A. Boumedien and K. Bouhadef, The natural circulation solar water heater model with linear temperature distribution, Renewable Energy, vol. 26, pp. 549–559, 2002.
[9] A. A. Karaghouli and W. E. Alnaser, Experimental study on thermosyphon solar water heater in Bahrain, Renewable Energy, vol. 24, pp. 389-396, 2001.
[10] K. Chuawittayawuth and S. Kumar, Experimental investigation of temperature and flow distribution in a thermosyphon solar water heating system, Renewable Energy, vol. 26, pp. 431–448, 2002.
14

15
[11] V. Belessiotis, E. Mathioulakis, Analytical approach of thermosyphon solar domestic hot water
system performance, Solar Energy, vol. 72 (4), pp. 307-315, 2002.
[12] E. Mohseni-Languri, H. Taherian, R. Masoodi, J. R. Reisel, An energy and exergy study of a solar
air collector, Thermal Science, vol. 13 (1), pp. 205-216, 2009.
[13] F. Fooladi, H. Taherian, Experimental study of a multi-tube ICS solar water heating system in
mild climates, Applied Solar Energy, vol. 46 (1), pp. 22-31, 2010.
[14] J. Varghese, G. K. Awari and M. P. Singh, Experimental analysis of distinct design of a batch solar
water heater with integrated collector storage system, Thermal Science, vol. 11 (4), pp. 135-142, 2007.
[15] A. Shitzer, D. Kalmanoviz, Y. Zvirin and G. Grossman, Experiments with a flat plate solar water heating system in thermosyphonic flow, Solar Energy, vol. 22, pp. 27-35, 1979.
[16] A. H. Fanney and B. P. Dougherty, Measurement of buoyancy-induced flow using a self heated thermistor flow meter, Journal of Solar Energy Engineering, vol. 109, pp. 34-39, 1987.
[17] R. B. Bannerot, Y. W. Tu, A. Scott, G. Placke and T. Poche, A simple device for monitoring flow rates in thermosyphon solar water heaters, Journal of Solar Energy Engineering, vol. 114, pp. 47-51, 1992.
[18] M. K. Sako, Y. N’Guessan, H. Y. Andoh, P. M. E. Koffi, P. Gbaha and M. K. Sangaré, Economical
and technical viability of a thermosyphon solar water heater in Côte D’ Ivoire, Journal of Applied
Sciences, vol. 7 (24), pp. 3977-3982, 2007.