experimental method for dynamic residual strength characterisation of...
TRANSCRIPT

International Journal of Crashworthiness, 2013Vol. 18, No. 1, 64–81, http://dx.doi.org/10.1080/13588265.2012.745692
Experimental method for dynamic residual strength characterisationof aircraft sandwich structures
N.W. Baileya∗, M.A. Battleya and M. Zhoub
aDepartment of Mechanical Engineering, The University of Auckland, Auckland, New Zealand; bThe George W. Woodruff School ofMechanical Engineering, Georgia Institute of Technology, Atlanta, Georgia, USA
(Received 21 June 2012; final version received 30 October 2012)
This study investigates the effect of dynamic loading on the residual of sandwich structures used in aircraft interiorscomprising glass fibre phenolic resin face sheets and Nomex R© honeycomb core. A dynamic edgewise compression testmethod for residual strength testing of sandwich structures has been developed using a modified compressive Split HopkinsonPressure Bar apparatus. Dynamic edgewise compression at strain rates of approximately 50 s−1 for undamaged specimensshowed an average increase of 26% in compression strength compared with equivalent static edgewise compression tests.For low levels of indentation damage there was a 27% reduction in residual dynamic compressive strength compared with a15% reduction in residual static compressive strength for equivalent prior damage. This new experimental method providesinsights into the dynamic edgewise response of composite sandwich structures to aid in the design and development of futureaeronautical structures.
Keywords: sandwich; honeycomb; dynamic; aircraft
1. Introduction
Sandwich structures comprising thin face sheets and a cel-lular core have been used extensively in aerospace applica-tions for their high strength, stiffness and associated weightsavings. Due to their geometrical configuration, sandwichstructures have several possible failure modes depending onthe loading conditions, which include face sheet fracture,wrinkling, core shear failure, shear crimping and globalbuckling [11, 26]. Phenolic-based glass fibre-reinforcedplastics (GFRP) are widely used in interior aircraft ap-plications due to their superior flammability resistance. Acommonly used core is phenolic-impregnated aramid fi-bre paper such as the product range known as Nomex R©honeycomb.
Structures must meet strict design requirements thatare intended to maintain their structural integrity underdynamic loading typical of an associated crash landing.Regulations specify that aircraft must be capable of with-standing significant loads, some replicating a survivablecrash. Specifically, Federal Aviation Regulation Part 25,Section 25.561 on Emergency Landing Dynamic Condi-tions, describes the certification loads that items of massmust be certified to [7]. This states that components mustbe able to withstand peak floor decelerations of up to 9.0 gforward.
Classification of in-plane compression for design allow-ables is typically carried out using the edgewise compres-
∗Corresponding author. Email: [email protected]
sion method as described in ASTM C364 – ‘Standard TestMethod for Edgewise Compressive Strength of SandwichConstructions’ [2] or the beam flexural test method ASTMD7249 – ‘Standard Test Method for Facing Properties ofSandwich Constructions by Long Beam Flexure’ [1].
Thin face sheet sandwich structures loaded in compres-sion are likely to fail by wrinkling of the face sheet [3]. Thisinstability failure mode is governed by the critical load atwhich the core can no longer stabiles the face sheet whichbuckles locally into or out of the core. Usually this localbuckling failure occurs with a very small wavelength and isimmediately followed by catastrophic failure of the struc-ture as the opposite face sheet cannot support the load. Theface sheet fractures as a result of localised buckling and thefailure can often be mistaken for pure compression failureof the face sheet material. Failure is attributed to wrinklingfailure due to the lower critical load than what would beexpected from a pure compressive failure of the face sheetmaterial [12, 16]. Wrinkling failure can be approximatedby the Hoff wrinkling approximation given in Equation (1)[14] (where Ef is the face sheet modulus, Ec is the out-of-plane core modulus and Gc is the core shear modulus).This semi-empirical failure criteria was developed basedon a strain energy formulation and a series of experimentaledgewise compression tests. Since 1945 this criteria hasbeen widely used for design purposes as a conservativeestimate of the critical wrinkling failure stress (σ cr),
C© 2013 Taylor & Francis
Dow
nloa
ded
by [
Seou
l Nat
iona
l Uni
vers
ity]
at 0
0:02
07
Mar
ch 2
013

International Journal of Crashworthiness 65
σcr = 0.5(EfEcGc
) 13 . (1)
Dynamic loading can cause additional and morecomplex failure modes to occur due to interactingrate-dependant material properties, inertial effects andwave propagation within the components of the sandwichstructure [12, 22]. Previous studies have mainly focusedon rate-dependent material classification of the constituentcomponents used in sandwich structures. For honeycombsandwich structures the dynamic effects may vary in thecore and face sheet components due to different constituentmaterials and cellular geometry. A study on the separateface sheet and core constituents susceptibility to strain rateby Heimbs et al. [11] found that for a strain rate of 50 s−1
the tensile strength of phenolic-based GFRP increased onaverage by 88% compared to static loading. The reasonsfor this are not certain; however, one theory attributes theincreased strength at higher strain rates to changes in thefailure mechanisms, such as an increase in fibre matrixinterface failure [4]. Heimbs also showed that the rateeffect of Nomex R© honeycomb is also significant, with anincrease of 25% in stabilised out-of-plane crush strengthfor a strain rate of 125 s−1. For in-plane compressionof Nomex R© honeycomb at 50 s−1, the plateau stressincreased by 33%. The rate dependency in the honeycombis attributed to the inertial effects during local bucklingand resulting permanent deformation of cell walls, ratherthan material rate effects [10, 27].
Experimental techniques to dynamically test materials,including metals and composites, are difficult to performwhen compared with static test methods and the results areoften difficult to interpret [4]. A review of dynamic test-ing equipment by Barre et al. [4] described the advantagesof some commonly used test systems. The most popularis the Split Hopkinson Pressure Bar (SHPB) system as itoffers high strain rate testing capability of up to 104 s−1
[22]. Other systems used for the testing of composites in-clude drop weight impact test machines and shock tubesystems. SHPB systems operate on the principle of detect-ing strain differences in measurements taken from gaugeslocated on the incident and transmission bars to determinethe impact-history of the dynamic event. Stress and strainderivations are based on the elastic bar wave theory for apulse propagating in a uniform bar. A full description of theSHPB theory can be found in [17]. Common configurationsof an SHPB system consist of a series of concentricallyaligned steel rods mounted on a rigid frame that allowslongitudinal movement of the rods through lubricated col-lars. Historically, Hopkinson pressure bar test apparatus hasbeen widely used to evaluate high strain rate effects usinga torsion bar, spring or a gas gun launch system [22]. Theapparatus can be tailored for different testing modes (com-pression, tension and shear) to obtain data on strain ratesensitivity, dynamic yield stress, damage propagation and
failure mechanisms. The SHPB is designed for mediumstrain rate testing with load rates typically between 102 s−1
and 104 s−1 [22].Previous work has been carried out by others to modify
the SHPB system to incorporate composite materials. Parket al. [19] used a compression SHPB apparatus to charac-terise the mechanical response of glass and carbon fiber-reinforced laminates to transverse impact in a three-pointloading configuration. Gilat et al. [8] modified a standardSHPB to successfully incorporate a polymer matrix spec-imen. Mahfuz et al. [18] modified the conventional SHPBsystem for testing soft materials (soft core sandwich struc-tures) by replacing the steel transmitter bar with a polycar-bonate bar.
For this set of work, a compression SHPB was used asthe experimental test system. A strain rate of 50 s−1 wasselected for this test program based on the investigations byHeimbs et al. [11] into relevant loading rates for interior air-craft components manufactured from Nomex R© honeycomband phenolic resin-based GFRP. The advantage of using thisstrain rate with an SHPB system is that there is capabilityto increase the strain rate for future work and the resultscan be compared to drop weight impact tests of the sameedgewise compression configuration. A test program is un-derway to replicate dynamic edgewise loading using a fullyinstrumented drop weight impact test machine. This willprovide comparative results to determine the effectivenessof the modified Hopkinson bar technique developed here.
Damage tolerance for aerospace composites is gener-ally defined as the capability of the structure to sustain animpact event and retain appropriate residual strength [22].A major concern with sandwich structures is the suscepti-bility of honeycomb sandwich structures to impact damageand the potential reduction in structural integrity. In-servicedamage in an aircraft cabin from sources such as mainte-nance operations or luggage and trolley impacts has thecapability to significantly reduce the load-carrying capac-ity of the structure [9].
Residual strength characterisation of the structure iscomplex because of the interactions between the faceand core constituents [24]. One method to classify dam-age is to separate the damage into two classes dependingon the severity, firstly scratches and dents, and secondlycracks/punctures, which penetrate the face sheet. The dis-tinct difference between these types of damages is that dam-age that penetrates the face sheet is more likely to be ob-served during maintenance checks. Damage that is difficultto detect during routine visual inspections is often referredto as Barely Visible Impact Damage (BVID) and this typeof damage may have a significant effect on the structuralintegrity of the component.
Out-of-plane indentation of sandwich structures typi-cally results in both face sheet and core damage. In thecase of thin face sheet sandwich structures, the face sheetdamage radius (Rf) has been shown to be approximately
Dow
nloa
ded
by [
Seou
l Nat
iona
l Uni
vers
ity]
at 0
0:02
07
Mar
ch 2
013
66 N.W. Bailey et al.
Rf
Ri
δ i
δc
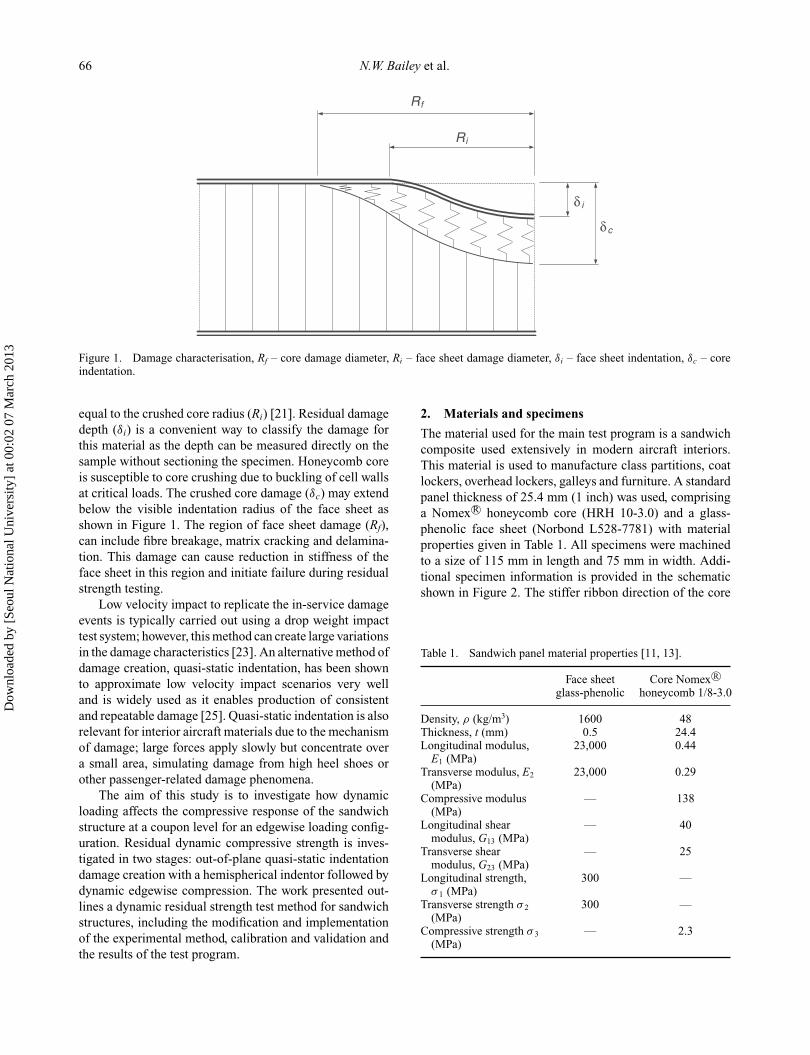
Figure 1. Damage characterisation, Rf – core damage diameter, Ri – face sheet damage diameter, δi – face sheet indentation, δc – coreindentation.
equal to the crushed core radius (Ri) [21]. Residual damagedepth (δi) is a convenient way to classify the damage forthis material as the depth can be measured directly on thesample without sectioning the specimen. Honeycomb coreis susceptible to core crushing due to buckling of cell wallsat critical loads. The crushed core damage (δc) may extendbelow the visible indentation radius of the face sheet asshown in Figure 1. The region of face sheet damage (Rf),can include fibre breakage, matrix cracking and delamina-tion. This damage can cause reduction in stiffness of theface sheet in this region and initiate failure during residualstrength testing.
Low velocity impact to replicate the in-service damageevents is typically carried out using a drop weight impacttest system; however, this method can create large variationsin the damage characteristics [23]. An alternative method ofdamage creation, quasi-static indentation, has been shownto approximate low velocity impact scenarios very welland is widely used as it enables production of consistentand repeatable damage [25]. Quasi-static indentation is alsorelevant for interior aircraft materials due to the mechanismof damage; large forces apply slowly but concentrate overa small area, simulating damage from high heel shoes orother passenger-related damage phenomena.
The aim of this study is to investigate how dynamicloading affects the compressive response of the sandwichstructure at a coupon level for an edgewise loading config-uration. Residual dynamic compressive strength is inves-tigated in two stages: out-of-plane quasi-static indentationdamage creation with a hemispherical indentor followed bydynamic edgewise compression. The work presented out-lines a dynamic residual strength test method for sandwichstructures, including the modification and implementationof the experimental method, calibration and validation andthe results of the test program.
2. Materials and specimens
The material used for the main test program is a sandwichcomposite used extensively in modern aircraft interiors.This material is used to manufacture class partitions, coatlockers, overhead lockers, galleys and furniture. A standardpanel thickness of 25.4 mm (1 inch) was used, comprisinga Nomex R© honeycomb core (HRH 10-3.0) and a glass-phenolic face sheet (Norbond L528-7781) with materialproperties given in Table 1. All specimens were machinedto a size of 115 mm in length and 75 mm in width. Addi-tional specimen information is provided in the schematicshown in Figure 2. The stiffer ribbon direction of the core
Table 1. Sandwich panel material properties [11, 13].
Face sheetglass-phenolic
Core Nomex R©honeycomb 1/8-3.0
Density, ρ (kg/m3) 1600 48Thickness, t (mm) 0.5 24.4Longitudinal modulus,
E1 (MPa)23,000 0.44
Transverse modulus, E2
(MPa)23,000 0.29
Compressive modulus(MPa)
— 138
Longitudinal shearmodulus, G13 (MPa)
— 40
Transverse shearmodulus, G23 (MPa)
— 25
Longitudinal strength,σ 1 (MPa)
300 —
Transverse strength σ 2
(MPa)300 —
Compressive strength σ 3
(MPa)— 2.3
Dow
nloa
ded
by [
Seou
l Nat
iona
l Uni
vers
ity]
at 0
0:02
07
Mar
ch 2
013

International Journal of Crashworthiness 67
75 mm
115 mm
12 mm
A1 B1/B2 C1
Cor
erib
bon
dire
ctio
n
25.4 mm
1 2
6.25 mm
Potting region
Strain gauges
y
x
Figure 2. Specimen geometry showing strain gauge placement and resin potting regions.
was aligned along the length of the specimen and used asthe primary loading direction. Potting of the specimen endswas required to prevent premature failure of the specimensat the platen contact points. If the ends are not stablilised,the free edge of the unsupported face sheet separates fromthe core before failure of the sandwich structure occurs inthe gauge length. Potting of the ends involved machiningaway the core to a depth of 6.35 mm with a standard millingmachine. A compound comprising epoxy resin (West Sys-tem 105) mixed with a phenolic micro-balloon filler (WestSystem 407) was used to fill the ends of the sandwich speci-mens to replace the core. A flat aluminum mould was used toprepare the end surfaces of the specimens. Post-machiningof the ends was also carried out to maintain the flatness andparallelism of the end surfaces to a tolerance of 0.02 mm.This step was critical to minimise possible uneven loadingof face sheets, which may result in bending of the specimencausing premature failure. To ensure that the load distri-bution was even between the face sheets, resistance straingauges (WK-06-250BF-10C, Gauge factor of 2.05) wereattached to the face sheet surface. The schematic in Fig-ure 2 shows where the gauges were placed; strain gaugesA1 and C1 were located on the edge of the front face sheetwhere Y1 = 12 mm, B1 and B2 were located in the cen-tre of the front and back face sheets respectively (numbers1 and 2 refer to the front and back face sheets). This ar-rangement of gauges allowed the measurement of straindistribution between the two face sheets (gauges B1 andB2) and also across the width of the face sheets (gauges A1and C1).
3. Experimental methods
3.1. Damage creation
Damage creation was carried out using quasi-static inden-tation of a 25.4-mm diameter hemispherical indentor to in-duce varying degrees of out-of-plane compressive damage.The loading rate was set at a constant speed of 0.5 mm/minand the specimen was supported by a rigid platen.
Initial experiments were carried out to a depth of 6 mmto determine the damage characteristics of the sandwichstructure when loaded in the out-of-plane direction. Theindentor was displaced into the face sheet up to 6 mm andthe force-displacement profile is shown in Figure 3. Theresults show a linear increase in the force response until adisplacement of approximately 2.5 mm at a load of 625 N.During the linear loading phase, the local damage to the facesheet and local core crushing were the predominant damagemechanisms observed. At the maximum load point signif-icant cracking of the face sheet starts to occur and there isa 20% average decrease in compressive load. After a dis-placement of approximately 2.5 mm there is a penetrationof the face sheet and the failure mode shifts predominantlyto core crushing. The variability in damage increases afterthis point as shown by the standard deviation profiles inFigure 3 (based on a sample of seven specimens).
The next phase of testing involved the classificationof damage in terms of the residual dent depth. This wascarried out using a loading and unloading test. The inden-tor was displaced into the specimen to the required depthand then removed at the same loading rate. The displaced
Dow
nloa
ded
by [
Seou
l Nat
iona
l Uni
vers
ity]
at 0
0:02
07
Mar
ch 2
013

68 N.W. Bailey et al.
0 1 2 3 4 5 60
100
200
300
400
500
600
700
800
z Displacement (mm)
Com
pres
sive
For
ce (
N)
Mean+/− 1 Std Deviation
Figure 3. Force-displacement profile for quasi-static indentation using a 25.4-mm hemispherical indentor.
depth at which the compressive load reached zero duringthe unloading stage was defined as the residual dent depth.This test was carried out for displaced depths of 0 to 6 mmin 1-mm increments. Results in Figure 4 show three mainstages during loading: an initial loading region with a min-imal variation in the damage, a step change increase inresidual dent depth between 2 mm and 3 mm, and a fi-nal region with more variability in the damage created. At2.5-mm indentation cracking and splitting of the face sheetstarts to occur, hence damage depths beyond this are likelyto be easily identified during routine maintenance inspec-tions. Indentation depths of 1, 2 and 3 mm were used inthis study to replicate BVID, creating damage with resid-ual dent depths of 0.22, 0.67 and 1.7 mm respectively. Thedegree of damage will be referred to using these residualdent depth values.
3.2. Static edgewise compression
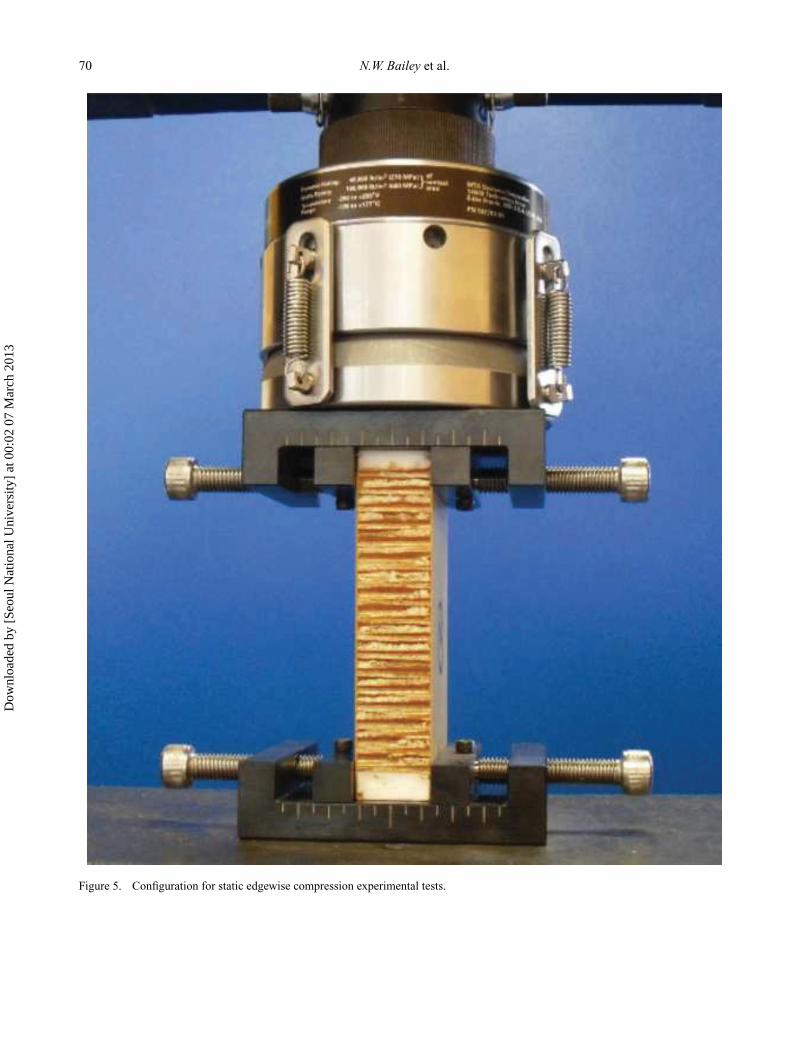
Static residual strength testing was carried out as per ASTMC364 [2] as a comparative study for the dynamic residualstrength test method under development. Specimens wereclamped using fixtures at both ends of the specimen totransfer the load evenly from the spherical loading headand to the base of the universal testing machine as shown inFigure 5. A displacement rate of 0.5 mm/min was applied,
which induced failure within the specified time range of3–6 min for the test method. Strain gauges were used toensure that alignment of the loading platens was uniform.Strain gauges were located in the centre of each face sheetgauges (B1 and B2 in Figure 2).
The standard defines acceptable failure modes as beingthose occurring within the gauge length of the specimen onethickness distance from each end of the specimen. Wrin-kling failure is the most likely failure mode with the sand-wich structure configuration used in this study; however,observation and verification of wrinkling failure actuallyoccurring is difficult. An Olympus high-speed camera (i-Speed 2) was used to capture the failure of the sandwichstructure at 10,000 fps. Tests were carried out with the cam-era orientated normal and to the face sheet. A total of nineundamaged specimens were tested and five samples of eachdamage depth were tested.
Compressive strength was derived based on the an-tiplane core assumption that no axial load is distributedto the honeycomb core in the loading direction and the facesheets share the applied load equally. The critical stresswas calculated using the expression given in Equation (2),where F is the applied load, t is the face sheet thickness andW is the width of the specimen [16]:
σcr = F
2tW. (2)
Dow
nloa
ded
by [
Seou
l Nat
iona
l Uni
vers
ity]
at 0
0:02
07
Mar
ch 2
013

International Journal of Crashworthiness 69
0 1 2 3 4 5 60
0.5
1
1.5
2
2.5
3
3.5
Displaced depth (mm)
Res
diua
l den
t dep
th (
mm
)
Mean+/− 1 Std Deviation
Penetration of facesheet
Figure 4. Residual dent profile for quasi-static indentation using a hemispherical indentor.
3.3. Dynamic edgewise compression
The SHPB system configuration used for this study usesa gas gun to fire a projectile along the gun barrel into theincident bar as shown in Figure 6. This generates a stresswave that propagates along the incident bar through thespecimen and into the transmission bar. Initial and reflectedwaves are recorded via strain gauges located on the incidentand transmission bars at the locations indicated in Figure 6.
From the strain–time histories of incident and transmis-sion bars, the stress (σ s) in the specimen can be calculatedusing Equation (3), where E is the Young’s modulus of im-pact bars, Ao is the cross-sectional area of impact bars and Ais the cross-sectional area of the specimen face sheets. Thestrains, εi, εR and εT are recorded at the incident, reflectedand transmission locations respectively. The ‘reflected’ lo-cation refers to the wave recorded in the incident bar afterreflection from the specimen interface. This assumes thatthe core does not take any of the in-plane stress (antiplanecore assumption) as used in the static edgewise compres-sion method. The strain in the specimen (εs) is derived usingthe expression given in Equation (4), where co is the speedof sound in the bars, L is the length of the specimen and εR
is the reflected strain recorded in the incident bar:
σs = EAo
2A(εi + εR + εT ) , (3)
ε = −2∫ t
0
co
LεR(t)dt. (4)
A typical specimen used for Hopkinson bar compres-sion tests of homogeneous materials is in the order of5–10 mm in diameter. Modification to the interface con-figuration (between the incident bar, specimen and trans-mission bar) was required to incorporate a significantlylarger sandwich specimen. The focus of this modificationwas the distribution of the stress wave from the 19-mmcircular rods of the SHPB system to the edge of the spec-imen. The aim was to create a planar stress wave acrossthe full width of the specimen. Steel fixtures were designedto transfer the load across the width of the specimen us-ing a tapered shape to minimise the size of fixtures andlimit the addition of mass into the system. Explicit FiniteElement Analysis (FEA) was carried out on potential mod-ifications to the current SHPB system. Simulation of thedynamic impact was performed using Abaqus 6.9 to assistwith the design of the fixture geometry. A linear elasticmaterial model was implemented using the material prop-erties given in Table 1. Solid elements were used for thecore region (C3D8R) and shell elements for the face sheets(S4R) with a global element size of 3 mm. The fixtureand incident and transmission bars were also modelled us-ing solid elements. The model comprised approximately
Dow
nloa
ded
by [
Seou
l Nat
iona
l Uni
vers
ity]
at 0
0:02
07
Mar
ch 2
013
70 N.W. Bailey et al.
Figure 5. Configuration for static edgewise compression experimental tests.
Dow
nloa
ded
by [
Seou
l Nat
iona
l Uni
vers
ity]
at 0
0:02
07
Mar
ch 2
013

International Journal of Crashworthiness 71
V
Incident bar Specimen Transmission bar
5550 mm
GaugeGauge
450 mm 450 mm
Figure 6. Experimental layout of Split Hopkinson Pressure Bar (SHPB).
34,000 elements for the original configuration (Figure 7a)and 50,000 elements for the modified configuration with thenew fixtures attached (Figure 7b). Simulations were carriedout to determine what effect the addition of the modifica-tion had on the propagation of stress waves in the specimen,with stress wave results shown in Figure 8 at 20 μs afterthe initial impact. The simulation modelled the impact for atotal of 400 μs. Analysis of the fixture was carried out withan initial velocity of the incident bar of 5.5 m/s to replicatethe desired loading strain rate of 50 s−1. For the unmodifiedconfiguration, the stress results shown in Figure 8a illustratea localized stress concentration at the impact point whichdevelops into a narrow stress wave as it propagates throughthe specimen. The maximum stress in the concentrated areanear the impact point observed in Figure 8a is 37% greaterthan the maximum stress in the same area shown in Fig-ure 8b, demonstrating that the modification improves thedispersion of energy across the width of the specimen andincreases the uniformity of loading.
The final fixture design is shown in Figure 9. The spec-imen slides into the middle slot but is not clamped. A re-cess in the angled fixture and a centering ring are used toalign the fixture with a cylindrical steel bar of the test rig.The region of the specimen supported in the z-directionis the part of the specimen, which is lightly clamped inthe static edgewise method ASTM C364 [2]. The modifiedSHPB test configuration with additional fixtures is shown inFigure 10.
Calibration of the SHPB system requires the transmis-sion and incident bars to be configured without an attachedspecimen [2]. To calibrate, strain pulses from an impactare recorded at the incident and transmission locations andthe two recorded pulses should be ‘approximately identi-cal and rectangular in shape’ [2]. The SHPB was installedwith new fixtures and an impact carried out. Strain profilesshown in Figure 11 show similar pulses in terms of mag-nitude, and the shape is rectangular as required. The firstpulse shown in Figure 11 is the wave propagating through
the incident bar and the second pulse is the wave that prop-agates through the transmission bar. The pulse recorded inthe transmission bar has to pass through the interface atthe boundary between the incident and transmission barswhich in this test case means that the pulse also has to passthrough the new fixtures attached to the end of each bar.As the strain pulses were approximately identical and rect-angular in shape, it suggested that the new fixtures wereadequately incorporated into the SHPB system.
Tests were carried out at various gas gun pressures todetermine the relationship between set pressure, impact ve-locity and strain rate. For the target strain rate of 50 s−1
this correlated to a gas gun pressure of 40 psi, which wasused for the main test program. An impact mass of 1.35 kgwas used for the striker bar projectile. A high-speed camera(Imacon 200) was used to capture the impact event to eval-uate damage propagation and failure in the face sheet of thesandwich specimen. The high-speed camera was orientatednormal to the face sheet to capture the crack propagationwithin the laminate. The camera was triggered using thestrain output from the incident bar. A time delay was addedto account for the time taken for the pulse to travel fromthe strain location to the specimen. The frame rate on thecamera was set at 30,000 fps, which adequately capturedthe failure progression in the face sheet of the specimen.The number of frames recorded by the camera was limitedto 16 due to the number of CCD modules and this restrictedthe recording time to 500 μs. Lighting was provided by aPhotogenic Powerlight 2500DR 1000 W. This light systemwas triggered by the camera and set to flash at 379 W withan ambient light setting of 134 W.
To verify the use of new fixture in the system, thestrain uniformity in the specimen during loading was in-vestigated. Resistance strain gauges were attached to spec-imens at the locations shown in Figure 2 in Section 2(‘Materials and Specimens’). Two cases were tested: uni-formity between the faces, and uniformity across the face.Strain was recorded at 2.0 MHz and recorded for a total
Dow
nloa
ded
by [
Seou
l Nat
iona
l Uni
vers
ity]
at 0
0:02
07
Mar
ch 2
013

72 N.W. Bailey et al.
Figure 7. Split Hopkinson Pressure Bar (SHPB) test configurations with FEA mesh: (a) without modification, (b) with new fixture.
duration of approximately 1400 μs. Impact tests were car-ried out at loading levels low enough to avoid failure ofthe specimen. The strain data shown in Figures 12a and12b show the results of a 3.3-m/s impact and strain rate of28.7 s−1.
A difference in strain recorded between the two facesheets indicates bending in the specimen. The percent-age bending (By) in the specimen can be calculated usingEquation (5). A maximum allowable bending of 10% at amaximum applied force is specified in the static edgewise
Dow
nloa
ded
by [
Seou
l Nat
iona
l Uni
vers
ity]
at 0
0:02
07
Mar
ch 2
013

International Journal of Crashworthiness 73
Figure 8. Progression of wave front through the sandwich struc-ture face sheet for a 5.5-m/s impact at t = 20 μs (after intialimpact): (a) without modification, (b) with new fixture.
compression test standard [2]. A bending of 5.7% was cal-culated for the test data displayed in Figure 12a,
By = 100ε1 − ε2
ε1 + ε2. (5)
The correlation between strain channels was also quan-tified using the Russell Error Method [15, 20]. This methodevaluates differences in phase and magnitude between tran-sient data sets to give an overall error measure. For deter-mining the correlation between arbitrary variables A and B,the magnitude (MR), phase (PR) and total comprehensiveerror (CR) values are calculated respectively using Equa-tions (6)–(9) (ai and bi refer to the values of independentvariables for each data point and N is the total number of
32
35
9.6
3.3
85
z
y
x
Figure 9. New Split Hopkinson Pressure Bar (SHPB) fixturegeometry manufactured from steel with dimensions in millimetre.
data points):
MR =√ψAA
ψBB− 1, (6)
PR = 1
πcos−1
(ψAB√ψAAψBB
), (7)
CR =√M2R + P 2
R, (8)
where
ψAA =∑N
i a2i
N, ψBB =
∑Ni b
2i
N, ψAB =
∑Ni aibi
N.
(9)The error is classified as excellent (CR < 0.15), acceptable(0.15 < CR < 0.28) or poor (CR > 0.28). For the dis-tribution of load between two face sheets, the correlationbetween the strain profiles in Figure 12a gives a CR value of0.134, which is classified as excellent. For the comparisonof strain profiles across the width of the face sheet given inFigure 12b, the CR value is 0.0941, which is also consid-ered an excellent correlation. This gives confidence that thespecimens were being loaded evenly with modifications tothe SHPB system.
4. Results and discussion
An experimental test program was undertaken to investi-gate the effect of out-of-plane compression damage on thedynamic residual strength of a thin face sheet sandwichstructure. The damage tolerance investigation was carriedout by first damaging the specimens using the quasi-static
Dow
nloa
ded
by [
Seou
l Nat
iona
l Uni
vers
ity]
at 0
0:02
07
Mar
ch 2
013

74 N.W. Bailey et al.
Figure 10. Modification to Split Hopkinson Pressure Bar (SHPB) showing new fixture and attached sandwich specimen.
0 100 200 300 400 500 600
−0.02
−0.01
0
0.01
0.02
0.03
0.04
0.05
Time μs
Vol
tage
Incident WaveTransmission Wave
Figure 11. Calibration graph for Split Hopkinson Pressure Bar (SHPB) showing voltage output from strain gauges.
Dow
nloa
ded
by [
Seou
l Nat
iona
l Uni
vers
ity]
at 0
0:02
07
Mar
ch 2
013

International Journal of Crashworthiness 75
200 400 600 800 1000 1200 1400
0
1000
2000
3000
4000
5000
6000
7000
8000
9000
10000
Time (μs)
Str
ain
(μst
rain
)
(a)
B1B2
200 400 600 800 1000 1200 1400
0
1000
2000
3000
4000
5000
6000
7000
8000
9000
10000
Time (μs)
Str
ain
(μst
rain
)
(b)
A1C1
Figure 12. Comparative strain output for a 3.3-m/s impact, (a) for gauges in the centre of each face sheet, (b) for gauges on the edges ofone face sheet.
damage creation process, followed by dynamic edgewiseloading at a target strain rate of 50 s−1. Two specimens weretested for each damage scenario of 0.22, 0.67 and 1.7-mmresidual dent depth. Time-histories of voltage data recordedat two resistance strain gauge locations in the transmissionand incident bars were post-processed in Matlab. CompleteSHPB results from the test of the specimen with no priordamage are shown in Figure 13. This demonstrates how theincident, transmission and reflected waves (shown in Fig-ures 13b, 13c and Figure 13d respectively) are extractedfrom the raw data (Figure 13a). The data are then processed
using Equations (3) and (4) to plot stress (Figure 13e) andstrain (Figure 13f).
In order to validate the SHPB method modification totest sandwich structures, strain outputs were compared bythe SHPB method (strain outputs from loading bars) andthe strain gauges located on the specimen. This methodwas used successfully by Goldberg et al. [8] to verifythe modification made to test the dynamic tensile proper-ties of carbon/epoxy composite laminates using the SHPBsystem. Strain results from gauges located on undamagedspecimens were used for comparisons: one gauge from the
Dow
nloa
ded
by [
Seou
l Nat
iona
l Uni
vers
ity]
at 0
0:02
07
Mar
ch 2
013

76 N.W. Bailey et al.
0 200 400 600 800−0.03
−0.02
−0.01
0
0.01
0.02
(a) Raw outputs
Time (μs)
Vol
tage
(V
)
Incident barTransmission bar
0 100 200 300 400−0.01
0
0.01
0.02
0.03(b) Incident wave
Time (μs)
Vol
tage
(V
)
0 100 200 300 400−0.010
0.000
0.010
0.020
(c) Transmission wave
Time (μs)
Vol
tage
(V
)
0 100 200 300 400−0.03
−0.02
−0.01
0
0.01
0.02(d) Reflected wave
Time (μs)
Vol
tage
(V
)
0 100 200 300 4000
100
200
300(e) Stress
Time (μs)
Str
ess
(MP
a)
0 100 200 300 400−5
0
5
10x 10
−3 (f) Strain
Time (μs)
Str
ain
Figure 13. Split Hopkinson Pressure Bar (SHPB) output and processing of data.
central location (gauge B1 shown in Figure 2) and anotherfrom the edge location (gauge A1 shown in Figure 2). Strainresults from the gauges and the SHPB derivation are shownin Figure 14. Despite some oscillation in the data the slopeof the strain profile is similar for each data set and themaximum strain values reached at the failure point are alsocomparable. This verifies that the calculation of strain viathe SHPB method from the gauges on the incident and trans-mission bars is successful in producing meaningful resultswith the addition of new fixtures into the SHPB system.
Results for the dynamic tests were compared with pre-vious static edgewise compression results. Static residualstrength results gave an average ultimate failure stress of
235 ± 10 MPa. The Hoff and Mautner wrinkling failureapproximation (Equation (1)) gives a failure stress of 250MPa, which is 6.4% higher than the average failure stressfrom static edgewise compression tests. Conversely, aver-age dynamic compressive failure occurred at 296 ± 18MPa, which is an increase of 26% compared with the staticedgewise compression and an 18% increase compared withthe Hoff and Mautner approximation. This is significantlyless than the 88% increase observed by Heimbs et al. [11]from tensile tests of the constituent face sheet material atthe same strain rate of 50 s−1 but similar to the 25% increasein stabilised out-of-plane crush strength. During wrinklingfailure the face sheet buckles locally, causing compression
Dow
nloa
ded
by [
Seou
l Nat
iona
l Uni
vers
ity]
at 0
0:02
07
Mar
ch 2
013

International Journal of Crashworthiness 77
0 50 100 150 200 250 3000
0.2
0.4
0.6
0.8
1
Time (μs)
Str
ain
(%)
Specimen Gauge A1Specimen Gauge B1SHPB Strain
Figure 14. Strain comparisons for Split Hopkinson Pressure Bar (SHPB) method and strain gauges on specimen.
of the core in the out-of-plane direction. Therefore, theobserved rate effect may not just be a result of rate de-pendency of the glass-phenolic face sheet material and ispossibly related to the sensitivity of the Nomex R© Honey-comb to inertial effects during out-of-plane compression ofthe core as a result of wrinkling failure.
Final failure of the undamaged static specimens wascommonly a compressive face sheet fracture across the cen-tre of one face sheet as a result of wrinkling instability asshown in Figure 15a. Dynamic failure of an undamagedspecimen shown in Figure 15b demonstrates substantialbranching of the crack. Crack branching is the result ofincreased availability of kinetic energy due to high-impactvelocities. This has been found to be a phenomenon inthe dynamic failure of brittle fibre-reinforced plastics, es-pecially under impact loading [5]. When the energy being
imparted to the specimen can no longer be dissipated by anincrease in crack velocity, branching occurs, which createsmore fractured surfaces for absorbing energy [6].
4.1. Damage tolerance
The residual strength testing was carried out using damagedspecimens with 0.22, 0.67 and 1.77-mm deep residual dentsin the centre of one face sheet. An example of failure mech-anisms during residual strength testing (static and dynamic)of damaged samples is shown in Figure 16. The examplesshow the results of dynamic impact on pre-damaged speci-mens with a 1.7-mm indentation. Distinctly different failuremechanisms were observed in the early stages of damagedpropagation for the shown static and dynamic loading rates.In the static case, the dent depth increased with load until
Table 2. Residual strength results summary.
Loading type Strain rate (s−1)Residual damage
(mm) Damage energy (J)Edgewise failure
load (kN)Edgewise compressive
strength (MPa)Standarddeviation
Static 7.20e-05 0 0 17.6 235.2 10.41Static 7.20e-05 0.22 0.11 15.1 200.8 5.15Static 7.20e-05 0.67 0.44 12.1 161.5 7.43Static 7.20e-05 1.7 0.98 10.2 136.7 5.03Dynamic 51.9 0 0 22.2 296.1 18.3Dynamic 46.1 0.22 0.11 16.3 217.3 1.77Dynamic 44.7 0.67 0.44 13.7 182.5 3.54Dynamic 45.1 1.7 0.98 13 173.1 0.57
Dow
nloa
ded
by [
Seou
l Nat
iona
l Uni
vers
ity]
at 0
0:02
07
Mar
ch 2
013

78 N.W. Bailey et al.
Figure 15. Post-failure photos of edgewise compression failure:(a) static (strain rate = 7.2 × 10⁻⁵ s–1), (b) dynamic (strain rate ≈50 s–1).
the crack slowly moved out from the central damage region.At the final failure point, rapid propagation of the crack oc-curred resulting in complete failure of the face sheet acrossthe width of the specimen. In the case of dynamic failure(Figure 16) the dent region grew in depth and also in widthas load increased. Fracture of the specimen initiated at theedge of this buckled region with a final crack propagating tothe edge of the specimen. Complete failure of the specimentook 22 μs in the dynamic case compared with 24 ms in thestatic case. The increased indentation of the core in the pre-existing damage region during the dynamic loading eventcauses rapid compression of core in the out-of-plane direc-tion before the final fracture of the face sheet. Therefore,the effect of dynamic loading on pre-damaged specimenscould also be related to the sensitivity of the honeycombcore to inertial effects.
A summary of the static and dynamic residual strengthresults are given in Table 2 showing the significance of load-ing rate on damaged specimens. Failure load is determinedfrom the force data profiles where the catastrophic failure ofthe face sheet causes a sudden drop in the applied load. Thestandard deviation values given in Table 2 indicate that thereis more variability in the edgewise compression strength forspecimens with no damage regardless of whether the load-ing is static or dynamic. Damaged specimens provide aninitiation point in the damaged region from where a crackwill most likely propagate. Without prior damage in thespecimen, compression failure is initiated at the edge of theface sheet and attributed to local instability of the face sheetcommonly known as wrinkling. In this case failure occursas one rapid event in both static and dynamic loading ofundamaged specimens. Therefore, without a specific initi-ation point for the compressive failure to propagate from,the variability in compressive residual strength test dataincreases.
The dynamic residual strength results are summarisedin Figure 17, including a comparison to the static results.Error bars for each test case showing ±1 standard devia-tion quantify the variability. The dynamic damage tolerancecurve in Figure 17 is offset above the static curve, meaningthat for all levels of prior damage the residual compressivestrength is higher for dynamic loading compared with staticloading. The reduction in dynamic compressive strength fordamaged specimens is sensitive to even small damage, illus-trated by a 27% decrease in compressive strength on averagebetween undamaged specimens and those with a 0.22-mmresidual dent; static residual tests of specimens with equiv-alent damage resulted in a 15% reduction in compressivestrength. A plateau region is evident in each of the dam-age tolerance curves shown in Figure 17 where the residualstrength levels off between dent depths of 0.66 and 1.7 mm.This region corresponds with the transition point in thedamage-creation phase, where the face sheet is penetratedbeyond a dent depth of approximately 1.2 mm (displaceddepth of 2.5 mm).
Dow
nloa
ded
by [
Seou
l Nat
iona
l Uni
vers
ity]
at 0
0:02
07
Mar
ch 2
013

International Journal of Crashworthiness 79
Figure 16. High-speed video capture of static and dynamic edgewise compression failure mechanisms for sandwich specimens withprior damage of a 1.7-mm dent (time values refer to time).
0 0.2 0.4 0.6 0.8 1 1.2 1.4 1.6 1.8 2
120
140
160
180
200
220
240
260
280
300
320
Residual Dent Depth Damage (mm)
σ c (M
Pa)
DynamicStatic
Figure 17. Residual strength profile for static (strain rate = 7.2 ×10⁻⁵ s–1) and dynamic (strain rate ≈ 50 s–1) edgewise compression tests.
Dow
nloa
ded
by [
Seou
l Nat
iona
l Uni
vers
ity]
at 0
0:02
07
Mar
ch 2
013

80 N.W. Bailey et al.
5. Conclusions
A test method has been developed for dynamic edge-wise compression loading of sandwich structures based onSHPB methodology. The new test method has successfullyenabled dynamic edgewise compression characterisation ofglass-phenolic Nomex R© honeycomb sandwich structuresat a strain rate of approximately 50 s−1. Calibration andverification tests demonstrated that the addition of steel fix-tures to incorporate a sandwich structure specimen into theSHPB system achieved acceptable uniformity of the speci-men strain fields.
Comparisons were made between the dynamic tests andequivalent static edgewise test results for undamaged spec-imens. Results for dynamic residual strength showed anaverage increase of 26% in compression strength comparedto equivalent static tests. Significant branching of crackswas observed during dynamic failure of the face sheet.
In the case of specimens with pre-existing damage,a higher dynamic residual strength was recorded for allcases of indentation damage compared with static residualstrength. Residual strength tests showed increased inden-tation into the core during dynamic failure that was notobserved in static tests. Even for low levels of indentationdamage (0.22-mm dent depth) there was a 27% reductionin residual dynamic compressive strength compared with a15% reduction in residual static compressive strength forequivalent prior damage.
Characterisation of sandwich structures solely usingstatic test methods may therefore not be definitive in pre-dicting the force response and mechanisms of failure whensubjected to dynamic loads. This study illustrates impor-tant phenomena in the edgewise compressive response ofsandwich structures under dynamic loading that requireconsideration in the design of aircraft components utilisingsandwich structures.
AcknowledgementsThe work presented has been supported by The Universityof Auckland Doctoral Scholarships, The Foundation for Re-search Science and Technology of New Zealand through grantUOAX0710, Fulbright NZ – Ministry of Research Science andTechnology, The US Office of Naval Research grant numberN00014-09-1-0618, The New Zealand Defence Force – DefenceTechnology Agency and Altitude Aerospace Interiors. Thanksto the Georgia Institute of Technology staff for their technicaland professional assistance, especially Dr Min Zhou, SiddharthAvachat and Rick Brown.
References[1] ASTM International, ASTM, Standard Test Method for Fac-
ing Properties of Sandwich Constructions by Long BeamFlexure, in D7249/D7249M – 06, ASTM International,WestConshohocken, PA, 2006.
[2] ASTM International, ASTM, Standard Test Method forEdgewise Compressive Strength of Sandwich Construc-
tions, in C 364/C 364M – 07, ASTM International, WestConshohocken, PA, 2007.
[3] N. Bailey, M. Battley, and M. Zhou, Dynamic damage tol-erance for aircraft sandwich structures: experiments andmodeling, Proceedings of the 52nd Structures Conference ofAmerican Institute of Aeronautics and Astronautics, Denver,CO, 2011.
[4] S. Barre, T. Chotard, and M.L. Benzeggagh, Comparativestudy of strain rate effects on mechanical properties of glassfibre-reinforced thermoset matrix composite, Composites A:Appl. Sci. Manuf. 27 (1996), pp. 1169–1181.
[5] I. Daniel, E. Gdoutos, and Y. Rajapakse, Major Accomplish-ments in Composite Materials and Sandwich Structures:An Anthology of ONR Sponsored Research, Springer, NewYork, 2009.
[6] V. Evora, N. Jain, and Shukla, Static and dynamic fracturetoughness and crack propagation in nanocomposites, Pro-ceedings of the 11th Conference on Fracture, Turin, Italy,2005.
[7] Federal Aviation Administration, FAA, PART 25 – Airworthi-ness Standards: Transport Category Airplanes, Subpart C –Structure, Emergency Landing Conditions, in Federal Avi-ation Regulations, D.o.T., Federal Aviation Administration,Washington, DC, 2012.
[8] A. Gilat, R.K. Goldberg, and G.D. Roberts, Experi-mental study of strain-rate-dependent behavior of car-bon/epoxy composite, Compos. Sci. Technol. 62 (2002), pp.1469–1476.
[9] P.R. Hampson and M. Moatamedi, A review of compositestructures subjected to dynamic loading, Int. J. Crashwor-thiness 12 (2007), pp. 411–428.
[10] J.J. Harrigan, S.R. Reid, and C. Peng, Inertia effects in impactenergy absorbing materials and structures, Inter. J. ImpactEng. 22 (1999), pp. 955–979.
[11] S. Heimbs, P. Middendrof, C. Hampf, F. Hahnel, and K.Wolf, Numerical simulation of aircraft interior componentsunder crash loads, Int. J. Crashworthiness 13 (2008) pp.511–521.
[12] S. Heimbs, S. Schmeer, P. Middendrof, and M. Maier,Strain rate effects in phenolic composites and phenolic-impregnated honeycomb structures, Compos. Sci. Technol.67 (2007), pp. 2827–2837.
[13] Hexweb, Hexweb Honeycomb Sandwich Design Technol-ogy, Hexcel Composites, Cambridge, 2000.
[14] N.J. Hoff and S.E. Mautner, The buckling of sandwich typepanels, J. Aeronaut. Sci. 12 (1945, July), p. 285.
[15] J. LeBlanc and A. Shukla, Dynamic response and dam-age evolution in composite materials subjected to underwa-ter explosive loading: An experimental and computationalstudy, Compos. Struct. 92 (2010), pp. 2421–2430.
[16] R. Ley, W. Lin, and U. Mbanefo, Facesheet Wrinklingin Sandwich Structures, NASA Langley Research Center,Hampton, VA, 1999.
[17] U.S. Lindholm, Some experiments with the split HopkinsonPressure Bar, J. Mech. Phys. Solids 12 (1964), p. 18.
[18] H. Mahfuz, W.A. Mamun, A. Haque, S. Turner, H.Mohamed, and S. Jeelani, An innovative technique for mea-suring the high strain rate response of sandwich composites,Compos. Struct. 50 (2000), pp. 279–285.
[19] S.W. Park, M. Zhou, and D.R. Veazie, Time-resolved impactresponse and damage of fiber-reinforced composite lami-nates, J. Compos. Mater. 34 (2000), pp. 879–904.
[20] H. Sarin, M. Kokkolaras, G. Hulbert, P. Papalambros,S. Barbat, and R.J. Yang, Comparing time historiesfor validation of simulation models: error measures and
Dow
nloa
ded
by [
Seou
l Nat
iona
l Uni
vers
ity]
at 0
0:02
07
Mar
ch 2
013

International Journal of Crashworthiness 81
metrics, J. Dyn. Syst., Meas. Control 132 (2010), pp.061401-1–061401-10.
[21] A. Shipsha and D. Zenkert, Compression-after-impactstrength of sandwich panels with core crushing damage,Appl. Compos. Mater. 12 (2005), pp. 149–164.
[22] R.L. Sierakowski and S.K. Chaturvedi, Dynamic Loadingand Characterization of Fiber-Reinforced Composites, JohnWiley, New York, 2007.
[23] D.D. Symons, Characterisation of indentation damage in0/90 lay-up T300/914 CFRP, Compos. Sci. Technol. 60(2000), pp. 391–401.
[24] J. Tomblin, T. Lacy, B. Smith, and A. Hooper, Review ofDamage Tolerance for Composite Sandwich Airframe Struc-
tures, US Department of Transportation, Federal AviationAdministration, 1999.
[25] T.K. Tsotsis and S.M. Lee, Characterization of lo-calized failure modes in honeycomb sandwich pan-els using indentation, in Composite Materials:Testing and Design Vol. 12 (ASTM STP 1274),ASTM International, West Conshohocken, PA, 1996,p. 26.
[26] D. Zenkert, An Introduction to Sandwich Construction,Wiley-Blackwell, Hoboken, NJ, 1995.
[27] H. Zhao and G. Gary, Crushing behaviour of aluminiumhoneycombs under impact loading, Int. J. Impact Eng. 21(1998), pp. 827–836.
Dow
nloa
ded
by [
Seou
l Nat
iona
l Uni
vers
ity]
at 0
0:02
07
Mar
ch 2
013