experimental methods in genome analysis. genomic sequences are boring...
Post on 21-Dec-2015
217 views
TRANSCRIPT

Experimental methods in genome analysis

Genomic sequences are boringGATCAATGATGATAGGAATTGAAAGTGTCTTAATTACAATCCCTGTGCAATTATTAATAACTTTTTTGTT CACCTGTTCCCAGAGGAAACCTCAAGCGGATCTAAAGGAGGTATCTCCTCAAAAGCATCCTCTAATGTCA GAAGCAAGTGAGCACTGGGAAGAATACTTGAGAAAGTGGCATGCTTACGAAACTGCTAAGGTGCACCCCA GGGAGGTTGCAAAACCTGCATCTAAAGGAAAGCCCAGGCTTCCAAAGGCTTCTCCTAAGGCAACCTCCAA ACCCAAGCACAGGCATAGGAAAGCACAAATCAAGACCCCGGAGACCCTCGGGCCAAATACAAATTCCAAT AACAACATAGAAGATGATCAGGATGTCCATTCCGAACAGCACCCTTCCCAAAAGGATCTCCAGCAGCTTA AGAAAAAGCCCCGGATCGTCCTACCTTGGTGGTGTGTTTATGTTGCATGGTTTTTGGTTTTTGCTACTTC TAGCATATCCTCATTCTTCATTGTATTTTATGGACTGACTTACGGCTATGACAAGTCAATAGAATGGCTC TTTGCATCTTTTTGTTCATTCTGTCAGTCAGTTCTTCTGGTGCAGCCATCTAAAATTATACTCCTGTCAG GCTTCAGAACGAATAAACCCAAGTATTGCAAAAACCTTTCATGGTCAACCAAGTATAAATATACTGAGAT CAGGTTGGATGGAATGCGTATGCATCCAGAAGAAATGCAGAGGATACATGACCAGATCGTCCGAATCCGA GGCACGAGGATGTACCAACCCCTTACAGAAGATGAAATCAGAATATTCAAAAGAAAGAAGAGGATCAAGA GAAGAGCACTCCTGTTTCTGAGTTACATTCTAACTCACTTTATCTTTCTAGCCCTTCTGTTGATCCTTAT CGTCTTACTACGTCACACTGACTGCTTTTACTATAACCAGTTTATTCGTGATCGGTTCTCTATGGATCTT GCTACTGTGACTAAGCTGGAAGACATCTATAGATGGCTAAACAGCGTGCTGTTGCCTTTGTTACACAATG ACCTGAATCCAACATTTCTTCCTGAAAGCTCGTCTAAAATCCTTGGCCTTCCATTGATGAGGCAAGTGAG AGCAAAATCTAGTGAAAAAATGTGTCTACCTGCCGAAAAGTTTGTGCAAAACAGCATCAGAAGAGAAATT CATTGTCACCCCAAATATGGCATTGACCCAGAAGACACAAAAAACTATTCTGGCTTTTGGAATGAAGTTG ATAAGCAGGCTATAGATGAGAGTACCAATGGATTTACTTATAAGCCTCAAGGAACGCAATGGCTATATTA TTCCTATGGACTACTACACACCTATGGATCTGGAGGATATGCACTCTATTTTTTTCCAGAACAGCAGCGG TTTAATTCCACACTGAGGCTCAAAGAACTTCAAGAAAGCAATTGGCTGGATGAGAAGACATGGGCTGTGG TTTTGGAATTAACAACTTTTAATCCAGATATAAATCTGTTCTGTAGCATTTCGGTCATATTTGAAGTCTC TCAGTTAGGAGTTGTCAACACAAGCATATCTCTGCACTCTTTTTCACTTGCTGATTTTGACAGAAAAGCT TCAGCAGAAATCTACTTGTATGTGGCCATTCTCATTTTTTTCTTAGCCTACGTTGTTGATGAGGGTTGTA TCATTATGCAAGAAAGAGCCTCCTATGTGAGAAGTGTGTATAATTTGCTCAACTTTGCTTTAAAGTGCAT ATTTACTGTGTTGATTGTGCTCTTTCTCAGGAAACATTTCCTGGCCACTGGCATAATTCGGTTTTACTTG TCGAACCCAGAAGACTTCATTCCCTTTCATGCAGTTTCTCAGGTAGATCACATTATGAGGATAATTTTGG GTTTCCTGTTATTTCTGACAATTTTGAAGACCCTCAGGTATTCCAGATTCTTCTACGATGTGCGCCTGGC TCAGAGGGCCATCCAGGCTGCCCTCCCTGGCATCTGCCACATGGCATTTGTTGTGTCCGTGTATTTCTTC GTATACATGGCTTTTGGTTACCTGGTGTTTGGTCAGCATGAATGGAACTACAGTAACTTGATTCATTCCA CTCAGACAGTATTTTCCTATTGTGTCTCAGCTTTCCAGAACACTGAATTTTCCAATAACAGGATTCTGGG GGTCCTGTTCCTCTCATCTTTCATGCTGGTGATGATCTGCGTCTTGATCAACTTATTTCAGGCTGTAATT

Making sense of genomic seqs
• Look for repeats• HMM analysis• Compare genomes to each other• Compare to other kind of experimental data
– Which kinds of data can you think of?

Other kinds of data
1. mRNA (EST)
2. RNA sequences & structures
3. Protein sequences
4. Protein structures
5. SNPs, polymorphisms
6. Gene expression (microarray)
7. Protein expression (2D protein gels)
8. Protein interaction
9. Metabolic pathways
10. Regulatory pathways

-OMEs
• Genome • Transcriptome• Proteome• Interactome• Metabolome• Phenome

-OMEs Technologies
• Genome • Transcriptome• Proteome• Interactome• Metabolome• Phenome
Sequencing
Microarray ESTs
Computer (ORFs)
Y2H, Mass-spec
Mass-spec
Phenotype
Biochemical
Disease

Transcript databases
• RefSeq contains full length sequences of mRNAs, carefully reviewed– Currently 27.000 human sequences
• dbEST contains 5’ and 3’ reads of random cDNAs– Currently 4 mio. human seqs

What are ESTs?
AAAAATTTTTGGTTAACG
Reverse transcriptase
AAAAA
cDNA 1st strand
CGTTAACC TTTTTGGTTAACG

What are ESTs?
AAAAAGCAATTCGCGTTAAGC TTTTTCGTTAAGC
GCAATTCGGCAATTCG
GCAATTCG
CGTTAAGCCGTTAAGC
Cloning Vector

What are ESTs?

What are ESTs?

ESTs
• UniGene: Merge (cluster) any two ESTs when >100 bp are identical
• 4 mio -> 104.214 clusters

ESTs
UniGene: total # clusters 104.214
Cluster size Number of clusters 1 37503 2 14605 3-4 15912 5-8 10798 9-16 5978 17-32 4143 33-64 3658 65-128 4117 129-256 4109 257-512 2317 513-1024 743 1025-2048 227 2049-4096 68 4097-8192 29 8193-16384 6 16385-32768 1

Some statistics
Copies # different mRNA # of mRNAs per
per cell species abundance level
_________________________________________________
5 4000 20.000
50 3250 162.500
200 2500 500.000
1000 250 250.000
_____________________________
Total 10.000 932.500

More statistics
1.000 5.000 10.000 50.000 250.000 1.000.000
5 0.53 2.65 5.22 23.52 73.83 99.53
50 5.22 23.52 41.5 93.15 100 100
200 16.31 65.78 88.29 100 100 100
1000 65.8 99.53 100 100 100 100
Abundancelevel
Size of EST database
Rare transcripts difficult to detect!

Solutions
• Sequence ESTs from many cell types, rare transcripts might be abundant in other tissues.
• Use molecular normalization procedures prior to sequencing

Transcripts: what can we learn?
• Comparing genome sequences to transcripts allows: – Confirmation of gene predictions
– Experimental identification of Exons/Introns, 5’ UTRs, 3’ UTRs
– Alternative splicing

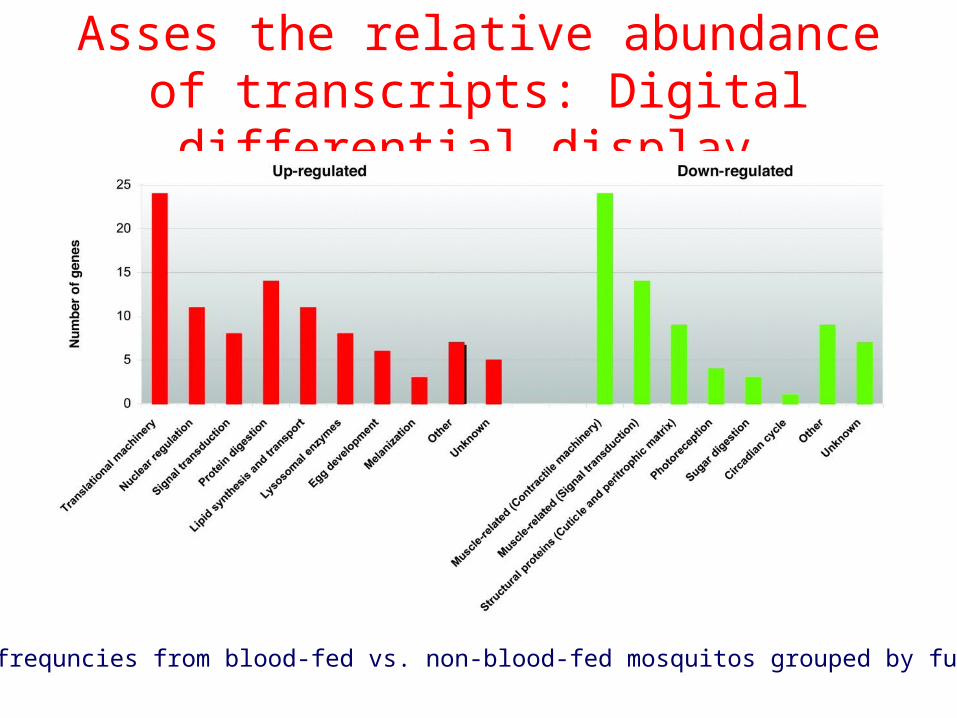
Asses the relative abundance of transcripts: Digital differential display.
EST frequncies from blood-fed vs. non-blood-fed mosquitos grouped by function

Gene ontology
• Ontology: reason for being
• Gene Ontology is a controlled vocabulary that can be applied to all organisms
• The three organizing principles of GO are – molecular function,
– biological process and
– cellular component

Protein interaction networks
• Yeast-two hybrid• Proteomics
Ho et al. 2002
Gavin et al. 2002

Protein interaction networks
• Purpose: Identify components of major protein complexes
• Defining functions for proteins with unknown function: guilt by association

Yeast two-hybrid

Nanoelectrospray ionization – tandem mass spectrometry (MS-MS)


Proteomics (Mass-spec)


Conclusions on helper data
1. mRNA (EST)
2. RNA sequences & structures
3. Protein sequences
4. Protein structures
5. SNPs, polymorphisms
6. Gene expression (microarray)
7. Protein expression (2D protein gels)
8. Protein interaction
9. Metabolic pathways
10. Regulatory pathways

Regulation of Gene Expression

Cells respond to environment
Heat
FoodSupply
Responds toenvironmentalconditions
Various external messages

Genome is fixed – Cells are dynamic
• A genome is static– Every cell in our body has a copy of same genome
• A cell is dynamic– Responds to external conditions
– Most cells follow a cell cycle of division
• Cells differentiate during development

Gene regulation
• … is responsible for the dynamic cell
• Gene expression varies according to:
– Cell type
– Cell cycle
– External conditions

Where gene regulation takes place
• Opening of chromatin
• Transcription
• Translation
• Protein stability
• Protein modifications

Transcription Factors Binding to DNA
Transcription regulation:• Certain transcription
factors bind DNA
Binding recognizes DNA substrings:
• Regulatory motifs

Promoter and Enhancers
• Promoter necessary to start transcription
• Enhancers can affect transcription from afar

Example: A Human heat shock protein
• TATA box: positioning transcription start
• TATA, CCAAT: constitutive transcription• GRE: glucocorticoid response• MRE: metal response• HSE: heat shock element
TATASP1CCAAT AP2HSEAP2CCAATSP1
promoter of heat shock hsp70
0--158
GENE
Motifs:

The Cell as a Regulatory Network
A B Make DC
If C then D
If B then NOT D
If A and B then D D
Make BD
If D then B
C
gene D
gene B
B
Promoter D
Promoter B

The Cell as a Regulatory Network (2)

DNA Microarrays
Measuring gene transcription in a high-throughput fashion
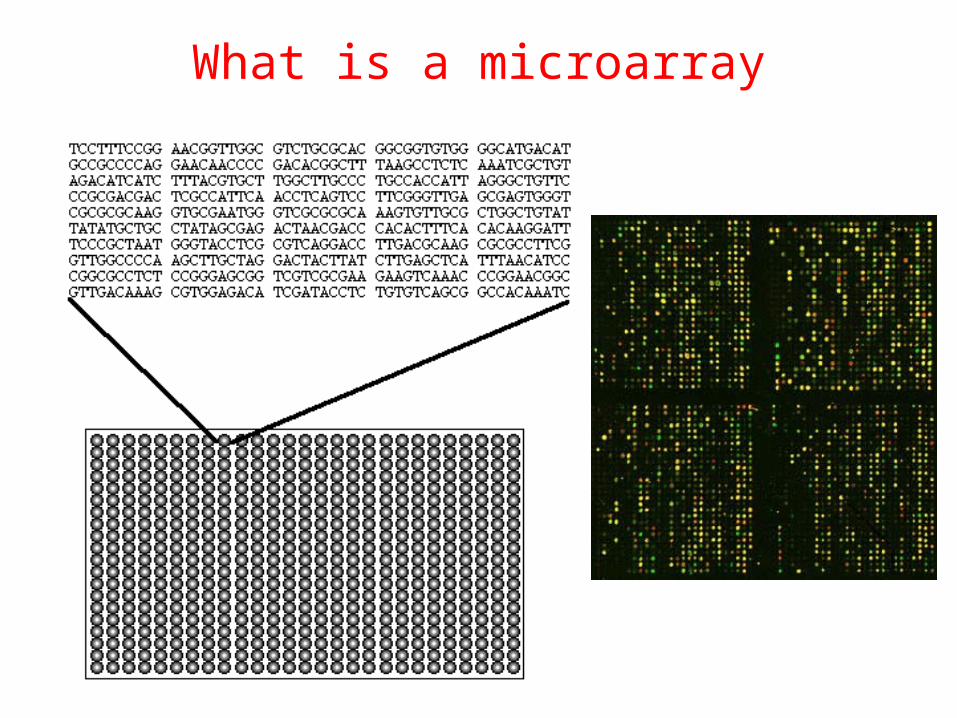
What is a microarray

What is a microarray (2)
• A 2D array of DNA sequences from thousands of genes
• Each spot has many copies of same gene
• Allow mRNAs from a sample to hybridize
• Measure number of hybridizations per spot

How to make a microarray
• Method 1: cDNA Microarrays– Use PCR to amplify a 1Kb portion of each gene
– Apply each sample on glass slide
• Method 2: DNA Chips (Affymetrix)– Grow oligonucleotides (~20bp) on glass
– Several words per gene (choose unique words)
If we know the gene sequences,
Can sample all genes in one experiment!


cDNA Microarrays• Use robot to spot glass slides at precise points with
complete gene/EST sequences • Gene expression levels measured by fluorescence
hybridisation

Microarray Experiment
RT-PCR
RT-PCR
LASER
DNA “Chip”
High glucose
Low glucose

Raw data – images
• Red (Cy5) dot – overexpressed or up-regulated
• Green (Cy3) dot – underexpressed or down-regulated
• Yellow dot– equally expressed
• Intensity - “absolute” level
cDNA plotted microarray