experimental results for hybrid energy storage systems
TRANSCRIPT

UC IrvineUC Irvine Previously Published Works
TitleExperimental results for hybrid energy storage systems coupled to photovoltaic generation in residential applications
Permalinkhttps://escholarship.org/uc/item/8wv9r5n8
JournalInternational Journal of Hydrogen Energy, 36(19)
ISSN0360-3199
AuthorsMacLay, JDBrouwer, JSamuelsen, GS
Publication Date2011-09-01
DOI10.1016/j.ijhydene.2011.06.089
Copyright InformationThis work is made available under the terms of a Creative Commons Attribution License, availalbe at https://creativecommons.org/licenses/by/4.0/ Peer reviewed
eScholarship.org Powered by the California Digital LibraryUniversity of California

i n t e rn a t i o n a l j o u r n a l o f h y d r o g e n en e r g y 3 6 ( 2 0 1 1 ) 1 2 1 3 0e1 2 1 4 0
Avai lab le at www.sc iencedi rect .com
journa l homepage : www.e lsev ie r . com/ loca te /he
Experimental results for hybrid energy storage systemscoupled to photovoltaic generation in residential applications
James D. Maclay, Jacob Brouwer*, G. Scott Samuelsen
National Fuel Cell Research Center, University of California, Irvine, CA 92697-3500, United States
a r t i c l e i n f o
Article history:
Received 18 October 2010
Received in revised form
2 June 2011
Accepted 17 June 2011
Available online 23 July 2011
Keywords:
Dynamic experimental data
Fuel cell
Electrolyzer
Solar-hydrogen
Hybrid energy storage
Renewable residential power
* Corresponding author. Tel.: þ1 949 824 199E-mail address: [email protected] (J. Brouw
0360-3199/$ e see front matter Copyright ªdoi:10.1016/j.ijhydene.2011.06.089
a b s t r a c t
An experimental solar-hydrogen powered residence simulator was built and tested. The
system consisted of a solar photovoltaic array connected to an electrolyzer which produced
hydrogen as a means of energy storage. The hydrogen was used to produce electricity in
a fuel cell that operated in parallel with a battery to meet dynamic power demand similar
to that found in residential applications. The study demonstrated the technical feasibility
of operating such a system under the simultaneous dynamics of solar input and load.
Limitations of current fuel cell and electrolyzer designs, as they pertain to both power
delivery and energy storage, were identified. The study also established the need to
understand and address dynamic performance in the design and application of solar-
hydrogen reversible fuel cell hybrid systems. An economic analysis found that major
cost reductions would need to be achieved for such systems to compete with conventional
energy storage devices.
Copyright ª 2011, Hydrogen Energy Publications, LLC. Published by Elsevier Ltd. All rights
reserved.
1. Introduction is both analogous to rechargeable batteries and that may have
Solar photovoltaic (PV) arrays are increasingly being deployed
to meet residential electricity needs. One of the major chal-
lenges for PV systems remainsmatching the sun’s diurnal and
intermittent power supply with the dynamic and non-
coincident power demand of a residence. Operating the PV
array in parallel with the electrical grid is one solution to this
problem. However, if the PV array is operated independently
from the grid, i.e., as a stand-alone power system, some type
of energy storage device must be employed. This device must
store excess PV energy and subsequently deliver power at the
desired time and rate. The energy storage device most
commonly used with PV systems today is the rechargeable
lead acid battery.
With the emergence of reversible or regenerative fuel cells
(RFC), one can consider using a new energy storage device that
9x221.er).
2011, Hydrogen Energy P
unique advantages in comparison to them in photovoltaic
applications. For example, such systems could produce
hydrogen for use as a vehicle fuel or for heating or cooking in
addition to energy storage. It is also possible to implement
a system design that uses both an RFC and a battery together
in a “hybrid” energy storage scenario that combines the
strengths of each technology.
Electrolysis is the chargemode of the RFC, where electricity
and water are taken in to produce hydrogen and oxygen. The
discharge mode uses the fuel cell to take in hydrogen and
oxygen (or air) and produce electricity and water. Regenera-
tive fuel cells have a wide range of potential applications
including energy storage devices coupled to renewable energy
sources, auxiliary power plants for automobiles and aircraft,
and propulsion systems for satellites and other space
applications.
ublications, LLC. Published by Elsevier Ltd. All rights reserved.

i n t e r n a t i o n a l j o u r n a l o f h y d r o g e n en e r g y 3 6 ( 2 0 1 1 ) 1 2 1 3 0e1 2 1 4 0 12131
The authors are not aware of prior research that has
addressed critical questions that pertain to the use of RFC
systems in solar-hydrogen residential applications. These
questions are, one, can the electrolyzer be relied upon to
consistently produce hydrogen in the presence of dynamic
solar input and, two, can the fuel cell be relied upon to deliver
power at the dynamic rates typical of residential demand and
what are the limitations. This study addresses the technical
feasibility of operating a residential solar-hydrogen reversible
fuel cell under the conditions of a dynamic source (sun) and
sink (load) and establishes the importance of understanding
the dynamic requirements of the application and addressing
the dynamic performance in design. A cost analysis is also
performed to assess the commercial feasibility of such
a system.
2. Background and related work
The main groups that are advancing regenerative proton
exchange membrane fuel cell systems are at NASA [1], Law-
rence Livermore National Laboratory [2], Proton Energy
Systems [3], the U.S. Department of Energy [4], and Giner
Electrochemical Systems [5]. Other groups that are more
focused on bi-functional electrode or MEA development
include researchers at AIST in Japan and the Dalian Institute
of Chemical Physics in China [6e8]. Few of these research
groups have published analyses pertaining to hybrid energy
storage systems that contain regenerative fuel cells and
batteries as applied to residential solar photovoltaic energy
systems as in this effort. However, some recent analyses have
addressed related topics.
Kelouwani et al. [9] created a dynamic model consisting of
a battery, buck and boost DC converters, electrolyzer, fuel cell
and hydrogen storage. Experimentally measured current from
a wind generator rectifier and a PV DC regulator were studied
as inputs to this energy storage systemmodel. The load on the
energy storage system was said to be representative of resi-
dential consumption, but the applied residential load and
temporal resolution are not described in the paper. The
authors claim that the modeled system shows results
comparable to the performance of an experimental system
with an average deviation of 5%.
Maclay et al. [10] have developed a dynamic empirical
model that uses performance curves for an RFC and a battery,
measured output from a PV array and measured power
demand for an individual residence to determine the
optimum sizing of the battery and RFC system for a residence.
This study considered the efficiency, load sharing, energy
storage capacity and component duty cycle in the dynamic
analyses used to determine component sizes. This work was
extended [11] to assess control strategies, sizing, capital costs,
and efficiencies of RFCs, batteries, and ultra-capacitors both
individually, and in combination, as hybrid energy storage
devices. The choice of control strategy for a hybrid energy
storage system was found to have a significant impact on
system efficiency, hydrogen production and component
utilization. Uzunoglu et al. [12], Li et al. [13] and Lagorse et al.
[14] describe results for similar models with focuses on sizing
optimization and control.
Bilodeau and Agbossou [15] build on thework of Kelouwani
et al. [9] by using a dynamic fuzzy logic controller to determine
suitable hydrogen production and consumption rates based
upon system power input and output and the battery state of
charge. These rates are then implemented to control the
operation of the fuel cell and electrolyzer in the model.
Busquet et al. [16] describe an empiricalmodel of a PEMRFC
that can calculate cell voltage vs. current density (VI) curves by
entering measured values of stack temperature and oxygen
partial pressure.
El-Sharkh et al. [17] have developed a dynamic electro-
chemicalmodel of a PEM fuel cell andmethanol reformer. The
main focus of the study was to characterize the transient
response and load following capability of the fuel cell under an
actual residential load. The results indicate that the fuel cell is
able to rapidly respond to residential load changes.
Tanrioven and Alam [18] describe the impact of load
management control on the reliability of residential stand-
alone fuel cell systems. Reliability evaluation is performed
with a component-based state spacemodel that uses fuzzy set
theory and expert knowledge. The smart energymanagement
control is said to increase fuel cell reliability from 95% to
99.93% over a ten year operational period.
Gigliucci et al. [19] report results from both the demon-
stration of a residential fuel cell CHP unit and a mathematical
model of the system that predicts technical and economic
evaluations of system suitability to specific residential
customers.
Santarelli and Macagno [20] developed a thermoeconomic
model of a residential solar-hydrogen reversible fuel cell
system. They find that the system has a very high cost but
suggest that itmay be a viable solution for remote stand-alone
applications without electrical distribution infrastructure.
The analysis uses average hourly load and solar irradiance
data, which will not capture the actual power demand rates
that the fuel cell will have to meet or the true solar dynamics
that the electrolyzer will be subject to.
Yilanci et al. [21] provide energy and exergy analyses for
a model based on a 1.2 kWe Nexa PEM fuel cell unit in a solar-
based hydrogen production system. A parametric study on the
system and its parameters was undertaken to investigate the
changes in the efficiencies for variations in temperature,
pressure and anode stoichiometry. Energy and exergy effi-
ciencies were found to increase with pressure, not change
with increasing temperature and decrease with increasing
anode stoichiometry. The results show that the PEM fuel-cell
system has lower exergy efficiencies than the corresponding
energy efficiencies due to irreversibilities not considered by
energy analysis.
Guizzi et al. [22] describe experimental results for a hybrid
energy system for electric wheelchair and industrial auto-
mated guided vehicle applications. The main components are
a PEM fuel cell, a battery pack and an ultra-capacitor pack as
power sources, and metal hydride canisters as energy storage
devices. Overall system efficiency is reported to be always
higher than 36%. The fuel cell meets low to medium loads,
which allows near maximum efficiency operation.
Douceta et al. [23] report the general performance for an
auxiliary power unit consisting of a PEM water electrolyzer,
a hydride storage tank and a fuel cell. The hydrogen can be
i n t e rn a t i o n a l j o u r n a l o f h y d r o g e n en e r g y 3 6 ( 2 0 1 1 ) 1 2 1 3 0e1 2 1 4 012132
used for co-generation of heat and electricity in residential,
remote site or mobile hydrogen refueling applications. There
is no mention of how the system may respond to actual
residential loads.
Eroglu et al. [24] describe results for an experimental
system that uses solar and wind energy and a reversible fuel
cell and battery for energy storage. However, there is no
mention of the impact of dynamic solar irradiance or load
demand on system performance.
3. Approach
The current study analyzes an experimental hybrid energy
storage system consisting of an electrolyzer, fuel cell and
battery coupled to a solar photovoltaic system, intended for
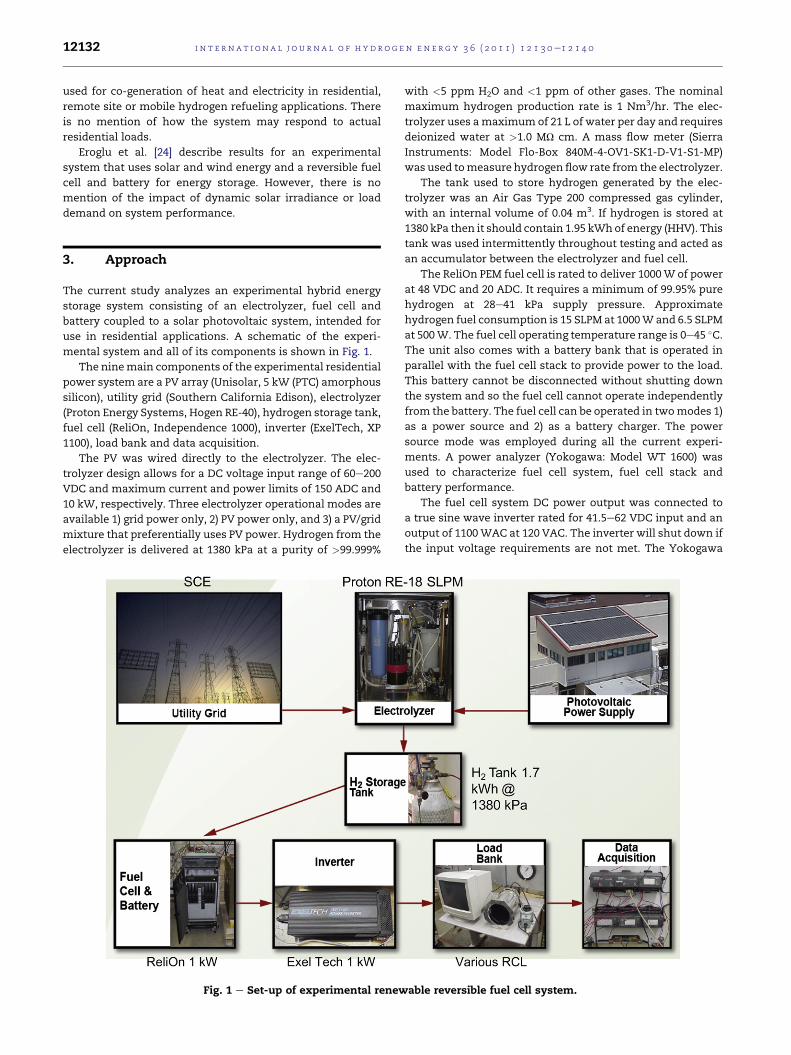
use in residential applications. A schematic of the experi-
mental system and all of its components is shown in Fig. 1.
The ninemain components of the experimental residential
power system are a PV array (Unisolar, 5 kW (PTC) amorphous
silicon), utility grid (Southern California Edison), electrolyzer
(Proton Energy Systems, Hogen RE-40), hydrogen storage tank,
fuel cell (ReliOn, Independence 1000), inverter (ExelTech, XP
1100), load bank and data acquisition.
The PV was wired directly to the electrolyzer. The elec-
trolyzer design allows for a DC voltage input range of 60e200
VDC and maximum current and power limits of 150 ADC and
10 kW, respectively. Three electrolyzer operational modes are
available 1) grid power only, 2) PV power only, and 3) a PV/grid
mixture that preferentially uses PV power. Hydrogen from the
electrolyzer is delivered at 1380 kPa at a purity of >99.999%
Fig. 1 e Set-up of experimental renew
with <5 ppm H2O and <1 ppm of other gases. The nominal
maximum hydrogen production rate is 1 Nm3/hr. The elec-
trolyzer uses amaximum of 21 L of water per day and requires
deionized water at >1.0 MU cm. A mass flow meter (Sierra
Instruments: Model Flo-Box 840M-4-OV1-SK1-D-V1-S1-MP)
was used tomeasure hydrogen flow rate from the electrolyzer.
The tank used to store hydrogen generated by the elec-
trolyzer was an Air Gas Type 200 compressed gas cylinder,
with an internal volume of 0.04 m3. If hydrogen is stored at
1380 kPa then it should contain 1.95 kWhof energy (HHV). This
tank was used intermittently throughout testing and acted as
an accumulator between the electrolyzer and fuel cell.
The ReliOn PEM fuel cell is rated to deliver 1000W of power
at 48 VDC and 20 ADC. It requires a minimum of 99.95% pure
hydrogen at 28e41 kPa supply pressure. Approximate
hydrogen fuel consumption is 15 SLPM at 1000W and 6.5 SLPM
at 500W. The fuel cell operating temperature range is 0e45 �C.The unit also comes with a battery bank that is operated in
parallel with the fuel cell stack to provide power to the load.
This battery cannot be disconnected without shutting down
the system and so the fuel cell cannot operate independently
from the battery. The fuel cell can be operated in twomodes 1)
as a power source and 2) as a battery charger. The power
source mode was employed during all the current experi-
ments. A power analyzer (Yokogawa: Model WT 1600) was
used to characterize fuel cell system, fuel cell stack and
battery performance.
The fuel cell system DC power output was connected to
a true sine wave inverter rated for 41.5e62 VDC input and an
output of 1100WAC at 120 VAC. The inverter will shut down if
the input voltage requirements are not met. The Yokogawa
able reversible fuel cell system.
0
1
2
3
4
5
6
7
8
9
Time (One Week)
Pow
er (k
W)
PV Power Residential Load Demand
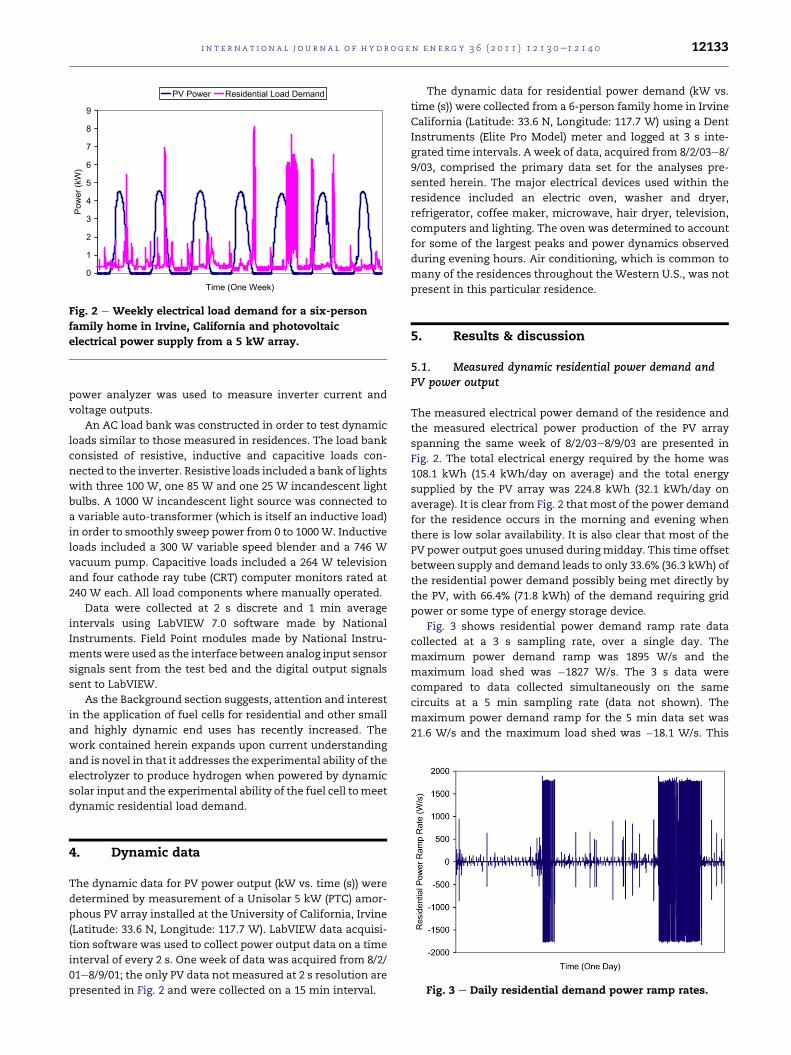
Fig. 2 e Weekly electrical load demand for a six-person
family home in Irvine, California and photovoltaic
electrical power supply from a 5 kW array.
i n t e r n a t i o n a l j o u r n a l o f h y d r o g e n en e r g y 3 6 ( 2 0 1 1 ) 1 2 1 3 0e1 2 1 4 0 12133
power analyzer was used to measure inverter current and
voltage outputs.
An AC load bank was constructed in order to test dynamic
loads similar to those measured in residences. The load bank
consisted of resistive, inductive and capacitive loads con-
nected to the inverter. Resistive loads included a bank of lights
with three 100 W, one 85 W and one 25 W incandescent light
bulbs. A 1000 W incandescent light source was connected to
a variable auto-transformer (which is itself an inductive load)
in order to smoothly sweep power from 0 to 1000W. Inductive
loads included a 300 W variable speed blender and a 746 W
vacuum pump. Capacitive loads included a 264 W television
and four cathode ray tube (CRT) computer monitors rated at
240 W each. All load components where manually operated.
Data were collected at 2 s discrete and 1 min average
intervals using LabVIEW 7.0 software made by National
Instruments. Field Point modules made by National Instru-
mentswere used as the interface between analog input sensor
signals sent from the test bed and the digital output signals
sent to LabVIEW.
As the Background section suggests, attention and interest
in the application of fuel cells for residential and other small
and highly dynamic end uses has recently increased. The
work contained herein expands upon current understanding
and is novel in that it addresses the experimental ability of the
electrolyzer to produce hydrogen when powered by dynamic
solar input and the experimental ability of the fuel cell tomeet
dynamic residential load demand.
Fig. 3 e Daily residential demand power ramp rates.
4. Dynamic data
The dynamic data for PV power output (kW vs. time (s)) were
determined by measurement of a Unisolar 5 kW (PTC) amor-
phous PV array installed at the University of California, Irvine
(Latitude: 33.6 N, Longitude: 117.7 W). LabVIEW data acquisi-
tion software was used to collect power output data on a time
interval of every 2 s. One week of data was acquired from 8/2/
01e8/9/01; the only PV data not measured at 2 s resolution are
presented in Fig. 2 and were collected on a 15 min interval.
The dynamic data for residential power demand (kW vs.
time (s)) were collected from a 6-person family home in Irvine
California (Latitude: 33.6 N, Longitude: 117.7 W) using a Dent
Instruments (Elite Pro Model) meter and logged at 3 s inte-
grated time intervals. A week of data, acquired from 8/2/03e8/
9/03, comprised the primary data set for the analyses pre-
sented herein. The major electrical devices used within the
residence included an electric oven, washer and dryer,
refrigerator, coffee maker, microwave, hair dryer, television,
computers and lighting. The oven was determined to account
for some of the largest peaks and power dynamics observed
during evening hours. Air conditioning, which is common to
many of the residences throughout the Western U.S., was not
present in this particular residence.
5. Results & discussion
5.1. Measured dynamic residential power demand andPV power output
The measured electrical power demand of the residence and
the measured electrical power production of the PV array
spanning the same week of 8/2/03e8/9/03 are presented in
Fig. 2. The total electrical energy required by the home was
108.1 kWh (15.4 kWh/day on average) and the total energy
supplied by the PV array was 224.8 kWh (32.1 kWh/day on
average). It is clear from Fig. 2 that most of the power demand
for the residence occurs in the morning and evening when
there is low solar availability. It is also clear that most of the
PV power output goes unused during midday. This time offset
between supply and demand leads to only 33.6% (36.3 kWh) of
the residential power demand possibly being met directly by
the PV, with 66.4% (71.8 kWh) of the demand requiring grid
power or some type of energy storage device.
Fig. 3 shows residential power demand ramp rate data
collected at a 3 s sampling rate, over a single day. The
maximum power demand ramp was 1895 W/s and the
maximum load shed was �1827 W/s. The 3 s data were
compared to data collected simultaneously on the same
circuits at a 5 min sampling rate (data not shown). The
maximum power demand ramp for the 5 min data set was
21.6 W/s and the maximum load shed was �18.1 W/s. This

Fig. 5 e Independence 1000 fuel cell system DC power and
inverter AC power outputs during dynamic load testing.
i n t e rn a t i o n a l j o u r n a l o f h y d r o g e n en e r g y 3 6 ( 2 0 1 1 ) 1 2 1 3 0e1 2 1 4 012134
dramatic difference between ramp rates underscores the need
for high resolution data sets for accurate characterization of
real load demands that will be experienced by stand alone
power systems.
For the experimental solar-hydrogen residential system
results, (Fig. 4e10), the data sampling rate (either 2 s discrete
or 1 min averaged) and electrolyzer mode (either PV-only or
grid-onlymode) are indicated. Fig. 4 shows PV DC power input
to the electrolyzer, the equivalent power output of the
hydrogen evolved from the electrolyzer and the cumulative
raw hydrogen energy produced over the span of a day. PV
energy consumption by the electrolyzer was 33.4 kWh/day,
grid energy consumption was 4.8 kWh/day and hydrogen
energy production was 17.8 kWh/day. Grid AC power
consumption, which is required by the electrolyzer to run
ancillary components such as an air blower and water pump
even in PV-only mode, was 430 W on average. Cumulative
hydrogen energy production of 17.8 kWh/day is greater than
the 15.4 kWh/day average residential load demand. However,
if this hydrogen was to be used in a fuel cell to power the
residence it would be insufficient to meet the total energy
requirements due to losses in the fuel cell.
The electrolyzer was able to successfully operate with
518W of PV power upon start up at 7:07 AM as shown in Fig. 4.
Prior to this, the electrolyzer failed to start due to low cell
voltage and low system pressure errors. The internal pressure
must build to 1380 kPa before the electrolyzer can deliver
hydrogen and PV power below 518 W was insufficient to
achieve this internal pressure requirement. The electrolyzer
shut down at 6:26 PM with a PV power input of 212 W due to
a low system pressure error. The electrolyzer stack operated
continuously throughout the day for 11 h and 19 min in the
PV-only mode since solar irradiance was fairly uninterrupted
by clouds. In general, the electrolyzer tolerated short tran-
sients in solar irradiance, such as intermittent cloud cover.
Extended transients in solar irradiance, such as cloudy days
with rain, led to electrolyzer shut downs due to system pres-
sure loss. Thus, the electrolyzer was found to be able to
consistently produce hydrogen in the presence of dynamic
solar irradiance as long as systempressure can bemaintained.
0
1000
2000
3000
4000
6:57 AM 9:21 AM 11:45 AM 2:09 PM 4:33 PM 6:57 PM
PV P
ower
& E
lect
roly
zer H
ydro
gen
HH
V En
ergy
Flo
w (W
)
0
2
4
6
8
10
12
14
16
18
Cum
ulat
ive
Hyd
roge
n En
ergy
(kW
h)
PV Power Hydrogen Power HHV Cumulative Hydrogen Energy
PV Only Mode Δt = 1 minute
Fig. 4 e Daily PV power output, electrolyzer hydrogen
energy flow and cumulative daily hydrogen energy
produced.
Now that hydrogen has been produced by the electrolyzer
and stored in a gas cylinder, it can be used in the fuel cell to
meet a simulated residential load dynamics. A key interest of
this research is to determine the ability of a fuel cell to meet
the fast power rates of change observed in residential demand
profiles (Fig. 3). Although the experimental fuel cell and
inverter are only sized to amaximum continuous rated power
output of 1 kW (versus the peak demand of over 8 kW seen in
the residence in Fig. 2), it will be useful to see if the power
ramp rates measured in Fig. 3 can be approached by the
system. Another interest is to determine whether the experi-
mental system has the ability to supply reactive loads with
low power factors where inductive and capacitive power
demands are significant.
Fig. 5 shows fuel cell system DC power output, which is
a measure of the total combined output of the fuel cell stack
and internal battery to the load. Inverter AC power output is
also shown in Fig. 5, which is in response to the actual power
demand of the AC load bank. For this set of experiments (Figs.
5 and 6), the fuel cell power output was only being measured
at the system level and so it was not possible to determine
-900
-700
-500
-300
-100
100
300
500
700
900
10:40 AM 10:52 AM 11:03 AM 11:15 AM 11:26 AM 11:38 AM
PV Only Mode Δt = 2 second
Fuel
Cel
l Sys
tem
DC
Pow
er R
amp
Rat
e (W
/s)
Fig. 6 e Independence 1000 fuel cell system DC power
ramp rates during dynamic load testing.

0
100
200
300
400
500
600
8:52 AM 10:48 AM 12:43 PM 2:38 PM 4:33 PM
Fuel
Cel
l Sys
tem
AC
Pow
er (W
)
0
10
20
30
40
50
60
Fuel
Cel
l Sys
tem
DC
Vol
tage
(V)
Inverter AC Power Fuel Cell System Volts
PV Only Mode Δt = 1 minute
#1 #2
Fig. 9 e Independence 1000 fuel cell system voltage and AC
power demand.Fig. 7 e Independence 1000 fuel cell system, stack and
battery power.
i n t e r n a t i o n a l j o u r n a l o f h y d r o g e n en e r g y 3 6 ( 2 0 1 1 ) 1 2 1 3 0e1 2 1 4 0 12135
what portion of the load was being met by the fuel cell stack
and what portion was being met by the battery.
The simulated experimental residential loads applied in
Fig. 5 will be described in progression, moving from left to
right in the figure. The first load applied was resistive, where
approximately 1400 W of incandescent lights were switched
on and off simultaneously. This event corresponded to the
fastest observable ramp rates of 842 W/s and �817 W/s. The
fuel cell system was able to meet this dynamic load demand
without a problem.
Power was then slowly increased using a variable trans-
former to power increasing amounts of incandescent light to
create a VI curve. It was observed that as power demand from
the fuel cell system increases the amount of DC power needed
to produce a given amount of AC power increases. This is
a function of inverter efficiency which decreases above an
output power of 1000 W.
Next, between 5 and 30 A of DC current was switched on
and off five times for each of the 5 A increments (i.e., 5, 10, 15,
20, 25 and 30 A) using a resistive AC load bank. The fuel cell
system was able to meet this set of load demands without
exception.
-250
-200
-150
-100
-50
0
50
100
10:12 AM 10:26 AM 10:40 AM 10:55 AM 11:09 AM 11:24 AM 11:38 AM
Fuel
Cel
l Sta
ck P
ower
Ram
p R
ate
(W/s
)
PV Only Mode Δt = 2 second
Fig. 8 e Independence 1000 fuel cell stack power ramp
rates.
Next, two inductive loads were applied to the fuel cell
system at separate times. The first load is a variable speed
blender that draws approximately 250 W of power. Power to
the blender was cycled five times without a problem. One of
the blender motor starts produced a momentary power spike
of 830 W. The second inductive load test utilized a vacuum
pump rated at 746 W. Eight attempts were made to start the
vacuum pump without success. During these attempts
inverter voltage dropped from its rated output of 120 Ve40 V
causing the inverter to shutdown. Fuel cell system voltage
drops to 50 V during thismotor start event, which is within the
inverter operational input range of 41.5e62 VDC. The fuel cell
system itself did not shut down during these motor start
events because it is a DC source and does not have to produce
reactive power, whereas the inverter, an AC source, does. The
vacuum pump was plugged into a 120 VAC wall socket and
probed using a clamp-on ammeter during multiple successful
start up events. The resulting inrush current ranged from 28 to
39 A, which translates to 3360e4680 W. The inverter proved
unable to function under the strain of the inrush current
associated with the vacuum pump motor start. This was the
only instance of a system shutdown during the dynamic load
0
500
1000
1500
2000
2500
3000
3500
4000
10:40 AM 12:07 PM 1:33 PM 3:00 PM 4:26 PM0
1000
2000
3000
4000
5000
6000
7000
Cum
ulat
ive
Hyd
roge
n En
ergy
(Wh)
Hydrogen Power HHV Cumulative Hydrogen Energy
PV Only Mode Δt = 1 minute
Grid Only Mode Δt = 1 minute
Elec
troly
zer H
ydro
gen
HH
V En
ergy
Flo
w (W
)
Fig. 10 e Electrolyzer hydrogen energy flow and cumulative
hydrogen energy.

i n t e rn a t i o n a l j o u r n a l o f h y d r o g e n en e r g y 3 6 ( 2 0 1 1 ) 1 2 1 3 0e1 2 1 4 012136
testing. The lowest power factor measured during the induc-
tive load tests was 0.79.
Next, dynamic capacitive load testing was carried out.
First, a television was turned on together with some incan-
descent lights and then the television was cycled six times by
itself. Second, the television along with 4 cathode ray tube
(CRT) computer monitors were cycled on and off six times.
The fuel cell system was able to power these dynamic events
without a problem. A peak in demand of 100 W above the
steady state demand is observed in association with the start
up of the five CRTs. The television by itself is capable of
drawing the power factor down to 0.18 upon start up and has
a resting capacitance that leads to a power factor of 0.3 even
when not powered. When plugged in but not in use, the
television still draws 10 W of power due to slow charging of
the capacitive CRT. The CRT monitors have less capacitive
reactance than the television and during combined operation
a power factor of 0.65 was observed.
Finally, mixed loads were cycled. First, the blender was left
on and the five CRTs were cycled, leading to an improved
power factor of 0.77 vs. 0.65 for the case of CRT use only (more
capacitive loads). Next, the blender was cycled with the five
CRTs. Finally, 485 W of incandescent lights were left on and
the blender and five CRTs were cycled together leading to
a power factor of 0.93. Again, the fuel cell system was able to
power these dynamic loads without a problem.
Fig. 6 shows the power ramp rates experienced by the fuel
cell system when subjected to the load tests of Fig. 5. The
maximum power ramp rate measured was 842 W/s and the
maximum load shed measured was �817 W/s. These values
are less than half those measured for the residence in Fig. 3,
but the system is able to output close to its maximum power
rating of 1000 W within 1 s. A larger power class fuel cell
system would likely be able to meet the power rates observed
in the residence. Throughout the dynamic load testing there
was only one instance of a system shutdown and this was
caused by an inverter failure. The system was able to follow
the load dynamics in all other instances.
The results presented thus far characterize fuel cell system
power, which is a combination of fuel cell stack and battery
power. Fig. 7 presents results from investigating the dynamic
response of the fuel cell system, fuel cell stack and battery
power as successive loads were applied to the fuel cell system
in stepwise fashion. In the region before 10:40 AM, when no
external power is consumed, the fuel cell stack is float
charging the battery. When an external AC load of 250 W is
added to the fuel cell, the fuel cell alternates between pow-
ering the load and charging the battery while the battery
correspondingly alternates between charging and discharg-
ing. Once the external load reaches 500 W, the fuel cell and
battery both contribute continuous power to the load (no
charging of the battery occurs). As the load is stepped up to
750 W and then 1000 W, the fuel cell remains at a continuous
output of approximately 450 W while the battery steps up its
power output to meet the increased load demand. When the
external load is removed, the fuel cell stack begins charging
the battery first by bulk charging and eventually by float
charging.
Fig. 8 shows fuel cell stack power rates of change for the
case shown in Fig. 7. Power ramp rates up to 67 W/s and load
sheds up to�209W/sweremeasured. These are insufficient to
meet the ramp rates seen for the residence (Fig. 3). The fastest
power rates of change occur during battery charging.
The design of this fuel cell system uses the fuel cell as
a base-load power device and the battery as a peak-load power
device. This is a wise design strategy since the fuel cell has
greater physical limitations (such as control and delivery of
fuel and oxidant) compared to the battery. However, these
results do not help determine whether fuel cells, when not
hybridized with batteries and designed to operate in this
fashion, canmeet the fast power demand ramp rates observed
in residences.
The next line of inquiry was to characterize the energy
storage capacity of the fuel cell system, without a hydrogen
tank to store energy. This was done by subjecting the system
to a constant 400W AC load consisting of incandescent lights,
on a relatively sunny day with the system operating in PV-
only mode.
Fuel cell system AC power and DC voltage over the span of
the experiment are shown in Fig. 9. The voltage initially rises
as the internal battery is charged, then the load is applied and
the voltage drops significantly; finally voltage falls precipi-
tously in the case of system shutdowns (circle #1 in Fig. 9).
This voltage profile is repeated roughly three times during the
test (Fig. 9). Six out of the seven failures observed during this
testing were due to the fuel cell system reaching the low
voltage input limit of the inverter. This voltage decay occurs
because the fuel cell cannot meet the 400 W load demand by
itself and so it relies on the internal battery for assistance. The
battery is unable to maintain a steady voltage for long periods
due to its low energy storage capacity. The inverter has a cut
out voltage limit of 41.5 V for a nominal 48 V system for
a reason. 12 V batteries are deemed to be fully discharged
when they reach 10.5 V under discharge. For a 48 V nominal
system this is 42 V, so the inverter protects the battery from
damage that would otherwise occur in the case that it is dis-
charged below this voltage.
The one failure not caused by low fuel cell system voltage
was due to low electrolyzer system pressure, which occurs at
4:57 PM. This loss in system pressure is the result of insuf-
ficient solar irradiance. The product pressure drops below
the minimum 35 kPa required by the fuel cell to operate at
3:53 PM. As a result, the fuel cell voltage drop oscillates
unlike the smooth continuous drop observed when sufficient
hydrogen is present (circle #2 in Fig. 9). This voltage oscilla-
tion also occurs when the fuel cell is charging the battery in
the presence of insufficient hydrogen (at approximately
4:30 PM).
Fig. 10 reveals the difference in hydrogen energy flow from
the electrolyzer in grid-only mode during midday and in PV-
only mode late in the day. The cumulative energy stored in
the hydrogen tank from the two tank fills during midday (area
under each hydrogen power curve shown for the grid-only
mode case) were measured at 1742 Wh for the first fill and
1739 Wh for the second fill. This is 11% less than the 1950 Wh
calculated as the maximum hydrogen storage possible for the
tank. Assuming an average residential load of 15.4 kWh and
a fuel cell of 40% efficiency, one can determine that 22.3 of
these storage tanks would be needed for the fuel cell to meet
the day’s energy needs (without the battery) if hydrogen were

-2000
-1000
0
1000
2000
1:55 PM 2:09 PM 2:24 PM 2:38 PM 2:52 PM 3:07 PM 3:21 PM
Fuel
Cel
l Sta
ck P
ower
Ram
p R
ate
(W/s
)
Fig. 13 e GenCore fuel cell stack power ramp rates.
-1000
0
1000
2000
3000
4000
5000
6000
3:06:55 PM 3:07:21 PM 3:07:47 PM 3:08:12 PM 3:08:38 PM
Pow
er (W
)
0
200
400
600
800
1000
1200
Battery Fuel Cell Stack Fuel Cell System Fuel Cell Stack Power Rate
Fuel
Cel
l Sta
ck P
ower
Ram
p R
ate
(W/s
)
Fig. 11 e GenCore fuel cell system, stack and battery power
and fuel cell stack power ramp rates during power loading.
i n t e r n a t i o n a l j o u r n a l o f h y d r o g e n en e r g y 3 6 ( 2 0 1 1 ) 1 2 1 3 0e1 2 1 4 0 12137
stored at 1380 kPa (at 1.74 kWh per tank). Higher pressure
hydrogen storage would most likely be preferable.
In an effort to understand more generally the ability of
a PEM fuel cell stack to meet dynamic load ramp rates, data
from a Plug Power, 5 kW GenCore system tested at the NFCRC,
was analyzed. This fuel cell is marketed for telecommunica-
tion back-up power applications, but could be adapted for
residential power or other uses. The GenCore is designed for
operation on 99.95% pure hydrogen, provides a 48 VDC output
and the fuel cell stack operates in parallel with a 48 VDC
battery bank.
Fig. 11 shows the GenCore fuel cell system, stack and
battery power and fuel cell stack power ramp rates during
power loading. The external load, which is a variable resistive
load bank, was incrementally increased to the fuel cell
system. The power ramp rates for the stack are shown as
increasing with these step changes in power. Power ramp
rates up to 1231 W/s can be observed for the fuel cell stack
alone in Fig. 11.
Fig. 12 shows power ramp rates for the GenCore fuel cell
system (with both fuel cell and battery power production). The
maximum demand power ramp rate was 1720 W/s, which is
34% of the rated 5 kW GenCore output per second. The
maximum load shed power ramp rate was �4352 W/s, which
is 87% of the rated 5 kW GenCore output per second. These
-5000
-4000
-3000
-2000
-1000
0
1000
2000
1:55 PM 2:09 PM 2:24 PM 2:38 PM 2:52 PM 3:07 PM 3:21 PM
Fuel
Cel
l Sys
tem
Pow
er R
amp
Rat
e (W
/s)
Fig. 12 e GenCore fuel cell system power ramp rates.
values represent the response time of the fuel cell system
indicating that the hybrid systemwith the battery allows both
faster increasing and decreasing (shed) power ramp rates than
the fuel cell stack by itself. These ramp rates come close to or
exceed the maximum power ramp rates observed for the
residence during 3 s resolution demand monitoring. The
maximum fuel cell systempower ramp rate of 1720W/s is 91%
of the 1895 W/s observed in the residence and the maximum
fuel cell load shed ramp rate of �4352 W/s is 238% of the
�1827 W/s observed in the residence.
Fig. 13 shows power ramp rates for the GenCore fuel cell
stack. Themaximum demand power ramp rate was 1231W/s,
which is 25% of the rated 5 kW GenCore output per second.
The maximum load shed power ramp rate was �1412 W/s,
which is 28% of the rated 5 kW GenCore output per second.
The maximum fuel cell power ramp rate of 1231W/s is 65% of
the 1895W/s observed in the home and themaximum fuel cell
load shed ramp rate of �1412 W/s is 77% of the �1827 W/s
observed in the home. These data indicate that unlike the
Independence 1000 design, the GenCore hybrid fuel cell with
battery design allows the fuel cell stack to load follow and the
battery to absorb fuel cell power overshoots (observed in
Fig. 11).
-4000
-3000
-2000
-1000
0
1000
2000
3000
4000
5000
3:18:00 PM 3:18:17 PM 3:18:35 PM 3:18:52 PM 3:19:09 PM 3:19:26 PM
Pow
er (W
)
Battery Fuel Cell Stack Fuel Cell System
Fig. 14 e GenCore fuel cell system, stack and battery power
during dynamic load following.

Table 1e Solar hydrogen economic analysis assumptionsand conversions.
Units
Hydrogen HHV 39.7 kWh/kg
Hydrogen Mass/Volume Conversion 11.11 Nm3/kg
Electrolyzer Capital Cost 75,000 $/Unit
Electrolyzer Capital Cost 7500 $/kW Input
Electrolyzer Maximum Hydrogen
Production Rate
1.16 Nm3/hr
Electrolyzer Efficiency 41.5 %
Capital Cost per Battery 191 $
Battery Voltage 6 V
Fig. 15 e GenCore fuel cell stack and battery power and fuel
cell coolant temperature (macro view).
i n t e rn a t i o n a l j o u r n a l o f h y d r o g e n en e r g y 3 6 ( 2 0 1 1 ) 1 2 1 3 0e1 2 1 4 012138
Fig. 14 shows the case when load on the fuel cell system is
dropped from approximately 4.5 kWe0 kW. The battery can be
seen acting as a sink for fuel cell stack power in this event. The
fuel cell stack remains in a standby powermode (charging the
battery when there is zero load) and then reverts to meeting
load demand, once it returns to a nonzero value, approxi-
mately 15 s later.
Fig. 15 shows fuel cell stack and battery power and fuel cell
coolant temperature for the GenCore. In this test, load
demand up to at least 4000 W was added on three separate
occasions with fuel cell stack coolant temperature generally
increasing with progressive additions of load.
Fig. 16 provides a close-up view of the data presented in
Fig. 15, where battery power can be resolved. It is evident that
as the fuel cell stack temperature increases, less assistance
from the battery is required to meet the load. This indicates
that fuel cell stack power ramp rates may be kinetically
limited since the increased temperature led to increased
dynamic response capability. This is likely due to the fact that
increasing operating temperature increases the catalytic
activity of the electrodes. Thus, higher power ramp rates
should be possible with higher temperature PEM fuel cells.
Fig. 16 e GenCore fuel cell stack and battery power and fuel
cell coolant temperature (magnified view).
The GenCore uses a heater powered by the battery to heat the
fuel cell stack in cases when stack temperature is too low.
5.2. Solar hydrogen economics
The majority of this study has focused on the technical
feasibility of solar hydrogen and reversible fuel cells for resi-
dential applications. This section addresses another signifi-
cant challenge for the use of these systems today, which is
their economic value proposition. Table 1 summarizes all the
assumptions and conversions factors that went into the
economic analysis.
All analyses assume the HHV of hydrogen. Component
capital costs, lifetimes, efficiencies and hydrogen production
rates refer to the systems used in this study. The commercial
cost of the reversible fuel cell used during experimentation is
$10,500/kW, which agrees well with the value of $10,000/kW
used in the model.
Table 2 shows the results of the economic analysis, which
is based upon the measured performance and cost of current
components (not state-of-the-art). Note that accounting for
a dynamic load profile, as opposed to a steady state analysis at
a design point, reduces the economic performance of the
system.
The cost of electricity from PV (generation not retail) is
124% of the California average retail electricity price. The cost
of raw solar-hydrogen energy using PV-electrolysis is 106% of
grid-electrolysis generated hydrogen. Electricity derived from
Battery Amp-Hour Rating (C/20) 350 Ahr
Battery Discharge Time 20 hr
Battery Depth of Discharge 50 %
Battery Cycle Lifetime
(for 50% Depth of Discharge)
1000 Cycles
Battery Cycle per Day 1 Cycle/day
Battery Percent of Time Discharging 40 % Time
Battery Percent of Time Charging 60 % Time
Battery Efficiency During Charge 90 %
Average Battery Efficiency During
Charge/Discharge
94 %
Battery Capital Cost (C/20 Rate) 100%
Raw Energy Rating
91 $/kWh
Fuel Cell Capital Cost 3000 $/Unit
Fuel Cell Capital Cost 3000 $/kW Output
Fuel Cell Efficiency 40 %
PV Lifetime (Continuous Operation) 30 Yr
Electrolyzer Lifetime (Continuous Operation) 6 Yr
Battery Lifetime (Continuous Operation) 2.75 Yr
Fuel Cell Lifetime (Continuous Operation) 2.28 Yr

Table 2 e Economic analysis of energy costs.
Energy Cost ($/kWh) HHV Energy Cost ($/kg*H2)
Assumed Average California Retail Electricity Price 0.125 NA
Assumed Photovoltaic Electrical Generation Cost 0.155 NA
Battery Electrical Generation Capital Cost 0.402 NA
Electrolyzer Hydrogen Generation Capital Cost (Raw Thermal Hydrogen Energy) 0.344 13.67
Electrolyzer Hydrogen Generation Capital Cost (Electrical w/40% Efficient Fuel Cell) 0.861 NA
PV þ Rechargeable Battery Electrical Generation Capital Cost 0.557 NA
PV þ Electrolyzer Hydrogen Capital Cost (Raw Thermal Hydrogen Energy) 0.499 19.82
PV þ Electrolyzer Hydrogen Capital Cost (Electrical w/40% Efficient Fuel Cell) 1.016 NA
Fuel Cell Electrical Generation Capital Cost 0.150 NA
PV þ RFC Electrical Generation Capital Cost 1.166 NA
California Grid þ Electrolyzer Hydrogen Generation Capital Cost 0.469 18.63
California Grid þ RFC Electrical Generation Capital Cost 0.986 NA
i n t e r n a t i o n a l j o u r n a l o f h y d r o g e n en e r g y 3 6 ( 2 0 1 1 ) 1 2 1 3 0e1 2 1 4 0 12139
a reversible fuel cell costs $1.166/kWh or 933% of the Cal-
ifornia average retail electricity price. Electricity derived from
a rechargeable battery costs $0.577/kWh or 462% of the Cal-
ifornia average retail electricity price.
Compared to PV-battery electricity at $0.577/kWh, PV-RFC
electricity is $1.166/kWh or 202% more costly. Electrolyzer
capital cost leads to the highest cost per unit energy along the
chain of energy costs. These economic analyses suggest that
both electrolyzer and fuel cell costs must come down
significantly and lifetimes must increase for reversible fuel
cells to become cost competitive with conventional energy
storage.
The key contribution of the current economic analysis is to
establish the baseline cost of current technologies that are
required to meet real dynamic residential loads.
6. Summary & conclusions
An experimental solar-hydrogen reversible fuel cell system
was tested to determine its viability for residential applica-
tions. Most importantly, the current work demonstrates the
technical feasibility of the system to operate reliably under
dynamic solar irradiance and dynamic loads. It also estab-
lishes the importance of considering the real dynamics of the
sources and sinks in the design and application of such
systems. An economic analysis of the system showed that it is
far from being cost competitive.
The electrolyzer (a Proton Energy Systems, Hogen RE-40)
was able to consistently produce hydrogen in the presence
of dynamic solar irradiance as long as system pressure was
maintained.
Two separate fuel cell systems (a 1 kW ReliOn, Indepen-
dence 1000 and a 5 kW Plug Power, GenCore) were found to
possess power ramp rate capabilities of 0.8 and 1.7 kW/s,
respectively, compared to the 1.9 kW/s power ramp rate
demandmeasured in the residence. Fuel cell system load shed
capabilities were �0.8 and �4.4 kW/s, for the Independence
1000 and GenCore systems, respectively, compared to the
�1.8 kW/s power ramp rate measured in the residence. The
fuel cell stacks tested were integrated in hybrid systems that
produced power in parallel with batteries. The hybrid system
integration of batteries with a fuel cell stack is an effective
strategy for meeting fast power ramps and load sheds. This
configuration also allows the fuel cell to maintain operating
temperature (and good electrochemical kinetics) by allowing
it to charge the battery when load is reduced. Load following
capability of the fuel cell stack alone was observed to increase
with fuel cell stack operating temperature.
For stand-alone solar energy storage, the capital cost of the
reversible fuel cell was found to be 202% more than a battery.
This suggests that both electrolyzer and fuel cell costs must
come down significantly for reversible fuel cells to become
cost competitive with conventional energy storage.
Acknowledgments
We gratefully acknowledge the support of the U.S. Depart-
ment of Defense Fuel Cell Program of the Engineer Research
and Development Center at the Construction Engineering
Research Laboratory, which sponsored this research. We
especially acknowledge the support and guidance of the
program manager Mr. Frank Holcomb.
r e f e r e n c e s
[1] Burke KA. First international energy conversion engineeringconference; 2003. August17e21.
[2] Mitlitsky F, Myers B, Weisberg AH. Energy & Fuels. 1998;12:56e71.
[3] Smith W. J Power Sources 2000;86:74e83.[4] Milliken CE, Ruhl RC. Proceeding of the 2002 U.S. DOE
Hydrogen Program Review, (2002).[5] Giner Electrochemical Systems. LLC delivers a lightweight,
15-kilowatt electrolyzer stack for the Helios prototype flyingwing, www.ginerinc.com/lightwei.htm; 2001.
[6] Chaurasia PBL, Ando Y, Tanaka T. Energy ConversionManage 2003;44:611e28.
[7] Zhigang S, Baolian Y, Ming H. J Power Sources 1999;79:82e5.[8] Ioroi T, Oku T, Yasuda K, Kumagai N, Miyazaki Y. J Power
Sources 2003;124:385e9.[9] Kelouwani S, Agbossou K, Chahine R. J Power Sources 2005;
140:392e9.[10] Maclay JD, Brouwer J, Samuelsen GS. Intl J Hydrogen Energy
2006;31:994e1009.[11] Maclay JD, Brouwer J, Samuelsen GS. J. Power Sources 2007;
163:916e25.

i n t e rn a t i o n a l j o u r n a l o f h y d r o g e n en e r g y 3 6 ( 2 0 1 1 ) 1 2 1 3 0e1 2 1 4 012140
[12] Uzunoglu M, Onar OC, Alam MS. Renewable Energy 2009;34:509e20.
[13] Li CH, Zhu XJ, Cao GY, Sui S, Hu MR. Renewable Energy 2009;34:815e26.
[14] Lagorse J, Paire D, Miraoui A. Renewable Energy 2009;34:683e91.
[15] Bilodeau A, Agbossou K. J Power Sources 2006;162:757e64.[16] Busquet S, Hubert CE, Labbe J, Mayer D, Metkemeijer R. J
Power Sources 2004;134:41e8.[17] El-Sharkh MY, Rahman A, Alam MS, Byrne PC, Sakla AA,
Thomas T. J Power Sources 2004;138:199e204.[18] Tanrioven M, Alam MS. J Power Sources 2005;142:264e78.
[19] Gigliucci G, Petruzzi L, Cerelli E, Garzisi A, La Mendola A. JPower Sources 2004;131:62e8.
[20] Santarelli M, Macagno S. Energy Conversion Manage 2004;45:427e51.
[21] Yilanci A, Dincer I, Ozturk HK. Intl J Hydrogen Energy 2008;33:7538e52.
[22] Guizz GL, Manno M, De Falco M. Intl J Hydrogen Energy 2009;34:3112e24.
[23] Doucet G, Etievant C, Puyenchet C, Grigorie S, Millet P. Intl JHydrogen Energy 2009;34:4983e9.
[24] Eroglu M, Dursun E, Sevencan S, Song J, Yazici S, Kilic O. Intl JHydrogen Energy 2011;36:7985e92.