experimental simulation of element mass transfer and
TRANSCRIPT
lable at ScienceDirect
Applied Geochemistry 69 (2016) 1e11
Contents lists avai
Applied Geochemistry
journal homepage: www.elsevier .com/locate/apgeochem
Experimental simulation of element mass transfer and primary halozone on water-rock interaction
Qingjie Gong*, Taotao Yan, Jinzhe Li, Mu Zhang, Ningqiang LiuState Key Laboratory of Geological Processes and Mineral Resources, China University of Geosciences, Beijing, 100083, China
a r t i c l e i n f o
Article history:Received 23 December 2015Received in revised form1 April 2016Accepted 2 April 2016Available online 4 April 2016
Keywords:Water-rock interactionMass transfer of elementsDenudation coefficient of primary halo zoneCore flow-through pressure vessel reactorLinglong gold deposit
* Corresponding author. School of Earth Sciences anof Geosciences, Beijing, 100083, China.
E-mail address: [email protected] (Q. Gong).
http://dx.doi.org/10.1016/j.apgeochem.2016.04.0010883-2927/© 2016 Elsevier Ltd. All rights reserved.
a b s t r a c t
Primary halo zone is an important theory for prospecting the deep blind ore body and predictingresource potential. The common description of primary halo zone of multiple elements is based on theirbehaviors during hydrothermal alteration or mineralization. A geofluid with multiple elements, whichare Bi, Cu, Pb, Zn, Cd, Ag, and As (bearing Ni and Mo), is prepared to simulate the dispersive transfer ofelements in a hydrothermal fluidegranite reaction at 15 MPa, 100 �C using a new-constructed core flow-through pressure vessel reactor. Core granite samples with 5 cm long after water-rock reaction are cutinto ten sections to analyze their major oxides and trace elements. According to experiment results andthe method of immobile plateau, we determine that Al and Ti are immobile elements during the water-rock reaction and the hydrothermal alteration of granite is a mass gained process. The mobility index(MI) of each of experimental elements is calculated based on the immobile component Al2O3. Thesequence of experimental elements is from As to Ag, Pb, Zn, Cu, Bi, Ni, Cd, and Mo, which are sorted ontheir values of MI in these reacted granite cores from near to far end respecting to the reaction fluid. Thisresult is consistent with the empirical sequence of zonation of primary halo elements which is derivedfrom the statistical results from 58 gold deposits in China. The denudation coefficient of primary halozone (Zf or Zfe) is proposed to assess the degree of approaching to ore body on these experiments, whichis the averaged MI ratio of front halo elements to ore-body halo elements. The denudation coefficient ofprimary halo zone is applied on the cross section of gold ore-body hosted in the granite of the Linglonggold deposit located in the Jiaodong peninsula of eastern China. The degree of approaching to the goldore body is clearly illustrated by the denudation coefficient of primary halo zone.
© 2016 Elsevier Ltd. All rights reserved.
1. Introduction
Primary halo zone is an important theory for prospecting thedeep blind ore body and predicting resource potential (Li et al.,1995; Shao, 1997; Eilu et al., 2001; Harraz, 1995; Harraz andHamdy, 2015). It can be used to speculate the existence of blindore body and to assess the degree of approaching to ore body (Chenand Zhao,1998; Chen et al., 2008, 2016; Hosseini-Dinani and Aftabi,2016). Researches on the primary halo zone originated in the 1950s.As one of the most important features of primary halo, the zonationof primary halo has always been the hot topic. In the 1970s, Gri-goryan, a geochemist from the former Soviet Union, proposed anindex to calculate the element zonation of primary halo and
d Resources, China University
derived an experience zonation of elements of primary halo inhydrothermal deposits (Shao, 1997). In China, Shao also proposed azonation pattern of primary halo based on lots of case data from oredeposits and discussed its applications on resource prospecting in1974 (Shao, 1997). With respect to gold deposits, Li et al. (1999)derived an empirical zonation of elements of primary halo basedon 58 typical gold deposits in China. The zonation sequence of el-ements from the top to the bottom of ore body is B-As-Hg-F-Sb-Bawhich represents the assemblage of front halo elements, to Pb-Ag-Au-Zn-Cu which is the assemblage of ore body elements, then toW-Bi-Mo-Mn-Ni-Cd-Co-V-Ti, which represents the assemblage oftail halo elements. Although these experience zonation sequencesare derived from lots of case studies, no experimental simulationexists on water-rock reaction in hydrothermal mineralization oralteration systems to test the results. In this paper, we designed asimulation experiment on water-rock interaction to investigate thebehaviors of elements in the primary halo during hydrothermalalteration or mineralization.

Q. Gong et al. / Applied Geochemistry 69 (2016) 1e112
The common chemical indices for describing the process ofalteration are divided into two types. One type is constructed on themajor oxides of samples to indicate the degree of alteration, such asAlteration Index (AI; Ishikawa et al., 1976; Date et al., 1983),Chemical Index of Alteration (CIA; Nesbitt and Young, 1982) andChlorite-Carbonate-Pyrite Index (CCPI; Large et al., 2001). In addi-tion, some weathering index, such as Weathering Index of Parker(WIP; Parker, 1970), Weathering Index of Colman (WIC; Colman,1982) and Weathering Index of Granite (WIG; Gong et al., 2013)can also be applied for describing the alteration or mineralizationprocess, which can be classified into this type. The other type ispresented on element contents of samples to assess elements’quantity of mass transfer, such as Mobility Index (MI; Ng et al.,2001), the percentage of gain or loss (Xgp; Ng et al., 2001) and thet value (Brantley et al., 2007; Brantley and White, 2009; Ma et al.,2011). These indices are calculated on the basis of the immobileelements during hydrothermal alteration. Here, we adopt both twotypes of index to calculate the degree of alteration of samples andthe quantity of mass transfer of elements on the reacted samples.Finally the element zonation of primary halo is ordered by itsquantity of mass transfer during the hydrothermal alteration.
2. Materials and methods
2.1. Rock materials
The sample of granite for simulation experiment was collectedfrom Linglong biotite granite located in the Jiaodong Peninsula,China (Gong et al., 2013; Ma et al., 2013). Four columnar sampleswere made from the granite with length of about 5.1 cm anddiameter of approximately 2.6 cm. The detailed size and experi-ment No. for each sample are listed in Table 1. The granite samplesbefore and after experiments are presented in Fig. 1.
Fig. 1 Photographs of analyzed samples before and after thesimulation experiment. (a) Primary sample from Linglong biotitegranite; (b) Two of the cores after cutting from the primary granite;(c) No. 1 pre-experiment core without reacted; (d) No. 3 before thesimulation experiment; (e) No. 3 after the experiment; (f) No. 3 iscut into 10 sections from the near to the far end to the reactionfluid; (g) No. 4 before the experiment; (h) No. 4 after the experi-ment; (i) No. 4 is cut into 10 sections from the near to the far end; (j)No. 5 before the experiment; (k) No. 5 after the experiment; (l) No.5 is cut into 10 sections from the near to the far end. Arrows indi-cate the movement direction of the reaction fluids.
2.2. Fluid materials
The reaction fluid in S3 is prepared by dilution of standard so-lution, which represents a geofluid with multiple elements in lowcontents. In fluids of S4 and S5 which represent hydrothermalfluids with high metal contents, Bi, Cd, Ag and As are made bydilution, while, Cu, Pb and Zn are made from the dissolution ofstandard solid (nitrate). The element concentrations of fluidsadopted in this simulation are listed in Table 2.
Table 1Experiment No. and sample sizes of granite columns for the experiment.
Test no. Sample no. Length (cm) Diameter (cm)
Pre-experiment 1 5.10 2.60S3 3 5.14 2.60S4 4 5.09 2.60S5 5 5.09 2.61
2.3. Experimental setup
Based on the reactor system reported by Gong et al. (2012), anew core flow-through pressure vessel reactor was constructed tosimulate the disperse transfer of elements in water-rock reactionunder high temperature and high pressure (Fig. 2). The simulationreactor and the connected wires are made from hastalloy B, whichis an alloy mainly made from Ni and Mo.
2.4. Experimental procedure
Temperature, pressure and reaction time were set in thesesimulation experiments and are listed in Table 3.
In S3, when the fluiderock interaction had experienced 13 h, theeffusion took place at the trailing end of granite core, thus broughtS3 to the end of simulation. Accordingly, in the subsequent S4 andS5, the reaction time was set at eight hours to avoid the effusionand model the multi-component dispersed transformation ingranite medium, rather than the transformation dominated byfluxion. Remarkably, the S4 and S5 are characterized by the sameexperimental parameters, indicating that they are repeatedexperiments.
2.5. Analytical methods
All granite core samples before and after the experiment wererespectively cut into 10 sections at 0.5 cm interval from the near tofar end to the reaction fluid, with each sample labeled as 1 to 10(e.g. 101, 102, 103, 104, 105, 106, 107, 108, 109, 110 in Fig. 1).
Granite samples were analyzed at the Hubei GeologicalResearch Laboratory in China. Major oxides (SiO2, Al2O3, TiO2,Fe2O3, Na2O, K2O, CaO, MgO, MnO, and P2O5) and trace elements ofBa, Cr, Nb, Rb, Sr, and V were analyzed by X-ray fluorescencespectrometry (XRF) on pressed powder pellets. FeO was deter-mined by volumetric analysis, LoI (Loss on Ignition) by gravimetry.Trace elements of Bi, Cd, Co, Cu, Mo, Ni, Pb, Sc, Ta, Th, U, W, Y, Zn,and rare earth elements were analyzed by inductively coupledplasma mass spectrometry (ICP-MS). As, Sb were detected by atomfluorescence spectrometry, Be and Li by inductively coupled plasmaatom emission spectrometry, and Ag, B, and Sn by emissionspectrometry.
The accuracies of the above-mentioned analyses were moni-tored using standard materials. Most of the analytical methodsyield accuracy higher than 5% for major oxides and 10% for traceelements. The relative errors of repeated sample analyses are lessthan 10% and most exhibit less than 5% of relative errors.
3. Results
The bulk analyses of major oxides, rare earth elements and othertrace elements of the reacted granite samples are listed in Table 1S.
3.1. Major oxides
Major oxide contents (including LoI), WIG, Al2O3/TiO2 and K2O/SiO2 values of the before and after reacted granite samples areplotted versus distance from the near to far end to the reactionfluids in Fig. 3.
WIG index is constructed on the major oxides of sample todescribe the degree of graniteweathering (Gong et al., 2013), whichis also suitable to describe the alteration degree of rocks in alter-ation ormineralization process (He et al., 2014). Al2O3/TiO2 is a ratiobetween immobile elements (Duzgoren-Aydin et al., 2002) and canbe used to trace parent rocks of samples from regolith profiles(Gong et al., 2015). The index of K2O/SiO2 is a ratio between mobile

Fig. 1. Photographs of analyzed samples before and after the simulation experiment. (a) Primary sample from the Linglong biotite granite; (b) Two of the cores after cutting from theprimary granite; (c) No. 1 pre-experiment core without reacted; (d) No. 3 before the simulation experiment; (e) No. 3 after the experiment; (f) No. 3 is cut into 10 sections from thenear to the far end to the reaction fluid; (g) No. 4 before the experiment; (h) No. 4 after the experiment; (i) No. 4 is cut into 10 sections from the near to the far end; (j) No. 5 beforethe experiment; (k) No. 5 after the experiment; (l) No. 5 is cut into 10 sections from the near to the far end. Arrows indicate the movement direction of the reaction fluids.
Table 2Element concentrations of fluids in the simulation experiments.
Experiment no. pH Bi Cu Pb Zn Cd Ag As
S3 0.48 5 100 100 100 5 5 10S4 0.52 10 3507 1048 4705 25 10 100S5 0.52 10 3507 1048 4705 25 10 100Granite e 0.02 7.17 40.0 34.8 0.020 0.035 6.34
Note: The reaction fluid is HNO3-H2O system. The unit of concentration is mg/ml in fluids and mg/g in granite.
Q. Gong et al. / Applied Geochemistry 69 (2016) 1e11 3
elements and is used to characterize the extensive weatheringproducts (Gong et al., 2015).
Compared with the No. 1 sample (before simulation), the con-tents of major oxides (including LoI), and values of WIG, Al2O3/TiO2and K2O/SiO2 in No. 3 don't show clear deviationwithin the error ofhomogeneity of granite samples. However, these values vary clearlyin No. 4 and No. 5.
The behaviors of major oxides (including LoI), WIG, Al2O3/TiO2and K2O/SiO2 in No. 4 and No. 5 relative to in No. 1 are similar asfollows:
(1) The contents of Fe2O3, FeO, Na2O, K2O, CaO, MgO, MnO, P2O5and LoI show no clear changes from the near (0.25 cm) to farend (4.75 cm) to the reaction fluid. That is, they exhibit no
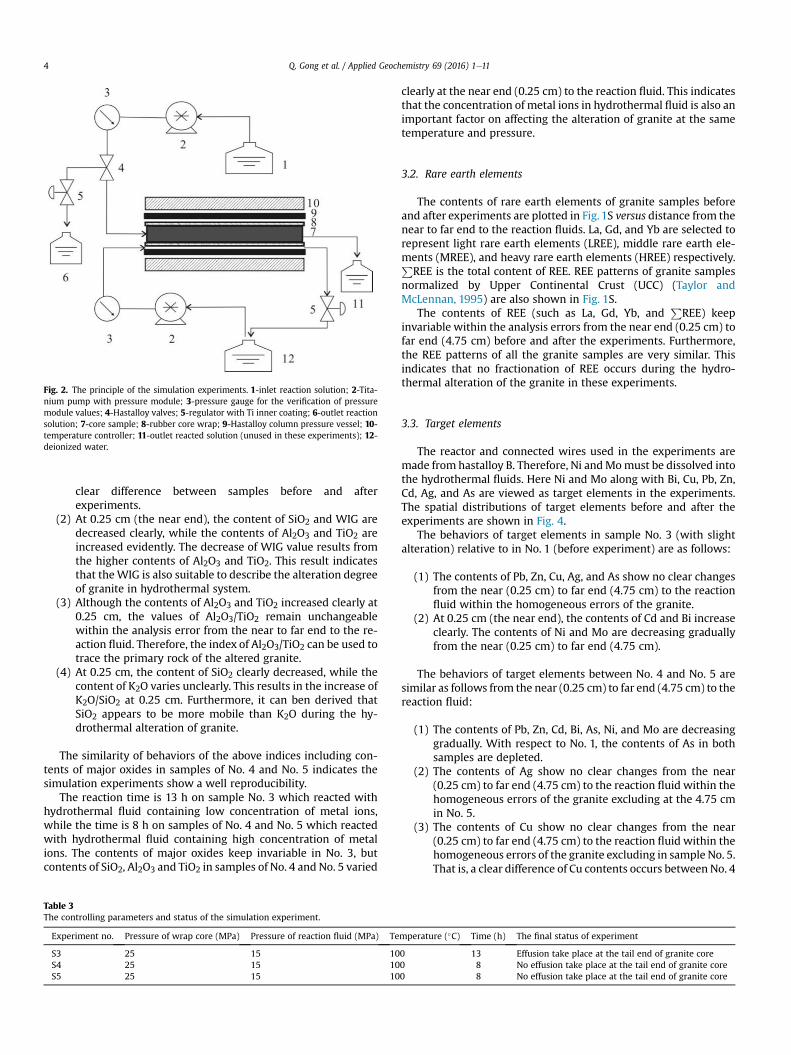
Fig. 2. The principle of the simulation experiments. 1-inlet reaction solution; 2-Tita-nium pump with pressure module; 3-pressure gauge for the verification of pressuremodule values; 4-Hastalloy valves; 5-regulator with Ti inner coating; 6-outlet reactionsolution; 7-core sample; 8-rubber core wrap; 9-Hastalloy column pressure vessel; 10-temperature controller; 11-outlet reacted solution (unused in these experiments); 12-deionized water.
Q. Gong et al. / Applied Geochemistry 69 (2016) 1e114
clear difference between samples before and afterexperiments.
(2) At 0.25 cm (the near end), the content of SiO2 and WIG aredecreased clearly, while the contents of Al2O3 and TiO2 areincreased evidently. The decrease of WIG value results fromthe higher contents of Al2O3 and TiO2. This result indicatesthat theWIG is also suitable to describe the alteration degreeof granite in hydrothermal system.
(3) Although the contents of Al2O3 and TiO2 increased clearly at0.25 cm, the values of Al2O3/TiO2 remain unchangeablewithin the analysis error from the near to far end to the re-action fluid. Therefore, the index of Al2O3/TiO2 can be used totrace the primary rock of the altered granite.
(4) At 0.25 cm, the content of SiO2 clearly decreased, while thecontent of K2O varies unclearly. This results in the increase ofK2O/SiO2 at 0.25 cm. Furthermore, it can ben derived thatSiO2 appears to be more mobile than K2O during the hy-drothermal alteration of granite.
The similarity of behaviors of the above indices including con-tents of major oxides in samples of No. 4 and No. 5 indicates thesimulation experiments show a well reproducibility.
The reaction time is 13 h on sample No. 3 which reacted withhydrothermal fluid containing low concentration of metal ions,while the time is 8 h on samples of No. 4 and No. 5 which reactedwith hydrothermal fluid containing high concentration of metalions. The contents of major oxides keep invariable in No. 3, butcontents of SiO2, Al2O3 and TiO2 in samples of No. 4 and No. 5 varied
Table 3The controlling parameters and status of the simulation experiment.
Experiment no. Pressure of wrap core (MPa) Pressure of reaction fluid (MPa) Te
S3 25 15 10S4 25 15 10S5 25 15 10
clearly at the near end (0.25 cm) to the reaction fluid. This indicatesthat the concentration of metal ions in hydrothermal fluid is also animportant factor on affecting the alteration of granite at the sametemperature and pressure.
3.2. Rare earth elements
The contents of rare earth elements of granite samples beforeand after experiments are plotted in Fig. 1S versus distance from thenear to far end to the reaction fluids. La, Gd, and Yb are selected torepresent light rare earth elements (LREE), middle rare earth ele-ments (MREE), and heavy rare earth elements (HREE) respectively.P
REE is the total content of REE. REE patterns of granite samplesnormalized by Upper Continental Crust (UCC) (Taylor andMcLennan, 1995) are also shown in Fig. 1S.
The contents of REE (such as La, Gd, Yb, andP
REE) keepinvariable within the analysis errors from the near end (0.25 cm) tofar end (4.75 cm) before and after the experiments. Furthermore,the REE patterns of all the granite samples are very similar. Thisindicates that no fractionation of REE occurs during the hydro-thermal alteration of the granite in these experiments.
3.3. Target elements
The reactor and connected wires used in the experiments aremade from hastalloy B. Therefore, Ni andMomust be dissolved intothe hydrothermal fluids. Here Ni and Mo along with Bi, Cu, Pb, Zn,Cd, Ag, and As are viewed as target elements in the experiments.The spatial distributions of target elements before and after theexperiments are shown in Fig. 4.
The behaviors of target elements in sample No. 3 (with slightalteration) relative to in No. 1 (before experiment) are as follows:
(1) The contents of Pb, Zn, Cu, Ag, and As show no clear changesfrom the near (0.25 cm) to far end (4.75 cm) to the reactionfluid within the homogeneous errors of the granite.
(2) At 0.25 cm (the near end), the contents of Cd and Bi increaseclearly. The contents of Ni and Mo are decreasing graduallyfrom the near (0.25 cm) to far end (4.75 cm).
The behaviors of target elements between No. 4 and No. 5 aresimilar as follows from the near (0.25 cm) to far end (4.75 cm) to thereaction fluid:
(1) The contents of Pb, Zn, Cd, Bi, As, Ni, and Mo are decreasinggradually. With respect to No. 1, the contents of As in bothsamples are depleted.
(2) The contents of Ag show no clear changes from the near(0.25 cm) to far end (4.75 cm) to the reaction fluid within thehomogeneous errors of the granite excluding at the 4.75 cmin No. 5.
(3) The contents of Cu show no clear changes from the near(0.25 cm) to far end (4.75 cm) to the reaction fluid within thehomogeneous errors of the granite excluding in sample No. 5.That is, a clear difference of Cu contents occurs between No. 4
mperature (�C) Time (h) The final status of experiment
0 13 Effusion take place at the tail end of granite core0 8 No effusion take place at the tail end of granite core0 8 No effusion take place at the tail end of granite core
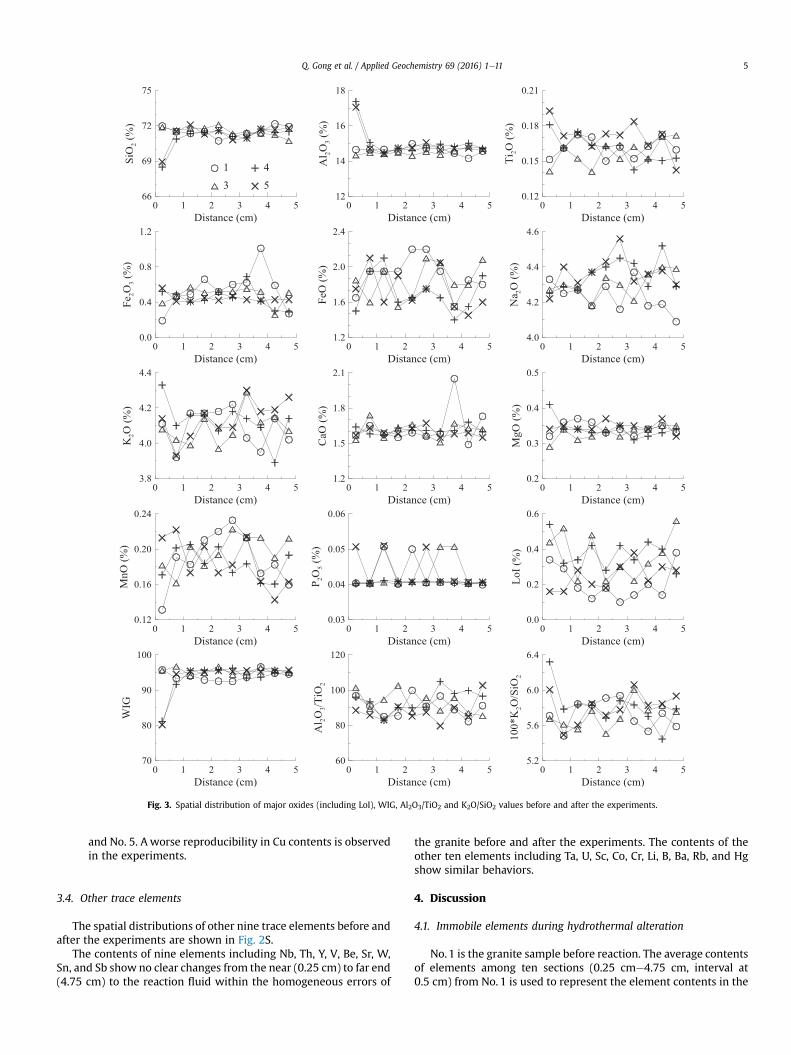
Fig. 3. Spatial distribution of major oxides (including LoI), WIG, Al2O3/TiO2 and K2O/SiO2 values before and after the experiments.
Q. Gong et al. / Applied Geochemistry 69 (2016) 1e11 5
and No. 5. A worse reproducibility in Cu contents is observedin the experiments.
3.4. Other trace elements
The spatial distributions of other nine trace elements before andafter the experiments are shown in Fig. 2S.
The contents of nine elements including Nb, Th, Y, V, Be, Sr, W,Sn, and Sb show no clear changes from the near (0.25 cm) to far end(4.75 cm) to the reaction fluid within the homogeneous errors of
the granite before and after the experiments. The contents of theother ten elements including Ta, U, Sc, Co, Cr, Li, B, Ba, Rb, and Hgshow similar behaviors.
4. Discussion
4.1. Immobile elements during hydrothermal alteration
No.1 is the granite sample before reaction. The average contentsof elements among ten sections (0.25 cme4.75 cm, interval at0.5 cm) from No. 1 is used to represent the element contents in the

Fig. 4. Spatial distribution of the target elements before and after the simulation experiment.
Q. Gong et al. / Applied Geochemistry 69 (2016) 1e116
granite before reaction, which is labeled as S1.As the samples of No. 4 and No. 5 are set as repeated experi-
ments, the average contents of elements in the same section be-tween No. 4 and 5 are used to represent the element contents in thegranite after reaction, which is labeled as S45. That is, the averagesample of 401 and 501 in Fig. 1 is called S45-1, average sample of402 and 502 is S45-2, etc.
According to the results of major oxides, S1 represents freshgranite, while S45-1 represents the granite in strong degree ofhydrothermal alteration, and S45-2 in weak. These three samplesare selected to investigate the immobile elements during the hy-drothermal alteration of the granite. The common method used todetermine immobile elements during geochemical process is theisocon diagram (Grant, 1986). A new method called immobileplateau was presented by Gong et al. (2011) and is used here todetermine the immobile elements. According to the analyzed ele-ments in this study, ten elements of Al, Ti, Nb, Ta, Th, U, Sc, Y, La, andY are selected as candidates for immobile elements, and theirplateau diagrams are illustrated in Fig. 5.
In the diagram of S1/S45-1, three plateaus can be recognized asAl-Ti, La-Y, and Ta-U-Th-Yb. In the diagram of S1/S45-2, two pla-teaus can be derived as Nb-La-Th-Y and Al-Ti-Yb. Only plateaus ofAl-Ti and La-Y occur in both diagrams. The alteration degree of S45-1 is stronger than that in S45-2, but the plateau of La-Y in bothdiagrams is ca. 0.9. Therefore, we exclude La and Y as immobileelements and select Al and Ti as immobile elements during thesimulation experiments.
According to the Al and Ti immobile elements, the mass ratios ofS45-1 and S45-2 to S1 are calculated as 1.17 and 1.02, respectively.Both ratios, which are larger than 1, indicate that the hydrothermalalteration of the granite in this simulation is a mass gained process.
4.2. Mass transfer of elements during hydrothermal alteration
Although Al2O3 and TiO2 are all immobile elements in the hy-drothermal alteration of the granite, the mass transfer of targetelements in these experiments is calculated on the immobileelement of Al2O3 which has a higher analytical precision than TiO2.
The mass transfer of elements can be presented by MobilityIndex (MI) which is defined as (Ng et al., 2001):
MI ¼ Ciw
C0w
,Cip
C0p
!¼ Ci
wC0p
C0wCi
p(1)
where Ciw and C0
w are the percentage by weight of the mobileelement i and immobile element in altered rock, Ci
p and C0p are the
percentage by weight of the mobile element i and immobileelement in the parent rock.
4.2.1. Mass transfer on MIThe spatial distributions of mass transfer on mobility index (MI)
of the samples 3 and S45 are shown in Fig. 6.According to Fig. 6, we can derive the following ones:
(1) For Ni and Mo, their MI are all larger than 1 in the samples 3and S45, and are decreasing gradually from the near end(0.25 cm) to the far end (4.75 cm) to reaction fluid.
(2) In the sample S45, the mass of Cd, Bi, and Zn is clearly gained(MI > 1), and the quantity of mass input is decreasing grad-ually from the near to the far end to the reaction fluid. Thegained mass of Pb is decreasing at the first three sections,while no obvious mass transfer took place (MI is ca. 1)

Fig. 5. Plateau diagrams of candidates for immobile elements.
Fig. 6. Spatial distribution of mass transfer mobility index (MI) for the target elements in the simulation experiment.
Q. Gong et al. / Applied Geochemistry 69 (2016) 1e11 7
subsequently. As displays obvious lost mass (MI < 1), and itslost mass is increasing gradually until it is reaching a stablevalue. TheMI of Ag is ca. 1 from the near to the far end to thereaction fluid except a high value at the end. Contents of Cushow aworse reproducibility in the experiments of No. 4 andNo. 5, which results in the irregularity of its MI in spatialdistribution.
(3) In the sample 3, the gained mass of Cd is decreasing from thenear to far end to the reaction fluid, until MI is ca. 1. Masstransfers of Pb and Zn are almost undetectable or values ofMIare ca. 1. Variation trends of MI of Bi, Cu, Ag, and As are un-clear, but their values of MI are ca. 1 generally.
4.2.2. Sequence of elements on MIIn these experiments, components of the two sections near to
the reaction fluids were altered clearly, while components of the
other eight sections (from the third to the tenth) are similar to thoseof their parent rock. Here the first, second, third and ninth sectionsare selected to represent the strong altered, weak altered, lightaltered, and parent samples to assess the mass transfer of elementson MI during the hydrothermal alteration of the granite. Sequenceof elements on MI in samples 3 and S45 is derived asAs/Ag/Pb/Zn/Cu/Bi/Ni/Cd/Mo (Fig. 7).
In the third and ninth section in sample 3, theMI of Cd is smallerthan that of Mo. However, the MI of Cd is clearly larger than that ofMo in S45. Cd is the target element selected in the simulation andits content in the fluids reacted with S45 is five times higher thanthat in the fluid reacted with sample 3 (Table 2). Mo is an elementdissolved into the reaction fluids from the Hastalloy B reactor.Thesemay result in the different sequence of Cd andMo on theirMIin samples at different degrees of alteration.
Li et al. (1999) have collected the zonation of elements of pri-mary halos for 63 gold deposits in China. They derived an empirical

Fig. 7. Sequence of elements on MI in the hydrothermal alteration of the granite.
Q. Gong et al. / Applied Geochemistry 69 (2016) 1e118
zonation of elements of primary halo based on the statistical resultsfrom 58 typical gold deposits. The zonation sequence of elementsfrom the top to the bottom of ore body is B-As-Hg-F-Sb-Ba whichrepresents the assemblage of front halo elements, to Pb-Ag-Au-Zn-Cuwhich is the assemblage of ore body elements, then toW-Bi-Mo-Mn-Ni-Cd-Co-V-Ti, which represents the assemblage of tail haloelements. In other words, element assemblage of front halo is B, As,Hg, F, Sb, and Ba; element assemblage of ore-body halo is Pb, Ag, Znand, Cu; element assemblage of tail halo isW, Bi, Mo, Mn, Ni, Cd, Co,V, and Ti in gold deposits.
In these experiments, the sequence of target elements on MI isAs/(Pb-Ag-Zn-Cu)/(Bi-Mo-Ni-Cd), which is consistent with theempirical result derived by Li et al. (1999). Therefore, the simulationmethod in this study can provide a new way to investigate thezonation of primary halos in hydrothermal mineralizationquantitatively.
4.3. Denudation coefficient on primary halo zone
According to the empirical primary halo zones in gold deposits(Li et al., 1999) and the sequence of target elements on MI in theseexperiments, we divide the element assemblage of Bi-Mo-Ni-Cd asthe ore body elements and As-Pb-Ag-Zn-Cu as the front halo ele-ments here. That is, the simulation in this study is like the Mo and(or) Ni mineralization rather than gold mineralization. The reactionfluids are contacting with the Hastalloy B which represents the Moand (or) Ni ore body before the reaction with granite, and can beregarded as mineralization fluids.
According to the idea that the ratio of front halo elements to ore-body halo elements can be used to evaluate the denudation degreeof ore body (Hu et al., 2010; Su and Dai, 2010), we proposed adenudation coefficient on primary halo zone to assess the degree ofapproaching to the ore body which is labeled as Zf (Zone coeffi-cient) and defined as the averagedMI ratio of front halo elements toore-body halo elements. Thus, on Mo and (or) Ni deposit in thissimulation, Zf is calculated as:
Zf ¼ ðMIBi þMICd þMIMo þMINiÞ=4�MIAs þMIPb þMIAg þMIZn þMICu
��5þ ðMIBi þMICd þMIMo þMINiÞ=4
(2)
whereMIi represent the Mobility Index of element i. Values ofMI ofthe mineralization elements are significantly larger than those ofothers among ore-body halo elements when approaching to the ore
body. To eliminate the extreme high MI when calculating Zf nearthe ore-body, we remove themineralization elements from the ore-body halo elements and label the Zone coefficient as Zfe (Zonecoefficient excluding mineralization elements) recalculated as:
Zfe ¼ ðMIBi þMICdÞ=2�MIAs þMIPb þMIAg þMIZn þMICu
��5þ ðMIBi þMICdÞ=2
(3)
The both denudation coefficients on primary halo zone, Zf andZfe, in these experiments are illustrated in Fig. 8.
Zf and Zfe in S45 are decreasing gradually from the near(0.25 cm) to far end (4.75 cm) to the reaction fluids in Fig. 8. Thisindicates that the averaged MI of the ore-body halo elements isdecreasing with respect to the averaged MI of the front halo ele-ments gradually far away from the Mo-Ni alloy which can beregarded as the ore body in these experiments. The behaviors of Zfand Zfe in No. 3 are also similar to those in S45. Therefore, the valuesof Zf and Zfe could indicate the degrees of approaching to the orebody in these experiments. In other words, the geological meaningof the denudation coefficient on primary halo zone (Zf and Zfe) isexplicit and its applicability is tested in these experiments.
4.4. Application
The Jiaodong Au province, located in the Jiaodong peninsula ofeastern China, is the largest Aumining and production area in China(Gong et al., 2013; Deng et al., 2015; Yang et al., 2015, 2016a).Linglong gold deposit is a typical Au-quartz-sulfide veins deposit inthis province and is hosted in the Linglong biotite granite (Deng andWang, 2015; Yang et al., 2007, 2009, 2016b) which is the rockmaterial in this experiment study. Previous geochronologicalstudies have reported that the mineralization age of the Linglonggold lode deposit was 125e120 Ma (Richard et al., 2014; Li et al.,2008) and the age of the hosted Linglong batholith was160e157 Ma (Ma et al., 2013; Wang et al., 2014).
Here we selected the No. 53 vein in Linglong gold deposit to testthe denudation coefficient on primary halo zone. The cross section
of the No. 53 vein at�130m level along the No. 631 exploratory lineis shown in Fig. 9. Six samples in the cross section with differentdegrees of alteration were collected, and their analytical results are

Fig. 8. Spatial distribution of the denudation coefficients (Zf and Zfe) for samples 3 and S45.
Fig. 9. Cross section of No. 53 vein at �130 m level in Linglong gold deposit.
Q. Gong et al. / Applied Geochemistry 69 (2016) 1e11 9
listed in Table 2S.
4.4.1. Target elementsThe spatial distributions of nine target elements in the experi-
ments and other primary halo elements, together with Au, Al2O3,and TiO2 in the cross section of No. 53 vein are shown in Fig. 3S.
Although the section crosses over the No. 53 vein ore body, themaximum content of Au in quartz-sulfide vein is only about 20 ng/g, which may be resulted from “the granular gold effect in chemicalanalysis”. Maximum contents of Pb, Zn, Cd, Bi, Mo, Cu, and As occurin the central section, while the maximum contents of Ni and Moare at the 6th m and 13th m in the cross section, respectively. Theminimum content of Al2O3 is in the sample of quartz-sulfide vein,and the maximum content of TiO2 is at the 6th m in the crosssection. The behaviors of TiO2 are similar with that of Al2O3
generally except the sample at the 6th m in the section.
4.4.2. Denudation coefficient on primary halo zoneAlthough the behaviors of TiO2 and Al2O3 are inconsistent at the
6th m in the section, we still selected the Al2O3 as the immobileelement during the goldmineralization in the No. 53 vein accordingto the experiment result.
The S1 sample in the above experiments is treated as the parentrock of the six samples in the cross section of No.53 vein, the
element MI in each sample is calculated. Then the denudation co-efficients of primary halo zone in each sample can be computedaccording to Eq. (2) and Eq. (3).
According to the empirical primary halo zones in gold depositsderived by Li et al. (1999) and the experiment results in this study,we select Bi-As-Hg-F-Sb-Ba as the front halo elements, Pb-Ag-Au-Zn-Cu as the ore-body halo elements and W-Bi-Mo-Mn-Ni-Cd-Co-V-Ti as the tail halo elements. The Zf and Zfe in the cross sectionof No. 53 vein in Linglong gold deposit are shown in Fig. 10.
Themaximumvalue of Zf appears at the 13th m (or sample B5 inFig. 9) in the cross section in Fig. 10, where the quartz-sulfides veindominates. From the quartz-sulfides vein to the pyritic sericitolitebilaterally, Zf is decreasing gradually. In order to eliminate theextreme highMIwhen calculating Zf near the ore-body, we removethe Au from the assemblage of Pb-Ag-Au-Zn-Cu, the ore-body haloelements, to calculate the Zfe in Fig. 10. The maximum value of Zfeappears at the 9th m (or sample B4 in Fig. 9), where the sericitolitedominates and maximum values of Pb, Ag, Zn, and Cu occur inFig. 3S. That is, the maximum value of Zfe occurs at the ore-bodywhich is described by the high values of ore-body halo elementsexcluding Au. The value of Zfe is also decreasing from the ore-bodybilaterally in Fig. 10. Therefore, the values of Zf and Zfe could indi-cate the degrees of approaching to the ore body in the cross sectionof No. 53 vein in Linglong gold deposit. In other words, the

Fig. 10. Spatial distribution of Zf and Zfe in the cross section of No. 53 vein.
Q. Gong et al. / Applied Geochemistry 69 (2016) 1e1110
geological meaning of the denudation coefficient on primary halozone (Zf and Zfe) is explicit and its applicability is verified in theLinglong gold deposit located in the Jiaodong peninsula of easternChina.
5. Conclusion
The simulation experiment that focuses on the transfer behaviorof elements in reaction between a geofluid with multiple elements(Bi, Cu, Pb, Zn, Cd, Ag, As bearing Ni and Mo) and granite is con-ducted at 15 MPa, 100 �C, using a new-constructed core flow-through pressure vessel reactor.
(1) Al and Ti are determined as immobile elements during thehydrothermal alteration of granite or mineralization, and thehydrothermal alteration of the granite is a mass gainedprocess.
(2) The elements of hydrothermal fluid can be brought in andout during the hydrothermal alteration of granite. Thezonation of primary halo elements is from As, to Ag, Pb, Zn,Cu, Bi, Ni, Cd, and Mo, which are sorted on their values of MIin these reacted granite cores from near to far end respectingto the reaction fluid. This sequence of primary halo elementscoincides with the empirical sequence derived from 58 golddeposits in China.
(3) Based on the experiment results and zonation of primaryhalos, the denudation coefficient on primary halo zone, Zfand Zfe, are proposed which indicate the degree ofapproaching to the ore body. The geological meaning of thedenudation coefficient on primary halo zone (Zf and Zfe) isexplicit and its applicability is verified in the Linglong golddeposit located in the Jiaodong peninsula of eastern China.
Acknowledgments
This work was financially supported by the Natural ScienceFoundation of China (Grant No. 41230311) and the National Scienceand Technology Support Program (Grant No. 2011BAB04B09). Wethank Professor Michael Kersten, and the two anonymous re-viewers for their valuable suggestions and comments to improvethe manuscript.
Appendix A. Supplementary data
Supplementary data related to this article can be found at http://dx.doi.org/10.1016/j.apgeochem.2016.04.001.
References
Brantley, S.L., White, A.F., 2009. Approaches to modeling weathered regolith. Rev.
Mineral. Geochem. 70, 435e484.Brantley, S.L., Goldhaber, M.B., Ragnarsdottir, K.V., 2007. Crossing disciplines and
scales to understand the critical zone. Elements 3, 307e314.Chen, Y.Q., Zhao, P.D., 1998. Zonation in primary halos and geochemical prospecting
pattern for the Guilaizhuang gold deposit, Eastern China. Nonrenew. Resour. 7(1), 37e44.
Chen, Y.Q., Huang, J.N., Liang, Z., 2008. Geochemical characteristics and zonation ofprimary halos of Pulang porphyry copper deposit, Northwestern YunnanProvince, Southwestern China. J. China Univ. Geosci. 19 (4), 371e377.
Chen, J., Chen, R.Y., Mao, Z.X., Yang, H.Z., Zhang, C.P., Han, R.P., 2016. Regionalmineral resources assessment based on rasterized geochemical data: a casestudy of porphyry copper deposits in Manzhouli, China. Ore Geol. Rev. 74,15e25.
Colman, S.M., 1982. Chemical Weathering of Basalts and Andesites; Evidence fromWeathering Rinds (No. 1246). USGPO, pp. 1e57.
Date, J., Watanabe, Y., Saeki, Y., 1983. Zonal alteration around the Fukazawa Kurokodeposits, Akita prefecture, northern Japan. Econ. Geol. Monogr. 5, 365e386.
Deng, J., Wang, Q.F., 2015. Gold mineralization in China: metallogenic provinces,deposit types and tectonic framework. Gondwana Res. http://dx.doi.org/10.1016/j.gr.2015.10.003.
Deng, J., Liu, X.F., Wang, Q.F., Pan, R.G., 2015. Origin of the Jiaodong-type Xinli golddeposit, Jiaodong Peninsula, China: constraints from fluid inclusion andCeDeOeSeSr isotope compositions. Ore Geol. Rev. 65, 674e686.
Duzgoren-Aydin, N.S., Aydin, A., Malpas, J., 2002. Re-assessment of chemicalweathering indices: case study on pyroclastic rocks of Hong Kong. Eng. Geol. 63(1), 99e119.
Eilu, P., Mikucki, E.J., Dugdale, A.L., 2001. Alteration zoning and primary geochemicaldispersion at the Bronzewing lode-gold deposit, Western Australia. Miner.Depos. 36 (1), 13e31.
Gong, Q.J., Deng, J., Yang, L.Q., Zhang, J., Wang, Q.F., Zhang, G.X., 2011. Behavior ofmajor and trace elements during weathering of sericite-quartz schist. J. AsianEarth Sci. 42, 1e13.
Gong, Q.J., Deng, J., Han, M., Yang, L.Q., Wang, W.Q., 2012. Dissolution of sandstonepowders in deionised water over the range 50e350� C. Appl. Geochem. 27 (12),2463e2475.
Gong, Q.J., Deng, J., Wang, C.M., Wang, Z.L., Zhou, L.Z., 2013. Element behaviors dueto rock weathering and its implication to geochemical anomaly recognition, acase study on Linglong biotite granite in Jiaodong peninsula, China. J. Geochem.Explor. 128, 14e24.
Gong, Q.J., Deng, J., Jia, Y.J., Tong, Y.K., Liu, N.Q., 2015. Empirical equations to describetrace element behaviors due to rock weathering in China. J. Geochem. Explor.152, 110e117.
Grant, J.A., 1986. The isocon diagram e a simple solution to Gresens' equation formetasomatic alteration. Econ. Geol. 81 (8), 1976e1982.
Harraz, H.Z., 1995. Primary geochemical haloes, El Sid gold mine, Eastern Desert,Egypt. J. Afr. Earth Sci. 20 (1), 61e71.
Harraz, H.Z., Hamdy, M.M., 2015. Zonation of primary haloes of Atud auriferousquartz vein deposit, Central Eastern Desert of Egypt: a potential explorationmodel targeting for hidden mesothermal gold deposits. J. Afr. Earth Sci. 101,1e18.
He, Y.F., Gong, Q.J., Han, D.Y., Liu, N.Q., Li, M., Ma, Y.T., Yuan, Y.T., 2014. Geochemistryof lamprophyre and its altered rocks in Linglong gold cluster in Jiaodongpeninsular. Gold 35 (7), 13e20.
Hosseini-Dinani, H., Aftabi, A., 2016. Vertical lithogeochemical halos and zoningvectors at Goushfil ZnePb deposit, Irankuh district, southwestern Isfahan, Iran:implications for concealed ore exploration and genetic models. Ore Geol. Rev.72, 1004e1021.
Hu, J.H., Ji, Y.S., Zeng, Z.G., 2010. Geochemical abnormal pattern of Wulagen Pb Zndeposit. Mineral Explor. 1 (3), 260e268.
Ishikawa, Y., Sawaguchi, T., Iwaya, S., Horiuchi, M., 1976. Delineation of prospectingtargets for Kuroko deposits based on modes of volcanism of underlying daciteand alteration halos. Min. Geol. 26, 105e117.
Large, R.R., Gemmell, J.B., Paulick, H., Huston, D.L., 2001. The alteration box plot: asimple approach to understanding the relationship between alteration miner-alogy and lithogeochemistry associated with volcanic-hosted massive sulfide

Q. Gong et al. / Applied Geochemistry 69 (2016) 1e11 11
deposits. Econ. Geol. 96 (5), 957e971.Li, H., Wang, Z.N., Li, F.G., 1995. Ideal models of superimposed primary halos in
hydrothermal gold deposits. J. Geochem. Explor. 55 (1), 329e336.Li, H., Zhang, W.H., Liu, B.L., Wang, J.C., Guo, R.D., 1999. The study on axial zonality
sequence of primary halo and some criteria for the application of this sequencefor major types of gold deposits in China. Geol. Prospect. 35 (1), 32e35.
Li, Q.L., Chen, F., Yang, J.H., Fan, H.R., 2008. Single grain pyrite RbeSr dating of thelinglong gold deposit, Eastern China. Ore Geol. Rev. 34 (3), 263e270.
Ma, L., Jin, L.X., Brantley, S.L., 2011. Chemical behaviors of different element groupsduring shale weathering at the Susquehanna/Shale Hills Critical Zone Obser-vatory. Appl. Geochem. 26, S89eS93.
Ma, L., Jiang, S.Y., Dai, B.Z., Jiang, Y.H., Hou, M.L., Pu, W., Xu, B., 2013. Multiplesources for the origin of Late Jurassic Linglong adakitic granite in the ShandongPeninsula, eastern China: zircon UePb geochronological, geochemical andSreNdeHf isotopic evidence. Lithos 162, 251e263.
Nesbitt, H.W., Young, G.M., 1982. Early Proterozoic climates and plate motionsinferred from major element chemistry of lutites. Nature 299 (5885), 715e717.
Ng, C.W.W., Guan, P., Shang, Y.J., 2001. Weathering mechanisms and indices of theigneous rocks of Hong Kong. Q. J. Eng. Geol. Hydrogeol. 34 (2), 133e151.
Parker, A., 1970. An index of weathering for silicate rocks. Geol. Mag. 107, 501e504.Richard, J., Goldfarb, Santosh, M., 2014. The dilemma of the jiaodong gold deposits:
are they unique? Geosci. Front. 5 (2), 139e153.Shao, Y., 1997. Rock Measurements (Primary Halo Method) in the Hydrothermal
Deposits Prospecting. Geological Publishing House, Beijing, pp. 1e145.
Su, X.J., Dai, L.X., 2010. Orebody spatial zoning model and application of Dongshandeposit in Linglong gold ore field. Glob. Geol. 29 (1), 60e70.
Taylor, S.R., McLennan, S.M., 1995. The geochemical evolution of the continentalcrust. Rev. Geophys. 33 (2), 241e265.
Wang, Z.L., Yang, L.Q., Deng, J., Santosh, M., Zhang, H.F., Liu, Y., et al., 2014. Gold-hosting high Ba-Sr granitoids in the xincheng gold deposit, Jiaodong Peninsula,East China: petrogenesis and tectonic setting. J. Asian Earth Sci. 95, 274e299.
Yang, L.Q., Deng, J., Ge, L.S., Wang, Q.F., Zhang, J., Gao, B.F., Jiang, S.Q., Xu, H., 2007.Metallogenicage and genesis of gold ore deposits in Jiaodong peninsula, easternChina, a regional review. Prog. Nat. Sci. 17 (2), 138e143.
Yang, L.Q., Deng, J., Guo, C.Y., Zhang, J., Jiang, S.Q., Gao, B.F., Gong, Q.J., Wang, Q.F.,2009. Ore-forming fluid characteristics of the Dayingezhuang gold deposit,Jiaodong Gold Province, China. Resour. Geol. 59 (2), 181e193.
Yang, L.Q., Deng, J., Guo, R.P., Guo, L.N., Wang, Z.L., Chen, B.H., Wang, X.D., 2015.World-class Xincheng Gold Deposit, an example from the giant Jiaodong GoldProvince. Geosci. Front.
Yang, L.Q., Deng, J., Guo, L.N., Wang, Z.L., Li, X.Z., Li, J.L., 2016a. Origin and evolutionof ore fluid, and gold deposition processes at the giant Taishang gold deposit,Jiaodong Peninsula, eastern China. Ore Geol. Rev. 72, 582e602.
Yang, L.Q., Deng, J., Wang, Z.L., Zhang, L., Goldfarb, R.J., Yuan, W.M., Weinberg, R.F.,Zhang, R.Z., 2016b. Thermo chronologic constraints on evolution of the LinglongMetamorphic Core Complex and implications for gold mineralization, a casestudy from the Xiadian gold deposit, Jiaodong Peninsula, eastern China. OreGeol. Rev. 72, 165e178.