experimental studies of pneumatic and hydraulic …havior of pneumatic and hydraulic breakwaters....
TRANSCRIPT
1('..;..titKt-z>:?Z-.ct. ? f~--a( (:£ fl;jJ.c
Permanent fae Copy 0 UNIVERSITY OF MINNESOTA Sl Anthony Falls Hydraulic Labora·
ST. ANTHONY FALLS HYDRAULIC LABORATORY
LORENZ G. STRAUB, Director
Technical Paper No. 25. Series B
EXPERIMENTAL STUDIES OF PNEUMATIC AND HYDRAULIC
BREAKWATERS
by
LORENZ G. STRAUB, C. E. BOWERS, and ZAL S. TARAPORE
August 1959
Minneapolis. Minnesota
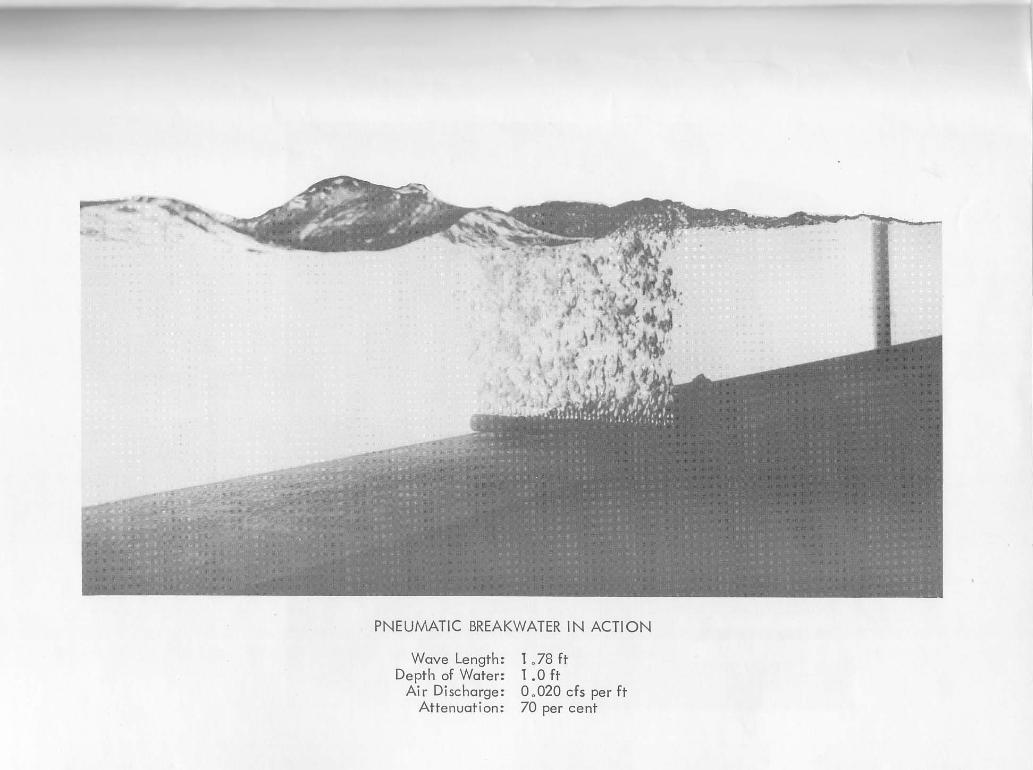
PNEUMATIC BREAKWATER IN ACTION
Wave Length: 1.78 ft Depth of Water: 1.0 ft
Air Discharge: 0 . 020 cfs per ft Attenuation: 70 per cent

HYDRAULIC BREAKWATER IN ACTION
Wave Lensth: 8 .0 ft Depth of Water: 4.5 ft
Jet Di scharge: 0 .167 cfs per ft Attenuation: 100 per cent
UNIVERSITY OF MINNESOTA
ST. ANTHONY FALLS HYDRAULIC LABORATORY
LORENZ G. STRAUB. Director
Technical Paper No. 25, Series B
EXPERIMENTAL STUDIES OF PNEUMATIC AND HYDRAULIC
BREAKWATERS
by
LORENZ G. STRAUB. C. E. BOWERS, and ZAL S. TARAPORE
August 1959
Minneapolis. Minnesota
Reproduction in whole or in part is permitted
for any purpose of the United states Government
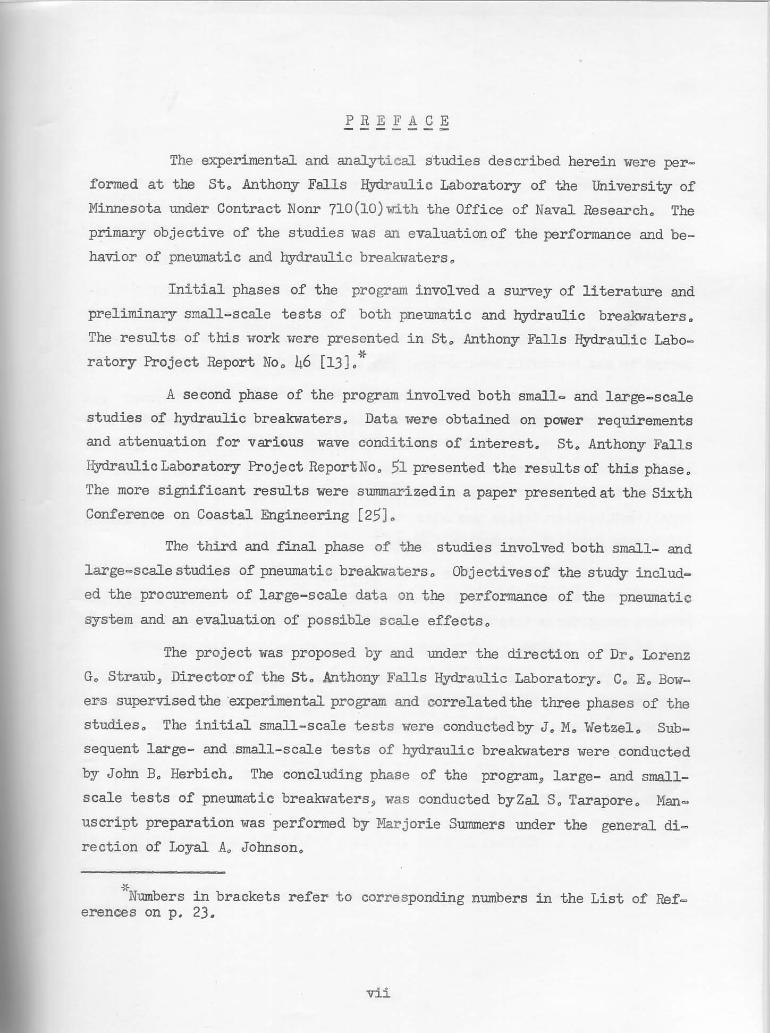
PRE FAC E - ------
The experimental and analytical studies described herein were per
formed at the St. Anthony Falls Hydraulic Laboratory of the University of
Minnesota under Contract Nonr 710(IO)with the Office of Naval Research. The
primary objective of the studies was an evaluation of the performance and be
havior of pneumatic and hydraulic breakwaters.
Initial phases of the program involved a survey of literature and
preliminary small-scale tests of both pneumatic and hydraulic breakwaters.
The results of this work were presented in St. Anthony Falls Hydraulic Labo
ratory Project Report No. 46 [13J.*
A second phase of the program involved both small- and large-scale
studies of hydraulic breakwaters. Data were obtained on power requirements
and attenuation for various wave conditions of interest. St. Anthony Falls
HydraulicLaboratory Project ReportNo. 51 presented the results of this phase.
The more significant results were s=izedin a paper presentedat the Sixth
Conference on Coastal Engineering [25J.
The third and final phase of the studies involved both small- and
large-scale studies of pneumatic breakwaters. Objectives of the study includ
ed the procurement of large-scale data on the performance of the pneumatic
system and an evaluation of possible scale effects.
The project was proposed by and under the direction of Dr. Lorenz
G. Straub, Directorof the St. Anthony Falls Hydraulic Laboratory. C. E. Bow
ers supervised the "experimental program and correlated the three phases of the
studies. The initial small-scale tests were conducted by J. M. Wetzel. Sub
sequent large- and small-scale tests of hydraulic breakwaters were conducted
by John B. Herbich. The concluding phase of the program, large- and small
scale tests of pneumatic breakwaters, was conducted byZal S. Tarapore. Man
uscript preparation was performed by Marjorie Summers under the general di
rection of Loyal A. Johnson.
* Numbers in brackets refer to corresponding numbers in the List of Ref-erences on p. 23.
vii
A B S T RAe T
Experimental studies Here conducted on two similar models of both
pneumatic and hydraulic breakwaters, having a length ratio of 4.$:1.
Tests of the pneumatic system indicated that the hor sepower re
quirements for a given percentage of attenuation depended only on the wave
length, the submergence of the manifold, and the depth of water. Mul tiple
manifold brealmaters with different spacings between manifolds were tried and
found to be of no particular advantage over the one-manifold system. An in
termittent bubbler device was also tested very briefly, showing very little
difference from the one-manifold data.
Tests of the hydraulic system indicated that power requirements var
ied with wave steepness as well as wave length. Orifice area was a very im
portant parameter as this affected the discharge requirements and the required
size of supply piping.
The p" .. e::' requirements of the pneumatic system are somewhat less
than the hydraulic for average values of wave steepness, but the maximum at
tenuation achieved was less than the hydraulic.
viii
CONTENTS -------- Page
Preface . . . . . · • vii Abstract . . • • • · · • • • • • • • viii List of Illustrations • • • • • • • • • x List of Symbols • • • • xii
I. INTRODUCTION • · . . . • • • • • • · · • · • · · · · 1
II. REVIEW OF PREVIOUS STUDmS · • · • • • • • · • • · • • · • • · 2
III. THEORETICAL CONSIDERATIONS · · · · · · · 4 A. Taylor's Theory · · • • • · • • • • • • • 4 B. A Simpler Counter-Current Theory 5 C. The Turbulent-Viscosity Theory • • • 6 D. Work Done in the U. S. S. R. • • • 6
IV. EXPERlllENTAL STUDIES OF A PNEUMATIC BREAKWATER • • • • • 7 A. Experimental Facilities • • • • · • · · · • 7 B. Experimental Results • · · • • • • · • • • · • • • 8
1. Effect of Wave Length and Water Depth • 8 2. Effect of Submergence • · • • • • • • • • 9 3. Effect of ~Iave Steepne ss • • • • • • • • 9 4. Effect of Orifice Area • 10 5. Effect of the Number and Spacing of Manifolds • 10 6. Comparison with Other Data • • • · • II 7. Scale Effect • • · · • • • • • · II 8. Velocity Profiles • • • • • • 12 9. Intermittent Bubbles • • • • • • • • • • · • 13
C. Summary--Pneumatic Breakwater Tests • • • • • • 13
V. EXPERIMENTAL STUDIES OF HYDRAULIC BREAKWATERS • 14 A. General Comments • • • • • · • • • • • • • • • 14 B. Experimental Results • • · • · · · • · • • • • • 15
1. Effect of Wave Length and Water Depth • 15 2. Effect of 1-lave Steepness · • • • • • • • • 15 3. Effect of Jet Submergence • • • 16 4. Effect of Jet Area • • • • 16 5. Efficiency • • • • • • · • • • • 17 6. Scale Effect • · • • • • 17
C. Summary Curves • • • • • • • • 18 D. Conclusions--HYdraulic Breakwater • • 18
VI. APPLICATION OF BREAKWATER DATA TO A TYPICAL PROBLEM • · • • • 20
List of References . • • • • • · • • • • 23 Figures 1 through 30 • • • • • • • • • • · • • • 27
ix
Figure
Frontispieces . " .. . .. " .. .. .. .. .. .. .. .. .. .. .. .. .. .. .. 1 Qualitative Pattern of Surface
Bubbles. Pneumatic Breakwater · . . 2
3
4 5 6
7
8
9
10
II
12
13
14 15
16
17
18
19
20
21
22
23
Solution for Taylor's Theory for Velocity Distribution in Surface
both ~= an:! Jic:muniform
View of Small Wave Channel •
View of Large Wave Channel
Current.. • ..
. . Sketch of Test Setup in the Small Channe' ..
•
• • •
• Sketch of Test Setup in the Large Channe
Effect of Wave Length on Air 1)isc:bar1ll" (d = 1.0 ft). Pneumatic Breakl<at.er •• .. .. .. .. .. .. .. .. Effect of Wave Length on Air Dis~£8 (d = 4.5 ft). Pneumatic 3reakwatc::- • • • .. .. .. .. · . . Horsepower Ratio as a Function of ~ -.~~~~ • Q.
Pneumatic Breakwater.. ............ .. .. ..
Relative Horsepower as a Functicc o! S-2~::(l=:e. matic Breakwater .. .. .. .. .. .. .. .. .. .. .. · . . .
· . . . Effect of j'lave Steepness. Pne1ll:atic
Effect of Orifice Diameter. Pr.e=tie
Comparative Performance of Single Pneumatic Breakwater .. .. .. .. .. .. ..
!o:.ds. . . . . . . . Effect of Manifold Spacing. Pnet!ll3ti: E':1w~ter
Comparison with Data from other So'::-ce 5. I A .~t.e=.!3t' 50 per cent) Pneumatic 3reakwater • • • • • • ... Velocity Distribution in Surface c.rrenz. Poe Breakwater .. .. .. .. .. .. .. .. .. .. .. .. .. .. · . Surface Current Velocity as a FnncZ::'on or ..: ~scbarge. Pneumat ic Breakwater .. .. .. .. .. .. .. .. .. .. .. .. .. .. .. .. .. ..
Horsepower Ratio as a Function c! Leng- -t.c-~
draulic Breakwater .. .. .. .. .. .. .. .. .. .. .. .. .. .. .. ..
Horsep(mer Ratio as a Function o! iiave S:.ee;:zx draulic Breakwater .. .. .. .. .. .. .. .. . .. .. .. .. ..
Ba.tio.
· .
· . .
· . . · . . · . .
Hy-
Effect of Jet Submergence on Discharge Hydraulic Breakwater .. .. .. .. .. .. .. .. .. .. .. .. .. .. .. .. .. .. .. .. Typical Graph of Horsepower and Dis~ge Ee~~~rts as a Function of Jet Area. FIyrlraulic~..er.
Efficiency as a function of ;;ave Stee;:cesa. Bre akwa ter • • •• "............
Wave Attenuation as a Function of DiscCa:~. Between Small- and Large-Scale ~ata. ~e
x
.. .. .. ..
Page
i
27
27
28
28
29
29
30
31
32
33
34 34
35 35
36
37
38
39
40
42
43
44
Figure
21.
25
26
27
28
29
30
Summary Curves--Attenuation 100 per cent. Hydraulic Breakwater • • .. .. • .. • .. • .. .. • .. .. ..
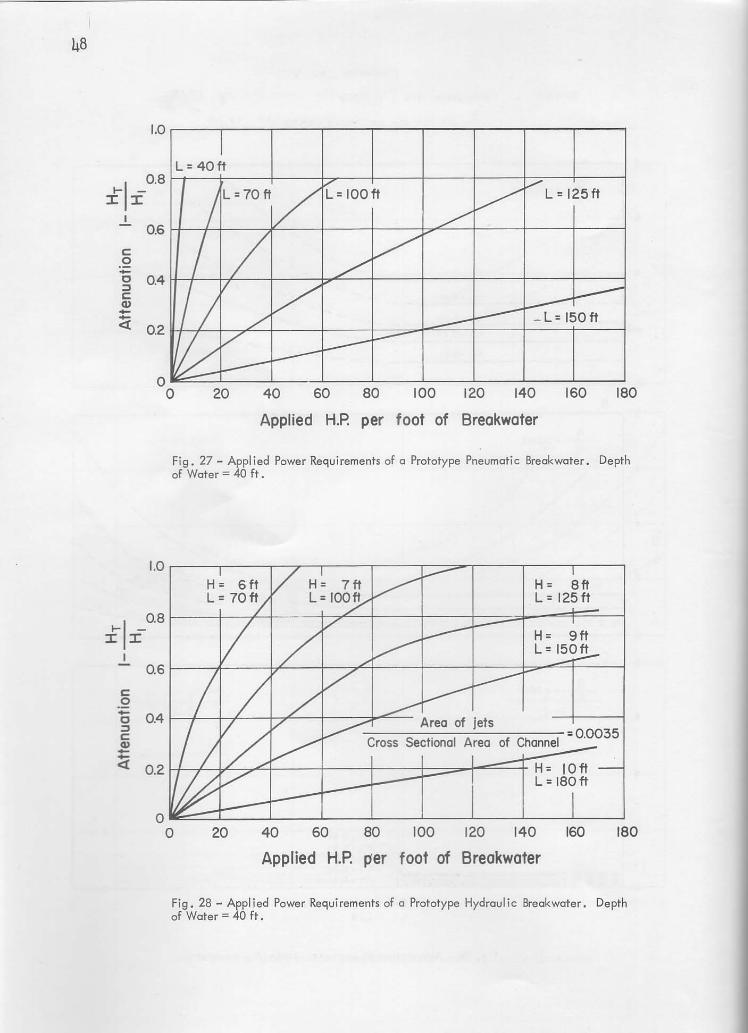
Summary Curves--Attenuation 80 per cent. Hydraulic Breakwater .. . • • . • .. .. .. • .. • . .. . .. .. .. Summary Curves--Attenuation 60 per cent. Hydraulic Br eakwater .. .. .. .. .. .. .. .. .. .. .. " .. " • " .. .. .. . .. Applied Power Requirements of a Prototype Pneumatic Breakwater. Depth of Water = 40 ft ••••••• •
•
Applied Power Requirements of a Prototype Hydraulic Breakwater. Depth of Water = 40 ft •••••••• • • Total Horsepower (Including Losses) for a Typical Proto-t ype Pneumatic Breakwater ................ .
Total Horsepower (Including Losses) for a Typical Prototype Hydraulic Breakwater .. . .. • .. .. • • • .. .. .. .. • .. •
xi
Page
45
1.6
47
48
48
49
49
LIST OF SYI1BOLS
a. - Area of jets per foot width (hydraulic breakwater). J
a - Area of channel per lineal foot of breakwater or one times the depth. c
A - Wave attenuation (1 - H.r/lI:r)' C - Have celerity.
d - Depth of water.
~ - Submergence of manifold (pneumatic breakwater).
D - Diameter of supply pipe.
E - Energy.
F - Projected area of air bubbles.
F - Froude number C/.jgd. n
g - Acceleration of gravity.
h - Thickness of surface current.
hL - Head loss in supply pipe.
H - "lave height.
HI - Incident wave height.
H.r - Transmitted wave height.
hPL - Horsepower losses in supply pipe.
k - Head loss coefficient.
L - Wave length.
p - PresslL""'G.
PI - Power in incident wave.
P. - Po,rer in hydraulic jets. J
PT
- Power in transmitted wave,
q - Discharge per foot width of breakwater.
Q - Total discharge.
I' - Ratio of energy extinguished by breakwater to the initial energy of the wave"
xii
t - Time.
U _ Velocity of the surface current.
v _ Horizontal velocity of water particles due to the orbital motion of waves.
v - Velocity in supply pipe.
w - Specific weight.
y _ Submergence of manifold (hydraulic breakwater).
z - Vertical distance measured from the water surface.
~ - Efficiency = PI - PT
Pj
1;; - Parameter in Taylor's surface current theory.
p - Density of water. hp/ft
¢ - Dimensionless horsepower ratio ------3/2 L5/2 pg
q Ijt - Dimensionless discharge ratio = ----
L ..;gd
w- Dimensionless parameter used in Taylor's theory.
xiii
EXPERIMENTA L STUDIES OF
PNEUMATIC AND HYDRAULIC BREAKWATERS
I. INTRODtx::TION
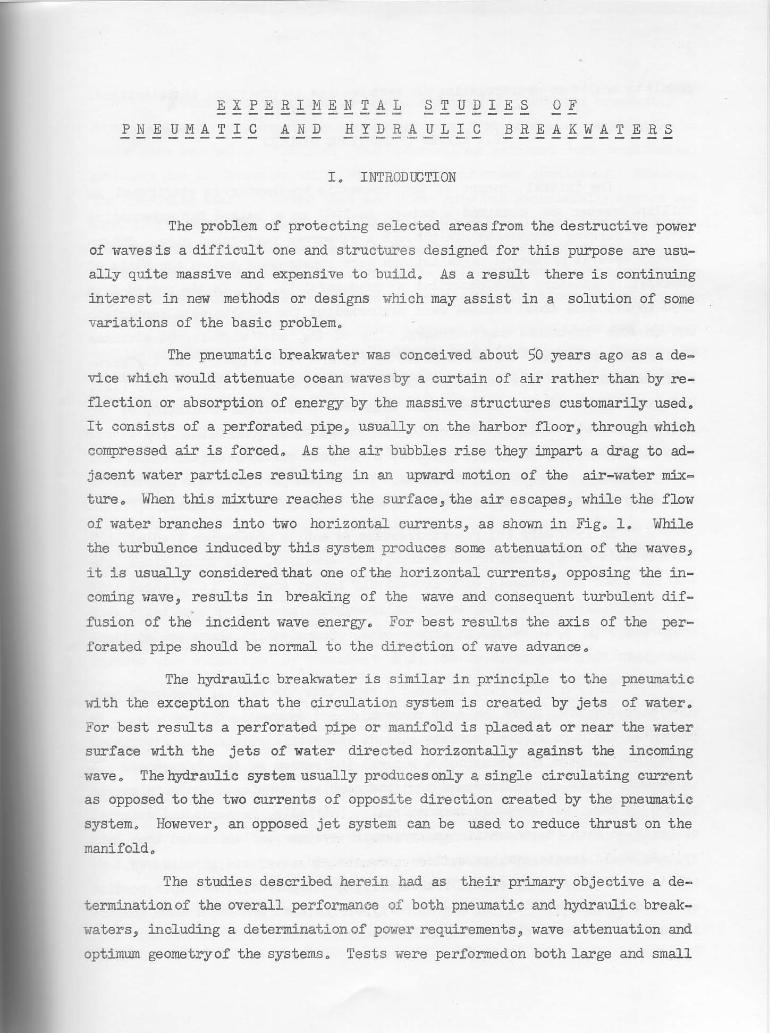
The problem of protecting selected areas from the destructive power
of wavesis a difficult one and structures designed for this purpose are usu
ally quite massive and expensive to build. As a result there is continuing
interest in new methods or designs which may assist in a solution of some
variations of the basic problem~
The pneumatic breakwater was conceived about 50 years ago as a de
vice which would attenuate ocean wavesby a curtain of air rather than by re
flection or absorption of energy by the massive structures customarily used.
It consists of a perforated pipe, usually on the harbor floor, through which
compressed air is forced. As the air bubbles rise they impart a drag to ad
jacent water particles resulting in an upward motion of the air-water mix
ture. When this mixture reaches the surface, the air escapes, while the flow
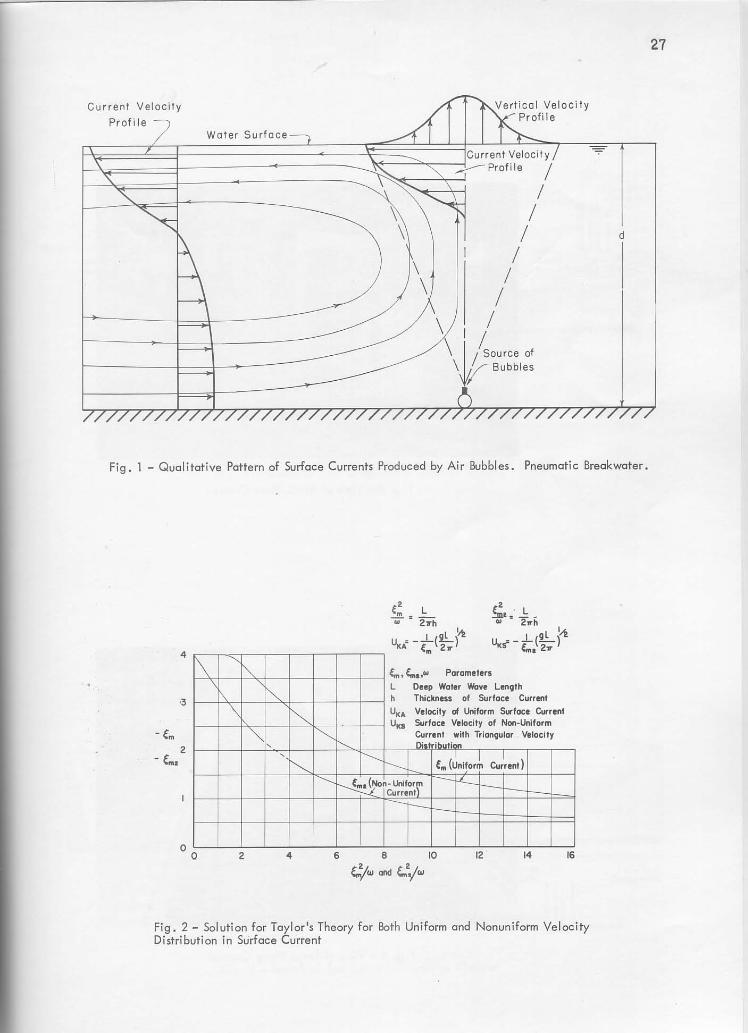
of water branches into two horizontal currents, as shown in Fig. 1. While
the turbulence inducedby this system produces some attenuation of the waves,
it is usually considered that one of the horizontal currents, opposing the in
coming wave, results in breald.ng of the wave and consequent turbulent dif
fusion of the incident wave energy. For best results the axis of the per
forated pipe should be normal to the direction of wave advance.
The hydraulic breakwater is similar in principle to the pneumatic
with the exception that the circulation system is created by jets of water.
For best results a perforated pipe or manifold is placed at or near the water
surface with the jets of water directed horizontally against the incoming
wave. The hydraulic system usually produces only a single circulating current
as opposed to the two currents of opposi te direction created by the pneumatic
system. However, an opposed jet system can be used to reduce thrust on the
manifold.
The studies described herein r~d as their primary objective a de
termination of the overall performance of both pneumatic and hydraulic break
waters, including a determination of power requirements, wave attenuation and
optimum geometryof the systems. Tests were performedon both large and small
2
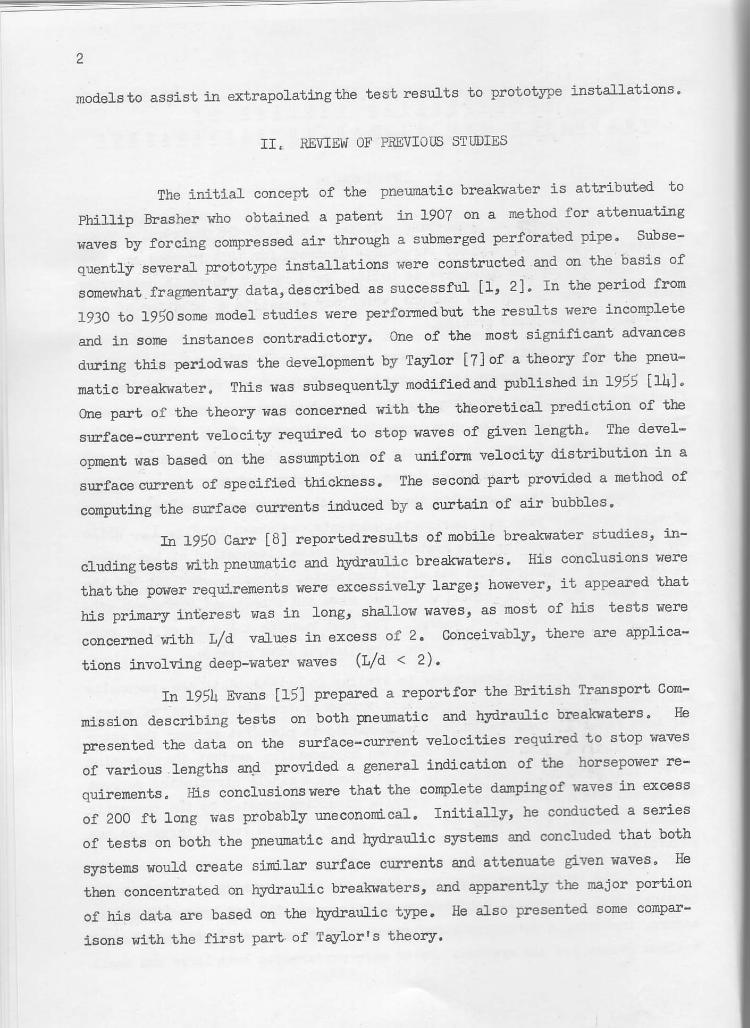
models to assist in extrapolating the test results to prototype installations.
II. REVIEW OF PREVIOUS STUDIES
The initial concept of the pneumatic breakwater is attributed to
Phillip Brasher who obtained a patent in 1907 on a method for attenuating
waves by forcing compressed air through a submerged perforated pipe. Subse
quently several prototype installations were constructed and on the basis of
somewhat fragmentary data, described as successful [1, 2J. In the period from
1930 to 1950 some model studies were performed but the results were incomplete
and in some instances contradictory. One of the most significant advances
during this period was the development by Taylor [7J of a theory for the pneu
matic breakwater . This was subsequently modified and published in 1955 [14J.
One part of the theory was concerned with the theoretical prediction of the
surface-current velocity required to stop waves of given l ength. The devel
opment was based on the assumption of a uniform velocity distribution in a
surface current of specified thickness. The second part provided a method of
computing the surface currents induced by a curtain of air bubbles.
In 1950 Carr [ 8 J reported results of mobile breakwater studies, in
cluding tests with pneumatic and hydraulic breakwaters. His conclusions were
thatthe power requirements were excessively large; however, it appeared that
his primary interest WaS in long, shallow waves, as most of his tests were
concerned with Lid values in excess of 2. Conceivably, there are applica
tions involving deep-water waves (Lid < 2).
In 1954 Evans [15J prepared a report for the British Transport Com
mission describing tests on both pneumatic and hydraulic breakwaters. He
presented the data on the surface-current velocities required to stop "aveS
of various lengths an.d provided a general indication of the horsepower re
quirements. His conclusions were that the complete damping of waves in excess
of 200 ft long was probably uneconomical. Initially, he conducted a series
of tests on both the pneumatic and hydraulic systems and concluded that both
systems would create similar surface currents and attenuate given waves. He
then concentrated on hydraulic breakwaters, and apparently the major portion
of his data are based on the hydraulic type. He also presented some compar
isons with the first part - of Taylor's theory.

3
Evans also discussed an installation of a pneumatic breakwater at
Dover, England, to protect the inner dock gate from excessive swell while an
outer gate was being repaired. The observations were not very conclusive,
probably due to formation of a standing wave or other conditions. However,
the operating staff reported that the dock gate was successfully opened and
shut by its motor onfive or six occasions in wave conditions that would have
prevented this actionif the pneumatic breakwater had not been operating. An
other source (12) reported that waves up to 4 ft high outside the breakwater
were reduced to 9 in. high by the time they reached the inner gate.
In 1954 lietzel (13) prepared a report on the results of preliminary
small-scale tests at the St. Anthony Falls Hydraulic Laboratory. Comparisons
of the results were made with Taylor 's theory and some of Carr's experimental
data.
During the period 1955-58 Kurihara [19) conducted model and proto
type tests on pneumatic breakwaters in Japan. His major conclusion was that
the mechanism of wave attenuation by the model pneumatic breakwater was due
chiefly to the surface current whereas the prototype systems were dependent
primarily on the turbulence accompanying the surface current. These obser
vations were based on the fact that better efficiencies were achieved in the
prototype when the two were compared on the hasis of Froude's law.
In 1956 the results of studies on hydraulic breakwaters at st. An
thony Falls Hydraulic Laboratory were reported by Herbich et al [20]; these
results were summarized by Straub et al in the Proceedings of the Sixth Con
ference on Coastal Engineering [ 25], and are also included in this report.
In 1957-58 several reports were issued on studies performed at the
University of California. Snyder [22] reported the results of studies on hy
draulic breakwaters in a water depth of 1 ft. The results are in general a
greement with those obtained at t he St. Anthony Falls Hydraulic Laboratory
(20), with the exception of the effect of wave steepness. Snyder concluded
that performance did not vary with wave steepness but the narrow range cov
ered by his stUdies (H/L = 0.047 to 0.068) appears inadequate for an eval
uation of this effect. Snyder [24] also studied the performance of the hy
draulic breakwater when located over a submerged reef; this geometry resulted
in a substantial improvement in performance.
4
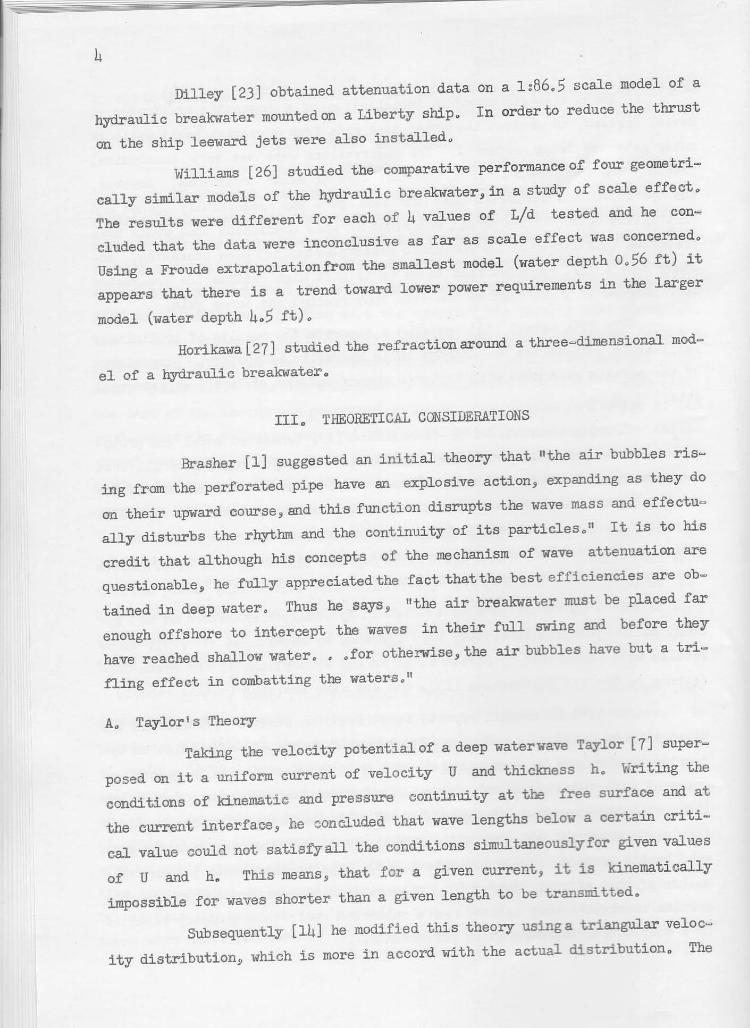
Dilley [23] obtained attenuation data on a 1:86.5 scale model of a
hydraulic breakwater mounted on a Liberty ship. In order to reduce the thrust
on the ship leeward jets were also installed.
Williams [26] studied the comparative performance of four geometri
cally similar models of the hydraulic breakwater, in a study of scale effect.
The results were different for each of 4 values of Lid tested and he con
cluded that the data were inconclusive as far as scale effect was concerned.
Using a Froude extrapolation from the smallest model (water depth 0.56 ft) it
appears that there is a trend toward lower power requirements in the larger
model (water depth 4.5 ft).
Horikawa[27] studied the refraction around a three-dimensional mod
el of a hydraulic breakwater.
III. THEORETICAL CONSIDERATIONS
Brasher [1] suggested an initial theory that "the air bubbles ris
ing from the perforated pipe have an explosive action, expanding as they do
an their upward course, and this f1Ulction disrupts the wave mass and effe ctu
ally disturbs the rhythm and the continuity of its particles." It is to his
credit that although his concepts of the mechanism of wave attenuation are
questionable, he fully appreciated the fact that the best efficiencies are ob
tained in deep water. Thus he says, "the air breakwater must be placed far
enough offshore to intercept the waves in their full swing and before they
have reached shallow water ••• for otherwise,the air bubbles have but a tri
fling effect in combatting the waters."
A. Taylor ' s Theory
Taking the velocity potential of a deep water wave Taylor [71 super
pos<ld on it a uniform current of velocity U and thiclmess h . Writing the
conditions of kinematic and pressure continuity at the free surface and at
the current interface, he concluded that wave lengths below a certain criti
cal value could not satisf'yall the conditions simultaneously for given values
of U and h. This means, that for a given current, it is kinematically
impossible for waves shorter than a given length to be transmitted.
Subsequently [14] he modified this theory usinga triangular veloc
ity distribution, which is more in accord with the actual distribution. The

5
results of both methods are shown in Fig. 2. Using these curves one can de
termine the maximum wave length that can be attenuated by a current of veloc
ity U and thickness h, or alternatively the current velocity required
to attenuate a given wave.
In order to relate the velocity and thicknessof the current to the
air discharge and the submergence of the perforated pipe, Taylor used Schmidt IS
analogous
of heat.
solution for the convective currents above a horizontal line source
Schmidt showed that the heated zone was a wedge of half angle tan- l
0.28. Assuming that this appliesto the case of the pneumatic breakwater, the
half width of the current would be 0 .28~ where ~ is the submergence of
the perforated pipe. At the free surface, the current turns through 90 de
grees; therefore at this point the depth of the current would be O. 28~ •
By the same analogy the maximum velocity U of the current is giv-
en by
U ~ 1.9 (qg)1/3 (1)
,.here q air discharge per unit width, and the constant 1.9 is dimension
less"
It is seen therefore that the thickness of the current depends sole
lyon the submergence. Thus for attenuating longer waves, where a deeper
current is necessary, an increased submergence is desirable. However, it
should be borne in mind that this entails larger power requirements, the pow_
er being diPectly proportional to the depth at which the bubbles .are released.
In addition, there is the factor of 'Velocity offusion, i.e., for a given
discharge the greater the submergence , the smaller willbe the current veloc
i ty at the surface.
B. A Simpler Counter-Current Theory
In 1942 Unna [6] provided an explanation for the increase in wave
height in a tidal estuarY. When the waves run into a counter-current, tbe
relative velocity of propagation and hence the wave length are reduced. Since
the rate of energy transfer across a given plane must remain a constant, the
wave height must increase.

6
Evans [10] extended this to breakwater studies, contending that the
current created by a pneumatic or hydraulic breakwater increased the wave
steepness to breaking point, thus causing the wave to dissipate its energy
in the ensuing turbulence.
C. The Turbulent-Viscosity Theory
Since 1952, a theoretical and experimental studyhas been under way
in Japan, under M. Kurihara [19]. The experilnental work in the Laboratory
was extended to include three full-scale tests of the pneumatic breakwater.
It was found that the full-scale experiments required much less power than
would be expected from a Froude extrapolation of the model data. The power
requirements were also much below those predicted by Taylor's theory. Kuri
hara was therefore led to propound the "turbulent viSCOSity" theory.
He concluded from his data that while the counter current was only
partially responsible, the attenuation of the wave was also due to the tur
bulent Reynolds stresses setup by the disturbance of the breakwater. In the
model where the scale is small, the counter-current effect dominates, while
on the large scale the "turbulent viscosity" is mainly responsible for atten
uating the wave motion.
It should be mentioned here that theories dealingwith the stopping
action of the current or dissipation of the wave due to turbulence in the cur
rent are basically also applicable to the hydraulic breakwater, since only the
mechanism of generating the current is different.
D. Work Done in the U. S. S. R.
In 1954 Teplov [11] published a summary of the work done in the U. S. S. R. on pneumatic breakwaters, and a translation of this paper has re
cently become available. His theory will be briefly mentioned here.
Due to a wave motion, the pressure at a given depth fluctuates a
bout a mean. Teplov assumes that this fluctuating pressure does work on the
rising bubbles, and the wave energy is thus expended. He assumes that the
air bubbles oscillate horizontally with the same velocity as the adjoining
water particles. Then the rate of energy dissipation dE/dt is given by
dE
dt

where
charge
7
P is the local pressure,
v is the local horizontal velocity, and
dF is the projection of the air bubbles at a depth z for an element
of area width unity and height dz.
On this basis he obtains a formula for q, the required air dis-
q 1 - r
where q is in m3/min/m,
r is the ratio of energy extinguished to the ini tial energy, and the
constant 0.03 is determined experimentally.
Alternatively in terms of the attenuation A
q 0.03 A(2 - A)
(1 _ A)2
The result is immediately seen to be fallacious , in that the air
requirement depends solely on the desired attenuation and is entirely inde
pendentof the scale of the breakwater. A closer inspection reveals the faulty
reasoning. If the bubbles oscillate with the same velocityas the neighboring
water particles, then the work done on the bubbles is actually zero and not
as stipulated by Teplov.
IV. EXPERIMENTAL STUDIES OF A PNEUMATIC BREAKrIATER
A. Experimental Facilities
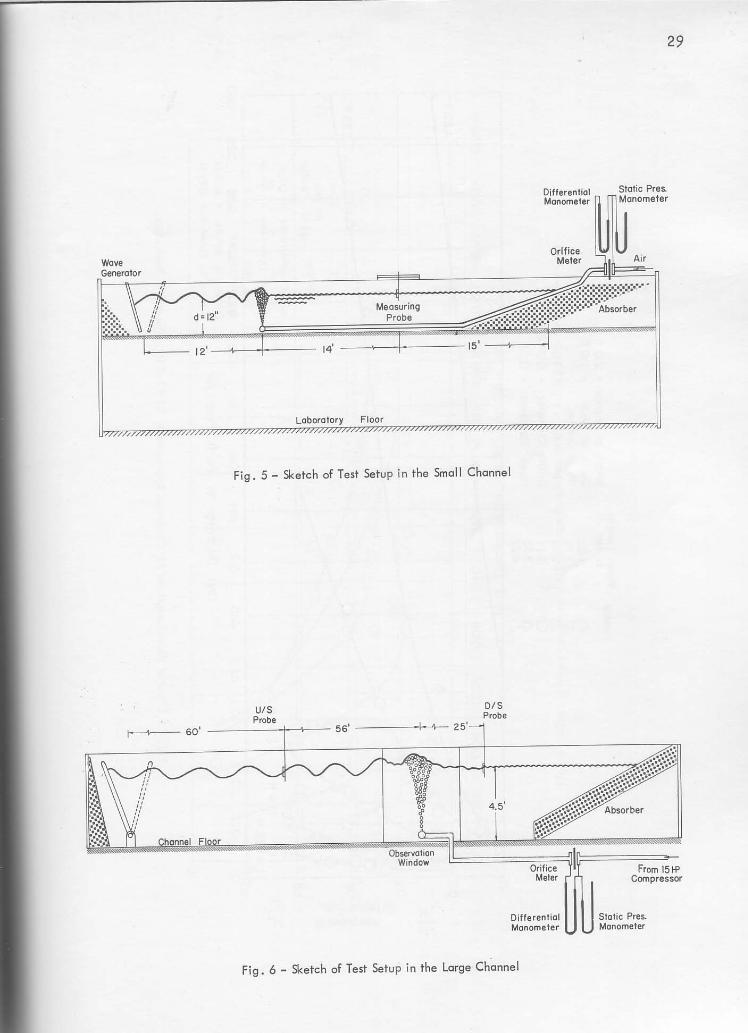
The experimental work was performed in two wave channels, which for
all practical purposes were geometrically similar. The small channel is 2 ft
wide, 1 ft 3 in. deep, and50 ft long (fig. 3). It is equipped with a pendu
lum-type wave generator capable of producing waves up to 10 ft long and with
amaximlIDl height of5 inches. Thewater depth was maintained at 1 ft throughout
the tests.
The large wave channelis 9 ft wide, 6 ft deep and 253 f t long (fig.
4), and is equipped with a hinged-plate generator capable of producing waves
8
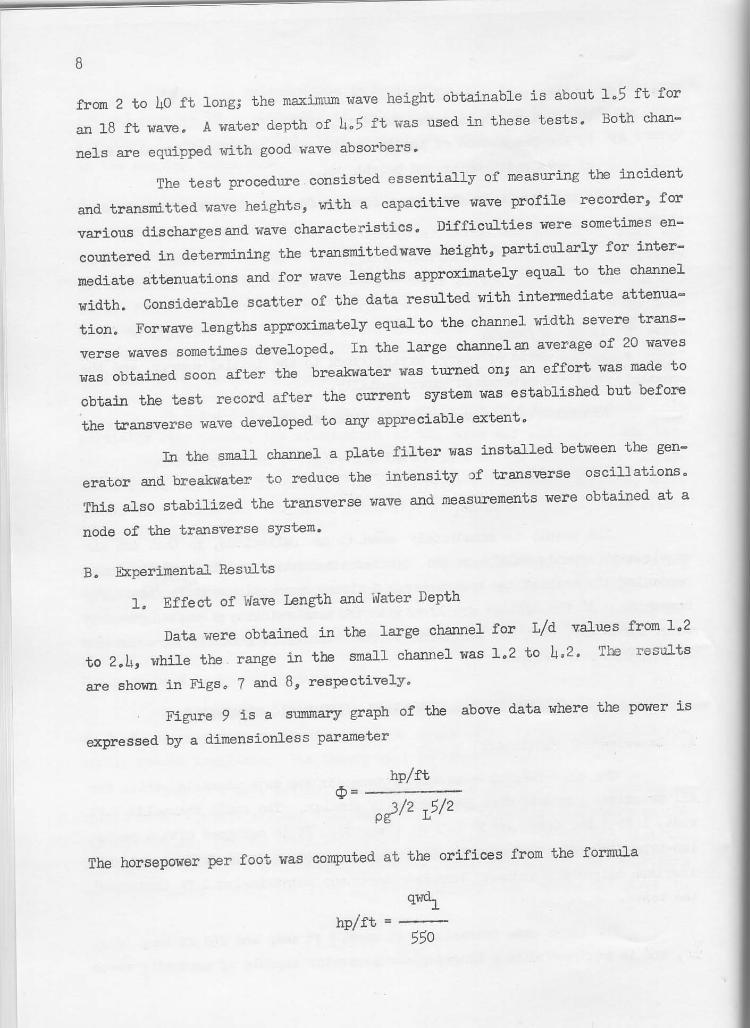
from 2 to 40 ft long; the maximum wave height obtainable is about 1.5 ft for
an 18 ft wave. A water depth of 4.5 ft was used in these tests. Both chan
nels are equipped with good wave absorbers.
The test procedure consisted essentially of measuring the incident
and transmitted wave heights, with a capacitive wave profile recorder, for
various discharges and wave characteristics. Difficulties were sometimes en
countered in determining the transmitted wave height, particularly for inter
mediate attenuations and for wave lengths approximately equal to the channel
width. Considerable scatter of the data resulted with intermediate attenua
tion. Forwave lengths approximately equal to the channel width severe trans
verse waves sometimes developed. In the large channel an average of 20 waves
was obtained soon after the breakwater was turned on; an effort was made to
obtain the test record after the current system was established but before
the transverse wave developed to any appreciable extent.
In the small channel a plate filter was installed between the gen
erator and breakwater t o reduce the intensity of transverse oscill ations.
This also stabilized the transverse wave and measurements were obtained at a
node of the transverse system.
B. Experimental Results
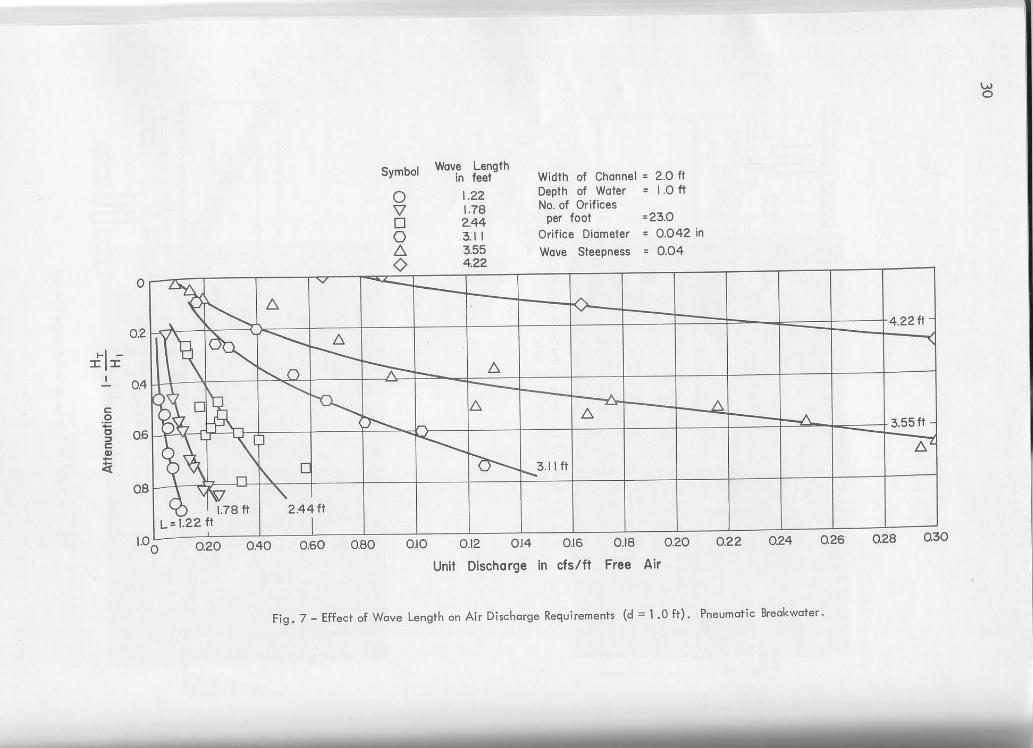
1. Effe ct of Wave Length and l,ater Depth
Data were obtained in the large channel for L!d values from 1.2
to 2.4, while the range in the small channel was 1.2 to 4.2. The results
are shown in Figs. 7 and 8, respectively.
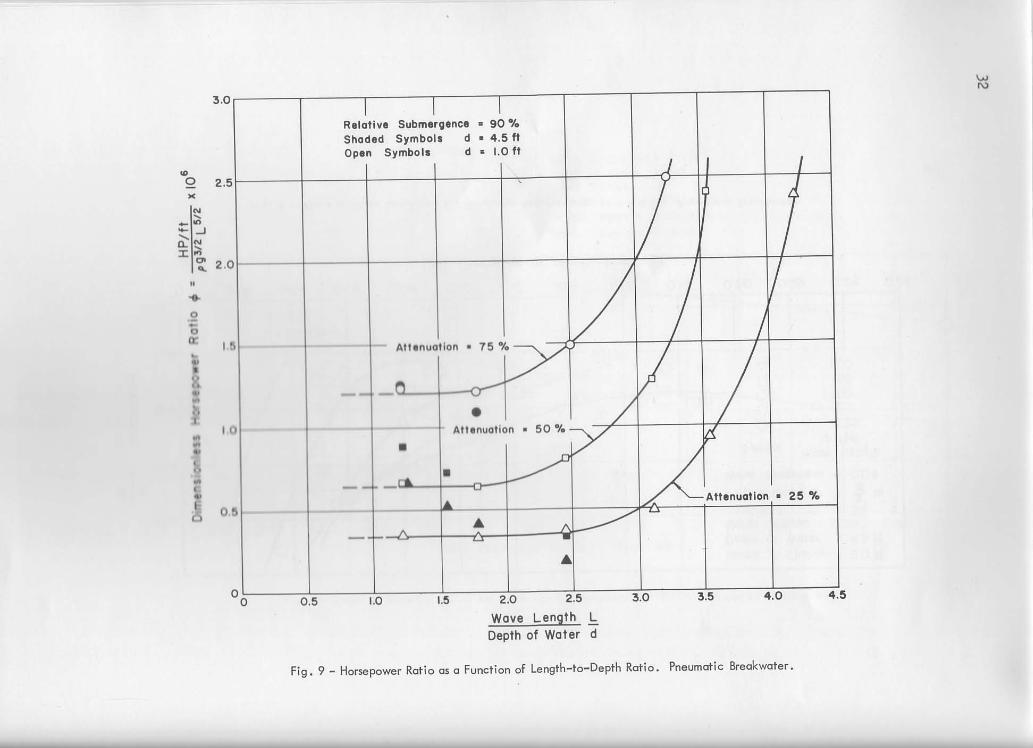
Figure 9 is a summary graph of the above data where the power is
expressed by a dimensionless parameter
hp!ft cP=----
pg}!2 L5!2
The horsepower per foot was computed at the orifices from the formula
hp!ft =
9
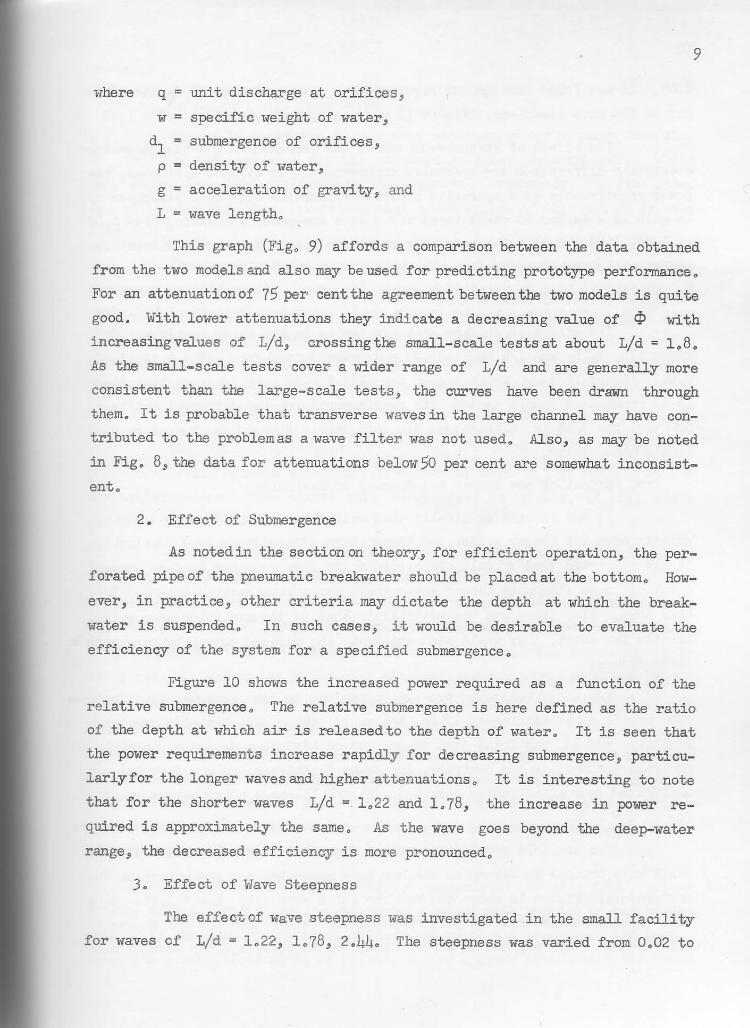
where q = unit discharge at orifices,
w= specific weight of >Tater,
dl
submergence of orifices,
p density of water,
g acceleration of gravity, and
L = wave length.
This graph (Fig. 9) affords a comparison between the data obtained
from the t>TO models and also may be used for predicting prototype performance.
For an attenuation of 7$ per cent the agreement between the two models is quite
good. With lower attenuations they indicate a decreasing value of <P with
increasing values of Lid, crossing the small-scale tests at about Lid = 1.8.
As the small-scale tests cover a wider range of Lid and are generally more
consistent than the large-scale tests, the curves have been drawn through
them. It is probable that transverse waves in the large channel may have con
tributed to the problemas a wave filter was not used. Also, as may be noted
in Fig. 8, the data for attenuations below$O per cent are somewhat inconsist-
ento
2. Effect of Submergence
As noted in the section on theory, for efficient oper ation, the per
forated pipe of the pneumatic breakwater should be placed at the bottom. How
ever, in practice, other criteria may dictate the depth at which the break
water is suspended. In Buch cases, it would be desirable to evaluate the
efficiency of the system for a specified submergence.
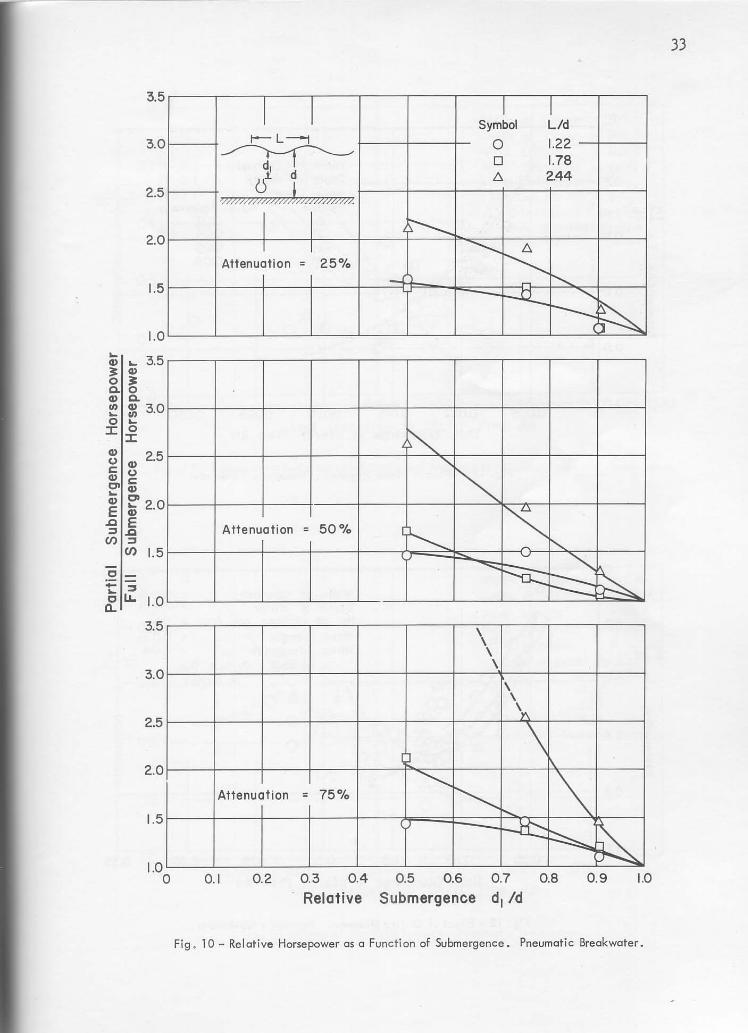
Figure 10 shows the increased power required as a function of the
relative submergence. The relative submergence is here defined as the ratio
of the depth at which air is released to the depth of water. It is seen that
the power requirements increase rapidly for decreasing submergence, particu-
larlyfor the longer wavesand higher attenuations.
that for the shorter waves Lid = 1.22 and 1.78,
It is interesting to note
the
quired is approximately the same. As the wave goes
range, the decreased efficiency is more pronounced.
3. Effect of Wave Steepness
increase in power re
beyond the deep-water
The effect of Wave steepness was investigated in the small facility
for waves of Lid = 1.22, 1.78, 2.44. The steepness was varied from 0.02 to
§
10
0.08. It was fOillld thatthe air required for a given attenuation is independ
ent of the wave steepness. Figure 11 shows a typical plot for Lid = 1.78.
The effect of steepness is one of the aspects in which the pneumatic
breakwater differsi'rom its hydraulic COilllterpart. As will be mentioned, the
power requirements of a hydraulic breakwater increase with wave steepness by
as much as a factor of about three for a wave steepness increasing from 0.02
to 0.08 (Lid = 3.3). Thismakes the pneumatic breakwater more efficient for
the waves of higher steepness.
4. Effect of Orifice Area
The effect of orifice area was tested in ,the large facility. Ori
fices 1/8, 3/16, and 1/4 inches in diameter were tested for Lid = 1.22, 1.78,
2.44. Figure 12 is a typical plot for Lid = 1 .78. It is seen that there
is no pronounced change in the air requirements for the different orifices.
However, the 3/16-in. orifice gave the most stable flowand was therefore used
in all other tests.
S. Effect of the NUJIlber and Spacing of Manifolds
It was thought originally that multiple-manifold systems would be
advantageous for longer waves, and where high attenuations were desirable.
It was suggested that a multiple system might give a deeper surface current
enabling it to attenuate longer waveS where the orbital motion extended far
ther down. Also there was the possibility that, if the manifolds were suffi
cienUy far apart, they would each attenuate the wave and thus gi va very high
attenuations 0
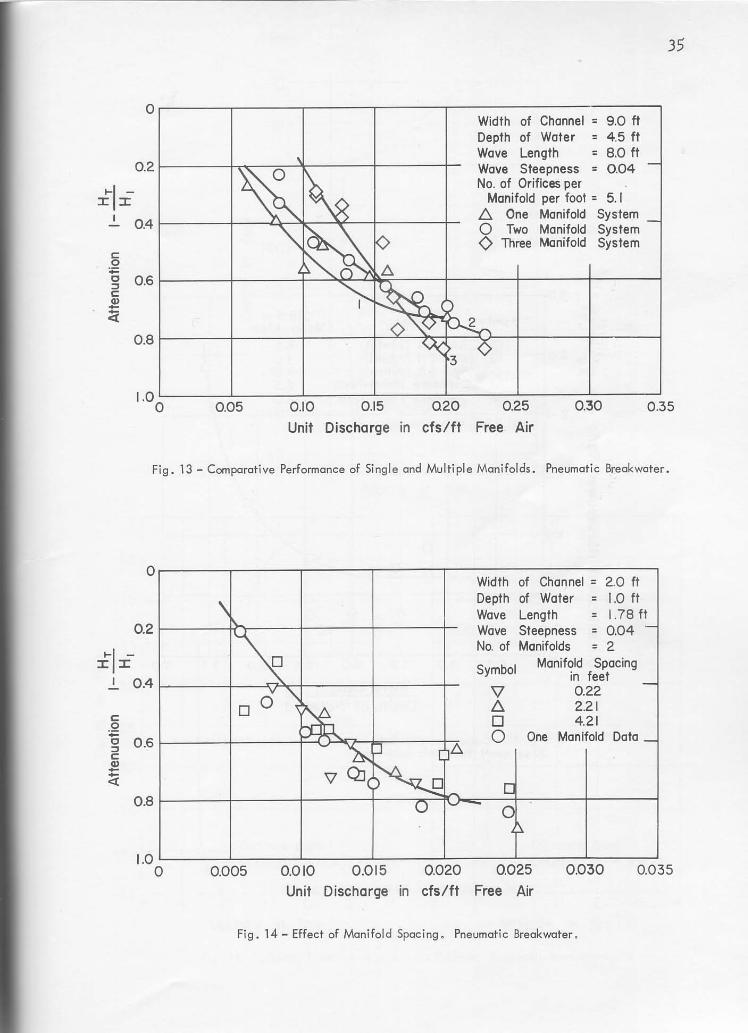
The above reasoning was not borne out by the experiments. Up to
four manifolds at spacings of 12 in. center to center were tested in the large
facility, and it was found that there was no advantage to using multiple
manifold systems. On the contrary, for lower discharges the air flow was not
uniform and poor efficiencies resulted. Figure 13 shows a typical set of data
for Lid = 1.78.
The manifold spacing was varied for a two-manifold system in the
small wave channel to determine whether this parameter had any effect on the
performance. Figure 14 shows the results for a Wave with Lid = 1. 78. Once
more it is apparent that the performance is no better than for the one-mani
fold system. For higher values of Lid, up to 3.11, similar results were
11
obtained.
6. Comparison with Other Data
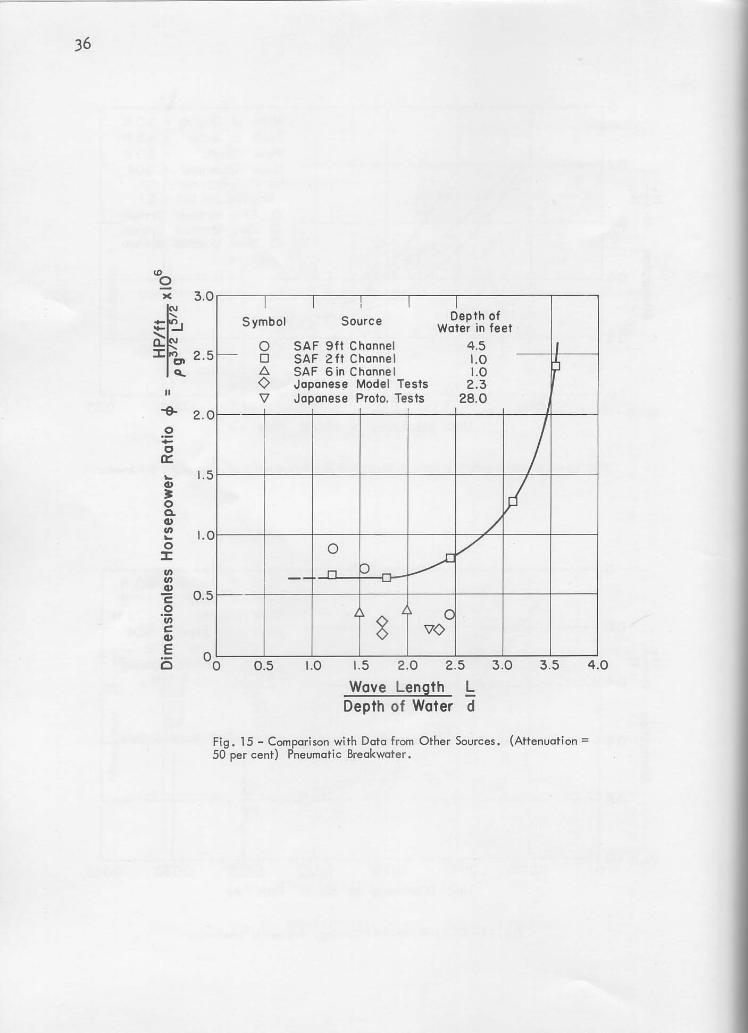
Figure 15 shows the 50 per cent attenuation curve taken from Fig.
9. This is compared with re sul ts obtained by other experimenters. While
many papers have been published on the pneumatic breakwater, the data given
are so limited and often incomplete 'that a comparison of this nature is very
difficult.
The Japanese model experiments [18] and one prototype measurement
are shown on this graph. Some .small-scale data taken at this Laboratory and
published in Project Report No. 46 are also shown for comparison. It is seen
that the horsepower ratio for all the compared data is about 50 per cent less
than that reported herein. This may be due in part to different methods of
measuring the attenuated wave and to the effect of transverse waves.
7. Scale Effect
The dimensionless plot of cP vs Lid shown in Fig. 9 indicates
good correlation between data taken in depths of waterof 1 ft and 4.5 ft for
high attenuations. Thus wi thin this range there is little, if any, scale
effect.
If the Froude law relating the model to the prototype holds valid,
the value of cP should be unchanged for a given value of Lid . Very few
prototype tests have been conducted, and even among these muchof the data is
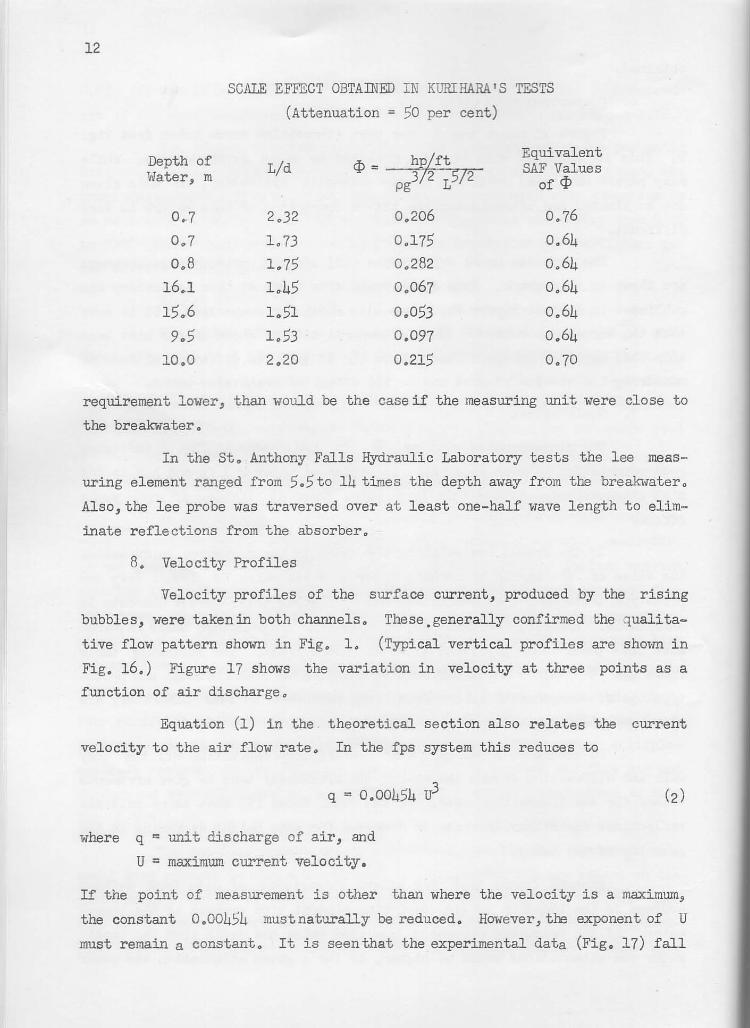
unreliable. However, Kurihara [19] reported that his prototype tests required
much less power than predicted from the model tests. The following table
shows the cP values for 50 per cent attel).uationfor both his model and proto
type tests. Comparative values from tests performed at this Laboratory are
also tabulated.
It should be noted here that factors like reflection off the quay
wall and diffraction around the endsof the breakwater tend to give erroneous
values for the transmitted wave. It has been shown [9] that these multiple
reflections can either increase or decrease the wave height depending on the
geometry of the setup.
Another factor that may affect comparisons of data i'.rom various
sources is the location of the measuring element with respect to the break
water. If the measuring element is less than twice the depth from the break
water the attenuations would be higher, or for a given attenuation the power
12
SCALE EFFECT OBTAINED IN KURIHARA'S TESTS
(Attenuation = 50 per cent)
Depth of q, _ hplft Equivalent
Lid SAF Values Water, m - -372 L5/2 of q, pg
0.7 2.32 0.206 0.76
0.7 1.73 0,175 0,64
0.8 1.75 0,282 0,64
16.1 1.45 0,067 0,64
15.6 1.51 0.053 0,64
9.5 1.53 0.097 0.64
10.0 2.20 0.215 0.70
requirement lower, than would be the caseif the measuring unit were close to
the breakwater.
In the St. Anthony Falls Hydraulic Laboratory tests the lee meas
uring element ranged from 5.5to 14 times the depth away from the breakwater.
Also,the lee probe waS traversed over at least one-half wave length to elim
inate reflections from the absorber.
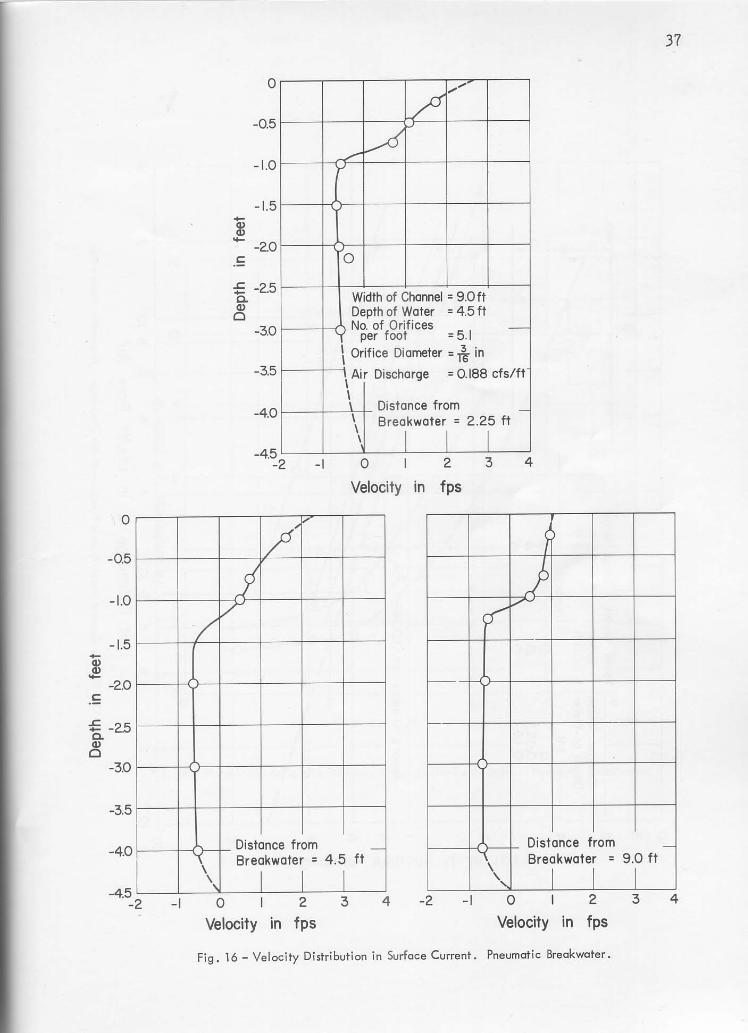
8. Velocity Profiles
Velocity profiles of the surface current, produced by the rising
bubbles, were takenin both channels. These,generally confirmed ohe qualita
tive flow pattern shown in Fig, 1. (Typical vertical profiles are shmm in
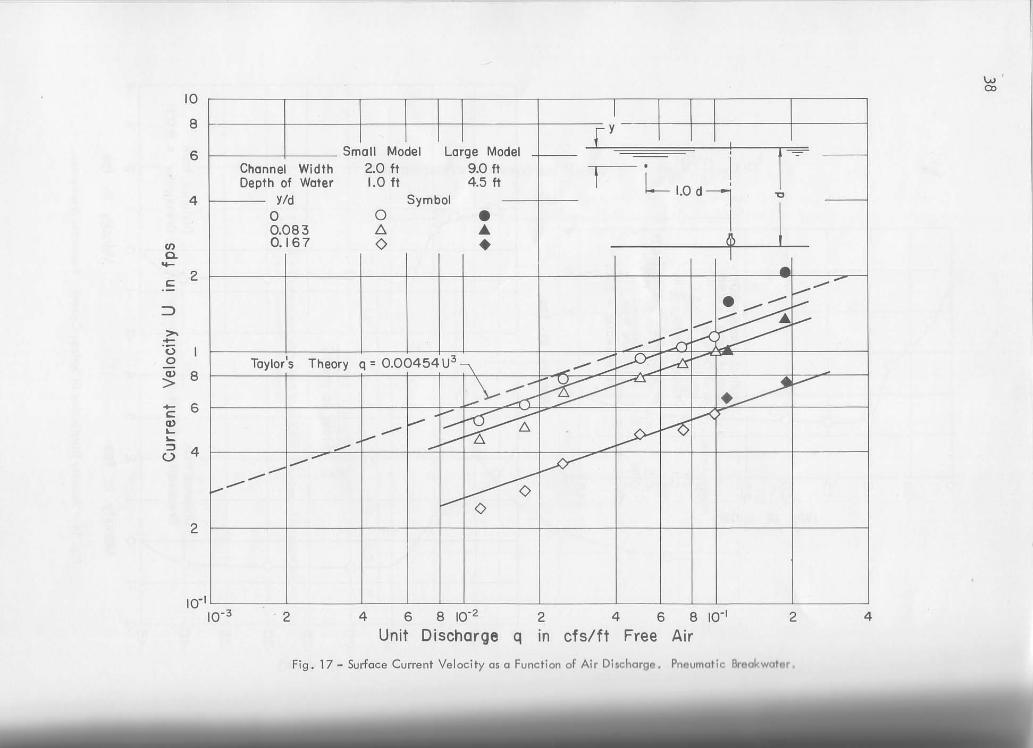
Fig, 16.) Figure 17 shows the variation in velocity at three pOints as a
function of air discharge.
Equation (1) in the theoretical section also relates the current
velocity to the air flow rate. In the fps system this reduces to
q = 0.00454 u3
where q = unit discharge of air, and
U = maximum current velocity.
If the point of measurement is other than where the velocity is a maximum,
the constant 0.00454 must naturally be reduced. However, the exponent of U
must remain a constant. It is seen that the experimental data (Fig. 17) fall
13
parallel to the theoretical line. The values of the velocity at the water
surface were obtained by extrapolating the velocity profiles. The latter
points fall quite close to the Taylor values. It may thus be said that the
maximum velocity measured one water depth from the breakwater is in good con
formity with Taylor's theory.
9. Intermittent Bubbles
A device for releasing bubbles intermittently and thereby saving
power was tested in the prototype scale at Dover, England [27]. Briefly, the
purpose was to generate a zone of turbulence through which the wave s would
pass and be attenuated.
Such a device was tested very briefly in the small channel and it
was found that there WaS no particular advantage in using an intermittent
stream of bubbles. Details of the construction of the Dover installation
were not available, so the tests were not necessarily an evaluation of the
Dover installation.
C. SUIIlmary--Pneumatic Breakwater Tests
The primary observations and conclusions resulting from the tests
of pneumatic breakwaters are as follows:
(1) The dimensionless horsepower ratio
hp/ft ¢ =----
3/2 L5/2 pg
is the parameter giving the requirements of the pneumat
ic breakwater. The value of ¢ depends oulyon the wave
length, depth of water, and the submergence of the mani
fold. Figures 9 and 10 illustrate the variation of ¢
with these parameters and may be usedfor design purposes.
(2) For L/d < 2, ¢ is a constant for a given attenuation.
When L/d exceeds 2, ¢ increases rapidly to the point
where the breakwater is no longer very effective.
(3) The breakwater is most efficient when the manifold is
placed at the bottom. For decreasing submergence, the
14
value of ¢ increases.
(4) The power requirements are independent of wave steepness.
(5) The orifice diameteris not an important parameter. How
ever, if too large, the air flow is unstable, and if too
small, the head loss is too large.
(6) There is no particular advantage to using multiple-mani
fold systems. On the contrary, the flow tends to be U!l
stable for low discharges.
(7) The power requirements for pneumatic and hydraulic break
waters are much the same for equal attenuations, except
that the pneumatic system cannot achieve more than 80 per
cent attenuation o
(8) No appreciable scale effect was observed between models
having a length ratio of 4.5:1. However, a few full-scale
tests conducted in Japan indicate greater efficiency in
the prototype. This needs further confirmation before
any conclusions are drawn.
V. EXPERIMENTAL STUDIES OF HYDRAULIC BREAKWATERS
A. General Comments
Experimental studies of hydraulic breakwaters were performed prior
to the studies of the pneumatic system and have been described in earlier re
ports [20, 25], The results are summarized in this paperto assist the reader
in comparisons of the two systems.
The major part of the program involved two-dimensional tests with
a single manifold, in the same channel s used in the pneumatic tests. Test
procedures were also similar.
The primary objectivewas the procurement of information concerning
the effect of various parameters on wave attenuation, which is defined as
1 - ~/~ (~= incident wave height and ~ = transmitted wave height).
Parameters which were varied include the wave length L, the wave height H,
jet submergence y, jet area a., and jet discharge q. The horsepower and J
discharge required under various test conditions were expressed in the form
of dima~sionless ratios as follows :
Horsepower per lineal foot of breakwater <p; --------------
3/2 L.5/2 pg
Discharge per lineal foot of breakwater
~ = ---------------L Jgd
1.5
where <P is the dimensionless power ratio, ~ is the dimensionless dis
charge ratio, p is the density of water in slugs per cubic foot, g is the
acceleration due tc gravity in feet per second per second, and d is the
water depth.
The horsepower was normally computed at the jets; for design pur
poses it would be necessary to add losses in the supply lines and manifold.
Equipment and procedures used in these tests were essentially the
same as those for the pneumatic breakwater tests.
B. Experimental Results
The data indicated that the power requirements of a hydraulic break
water are primarily dependent upon wave length, water depth, wave steepness,
submergence of the nozzles, spacing and size (or area) of nozzles , and the
number of manifolds.
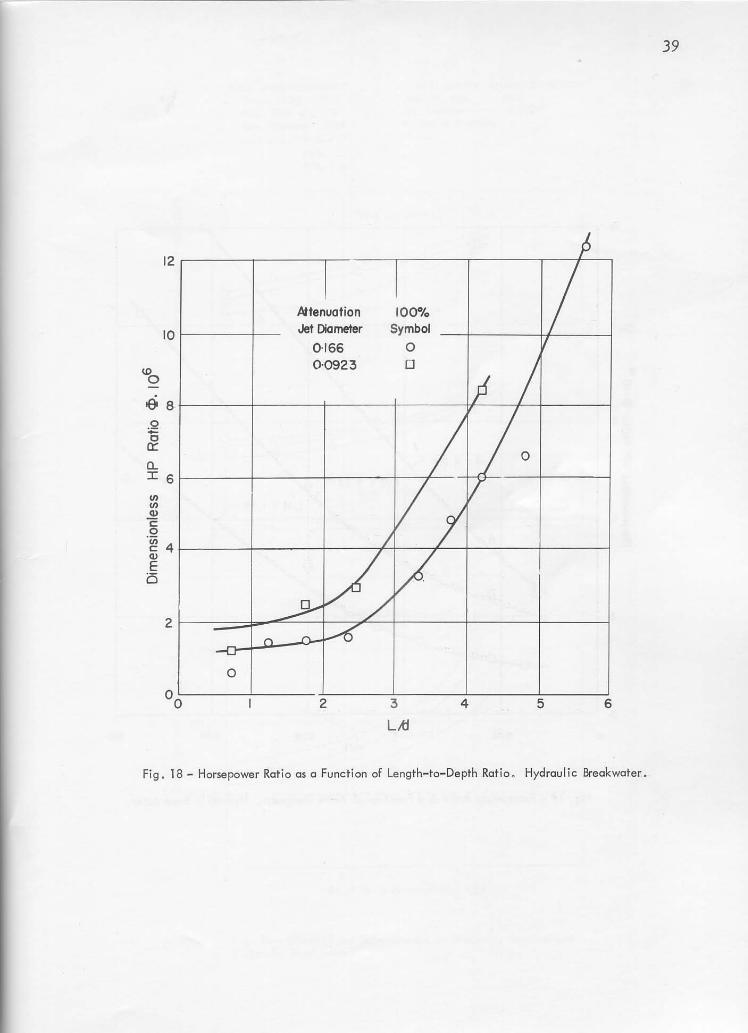
I. Effect of Wave Length and Water Depth
Experimentaldata were obtained in the large channel for Lid values
up to about 4.2 and in the small channel up to .5.6. Considerable scatter oc
curredfor values less than 1.0. Excluding these values, it appears that <P, the horsepower ratio,is fairly constant for Lid values up to about 2.0 and
that it increases quite rapidly for Lid values in excess of 2.0. Figure
18 illustrates typical data for an attenuation of 100 per cent, In this in
stance the power requirements for a single manifold increase by a factor of
7 as the Lid value i s increased from 2.0 to .5,0,
2, Effect of Wave Steepness
Wave steepness has an important effect on power requirements. fig
ure 19 presents typical dat~ for three Lid values based on the small-scale
tests. Considering the curve for a Lid value of 3.33, it maybe noted that
16
for an increase in wave steepness from 0.02 to 0.08, a factor of 4, the re
qull-ed horsepower ratio <P is increased by a factor of about 3. However,
the true efficiency, that is, the ratio of attenuated wave energy to the jet
energy, is considerably higher for the steep waves than itis for the shallow
waves 0
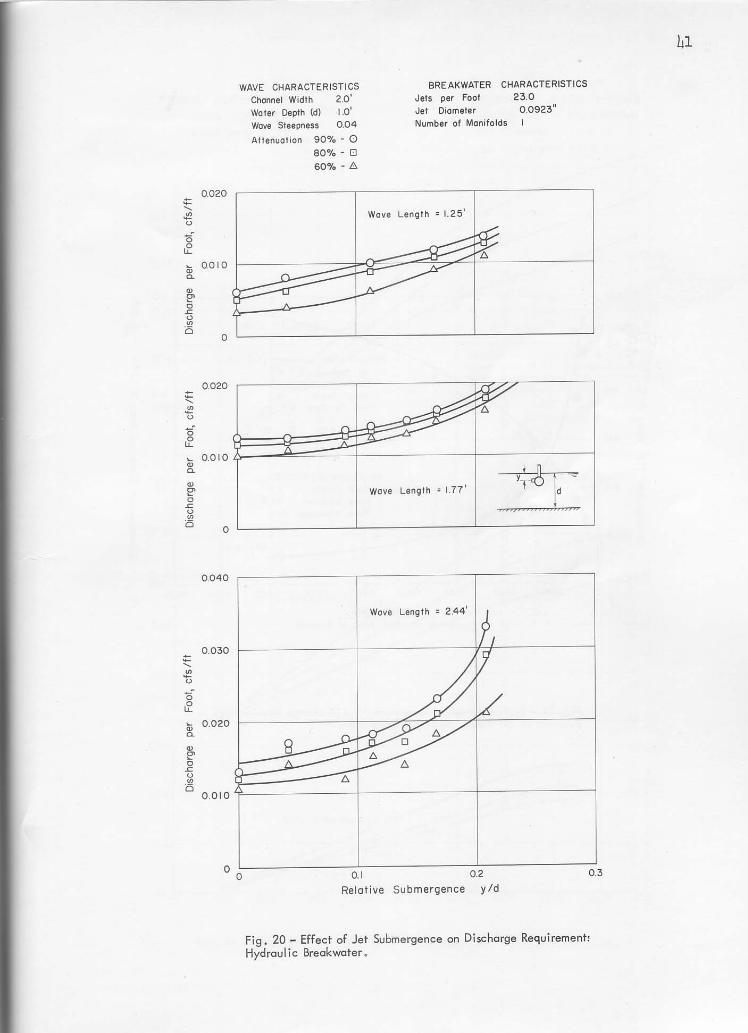
3 . Effect of Jet Submergence
The results presented in Fig. 20 indicate that the zero submergence
condition is the most efficient; however, there may be objections to a proto
type installation using this value, and the major! ty of te sts were based en
a relative submergence value y/d of 0.091. A slight correction can be ap
plied to such data by use of Fig. 20 if zero submergence is requll-ed.
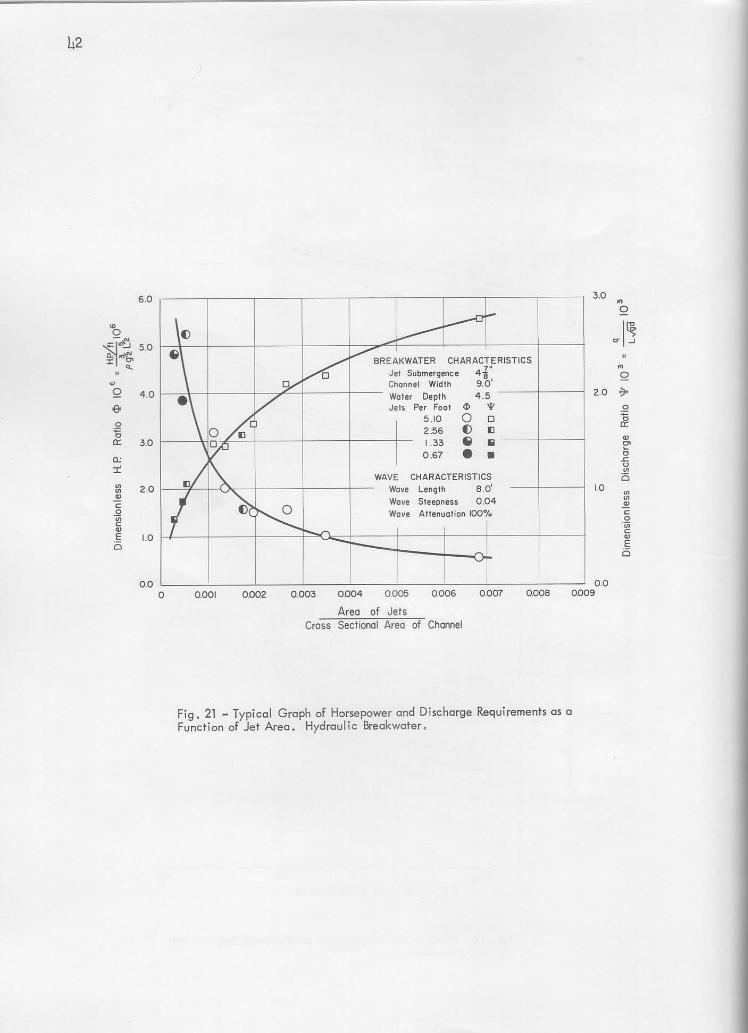
4. Effect of Jet Area
One of the most important parameters affecting both the discharge
and horsepower requll-ements is the jet area per lineal foot of breakwater.
Jet area is dependent on two variab1es--jet spacing and jet size . During
this study both the jet spacing and jet area were varied; large-scale tests
oovered spacings of 1.34, 2.56, and 5.11 jets per ft and a number of jet dia
meters between 0.422 and 1.047 inches. Four Lid ratios (L = wave length,
d = water depth) were selected for the tests: 0.72, 1.22, 1 . 78, and 2.~~.
A typical summary graph for Lid = 1.78 and lOOper cent attenuation is pre
sented in Fig. 21. In this case the dimensionless horsepower ratio <P and
dimensionless discharge ratio ~ were plotted against the dimensionless jet
area which is defined as
area of jets
cross-sectional area of channel
which is equal to
a j area of jets per foot =-------
ae
1 x depth of channel
Figure 21 indicates that the discharge and power requirements are
st.rongly dependent on the jet area. Low values of jet area are associated
with a requll-ement for high pOllar, high jet velocities, and low discharges.

17
It appears that power requirements at the jets or nozzles will probably de
crease as the jet area is increased until the latter is equal to the cross
sectional area of the required surface current. Apparently the turbulent
losses in the jets decrease as the jet velocity decreases, resulting in bet
ter efficiencies. However, as the jet area is increased, the required dis
charge is increased; as a result, it would be necessary to use larger mani
folds and supply pipes or provide for larger losses in these components.
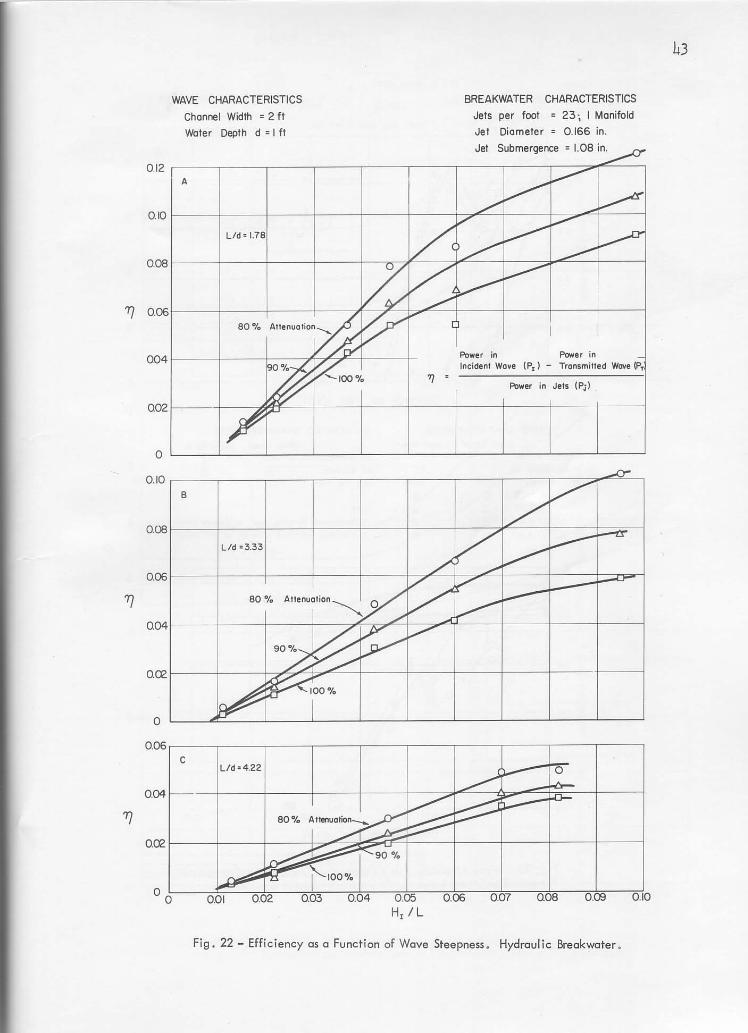
5. Efficiency
As noted in the section on wave steepness, more power is required
to attenuate relatively steep waves than flat wa\esj however, the efficiency
of the system 7J is much higher for the steep waves than it is for the flat
waves. The efficiency is defined as
7J =---P.
J
where PI
wave, and
is the power in incident wave, PT
is the power in transmitted
P. is the power in the hydraulic jets. J
Figure 22 illustrates experimental data on efficiency. For the one
manifold system, the efficiency varies with steepness, attenuation, and rela
ti ve wave length. For attenuations of 80 to 100 per cent, the maximum e ffi
ciency obtained was only about 12 per cent.
6. Scale Effect
The small and large wave channels, being geometrically similar, were
ideally sui ted for a scale-effect study. For the purpose of comparison of
small- and large-scale models, it was assUllled that gravity and inertia forces
are of primary importance in relating the two models and, consequently, that
Froude's law governs. The Froude number may be expressed as
C F =-=-n Jgd
>There C wave celerity,
g = acceleration of gravity, and
d depth of water.
18
Consequently,
the discharge ratio is
the length ratio for the two models
Q = L 5/2 and the power ratio is r r '
is Lr = 1/4.5, P = L 7/2.
r r
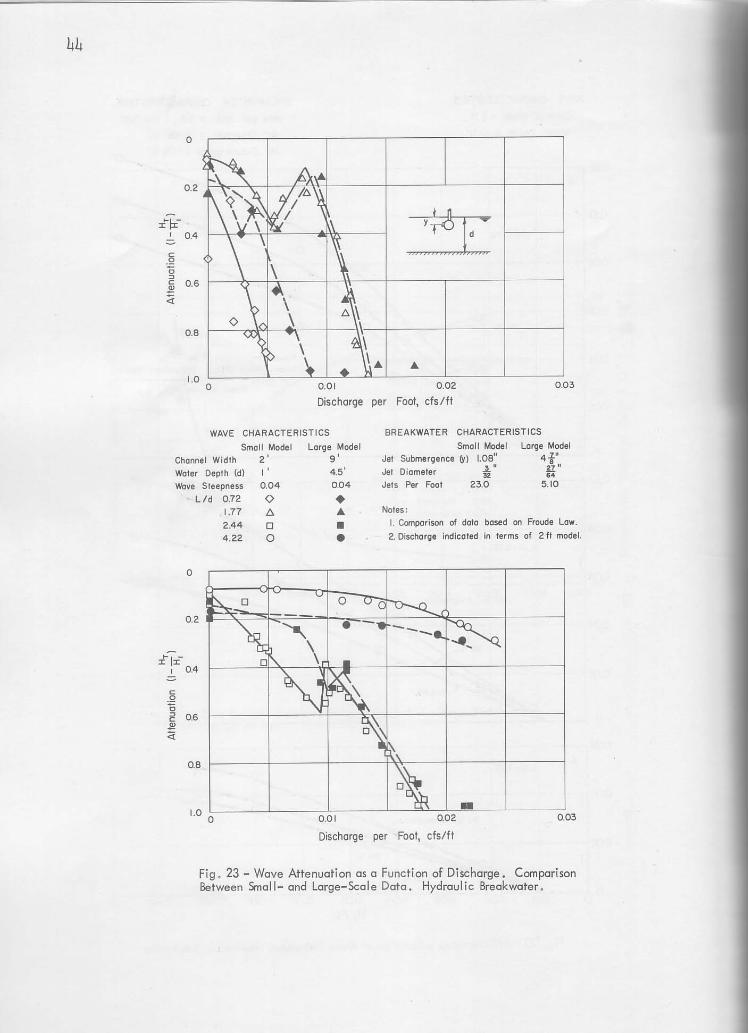
Figure 23 illustrates comparative discharge data expressed in terms
of the small model. The preceding formulas were used to reduce the large
scale data to the appropriate conditions. It ma;r be noted that data in the
low-attenuation region exhibited considerable scatter and that the curves had
a pronounced discontinuity; the latter ma;r have resulted from a variation in
the mechanism of energy loss as the jet discharge was varied. Considering the
data for attenuations in excess of 50 per cent and Lid values in excess of
1.0, agreement between the data for two models is quite good. It was concluded
that little, if any, evidence of scale effect existed for the 1:4.5 scale
ratio of the two sets of tests.
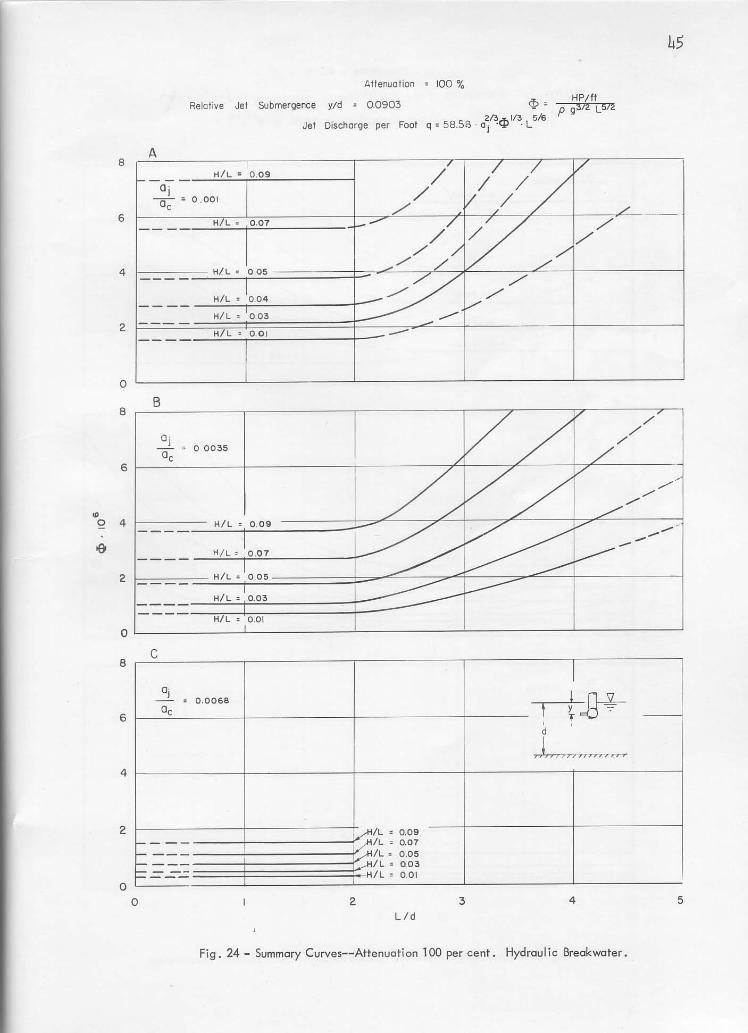
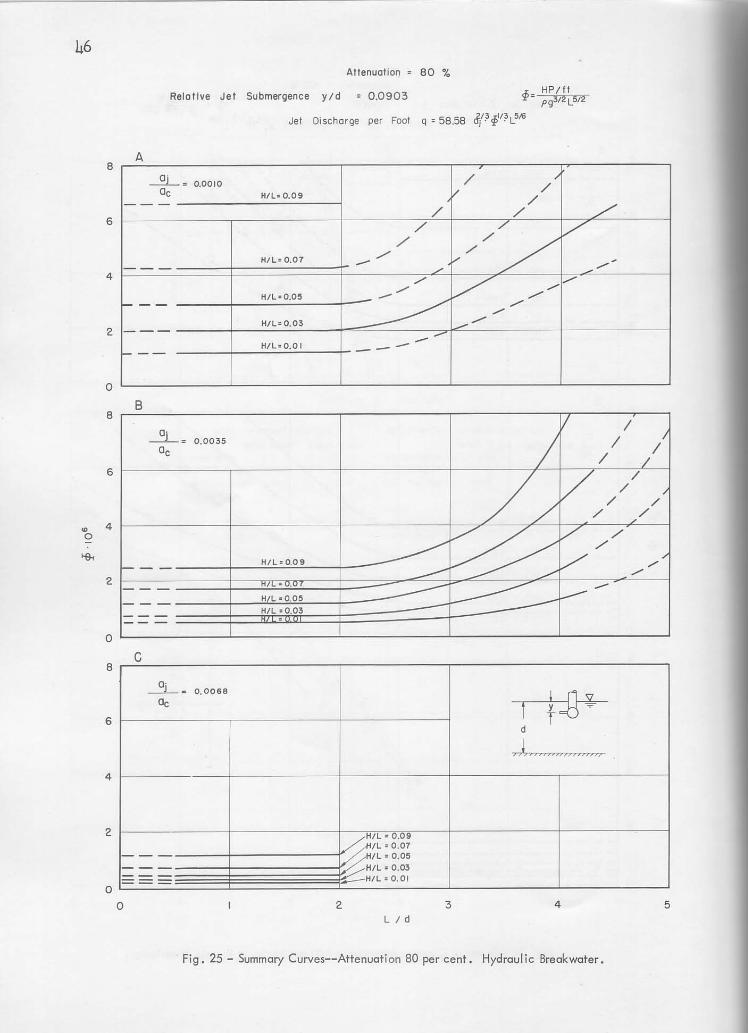
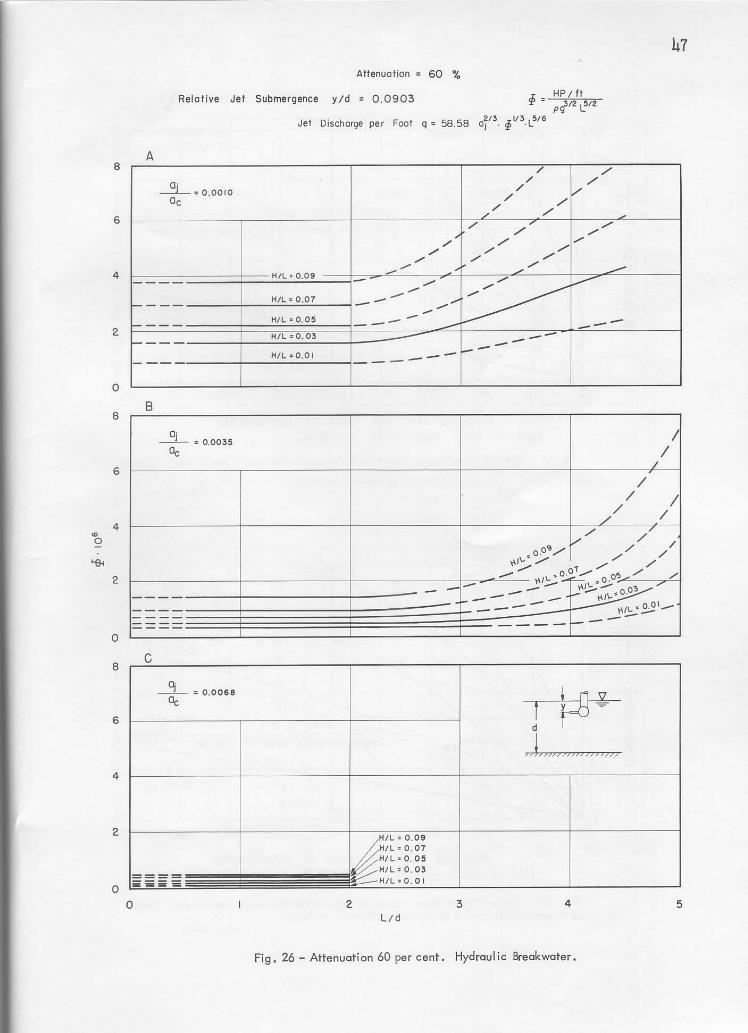
C. Summary Curves
Power requirements at the jets are summarized in Figs. 24 through
26in dimensionless form, The faired curves were based primarily an the large
scale testsin the region of 1 < Lid < 2.5 and upon small-scale tests for
Lid > 2.5. The dimensionless power ratio <P can be determined for selected
values of Lid, HIL, a./a, and attenuation. J c
The required discharge per lineal foot of breakwater can be computed
by the following formula:
q 58.58 a.2/3 <P 1/3 L5/ 6 in cfs per ft J
where 58.58 is a constant = 11001/3 gl/2 and L is the wave length.
D. Conclusions--H;ydraulic Breakwater
(1) Horsepower and water-discharge requirements for the hy
draulicbreakwater are dependent upon wave characteristics
such as length, height, and water depth, and breakwater
characteristics such as spacing and size of nozzles, sub
mergence of nozzles, and the number of manifolds.
(2) A single-manifold hydraulic breakwater is quite effective
for deep-water waves (Lid < 2), but its effectiveness
decreases with increasing Lid ratios.

(3) For high values of attenuation, more po.rer is required to
attenuate the steep waves; however, the efficiency of the
system based on the rat io of t he difference between in
cident and transmitted wave energy to the jet energy is
much higher for the steep waves than it. is for the flat
wave.s o
(4) Zero submergence of the nozzles appears to be most effi
cient for the range of wave lengths tested; however. the
differences in discharge requirements are not large for
values of yld between a and 0.1.
(5) Power and discharge requirements at the nozzles are de
pendent upon the area of jets per unit length of mani
fold. As the area is increased, the power decreases, and
the discharge increases . As losses in the pumping and
supply system are dependent on the discharge, the supply
system must be analyzed along with the manifold and jet
system in order to determine the optimum jet area.
(6) Comparative data on the hydraulic breakwater obtained in
the large and small channels (scale ratio 1,4.5) agree
quite well when comparedon the basis of Froude's law for
values of Lid between 1.22 and 1.78. This would indi
cate that little scale effect exists over this range and
tends to substantiate extrapo.l.ation of the data to the
protot ype condit.ion.
(71 There are preliminary indications that a several-manifold
hydraulic breakwater producing a thicker surface current
might require less power at the jets and higher discharges
than a breakwater wit.h a single manifold f or large Li d
values , but additional tests would be required to deter
mine the optimum efficiencies of several-manifold break
waters for a given range of Lid values.
(8) Limited comparisons with Taylor ' s theory indicated the
theoretical value of surface-current velocity usually oc
curred at a distance of one or two wave lengths from the
19

20
breakwater for an experimental wave steepness of 0.01.
The comparison is somewhat arbitrary as the theory does
not consider wave steepness"
(9) Snyder's experiments show fairly good agreement with the
tests described herein for high values of attenuation.
For low values of attenuation Snyder's experiments re
sultedin somewhat larger discharges thanSt. Anthony Falls
Hydraulic Laboratory data indicate.
(10) Brief tests with the manifold on the bottom and the water
jets issuing vertically required considerably more power
than a horizontal jet system located near the water sur-
face"
VI. APPLICATION OF BREAKWATER DATA TO A TYPI CAL PROBLEH
In the preceding sections the experimental data were presented in .
a form which would illustrate the effect of various parameters on some aspect
of performance. Summary curves were included (Fig. 9 for the pneumatic sys
tem andFigs. 24, 25, and 26for the hydraulic system) showing a dimensionl ess
power index <P as a function of various parameters. These curves will be
of assistance in extrapolating the results t o prototype installations. The
model tests did not reveal any significant scale effect between tests in a
water depth of 1 It and those in a depth of 4.5 ft. Scale-effect tests by
Williams [26] were considered inconclusive. Onthe other hand, tests by Kuri
hara [19] indicated lower power requirements in the protot ype than a Froude
extrapolation of the pneumatic model data would indicate. As an overall ob
servation it appears that further information on full-scale installations is
desirable. For the present , a Froude extrapolation of the model data is rec
ommended, in accordance with Figs. 24, 25, 26, and 9, asthe most conservative
approach.
With regard to a comparison of the pneumatic and hydraulic systems,
the following observations can be made :
(1) Higher attenuations, approachinglOO per cent, can be ob
tained with the hydraulic system as compared to maximums
in the range from 60 to 80 per cent for the pneumatic sys
tem"
(2) In general, the applied power at the nozzles will be less
for the pneumatic system than for the hydraulic, for atten
uation on the order of 60 per cent and L!d values less
than 2.
(3) Losses in the supply lines will usually be less for the
pneumatic system, or conversely, for the same total power
and pipe size a single supply line will accommodate a
longer manifold length, resulting in a simplified supply
system.
(4) Installationof the pneumatic manifold on the harbor floor
(for shore installations)would be easier and less subject
to wave damage than a hydraulic manifold at or near the
water surface. On the other hand, silt and sand may pre
sent some problems with a bottom installation.
(5) With both systems power requirements increase quite rapid
ly with wave length for L!d values in excess of 2.
21
To illustrate some of these factors the following computations for I
a specified site are included. The Bite is one which was of interest to the
Navy and for which wave data were available. The wave conditions to be ex
pected in this region were given as follows :
Wave Height, ft Wave Length, ft
6 70
7 100
8 125
9 150
10 180
The depth of water in the harbor was 40 ft.
Using Fig. 9, the horsepower requirementa for a pneumatic break
water were computed and are shown in Fig. 27. It should be rememhered that
the wave height is not of interest in this figure since the air required is
independeno of the steepness. Figure 28 shows 1;he requix-ements of a hydraulic
breakwater for similar condi tiona. Here the attenuation depends upon both the
wave height and the diameter of jets used. The horsepower values are computed
22
from the d:i1nensionless plots given in Figs. 24 through 26. An intermediate
jet area ratio of 0.003$ was used, since for lower areas the applied horse
power was too high, and for higher areas the friction losses were too high.
Figures 29 and 30 illustrate the supply-line losses for the pneu
matic and hydraulic systems, respectively. As an illustration a value of 100
hp was chosen for the applied power in each system, and the total power re
quired, including losses, was computed for various supply- line diameters.
This, however, is naturally dependent on the length of the breakwater and the
length of the supply lines. In these computations the length of supply line
was assumed to be 2$0 ft and the total coefficient of loss for valves and
bends was assumed to be 1.0.
\ ,

23
LIST OF REFERENCES ---- ----------[1] Anonymous. "The Brasher Air Breakwater." The Engineer, p. Ll4. 1916.
[2J Anonymous. "Severe Testof the Brasher Air Breakwater." Compressed Air Magazine. 1916.
l3] Bogolepoff, J. A. "Der Pressluft-'lellenbrecher." Bulletinof the Permanent International Association of Navigation Congresses. 1937.
[4] Platzer, Sven. "Pneumatiska vAgbrytare." Teknisk Tidskrift, Vol. 55, pp. 105-109. 1938.
[5] Schijf, J. B. "Het vernietigen van golven door het inspuiten van lucht (Pneumatische golfbrekers)." De Ingenieur, Vol. 55, pp. 121-125. 1940.
[6] Unna, P. J. H. Nature, Vol. 149, p. 219. February 1942.
(7] Taylor, G. I. "Note on Possibility of Stopping Sea Waves by Means of a Curtain of Bubbles." Admiralty Scientific Research Department, ATR/Misc/1259. 1943 .
[8] Carr, JohnH. Mobile Breakwater Studies. California Institute of Technology, HYdrodynamics Laboratory, Report No. N-64.2. 1950.
[9] Stoker,J. J., Fleishman, B., and Weliczker, L. Floating Breakwaters in Shall ow Water. New York Univer sity, Institute for Mathematics and Mechanics. February 1953. 46 pages.
[10] Evans, J. T. Pneumaticand Similar Breakwaters. British Transport Commission, Docks and Inland Waterways, Report No. 21. 1954. 23 pages.
, (11] Teplov, A. V. The Scientific Principlesfor the Use of Pneumatic Break
waters. floscow, 1954. Translatedand issued December 1958 by Technical' Information and library Services, Ministry of Supply, London.
[12]
[13]
Anonymous. nStrange Case of the Pneumatic Breakwater. 11 com~ressed Air Magazine. Vol. 59, No.8, pp. 221-222. August 19 4.
Wetzel, J. M. Experimental Studies of Pneumatic and HYdraulic Breakwaters. University of Minnesota, St. Anthony Fills flYdi"auhc Laboratory Project Report No . 46. May 1955. 61 pages.
(14] Taylor, G. I. "The Action of a Surface Current Used as a Breakwater." Proceedings of the Royal Society, A, Vol. 231, pp. 466-478. 1955.
(15] Evans, J. T. "Pneumatic and Similar Breakwaters." Proceedings of the Royal Society, A, Vol. 231, pp. 457-466. 1955.
24
[16]
[17]
Hensen, Walter. "}Iodelversuchemit pneumatischen ilellenbrechern." Mit
teilungen der Hannoverscben Versuchanstalt f"ur Grundbau ood
1,asserbau, Franzius Institut der Technischen Hochschule Han
nover, Heft 7, pp. 179-214. 1955.
Anonymous. "Pneumatic Breakwater Trials." The Dock and Harbour Author
ity, No. 426, Vol. 36, p. 364. 1956.
[lB] Laurie, A. H. "The German ExperiJnents on Pneumatic Breakwaters." The
Dock and Harbour Authority, No. 416, Vol. 36, pp. 61-64. 19K
(19) Kurihara, Michinori. "On the Study of a Pneumatic Breakwater." Appears
in five parts in Heports of Research Institute for Applied
Mechanics, Kyushu University, 1955-5B. Parts I, II, and III
have been translated by K. Horikawa in reports of the Wave Re
search Laboratory, University of California, Berkeley, Series
104, Issues 4, 5, and 6. English abstracts of Parts IV and
V are available.
[20) Herbich, John B., Ziegler, Jurgen, and Bowers, C. E. ExperiJnental Stud
ies of gvctraulic Breakwaters. Universi ty of Minnesota, St.
Anthony Falls Hydraulic Laboratory ProjectHeport No. 51. June
1956. 103 pages.
[21) Hensen, W. "Erprobungen von pneumatiscben Wellenbrecbern in Model und
in der Natur." Mitteilungen der Hannoverschen Versuchanstalt
far Grundbau und Wasserbau, Franzius Institut der Technischen
HochschUle Hannover, Heft 10, pp. 183-209. 1957.
[22]
[23]
Snyder, C. M. Model H aulic Breakwater Studies.
ratory, University of California. 197. Wave Research Labo-
30 pages.
'lave Research Laboratory, pages.
[24] Snyder, C~ · l!l. Model Study of a Hydraulic Breakwater Over a Submerged
Barrier. Wave Research Laboratory, University of California
1957. 56 pages.
[25) Straub, Lorenz G., Herbich, John B., and Bowers, C. E. "An Experimental
Study of Hydraulic Breakwaters." Proceedings of the Sixth Con
ferenceon Coastal Engineering, Gainesville, Florida, pp. 715-
728. December 1957.
[26] Williams, John A. Scale Effects of Models of
Wave Research Laboratory, University of
pages.
aulic Breakwaters. California. 19 0
[27) Horikawa, K. Three-Dil1lensional Model Studies of aulic Breakwaters.
Wave Research Laboratory, University of California. 19 3
pages.
[2B) Heath, William A. "Pneumatic Breakwater J evelo:-nt in mgland." The
Military Engineer, Vol. 51, .'0 . J v . ~..h-~pril 1959 .

FIGUR E S ----- --(1 through 30)
Cu rrent Velocity Profile
Wa te r Surface
Cur rent Velocity """:--Prafile /
~;;:3rl /
\ \
\
/ /
/
/
/ /
I / I / So",c. of 'tiBubbles
d
Fig _ 1 - Qualitative Pattern of Surface Currents Produced by Air Bubbles. Pneumatic Breakwater .
4
-e. 2
- , ....
°0
\ " '\
"-
2
'" '" , , ~
4
• • (,., (,..,001 Poromete,.
L Deep Water WoYI Length h Thickness ,I Surface Current
U" Vetocity of Uniform &.rfcel Current U .. Surface Velocity of Non-Uniform
"" ~;lr~;:II.ith Trlongulor Velocity "- . tr lion
----- ----...j ! ... (~ifO~ Cv~r.,.t)
-----1'--("1"'"- LQI~;\" C41rrenl
6 8 10 12 14 16
q~ "'" (..2.;~
Fig. 2 - Solution for Taylor 's Theory for Both Uniform and Nanuniform Ve locity Distribution in Surface Current
27

28
Fig. 3 - View of Small Wave Channel
Fig. 4 - View of Large Wove Channel
12'-+--!--- 14'
Fig. 5 - Sketch of Test Setup in the Small Channel
UIS Probe
I-+-- 60' - - ---+-->-- 56' -----I-,>-~-
DIS Probe
Differen lia] Manomeler
Orifice Meter
Stolic Pres. Manometer
Air
29
Absorber
From IS loP Compressor
Differential Manometer
Sialic Pres. Monomefer
Fig. 6 - Sketch of Test Setup in the large Channel
0
02
III" I
0.4 -c: 0
<= c 0.6 " c: " -<
0.8
1.00
Symbol
o 'V o o /'; o
Wove Length in feet
1.22 1.78 2.44 3.11 3.55 4.22
Width of Chonnel = 2.0 It Depth of Woter I .0 It No. of Orifices
per foot =23.0 Orifice Diameter 0.042 in Wove Steepness = 0.04
A~ ~ /';" -":"t--~~ ---r<- "'--~~ r-~ ~ C~ ''R.... h- 6
" " " 6-----8 ~, ' Q::::::: 6 ----'> ~ ~" c Icr-- f-----L <:0_ '11.78 It "" t--.. 3.11 It
= 1.22 It 2.44 ft I
0.20 0.40 0.60 0.80 0.10 0.12 0.14 0.16 0..18 0..20. 0.22 0.24
Unil Discharge in cfslft Free Air
-
= f--- 4.22 It-
. - r3.55:~
0.26 0.28 0.30
Fig. 7 - Effect of Wove Length on A ir Discharge Requirements (d = 1 .0 ft). Pneumatic Breakwater .
VJ o

o
0.2
:tl£ , 0.4
c: 0
+= " 0.6 " c: ., --<t
0.8
1.00
o~ '\ Width of Channel = 9.0 ft Depth of Woter = 4.5 ft , No. of Orifices
per foot = 5.1 -
" \ ~ ~ Orifice Diameter = ~ in
ho I::. Wave Steepness = 0.04 f\
\ \ ~ R Symbol Wove Length -/\ in feet
\ ~ r-....~ 0 3.25 t:, 0 5.5
11.0 ft -\ \ P "'-7.0ft ....... P"--IV ...J 0 7.0
<> \ 00 < ~ r-s:olt 0 8.0
00 OlC 0 t:, I::. 11.0
L = 3'25 It
5.5 It
I 0.02 0.04 0.06 0.08 0.10 0.12 0.14 0.16 0 .18 0.20 0.22 0.24 0.26
Unit Discharge in cfs/ft Free Air
Fig. 8 - Effect of Wave Length on Air Discharge Requirements (d = 4.5 ft). Pneumatic Breakwater.
\.oJ .....
3.0
.. Q 2.5
" N ,
T -...J Q:N .::I:~ 2 .0
" .. 0 -0
--cr 15 · .. • It • ..
h I,
10 .. ., F. ., •• .. ~-
Ii 05
00 0.5
I I I Relative SubmerQence • 90 OJ.
Shaded Symbols d • 4.5 ft Open Symbols d -I.Qft
J I ,
V /
V i )/ _~It.nUOlion • 1~V
V / --
• L . _ - Aft.nuo.lon • 50 "I",~ {!.
r-. - V Attt.nua.lon • 25 %
--1.&
• ..l' ~ - . t- -•
1.0 1.5 2.0 2.5 3.0 3.5 4.0
Wave Length .h Depth of Water d
Fig. 9 - Horsepower Rati o as a Function of Le ngth-te-Depth Ratio. Pneumatic Breakwater.
4 .5
W N
3. 5
3.0
2.5
2.0
1.5
1.0
~ ... 3. ~ Q) o ~ 0.0
5
Q) a. ~ ~ 3.0 o ~
I 0 J: .,
2.5 u ., c: u ., c: 0>., ~ 0> ~ ~ 2.0
.Q E :::J.Q (fl :::J
(fl I. 5
c_ :;::-; Su-o.. 1.0
3.5
3.0
2.5
2.0
1.5
1.0 o
I I t-- L----;
~ 1.)1. d
,///T//T////,7JT.)///27////UN%
Attenuation = 25%
Attenuation = 50%
Attenuation = 75%
0.1 0.2 0.3 OA
Relative
I ~/d Symbol
0 1.22 0 1.78
" 2.44
~ -......::.....
~ y--.....,
"'"-I--" ~ -
~ .....
~ ~
\ \ \ \
~ ~
0.5 0.6
Submergence
~ ~
--a..::::: ~ ~
\ \ \"
\
..... \ H--- r-.. ~ .....
0.8 0.9 1.0
Fig . 10 - Relative Horsepower as 0 Function of Submergence. Pneumatic Breakwater.
33

34
o ? I I I , Width of Channel ; 2.0 It
0.2
:tl£ 0.4
" .Q - 0.6 0
" " ., -4: 0.8
Depth of Wafer ; 1.0 It _
~( Wove Length ; I. 78 It Symbol Wave Steepness
() 0.02 0 0.04 -
c9()~ D. 0.06
~t 0 0.08
~ ~I .6. C ( • 0
~ U 0
0.005 0.010 0.015 0.020 0.025 0.030 0.Q35
Unit Discharge in cfs/ft Free Air
Fig . 11 - Effect of Wove Steepness . Pneumatic Breakwater.
o I I I .6. Width of Channel ; 9.0 It
Depth of Water ; 4.5 It
0.2
:tl£ 0.4
" 0 :;: 0 0.6 " " ., --<t
OB
No. of Orifices per foot ; 5.1 -!-\ rK Wave Length ; 8.01t
Wove Steepness ; 0.04 Symbol Orifice Dia.
In inches
~ L> /l D. I
~ ,Ii B 8
~~ 0 3 l,g' is
<> I .6.L
~' .. .......
i'-fo 0 -
0.05 0.10 0.15 0.20 025 0.30 0.35
Unit Discharge in cfs/ft Free Air
Fig . 12 - Effect of Orifice Diameter. Pneumatic Breakwater .
35
1.0 0'--------:Occ.0'-=5=----0"C:".'-::10=------=-0.'-::15=------=-a-=-20=-----=-0.-=-25=------,.0-=.3"C:"0----'0.35
Unit Discharge in cts/tt Free Air
Fig. 13 - Comparative Perfonnance of Single and Multiple Manifolds. Pneumatic Breakwater.
o
0.2
:tl£ I 0.4
c: o :;:: g 0.6 c:
~ 0.8
1.0 o
Widlh of Channel = 2.0 It
\ Deplh of Waler = 1.0 fl Wave Lenglh = 1.78 It
~ Wove Sleepness = 0.04 -No. of Manifolds = 2
Symbol Manifold Spacing in feet -
0" " 0.22 0 ~
l::,. 2.21 0 4.21 0 One Manifold Dolo _ vp: J [ f:!,.
"Q] ~ L '" 0 0 .l
0.005 0.010 0 .015 0.020 0.025 0.030 0.035
Unit Discharge in cfs/ft Free Air
Fig. 14 - Effect of Manifold Spac ing . Pn eumati c Breakwater .
36
"'0 )I( 3.0
" -&- 2.0 o
:;:: o
a::: ~ .. ~ o Q. .. (I) ~
o :z: en (I) .. 'E o 'iii <:: .. E Ci
1.5
1.0
0.5
I Symbol
I-0 0 I::. 0 'V
0.5
I , I _I Source Depth of
Water in feet
SAF 9ft Chonnel 4.5 SAF 2 It Chonnel 1.0 ~ SAF 6 in Channel 1.0 Japanese Model Tests 2.3 Japanese Proto. Tests 28.0
) 1I
0
n
1.0
/
/ V
b
8 'VOC
1.5 2.0 2.5 3.0
Wave Length h Depth of Water d
3 .5 4.0
Fig. 15 - Compari son with Data from Other Sources. (Attenuation = 50 per cent) Pneumatic Breakwater.
o
-0.5
-1.0
-1.5 -'" '" - -2.0 c
~ -2.5 Co
'" o -3.0
-3.5
-4.0
-4.5 -2 -I
0 ......
-0.5 ~
-1.0 ....-~
-1.5 -'" '" - -2.0 c 0
J:: -2.5 -Co Width of Channel = 9.0 It
'" 0 Depth of Water = 4.5 ft -3.0 No. of Orifices -
per foot = 5.1 \ Orifice Diameter = fir in
-3.5 \ Air Discharge = 0.188 cfs/ft
-4.0 \ Distance from _ \ Breakwater = 2.25 It \
I I I \ -4.5
-2 o 2 3 4 -I
Veloci ty in fps
?' j j
/ / ;J
f/
r-
Distance from _ Distance from
\ Breakwater = 4 .5 It
\ I o
Velocity in
I 2
fps
I 3 4 -2 -I
\ Breakwater
" I o I
Velocity
I 2
in fps
=
Fig. 16 - Velocity Distribution in Surface Current . Pneumatic Breakwater.
37
-9.0 It
I 3 4
II> C. ..... "
:::;)
,... -'0 0
~ -" III .... .... :3
U
10
8
6
4
2
8
6
4
2
, --; I I, I. I I -t-- rr 'I ---====~-~t:t~~L:ar~ge~~~M:O~ddeell +-- 'L ! "
- , •• " "00", '" , I I W "l I Channel Width Depth of Water
Y/d
2.0 It 4.5 It I 0 It
.• t Symbol
1"'-
o 0.083 0.167
o fj,
o ... •
• . --...-"'-...-____ -1"'- ...- ...
Taylor's Theory q' 0 .00454 U3 -:\ ~...-~
~S=~III.~ ___ -r"'-r ~ r<=FF
1...- ~ ---- LGF 10.1 I I I
10'3 2 4 6 8 10'2 2 4 6 8 10'1 2 4
Unit Discharge q in cfs/ft Free Air
Fig. 17 - Surface Current Velocity 05 0 Function of Air Discharge. Pnoumatic Brnokwotor
w ' 0:>
2
10
"'0
>&8 .Q
& a.. I6
2 r.
0
Attenuation 100% Jet Diameter Symbol
0·166 0 0·0923 0
IF' /
/ 7, Vj V
J
~ C7 >
...-6
2 3
LA! 4 5
P
/
6
Fig. 18 - Horsepower Ratio as a Function of Length-ta-Depth Ratio . Hydraulic Breakwater.
39

40
• o
10
8
26 -" 0:
Q. :I:
2
o
o
LId = 4.22 o
0.02 0.04 0.06 0.08 0.10 H/L
Fig. 19 - Horsepower Ratio as a Function of Wave Steepness. Hydraulic Breakwater .
.:: , 1'3
~ " m ~
m e-o ~ 0
t5
" 1'3 <f .l'
" • 0.
• e-0 ~ 0 · "
-, • -0
~ 0
.l' " • ~ m e-o ~ 0 ." 0
0.020
0010
0
0.020
0.010
0
0.040
0 .030
0.020
0 .010
WAVE CHARACTERISTICS
Chonnel Width 2.0' Waler Depth (d) 1.0'
Wove Steepness 0.04
Allenuolion 90% - 0 80"10 - []
60% - A
BREAKWATER CHARACTERISTICS
Jets per Fool 23.0 Jet Diometer 0 .0923" Number of ManifoldS I
Wove Length'" 1.25'
.r> ..-- ~ ~ " --~ -0-
Wove Length ~ 1.77' = WOl/e Leng th
8 D.
°oL-----------~L-----------~L-----------~ 0.1 0.2 0.3
Relative Submergence y/d
Fig. 20 - Effect of Jet Submergence on Discharge Requirement~ Hydraul ic Breakwater .
41
42
6 .0.
"b ~T~ 5.0
~1~ " • Q 4 .0
~
.2 ;; 0: 3.0
"' :t
~ 2 .0 • c .2 ~ • E 1.0 6
0..0. 0.
3.0.
I -C l--() !.---+-
tl
Vo V BREAKWATER CHARACTERISTICS
0/ Jet SubmerQetlCI 4·r Chonnel Width 9.0'
e\ V Waler Depth 4.5 Jets Per Foot .. '"
~ ~ 5 .10 0 0 2 .56 () .,
C7" 1.33 tl II 0 .67 e •
2.0.
.,1 1\ WAVE CHARACTERISTICS
I . ~ Wove Len91h S .O'
~ Wove Steepness 0 .04 Wove Attenuation 100°/.
1.0.
0..0. 0.001 0..002 0.003 0.004 0..005 0..006 o..ow c.""" COO.
Area of Jets Cross Sectional Area of Channel
Fig_ 21 - Typical Graph of Horsepower and Discharge Requirements as a Function of Jet Area. Hydraulic &-eakwoter .
• Q
gl~ • Q
~ 0
~ • ~ 0 ~ u
5 • • .!! c 0
.0; c • E 6
0..12
0.K)
0.08
WAVE CHARACTERISTICS
Channel Width = 2 ft waler Depth d:: I ft
A
LId z 1.78 v
BREAKWATER CHARACTERISTICS
Jets per foot = 23 ~ I Manifold
Jet Diameter = 0.166 in .
-~
Jet Submergence - I 08 in
V V ,,- ~
'" y V
V ~ .....---.......---~ ~
A''',"'';''~ V 7) 0.06
7)
7)
80"1.. I
Powtr in Power in
~ ~OO"I. Incidenl Woye (PIl - Transmilted ~e (PT
"I • Power in Jets (PJl
~
004
0.0.2
0.
0.. 10. .-_-, __ ---, __ -,---__ ,--_--, __ ---,-__ --.-_ _ -,--_-,..,........0-""----,
/V 8
0.08 1-----tL-,-, .-3-33t---r----t--t-- ---tV- --:;;-t'----~-t~-:::::j:::::a:'--j
/'" /~ 0'·06r--t----:=::-~=:!=_-I____::~v7'~v7,,-£-t==+:::==r=1
I 80% A"''''''';''~VV-O'04r---+--~-~r_~rr~~t_~~L---r--r_--+---4
9O%,V-:-~V /y ............. ~
O'.02 f-----+--I-:,~n-""'" .A~"'--+-____1--+-____1--+--t-_____1
0.
0..06 C
0..04
0.02
?<'..-c 100%
~ I
LId - 4.22
------I"'"
ao"!.. ~lIenUD~ V--::::::i ,...,..
<"""90%
~ 1" 00%
0..0.1 0..02 0..Q3 0..0.4 0..05 0..06 H,/L
o.m
0 ..A. -ro-
0.08 0..00
Fig. 22 - Efficiency as a Function of Wave Steepness . Hydraulic Breakwater .
0..10.
43
44
.§ c ,
o
0.2
~ 0.6
;;
0 .•
1.0
It\ AI"
\~\~ t/I>~ =:r \ ~ \
0\ .. \ , \ \ I>
\
o
WAVE
~ .'.
~ \ n • ~" "
0 .01 0.02
Discharge per Foot, cfs/ft
CHARACTERISTICS BREAKWATER Small Model Lort~e Model
0.03
CHARACTERISTICS
Small Model Lorge Model Chonnel Width 2' 9' J" Submergence ~) LOa" 4f"
c .Q
"
Waler Depth (d) , ' Wove Steepness 0.04
LId 0 .72 0 1.77 I> 2.44 0 4.22 0
o
t-.. 0
~ " \ 0 I\. \
0.2
4.5' "" Diomeler ... " n" " ..
0.04 Jets Po. Fool 23.0 5. 10
• " Noles :
• I. Comporison of dolo based on Froude Low.
• 2. Olschorl'll' indicated in terms of 2 II model.
0 vo 'O--.Q.. • -. ---.. ~ •
E 0.6 ~ ~
~ '" a
Q.
1.0 o
t\
\ 0.01 0.02
Discharge per Foot, cfs/ft
• 0.03
Fig . 23 - Wove Attenuation as a Function of Discharge. Comparison Between Small- and Lorge-Scale Doto . Hydrauli c Breakwater .
45
Attenuation 100 %
Relative Jet Submergence y/d = 0.0903 HP;ft
Jet Discharge per Fool q = 58.58· O~~ct>"~ L s/i;
A 8
4
I
/' l,///// / e--- H/L '" 0. 09
aj / ~= 0 ,00\
./ ,/- -He 'r °.07
.~
// V ./ ./
// // .// HIL . 0 .05
HIL = 10 .0 4 ~ ./
V./ ----H/L ='0.03
6
2 H/L = 0 .0 1 -
0
8 B
OJ o 003S 0,
6
• Q 4 Hie , 0 .09 --------oe H/L • 007 ----
2 MIL" 0 .05 ----MIL s 0.03 -------- Hie , 0 .01
0
8 c
I 6
OJ 0.0066 r+J.F-,
at
d
L,.-... rr".,'..,....,... 4
~:L , 0.0.
~ /L • 0.07 , ...H/L . O.OS
~ /L • Q03
F - /L = 0.01
2
o o 2 4 5
LId
Fig. 24 - Summary Curves--Attenuation l OOper cent. Hydraulic Breok'NOter.
46
8
6
4
2
o
8
6
o 4
2
o
8
6
4
2
o
Allenuotion : 80 %
Relative Jet Submergence Y/d 0.0903 HP/ft ~= pg312L5/2
Jet Discharge per Foot q = 58.58 ~/ .3 ~/"!!L'j16
A
~. 0.0010 / / ' Oc HILz 0.09 V / ---
/ / L / // V /
,/ / H/L z 0,07 / - ./ ./'
./ V /./ / H/L=O.Q'5
~ 1--- ..-..-H/L -O.03 ..... ------
1---H/LoO.OI -' ---
B
V I ~. 0 .0035
/ I I Oc / /
// V III /
I I
--:: ~ V / /
1-- H/L-O.09 V .-..... . :--r-----_ f..---H/L.O,05
HIL :0.03 .
c O· --.::L • 0 . 0068
~ Oc
d
j """ 'n ,,, "",
~/L " O.09 IL ,,0.07 -- ~;L'OO'
e~/L'O.03 :;...--H/L.O.OI
o 2 3 4 Lid
Fig . 25 - Summary Curves--Attenuotion 80 per cent. Hydraul ic Breakwater.
5
8
6
4
2
o
8
6
4
2
o
47 Attenuation = 60 %
Rela tJve Jet Submerg ence y/d 0 .0903 HP / fl ~ = p~!2 L!l/2
A
o· ~. O.OOIO
Oc
-- --I -
_. -
B
Jet Discharge pe r Fool q =- 58 ,58 off;' , !p 1/3. L5/6
./ .,-..-/
H/L. O,0 9 - ./ _ /
MIL ' 0 .0 7 -- _ .... -H/ L -O. O!! --- -"" H/L - 0 . 03
H/ l _ O,OI - - - --
./ ./
./ /
// '" '" .,-
'" ./ .,- ./ .,- ./ ..-
~ ----- -
'" ",'"
./ ..-..-
--V
---
I /
.,-'" / oo~/ ,/ //
y.1\" " ""'" /",/ .,.... 0 1 ""'"
L--------------r------------~--------------~--~-~-- ~.~~ o~ /" / I ~I_ - .• , \.. • o. ""-:--,.."-1 -- -- !!...-~.0 03 0
==== ----====
o
H/ L ' O. 0 9
i;H/ L . 0 . 07
~H/L ' O. 0 5 H/l. O. 03
::;---H/L .0, 0 I
2 Lid
_- _ -- \'t IL - r --- u / L ' O O' _ "-----
~ "1,,,,,,,,,,,,,,,,,
3 4
Fig. 26 - Attenuation 60 pe r cent. Hydraul ic Breakwa ter .
5
48
1.0
L= 40~ I
0.8 .... -
J: J: j L=701l
1
/ L = 100ft / V L= 125ft
c: o -
0.6 ./'"
/ o 0.4 "
/ / /
1/ / V V c: .. -<i 0.2
o o ~ V
20
--.,/ - - L=150ft -f..---f---
40 60 80 100 120 140 160 180
Applied H.P. per foot of Breokwater
Fig. 27 - Applied Power Requirements of a Prototype Pneumatic Breakwater. Depth of Water = 40 ft .
1.0 ,--,-----,---;r-,------,----.----=;:oo-,-------,--,---, H = 7 ft L= 100ft
H = 811 L=125ft
I 0.8
.... -J: J: H = 9 ft
L = 150ft I
c: o
0.6 i---,f----l:-r'----+----:7''''t-----/--+----:::J;"..-.-=:cj----...,
g 0.4 i-+-hL--hL--i--..,.. ..... "---- Area of jets -;;----;:;--:::----.,.--:-'--;--;;;--c-= 0.0035
~ Cross Sectional Area of Channel
~
0.2 ~~~~~1~=t:l~:t=!::rH~=:,0[ft~j L = 180ft
o o W ~ ~ 00 100 IW 140 ~ 100
Applied H.P. per foot of Breakwater
Fig. 28 - Applied Power Requirements of a Prototype Hydraulic Breakwater. Depth of Woter = 40 ft.

220r--------.---------,---------------------------, ~
'" 51 Supply Pipe Velocity ~ 500 I~s
'" , ...J0 200 "
" I ~~,
Applied H.P. per loot ~ 100
£ '- \ ~ 180~---------+4_----_+--~~4\~-~---4----\--------~--------~ g 400 Ips..... \ -- -- -
" ~ 160 \ _"\ ___ \_ ~ __ ~
~ 1401---- 3.o.oIPS_\- __ J\ ___ \ " :i \ [, ,-----~-15 120 2.0.0 Ips \. __" " 2.o.oft ---I 15 -.- f-----'- ____ ':::"..~ __ -' __ P Breakwater Length ~ 2.0 It 5.0 ft 1.0.0 ft
~
'" Q)
'" '" .3 ~
.5
."
" U ..5 -° ~ ~
~ Cl: :i "0 ~
22.0
1 . .0 2 . .0 3 . .0 4 . .0
Diameter of Supply Pipe in feet
Fig. 29 - Total Horsepower (Including Losses) for a Typica l Prototype Pneumatic Breakwater
Supply Pipe I .... , 1 Applied H.P. per loot ~ 1.0.0 Velocity ~ 6.0 Ips , .... Area 01 jets ~ 0 . .0035
5..0
2.0.0 f----....
\ cr~~ ~e:o;~Area 01 Channel 5.0 Ips "-
18.0
160
14.0
12.0
1.0.0 .0
I', "
I- t- __ \ -f\-- 1\ 40 Ips ...... --\ I-- \ -~ \ ---- t\--
3.0 Ips _ \ ~\ - - K f--_ ~ ~-- 2.o.oft
2.oIPS~ ____ ~--~ ~ ---Breakwater Length ~ 2.0 It 5.0 It I.o.oft
1..0 2.0 3 . .0 4 . .0 5 . .0 6..0 7.0 8.0 9 . .0
Diameter of Supply Pipe in feet
Fig . 30 - Total Horsepower (Including Losses) for a Typical Prototype Hydraulic Breakwater
10.0 .
49

Copies
2
1
1
1
25
1
6
DISTRIBUTION IJ.ST FOR TECRNICAL PAPER NO. 25-B
of the St. Anthony Falls Hydraulic Laborat ory
Organization
Chief of Naval Research, Navy Department, Washington 25, D. c., Attn: Code 438.
Commanding Officer, Office of Naval Research, Branch Office, The John Crerar Library Building, 10th Floor, 86 East Randolph Street, Chicago 1, Illinois
COlllllla.'1ding Officer, Office of Naval Research, Branch Office, 346 Broadway, New York 13, New York.
Comma.'1ding Officer, Office of Naval Research, Branch Office, 1030 East Green Street, Pasadena 1, California.
Commanding Officer, Office of Naval Research, Navy # 100, Fleet Post Office, New York, New York.
Connnanding Officer, Office of Naval Research, Branch Office, 1000 Geary St., San Francisco 9, California.
Director, Naval Research Laboratory, ,[ashington 25, D. C., Attn : Code 2021.
1 Chief, Bureau of Ordnance, NavY Department, Washington 25, D. C., Attn, Research and Development Division.
3 Chief, Bureau of Aeronautics, Navy Department, Washington 25, D. C., for distribution as follows:
1 - Research Division 1 - Aero and Hydro Branch (Code AD-3) 1 - Applied Mechanics Branch (Code DE-3).
5 Chief, Bureau of Ships, Navy Department, Washington 25, D. c., for distribution as follows:
1 - Research and Development (Code 300) 1 - Ship Design (Code 410) 1 - ~elimina.~ Design and Ship Protection (Code 420) 1 - Scientific, Structural, and Hydrodynamics (Code 442) 1 .. Landing Craft (Code 519).
1 Chief, Bureau of Yards and Docks, Navy Department, Washington 25, D. c., Attn: Research Division.
1 Hydrographer, Navy Depart.'llent, Washington 25, D. C.
1 Connnander, Naval Ordna.'lce Test Station, 3202 East Foothill Boulevard, Pasadena, California, Attn: Head, Underwater Ordnance Department"
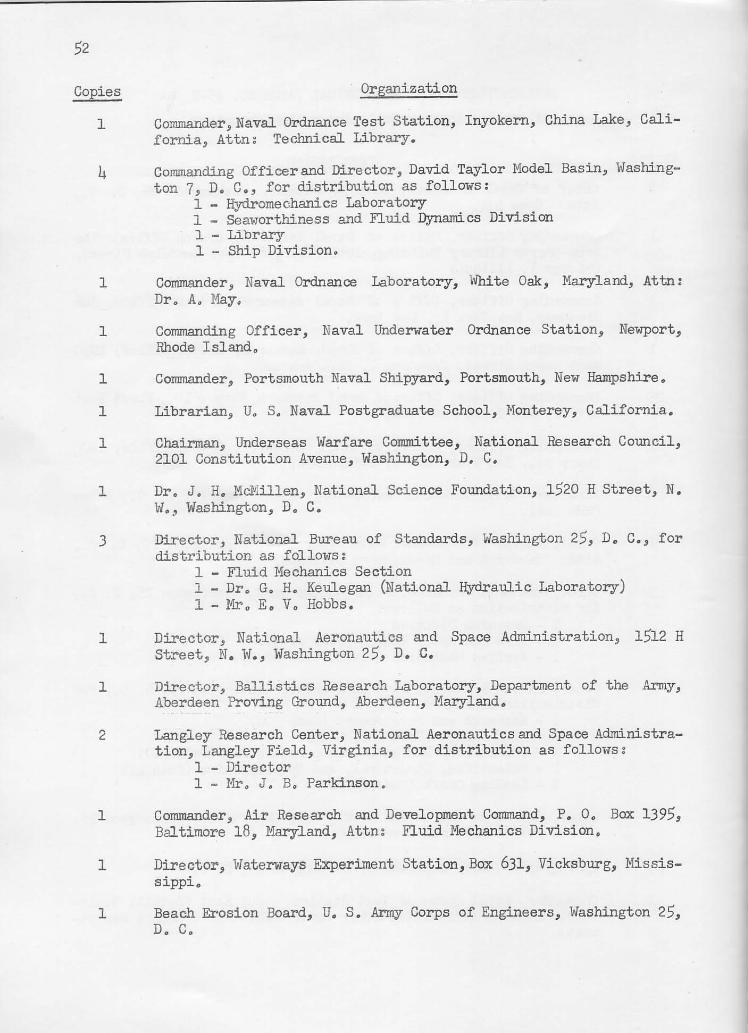
52
Copies Organization
1 Commander, Naval Ordnance Test Station, Inyokern, China Lake, California, Attn: Teclmical Library.
4 Commanding Officer and Director, David Taylor Model Basin, Washing-ton 7, D. C., for distribution as follows:
1 - Hydrcmechanics Laboratory 1 - Seaworthiness and Fluid pynamics Division 1 - Library 1 - Ship Division.
1 Commander, Naval Ordnance Laborator y, White Oak, Maryland, Attn: Dr. A. May.
1 Commanding Officer, Naval Underwater Ordnance Station, Newport, Rhode Island.
1 Commander, Portsmouth Naval Shipyard, Portsmouth, New Hampshire.
1 Librarian, U. S. Naval Postgraduate School , Monterey, California.
1 Chairman, Underseas Warfare Committee, National Research Council, 2101 Constitution Avenue, Washington, D. C.
1 Dr. J. H. McMillen, National Science Foundation, 1520 H Street, N. W., Washington, D. C.
3 Director, National Bureau of Standards, Washington 25, D. C., for distribution as follows:
1 - Fluid Mechanics Section 1 - Dr. G. H. Keulegan (National Hydraulic Laboratory) 1 - Mr. E. V. Hobbs.
1 Director, National Aeronautics and Space Administration, 1512 H Street, N. W., Washington 25, D. c.
1 Director, Ballistics Research Laboratory, Department of the Army, Aberdeen Proving Ground, Aberdeen, Maryland.
2 Langley Research Center, National Aeronautics and Space Administration, Langley Field, Virginia, for distribution as follows:
1 - Director 1 - Mr. J. B. Parkinson.
1 Commander, Air Research and Development Command, P. O. Box 1395, Baltimore 18, Maryland, Attn: Fluid Mechanics Division.
1 Director, Waterways Experiment Station, Box 631, Vicksburg, Mississippi.
1 Beach Erosion Board, U. S. Army Corps of Engineers, Washington 25, D. c.

Copies
1
53
Organization
Office of Ordnance Research, Department of the Army, Washington, D. C.
1 Office of the Chief of Engineers, Department of the Anny, Gravelly Point, Washington 25, D. C.
1 Commissioner, Bureau of Reclamation, Washington 25, D. c.
5 ASTIA Document Service Center, Arlington Hall Station, Arlington 12, Virginia.
1 Office of Technical Services, Department of Commerce, Washington 25, Do Co
1 Division of Applied Mathematics , Brown University, Providence 12, Rhode Island.
3 University of California, Berkeley 4, California, for distribution as follows :
1 - Professor H. A. Einstein, Department of Engineering 1 - Professor J. W. Johnson, Fluid Mechanics Laboratory 1 - Professor H. A. Schade , Director of Engineering Research.
1 Dr. R. R. Revelle, Director, Scripps Institute of Oceanography, Univers ity of California, La Jolla, California.
3 California Institut e of Technology, ~drodynamics Laboratory, Pasadena, California, Attn : Professor F. C. Lindvall , Chairman, Steering Committee.
1 Director, ~aulic Laboratory, Carnegie Institute of Technology, Pittsburg 13, Pennsylvania.
1 Case Institute of Technology, Department of Mechanical Engineering, Cleveland, Ohio, Attn . Professor G. Kuerti.
1 Colorado State College, Department of Civil Engineering, Fort Collins, Colorado, Attn , Professor M. L. Albertson.
1 Director,Fluid Mechanics Laboratory, Columbia University, New York 27, New York.
1 Cornell Uni versi ty, Graduate School of Aeronautical Engineering, Ithaca, New York, Attn : Professor W. R. Sears, Director.
1 Harvard University, Department of Mathematics, Cambridge 38, Massachusetts, Attn : Professor G. Birkhoff.
1 Indiana University, Department of Mathematics , Bloomington, Indiana, Attn : Professor D. Gilbarg.

54
Copies Organization
2 State University of Iowa, Iowa Institute of Hydraulic Research, Iowa City, Iowa, for distribution as follOl-IS:
1 - Dr. Hunter Rouse, Director 1 - Dr. L. Landweber.
1 Director, Applied Physics Laboratory, Johns Hopkins University, 8621 Georgia Avenue, Silver Spring, Maryland.
2 University of Maryland, College Park, Maryland, for distribution as follows ,
1 - ProfessorM. H. Martin, Director, Institute for Fluid Dynamics and Applied Mathematics
1 - Professor A. Weinstein, Department of Mathematics,
3 Massachusetts Institute of Technology, Cambridge 39, Massachusetts, for distribution as follows:
1 - Professor A. T. Ippen, Hydrodynamics Laboratory 1 - Department of Naval Archi te cture 1 - Professor M, A. Abkowitz, Departmentof Naval Architecture
and Marine Engineering.
1 Michigan State College, Hydraulics Laboratory, East Lansing, Michigan, Attn , Professor H. R. Henry.
2 University of Michigan, Ann Arbor, Michigan, for distribution as follows :
1 - Technical Library, Department of Naval Architecture 1 - Professor J. S. McNown, Applied Mechanics Department.
1 St. Anthony Falls Hydraulic Laboratory, University of Minnesota, Minneapolis 14, }O\.innesota, Attn : Dr. Lorenz G. straub, Director.
2 New York University, Institute of Mathematical Sciences, 25 Waverly Place, New York 3, New York, for distribution as follows :
1 - Professor R. Courant, Director 1 - Professor J. J. Stoker.
1 Universityof Notre Dame, College of Engineering, Notre Dame, Indiana, Attn : De an K, E. Schoenherr,
1 Director, Hydraulics Laboratory, Pennsylvania State University, University Park, Pennsylvania.
1 Princeton University School of Engineering, Princeton, New Jersey, Attn: Professor A. D. Hay.
2 Stanford University, Stanford, California,for distribution as follows :
1 - Applied Mathematics and Statistics Laboratory 1 - Professor L. I. Schiff, Department of Physics.
1 Stevens Institute of Technology, Elcperimental Towing Tank, 711 Hudson Street, Hoboken, New Jersey.

Copies
1
1
1
1
1
1
1
1
1
1
1
1
1
1
1
1
1
55
Organization
Webb Institute of NavalArchite cture, Crescent BeachHead, Glen Cove, Long Island, New York, Attn , Teclmical Library.
Worcester Polytechnic Institute , Alden Hydraulic Laboratory, Worcester, Massachusetts, Attn , Professor L. J. Hooper, Director.
Director, Woods Hole Oceanographic Institute, Woods Hole, Massachusetts.
The Martin Company, Bal timere 3, Maryland, via Bureau of Aeronautics Representative, Baltimore, Maryland,
Grumman Aircraft Engineering Corporation, Bethpage, Long Island, New York, via Bureau of Aeronautics Representative, Bethpage, Long Island, New York,
Edo Corporation, College Point, New York, via Bureau of Aeronautics Representative, Elmhurst, Long Island, New York.
Aerojet General Corporation, 6352 N, IrvindaleAve., Azuza, California, Attn , Mr, C, A. Gangwer,
CONVAIR, Divisionof General Dynamics Corporation, Fort Worth, Texas, via Bureau of Aeronautics Representative, Dallas, Texas.
Officeof Cbief of Engineers, Departmentof the Army, Marine Branch, Philadelphia, Pennsylvania.
Officer in Charge, U. S. Naval Civil Engineering Rese arch and EvaluationLaboratory, Port Hueneme, California, Attn: Mr,J, T. O'Brien.
Mr. Albert F. Bird, Coordinating Committee on Equipment and Supplies , Office of the Assistant Secretaryof Defense (Research and Engineering) , Department of Defense, Washington 25, D. c.
Commanding Officer, U. S. Army TransportationResearch and Engineering Command, Fort Eustis, Virginia, Attn , Chief, Technical Services Division"
VADM W. Mack Angas, USN (Ret.), Chairman, Department of Civil Engineering, Princeton University, Princeton, New Jersey,
Directorof Research, National Aeronautics and Space Administration, Lewis Research Center, 21000 Brookpark Road, Cleveland 35, Ohio,
Civil Engineering Department, Northwestern Uni versi ty, Te chnological Institute, Evanston, Illinois, Attn: Professor ],allis Hamilton.
Office of the Marine Corps Liason Officer, U. S. Army Transportation School, Fort Eustis, Virginia.
HYdronautics, Incorporated, 200 MonroeStreet, Rockville Maryland, Attn, Mr. Phillip Eisenberg, Mr. Marshall P. Tulin.