experimental studies on azo derivatives as new inhibitors
TRANSCRIPT

International Journal of Scientific & Engineering Research Volume 9, Issue 8, Augsut-2018 365 ISSN 2229-5518
IJSER © 2018 http://www.ijser.org
Experimental studies on azo derivatives as new inhibitors for corrosion of carbon steel
in acidic media F. Sh. Mohamed1, H. M. Abu Elnader2, H. S. Samra1, A. A. El-Bindary1*
1 Chemistry Department, Faculty of Science, Damietta University, Damietta 34517, Egypt. 2 Chemistry Department, Faculty of Science, Mansoura University, Mansoura, Egypt. * Corresponding author Email: [email protected]
Abstract— The corrosion inhibition effect of some azo derivatives, namely: (E)-2-(5-phenyl-4,5-dihydro-1H-pyrazol-3-yl)-4-(phenyldiazenyl)phenol (L1), (E)-4-((4-methylphenyl)diazenyl) -2-(5-phenyl-4,5-dihydro-1H-pyrazol-3-yl)phenol (L2) and (E)-4-((4-bromophenyl)diazenyl)-2-(5-phenyl-4,5-dihydro-1H-pyrazol-3-yl)phenol (L3) on carbon steel(CS) in 1 M HCl solution was studied by using mass loss (ML) technique, potentiodynamic polarization (PP) measurements, electrochemical frequency modulation (EFM) and electrochemical impedance spectroscopy (EIS). The adsorption isotherm of azo ligands on the CS surface follows Langmuir adsorption isotherm. Some thermodynamic parameters were calculated and discussed. It was found that the adsorption process increases, in the same direction as inhibition efficiency (%IE). The morphology of inhibited CS was analyzed by scanning electron microscope (SEM), the energy dispersive X-ray spectroscopy (EDX), and atomic force microscopy (AFM) that deduced the inhibitor produce thin film adsorbed in the surface of CS. All techniques were used to investigate the mechanism of corrosion inhibition is mixed type anodic and cathodic inhibitor and decreases the double layer capacitance in hence increasing the charge transfer resistance. The results obtained from chemical and electrochemical techniques are in good agreement.
Index Terms— Adsorption, Corrosion inhibition, CS, HCl, SEM, EDX, AFM
—————————— ——————————
INTRODUCTION nhibitor is a keyword in the case of corrosion prevention by altering the chemistry of corrosive media. The use of inhibitors is one of the most practical methods to protect
against corrosion especially in acidic conditions [1, 2]. The interaction between the metal surface and heteroatoms like nitrogen, oxygen, and sulfur plays remarkable role in the corrosion inhibition due to the free electron pairs that possess [3–7]. Besides, the compounds that contain p bonds generally show good inhibition efficiency providing electrons via the p-orbitals [8]. A few azo derivatives have been exposed to be higher corrosion hindrance for metals for example: 4-phenylazo-3-methyl-2-pyrazolon-5-one and three of its derivatives examined as hindrance for CS corrosion in 2.0M HCl [9]. (HQAP) 8-quinolinol-5-azoantipyrine, was planned as an inhibitor for mild steel corrosion in HCl [10]. The effect of Azo dye compound based on chromotropic acid has been studied on steel corrosion in sulfuric acid [11-13]. thiophene azo dye results as corrosion hindrance for CS in 2.0M HCl[14]. The effect of 1-methyl-3-pyridin-2-yl-thiourea on the corrosion resistance of MS in sulfuric acid [15]. The effect of some prepared surfactants based on azodye and Schiff base as corrosion hindrance for steel in medium contain acid [16]. However, researches around metal complexes as corrosion hindrance for CS in acid are very partial in literature [17, 18]. The present data showed that those inhibitors act by adsorption on the metal/solution interface. This phenomenon could happen via: (i) electrostatic attraction
between the charged metal and the charged inhibitor molecules, (ii) dipole- dipole type interaction between unshared electron pairs in the inhibitor with the metal, (iii) π electron interaction with the metal, and (iv) combination of all of the above [19].These compounds can adsorb on the CS surface blocking the active sites and thus decrease the corrosion rate. The present work deals with the synthesis of some azo derivatives and uses these derivatives as corrosion inhibitors for CS in HCl solution. The efficiency of these derivatives was evaluated at various concentrations and temperatures. The selection of these compounds is based on: a) are highly soluble in the test medium, and b) contain polar functional groups (such as –CN, N=N and C=O) and multiple bonds (double bonds and triple bonds) and extensive conjugation in the form of aromatic ring through which they can adsorb on metal surface c) easily prepared and d) have high molecular sizes In this study, we studied the effect of the ligand compounds as corrosion inhibitors of CS in 1 M HCl. The chemical and electrochemical techniques measurements have used in this study. The surface morphology of the CS specimens has evaluated.
EXPERIMENTAL Materials and solution The CS used in this study had the chemical composition (weight %), C 0.2, Mn 0.35, P 0.024, Si 0.003 and rest Fe. The aggressive solution, 1 M HCl was prepared by dilution of analytical grade (37 %) HCl with bi-distilled water. The concentration range of the inhibitors used was 5x10⁻⁶-
I IJSER

International Journal of Scientific & Engineering Research Volume 9, Issue 8, Augsut-2018 366 ISSN 2229-5518
IJSER © 2018 http://www.ijser.org
21x10-6 M Inhibitors and chemicals The inhibitors (ligands (Ln)) were synthesized in the laboratory according to a previously described experimental procedure [20] purified and characterized by NMR, IR spectroscopy and elemental analysis before use. The concentration range of the inhibitors (Ln) used was 5x10⁻⁶-21x10-6 M. All the experiments were performed at 25°C Preparation of 3-(2-hydroxyphenyl)-1-phenyl-2-propenone. Acetophenone (0.01 mol) and salicaldehyde (0.01 mol) were mixed in ethanol (40 ml) in a round bottom flask placed in ice bath with stirring. To the previous solution we added NaOH (10 ml, 60%) dropwise with constant stirring for 30 min. The mixing was continued for another 3 hrs at room temperature. The solution was diluted with cold distilled water (40 ml) and neutralized with 2 N HCl. The yellowish white precipitate was filtered off, washed with cold water and recrystallized from methanol. Yield 75%; m.p. 155 °C; FTIR (KBr) (ν cm-1): 3425 υ(OH), 1670 υ(C=O) cm-1. Anal. %: Calculated for (C15H12O2, 224.26): C, 80.34; H, 5.39. Found: C, 80.38; H, 5.35. Preparation of 3-(2-hydroxyphenyl)-5-phenyl-4,5-dihydro-1H-pyrazole 3-(2-hydroxyphenyl)-1-phenyl-2-propenone (0.01 mol) was mixed with hydrazine hydrate (0.01 mol) in 20 ml ethanol and refluxed for 4 hrs on hot plate. The solution was poured in a beaker and leave to cool. The precipitate has collected by filtration, washed with cold ethanol and recrystallized from ethanol. Yield 70%; m.p. 188 °C; FTIR (KBr) (ν cm-1): 3440 υ(OH), 1585 υ(C=N) cm-1. Anal. %: Calculated for (C15H14N2O, 238.29): C, 75.61; H, 5.92; N, 11.75. Found: C, 75.58; H, 5.90; N, 11.72. Preparation of 3-(2-hydroxy-5-(4-arylazo))-5-phenyl-4,5-dihydro-1H-pyrazole (Ln) The azo compounds of 3-(2-hydroxy-5-(4-arylazo))-5-phenyl-4,5-dihydro-1H-pyrazole (Ln) were prepared [20] by the following two steps: Step 1: Aniline or its p-derivatives (0.01 mol) was dissolved in a (20 mL) of 3M hydrochloric acid and the solution was cooled in an ice bath to 0 °C. The freshly prepared NaNO2 solution (0.01 mol, 30 ml H2O) was added with stirring in which the temperature remains below 0 °C. The solution was kept in the ice bath and immediately preceded to the next step. Step 2: The cooled solution of 3-(2-hydroxyphenyl)-5-phenyl-4,5-dihydro-1H-pyrazole (0.01 mol) in (0.01 mol KOH/ethanol, 40 ml) was added slowly to the diazonium salt solution (step 1). The mixture was stirred for 30 min. until completion of precipitation. The solid azo dye was collected by filtration, washed several times with water, dried in a vacuum desiccator over anhydrous CaCl2. The formed azo compounds (Scheme. 1) were recrystallized from ethanol to give colored crystals of compounds (L1-L3). The formed azo compound was recrystallized from ethanol
to give orange colored crystals of compounds (L1-L3): L1 = (E)-2-(5-phenyl-4,5-dihydro-1H-pyrazol-3-yl)-4-(phenyldiazenyl)phenol. L2 = (E)-4-((4-methylphenyl) diazenyl) -2-(5-phenyl-4,5-dihydro-1H-pyrazol-3-yl)phenol. L3 = (E)-4-((4-bromophenyl) diazenyl)-2-(5-phenyl-4,5-dihydro-1H-pyrazol-3-yl)phenol. (L1): Yield 70%; m.p. 165 °C; FTIR (KBr) (ν cm-1): 3417 (OH), 3341-3321 (NH), 1596 (C=N) 1500 (N=N); 1H-NMR (DMSO-d6): δ 2.48 (d, 1H, C5-H pyrazoline), 2.79 (d, 1H, C5-H pyrazoline), 3.36-3.79 (m, 2H, CH2, C4-H pyrazoline, 5.04 (br, s, 1H, OH), 7.00–8.00 (m, 14H, Ar-H and NH); MS m/z (M+) 342; Anal. %: Calculated for (C21H18N4O, 342.40): C, 73.67; H, 5.30; N, 16.36. Found: C, 73.55; H, 5.28; N, 16.45. (L2): Yield 65%; m.p. 173 °C; FTIR (KBr) (ν cm-1): 3409 (OH), 3299 (NH), 1596 (C=N) 1500 (N=N). 1H-NMR (DMSO-d6): δ 2.29 (s, 3H, CH3), 2.45 (d, 1H, C5-H pyrazoline), 2.49 (d, 1H, C5-H pyrazoline), 3.36-3.79 (m, 2H, CH2, C4-H pyrazoline, 5.11 (br, s, 1H, OH), 7.00–8.00 (m, 13H, Ar-H and NH); MS m/z (M+) 356. Anal. %: Calculated for (C21H18N4O, 356.43): C, 74.14; H, 5.66; N, 21.85. Found: C, 73.98; H, 5.58; N, 21.74. (L3): Yield 65%; m.p. 154 °C; FTIR (KBr) (ν cm-1): 3449 (OH), 3341 (NH), 1598 (C=N) 1500 (N=N). 1H-NMR (DMSO-d6): δ (d, 1H, C5-H pyrazoline), 2.69 (d, 1H, C5-H pyrazoline), 3.36-3.79 (m, 2H, CH2, C4-H pyrazoline, 6.42 (br, s, 1H, OH), 7.00–8.00 (m, 12H, Ar-H), 9.02 (s, 1H, NH); MS m/z (M+) 421. Anal. %: Calculated for (C21H18N4O, 421.34): C, 59.86; H, 4.07; N, 13.30. Found: C, 59.80; H, 4.00; N, 13.20.
NN
OH
N
NH
R
R = -H (L1), -CH3 (L2) and –Br (L3) Scheme 1: Structure of the ligands (L1, L2 and L3).
METHODS Chemical measurements
A. Mass loss measurements Mass loss measurements were performed on CS coupons with dimensions 2cm x 2cm x 0.2 cm in 1 M HCl solution with different concentrations of the inhibitors. The coupons were abraded with a series of emery papers of different grit sizes up to 1200, dried, weighted, and then suspended in 100 ml solution of HCl without and with different concentrations of the studied inhibitors for exposure period of 3 hours at the temperature range from 25 to 40°C. At the end of tests, the coupons were rinsed with bidistilled water, degreased with acetone, washed thoroughly again with bidistilled water, dried by filter papers, and weighed again. Experiments were carried out in triplicate to get good reproducibility.
IJSER
International Journal of Scientific & Engineering Research Volume 9, Issue 8, Augsut-2018 367 ISSN 2229-5518
IJSER © 2018 http://www.ijser.org
B. Electrochemical measurements Electrochemical experiments used CS specimen of the same composition was mounted in glass rod with an exposed area of 1cm2. An epoxy resin was used to fill the space between glass rod and CS electrode. The electrochemical measurements (potentiodynamic polarization (PP), EIS and EFM techniques) were performed in a conventional three-electrode glass cell with CS specimen as working electrode, platinum sheet as counter electrode, and a saturated calomel electrode (SCE) as reference electrode. Prior to each experiment, the electrode was treated as in ML measurements. The electrode potential was allowed to stabilize for 30 min before starting the measurements. For PP the electrode potential automatically changed from -600 to +400 mV vs open circuit potential (EOCP) with a scan rate of 1 mVs-1. For (EIS) measurements experiments were conducted in the frequency range of 100 kHz to 10 mHz at open circuit potential (OCP). The amplitude was 5 mV. For (EFM) measurements experiments were carried out using two frequencies 2 and 5 Hz. The base frequency was 1Hz with 32 cycles, so the waveform repeats after 1s. A perturbation signal with amplitude of 10 mV was used. The choice for the frequencies of 2 and 5 Hz was based on three principles [21]. Electrochemical measurements were performed with a Potentiostat /Galvanostat/ZRA (Gamry PCI 300/4) and a personal computer with DC105 software for DC corrosion measurements, EIS300 software for EIS measurements and EFM140 software for EFM measurements. Echem Analyst software 5.1 was used for plotting, graphing and fitting data. The measurements were carried out.
Surface Examinations The specimens of CS used for surface morphology examination were immersed in 1 M HCl in the absence (blank) and presence of Ln at 25°C for 1day. The analysis was performed using scanning electron microscope (JEOL JSM-5500, Japan). Rough elemental analyses for the exposed surface were conducted by EDX technique. The shape of the surface of metal pieces was investigated by Atomic force microscopy (AFM) by used on a Pico SPM2100 AFM device operating in contact mode in air at Nanotechnology Laboratory, Faculty of Engineering Mansoura University.
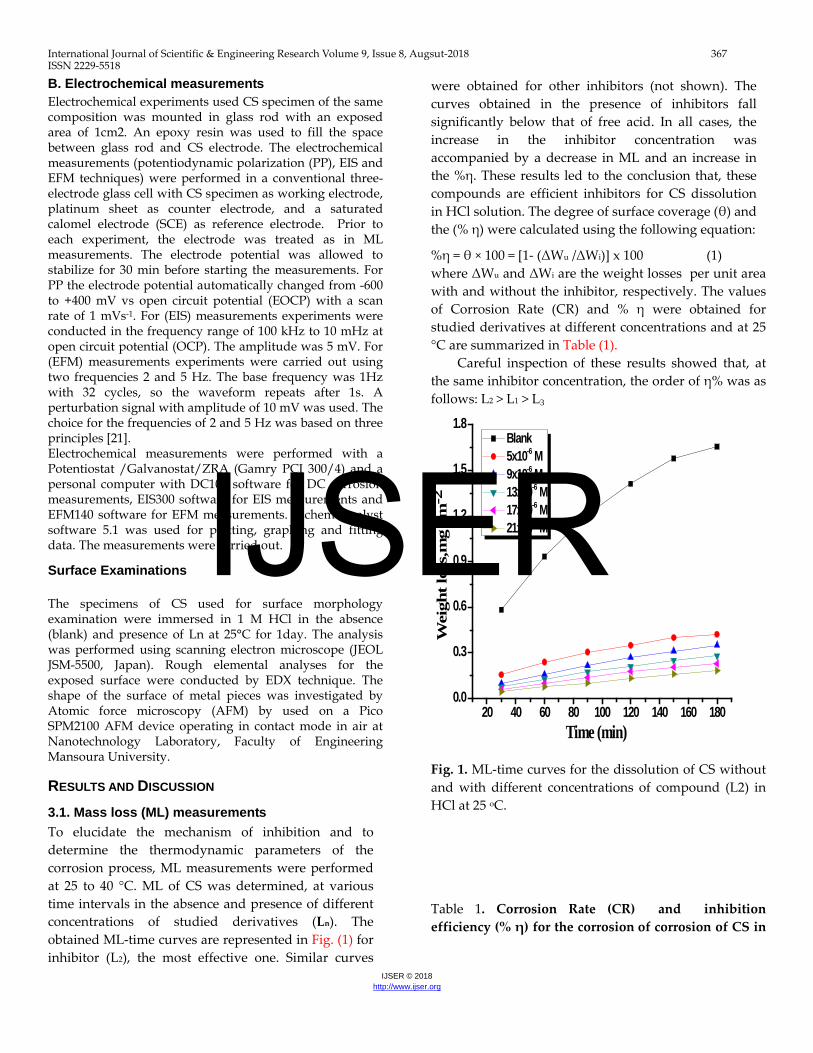
RESULTS AND DISCUSSION 3.1. Mass loss (ML) measurements To elucidate the mechanism of inhibition and to determine the thermodynamic parameters of the corrosion process, ML measurements were performed at 25 to 40 °C. ML of CS was determined, at various time intervals in the absence and presence of different concentrations of studied derivatives (Ln). The obtained ML-time curves are represented in Fig. (1) for inhibitor (L2), the most effective one. Similar curves
were obtained for other inhibitors (not shown). The curves obtained in the presence of inhibitors fall significantly below that of free acid. In all cases, the increase in the inhibitor concentration was accompanied by a decrease in ML and an increase in the %η. These results led to the conclusion that, these compounds are efficient inhibitors for CS dissolution in HCl solution. The degree of surface coverage (θ) and the (% η) were calculated using the following equation:
%η = θ × 100 = [1- (ΔWu /ΔWi)] x 100 (1) where ΔWu and ΔWi are the weight losses per unit area with and without the inhibitor, respectively. The values of Corrosion Rate (CR) and % η were obtained for studied derivatives at different concentrations and at 25 °C are summarized in Table (1).
Careful inspection of these results showed that, at the same inhibitor concentration, the order of η% was as follows: L2 > L1 > L3
20 40 60 80 100 120 140 160 1800.0
0.3
0.6
0.9
1.2
1.5
1.8 Blank 5x10⁻⁶ M 9x10⁻⁶ M 13x10-6 M 17x10-6 M 21x10-6 M
Wei
ght
loss
,mg
cm-2
Time (min)
Fig. 1. ML-time curves for the dissolution of CS without and with different concentrations of compound (L2) in HCl at 25 oC.
Table 1. Corrosion Rate (CR) and inhibition efficiency (% η) for the corrosion of corrosion of CS in
IJSER

International Journal of Scientific & Engineering Research Volume 9, Issue 8, Augsut-2018 368 ISSN 2229-5518
IJSER © 2018 http://www.ijser.org
1 M HCl and with different concentrations of studied derivatives at 25°C and at 120 min immersion.
Conc.
M
A B C
CR x102
mg cm-
2 min-1
% η
CR x102
mg cm-
2 min-1
% η
CR x102
mg cm-
2 min-1
% η
5 x10⁻⁶ 2.78 76.3 3.33 71.6 3.11 73.5
9 x10⁻⁶ 2.04 82.6 2.68 77.1 2.49 78.7
13x10-6 1.53 86.9 1.99 83 1.99 83
17 x10-6 1.26 89.3 1.30 88.9 1.53 86.9
21x10-6 0.973 91.7 1.11 90.5 1.34 88.5
3.1.1 Adsorption isotherm behavior
The nature of corrosion inhibition has been deduced in terms of the adsorption characteristics of the inhibitors. Metal surface in aqueous solution is always covered with adsorbed water dipoles. Therefore, adsorption of inhibitor molecules from aqueous solution is a quasi-substitution process. The (θ) for different concentrations of the inhibitors has been evaluated from ML measurements. The data were tested graphically by fitting to various isotherms. A straight line with correlation coefficient nearly equal to 1.0 (R2 > 0.9) was obtained on plotting (θ/1-θ) against C suggesting adsorption of studied derivatives on CS surface followed Langmuir adsorption isotherm model Fig. (2). According to this isotherm, the θ is related to inhibitor concentration by:
(θ/1- θ) = KC (2)
where C is the concentration (mol L–1) of the inhibitor in the bulk electrolyte, θ is the degree of surface coverage ( θ= IE / 100) and Kads is the adsorption equilibrium constant of the inhibitor adsorption. The free energy of adsorption ΔG°ads was calculated from the following equation:
ΔG°ads= - RT ln (55.5 K) (3)
where 55.5 is the concentration of water in solution in mol l-1, R is the universal gas constant and T is the absolute temperature. The ΔG°ads was calculated using Eq. (3) where one molecule of water is replaced by one molecule of inhibitor [22]. The values of ΔG°ads and Kads are given in Table (2). The negative sign of ΔG°ads
indicates that the adsorption of these inhibitors on the CS surface is a spontaneous process. Generally, the magnitude of ΔG°ads around-20 kJ mol-1 or less negative indicates electrostatic interaction between inhibitor and the charged metal surface (i.e. physisorption). Those around - 40 kJ mol-1 or more negative indicative of charge sharing or transferring from the inhibitor molecules to the metal surface to form a co-ordinate type of bond (i.e. chemisorptions) [23, 24]. In the present work, the calculated values of ΔG°ads of these inhibitors Table (2) are about-20 kJ mol-1 or less, which indicated that adsorption of these inhibitors on CS surface takes place via physisorption. Large values of Kads mean better inhibition efficiency of the inhibitors, i.e., strong electrical interaction between the double-layer existing at the phase boundary and the adsorbing inhibitor molecules (which is in our case). Small values of Kads,
however, reveal that such interactions between adsorbing inhibitor molecules and the metal surface are weaker, indicating that the inhibitor molecules are easily removable by the solvent molecules from the metal surface [25].
0.00005 0.00010 0.00015 0.00020
2
4
6
8
10 25 oC,R2 =0.991 30 oC,R2 =0.995 35 oC,R2 =0.993 40 oC,R2 =0.994
θ / θ - 1
C , M
Fig. 2. Langmuir adsorption isotherm plotted as (θ/1- θ) vs. C of the investigated inhibitors for corrosion of CS in 1 M HCl solution from ML method at 25oC.
Table 2. Kads and ΔG˚ads for the adsorption of inhibitors
on CS in 1 M HCl from ML method at 25 oC.
IJSER

International Journal of Scientific & Engineering Research Volume 9, Issue 8, Augsut-2018 369 ISSN 2229-5518
IJSER © 2018 http://www.ijser.org
-ΔS˚ads. J mol-
1K-1
-ΔH˚ads. kJ mol-
1
-ΔG˚ads. kJ mol-1
Kads M-1
Temp. ˚C Compound
64.6
11.8
20.4 45 25
L2 63.5 20.1 36 30
62.3 19.9 31 35
61.3 19.6 28 40
64.5
16.1
20.0 41 25
L1 62.9 19.8 34 30
61.1 19.3 27 35
60.2 19.1 24 40
59.2
18.2
18.4 36 25
L3 57.2 18.1 29 30
54.9 17.9 22 35 54.5 17.8 19 40
3.1.2 Effect of Temperature
The temperature is the accelerating factor in most of chemical reactions. It increases the energy of the reacted species, as a result, chemical reaction get much faster. The corrosion reaction is a chemical reaction in which the CS atoms at the metal surface react with the negatively charged anions (OH-, SO42-, Cl-, etc.). Hence, increasing temperature of the environment increases the activation energy of the CS atoms at the metal surface and accelerates the corrosion process of CS in the acidic media. The effect of temperature on the η of the tested inhibitors was determined in the absence and presence of different inhibitors at concentrations of 5× 10⁻⁶ - 21× 10-
6 M at 25 – 40 °C. In examining the effect of temperature on the corrosion of CS in presence of studied inhibitors in 1 M HCl solution, Arrhenius Eq. (4) was used [26]. Arrhenius – type plot:
kcorr = A exp (-Ea* / RT) (4)
where E*a is the apparent activation energy and A is the frequency factor.
Plots of log kcorr (corrosion rate) against 1/ T Fig. (3) for CS in 1 M HCl, gave straight lines with slope of - E*a/2.303R at which the activation energies were calculated and represented in Table (3). Activation parameters for corrosion of CS were calculated from transition state- type equation:
kcorr =RT / Nh exp (∆S*/R) exp (-∆H* / RT) (5)
The relation between log kcorr / T vs. 1 / T gives straight lines Fig. (4), from their slopes and intercepts, ∆H* and ∆S* can be calculated and their values are represented in Table (3).
The results of Table (3) revealed that, the presence of inhibitors increases the activation energies of CS indicating strong adsorption of the inhibitor molecules on the metal surface and the presence of these additives induces energy barrier for the corrosion reaction and this barrier increases with increasing the inhibitor concentrations. Higher activation energy means lower reaction rate and the opposite is true. The increase in activation energy with inhibitor concentration is often interpreted by physical adsorption with the formation of an adsorptive film of an electrostatic character [27]. Values of ΔH* are positive. This indicates that the corrosion process is an endothermic one. The entropy of activation is large and negative. This implies that the activated complex represents association rather than dissociation step, indicating that a decrease in disorder takes place, from reactants to the activated complex [28].
0.0030 0.0031 0.0032 0.0033 0.0034
0.0
0.4
0.8
1.2
1.6
2.0
Blank R2=98 5x10⁻⁶ M R2=98 9x10⁻⁶ M R2=98 13x10-6 M R2=98 17x10-6 M R2=98 21x10-6 M R2=98
Log k
corr
,mg c
m2
min
-1
1000/T,K-1
Fig. 3. Arrhenius plots (log kcorr vs. 1/ T) for the corrosion of CS in 1 M HCl in the absence and presence of different concentrations of inhibitor (L2).
IJSER

International Journal of Scientific & Engineering Research Volume 9, Issue 8, Augsut-2018 370 ISSN 2229-5518
IJSER © 2018 http://www.ijser.org
0.0030 0.0031 0.0032 0.0033 0.0034
-2.4
-2.0
-1.6
-1.2
-0.8
-0.4
Blank R2=98 5x10⁻⁶ M R2=98 9x10⁻⁶ M R2=98 13x10-6 M R2=98 17x10-6 M R2=98 21x10-6 M R2=98
Log k
/T ,m
g cm2 m
in-1 K-1
1000/T,K-1 Fig. 4. Plots of (log kcorr / T) vs. 1/ T for the corrosion of CS in 1 M HCl in the absence and presence of different concentrations of inhibitor (L2). Table 3. Thermodynamic activation parameters for the dissolution of CS in the absence and presence of different concentration of investigated derivatives.
Δ- S* J mol-1
K-1
Δ H* kJ mol-1
Ea*
kJ mol-
1 Conc. M
35.6 54.6 56.8 Blank Ligand (L2)
21.2 62 64.6 5x10⁻⁶ 20.4 62.7 65.3 9x10⁻⁶ 19.1 64.3 66.9 13x10-6 17.1 67.5 70.1 17x10-6 16.2 69 71.6 21x10-6
Ligand (L1) 25.7 60.8 63.4 5x10⁻⁶ 24.1 62.1 64.7 9x10⁻⁶ 22.1 64.3 66.5 13x10-6 21.3 65.4 67.9 17x10-6 20.1 66.3 68.9 21x10-6
Ligand (L3) 28.4 60.1 62.7 5x10⁻⁶ 27.5 61.1 63.7 9x10⁻⁶ 27.3 61.9 64.5 13x10-6 26.3 62.6 65.2 17x10-6 25.9 63.3 65.9 21x10-6
3.2. Electrochemical measurement
3.2.1. Potentiodynamic polarization (PP) method PP measurements were carried out to obtain Tafel plots in the absence and presence of various concentrations of the inhibitors. Fig. (5) shows the polarization curves in the absence and presence of inhibitor (L2). Similar curves were obtained for other inhibitors (not shown). It is observed that the current density of the anodic and cathodic branch is displaced towards lower values. This displacement is more evident with the increase in concentration of the inhibitors when compared to the blank material. The electrochemical parameters of corrosion such as corrosion current density icorr, corrosion potential Ecorr, corrosion rate C.R., anodic Tafel constants βa, cathodic Tafel constants βc and inhibition efficiency ηTafel (%) are given in Table (4). The inhibition efficiency (ηTafel %) was calculated from polarization curves as follows [29] :
ηTafel% = [1- ( icorr / iocorr)] x 100 (6)
where iocorr and icorr correspond to uninhibited and inhibited corrosion current densities, respectively.
It appears that inhibition occurred by a blocking mechanism on the available metal spaces [30]. The corrosion potential displayed small change in the range ±11 mV around the corrosion potential of - 400 mV. These results indicated that the presence of inhibitors affect both CS dissolution and hydrogen evolution; consequently these inhibitors can be classified as mixed corrosion inhibitors. According to the results in Table (4) the order of the inhibition efficiency was as follows: L2 > L1 > L3. It is important to note that there exists a difference in inhibition efficiency determined by WL and polarization methods. This may be, due to the longer time taken in case of weight loss (3 h) than in case of polarization method (30 min after reaching OCP).
IJSER

International Journal of Scientific & Engineering Research Volume 9, Issue 8, Augsut-2018 371 ISSN 2229-5518
IJSER © 2018 http://www.ijser.org
-1.0 -0.8 -0.6 -0.4 -0.2 0.0
1E-6
1E-5
1E-4
1E-3
0.01
Blank 5x10⁻⁶ M 9x10⁻⁶ M 13x10-6 M 17x10-6 M 21x10-6 M
log
i , m
A c
m-2
E, mV (vs SCE)
Fig. 5. Potentiodynamic polarization curves for the dissolution of CS in 1 M HCl in the absence and presence of different concentrations of inhibitor (L2) at 25 °C.
Table 4. Electrochemical kinetic parameters obtained from potentiodynamic polarization technique for the corrosion of CS in 1 M HCl at different concentrations of investigated inhibitors at 25 °C.
% η θ CR mmy-1
βc
mV dec-1
βa
mV dec-1
-Ecorr vs
SCE, mV
icorr
μA cm-2
Conc. x106, M Inh.
-- -- 1063 240 185 445 1100 0 Blank 73.2 0.732 265.6 189 96 465 295 5
L2 80.9 0.809 187.4 161 82 458 210 9
84.6 0.846 143.9 201 78 474 169 13
88.5 0.885 113.9 162 54 463 126 17
91.5 0.915 82.2 140 45 479 93 21 66.8 0.668 329.6 185 106 435 365 5
L1 77.9 0.779 211.8 175 87 455 243 9
83.5 0.835 171.9 184 78 456 181 13
87.3 0.873 118.3 180 77 462 140 17
90.0 0.900 84.5 145 48 476 110 21 58.0 0.580 432.9 178 108 432 462 5
L3 76.0 0.760 237.1 281 143 473 264 9
81.7 0.817 173.6 201 106 479 201 13
84.8 0.848 119.1 152 55 464 167 17
89.5 0.895 86.2 134 52 465 115 21 3.2.2. Electrochemical impedance spectroscopy
(EIS) method EIS measurements were carried out at 25°C in acid
solution with and without inhibitors. Figs. (6,7) shows the typical EIS diagrams obtained in 1 M HCl with and without inhibitor (L2). The charge transfer resistance (Rct) is calculated from the difference in impedance at lower and higher frequencies. The double layer capacitance (Cdl) and the frequency at which the imaginary component of impedance is maximal (-Zmax) are found as follow:
Cdl = (1/2πf.Rct) (7)
The equivalent circuit that describes our metal/electrolyte interface is shown in Fig. (8) where Rs, Rct and CPE refer to solution resistance, charge transfer resistance and constant phase element, respectively. EIS parameters and % η were calculated and tabulated in Table (5). As we notice, Fig. (6) the impedance diagrams consists of one large capacitive loop. In fact, the presence of inhibitors enhances the value of Rct in acidic solution indicating a charge-transfer process mainly controlling the corrosion of CS. The increase in Rct values, and consequently of inhibition efficiency, may be due to the gradual replacement of water molecules by the adsorption of
IJSER

International Journal of Scientific & Engineering Research Volume 9, Issue 8, Augsut-2018 372 ISSN 2229-5518
IJSER © 2018 http://www.ijser.org
the inhibitor molecules on the metal surface to form an adherent film on the metal surface and this suggests that the coverage of the metal surface by the film decreases the double layer thickness. Values of double layer capacitance decrease to the maximum extent in the presence of inhibitors. This decrease of Cdl at the metal/solution interface with increasing the inhibitor concentration can result from a decrease in local dielectric constant which indicates that the inhibitors were adsorbed on the surface at both anodic and cathodic sites [31]. Deviation of perfect circuit shape is often referred to the frequency dispersion of interfacial impedance. This anomalous phenomenon is generally attributed to the inhomogeneity of the metal surface arising from surface roughness or interfacial phenomena [32,33]. The impedance data confirm the inhibition behavior of the inhibitors obtained with other techniques. From the data of Table (5), it can be seen that the icorr values decrease significantly in the presence of these additives and the % η is greatly improved. The order of reduction in icorr exactly correlates with that obtained from potentiostatic polarization studies. Moreover, the decrease in the values of jcorr follows the same order as that obtained for the values of Cdl. It can be concluded that the inhibition efficiency found from weight loss, polarization curves and electrochemical impedance spectroscopy measurements are in good agreement.
0 50 100 150 200 250
0
20
40
60
80
100
Zreal, ohm cm-2
-Zim
ag, o
hm c
m-2
Blank 5x10⁻⁶M 9x10⁻⁶M 13x10-6M 17x10-6M21x10-6M
A
Fig. 6. The Nyquist plots (A) for CS in 1 M HCl solution in the absence and presence of different concentrations of inhibitor (L2) at 25 °C.
-1 0 1 2 3 4 5
0.2
0.4
0.6
0.8
1.0
1.2
1.4
1.6
1.8
2.0
2.2
2.4
2.6
Z ph, d
eg
log Z mo
d, ohm
cm-2
log F, Hz
Blank 5x10⁻⁶M 9x10⁻⁶M 13x10-6M 17x10-6M 21x10-6M
-70
-60
-50
-40
-30
-20
-10
0
10
20B
Fig. 7. The Bode plots (B) for CS in 1 M HCl solution in the absence and presence of different concentrations of inhibitor (L2) at 25 °C.
Table 5. Electrochemical kinetic parameters obtained from EIS technique for the corrosion of CS in 1 M HCl at different concentrations of investigated inhibitors at 25°C.
% η θ Cdl, μF
Rct, Ω cm2
Conc.,x106 M compounds
-- -- 160.1 16.3 0.0 blank
71.5 0.715 134.5 57.3 5
L2 78.4 0.784 117.6 75.5 9
85.1 0.851 95.5 109.5 13
87.9 0.879 88.9 135.1 17
92.7 0.927 72.4 224.8 21
61.6 0.616 136.8 42.6 5
L1 69.0 0.690 124.3 52.8 9
75.7 0.757 106.4 67.2 13
80.3 0.803 89.5 82.9 17
88.0 0.880 66.4 136.8 21
53.1 0.531 117.2 34.8 5
L3
66.7 0.667 100.9 49.1 9
76.0 0.760 78.0 68.2 13
81.5 0.815 70.2 88.3 17
85.3 0.853 54.6 111.3 21
Fig. 8. Electrical equivalent circuit used to fit the impedance data for CS in 1 M HCl solution.
IJSER
International Journal of Scientific & Engineering Research Volume 9, Issue 8, Augsut-2018 373 ISSN 2229-5518
IJSER © 2018 http://www.ijser.org
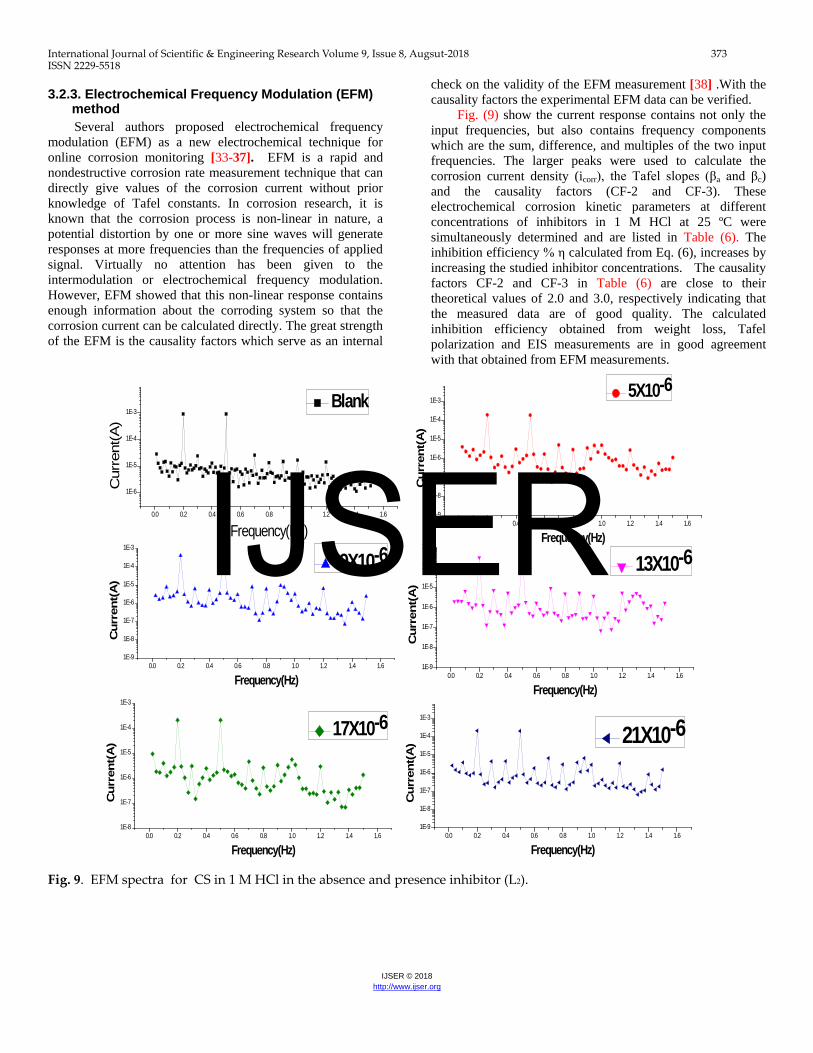
3.2.3. Electrochemical Frequency Modulation (EFM) method Several authors proposed electrochemical frequency
modulation (EFM) as a new electrochemical technique for online corrosion monitoring [33-37]. EFM is a rapid and nondestructive corrosion rate measurement technique that can directly give values of the corrosion current without prior knowledge of Tafel constants. In corrosion research, it is known that the corrosion process is non-linear in nature, a potential distortion by one or more sine waves will generate responses at more frequencies than the frequencies of applied signal. Virtually no attention has been given to the intermodulation or electrochemical frequency modulation. However, EFM showed that this non-linear response contains enough information about the corroding system so that the corrosion current can be calculated directly. The great strength of the EFM is the causality factors which serve as an internal
check on the validity of the EFM measurement [38] .With the causality factors the experimental EFM data can be verified.
Fig. (9) show the current response contains not only the input frequencies, but also contains frequency components which are the sum, difference, and multiples of the two input frequencies. The larger peaks were used to calculate the corrosion current density (icorr), the Tafel slopes (βa and βc) and the causality factors (CF-2 and CF-3). These electrochemical corrosion kinetic parameters at different concentrations of inhibitors in 1 M HCl at 25 ºC were simultaneously determined and are listed in Table (6). The inhibition efficiency % η calculated from Eq. (6), increases by increasing the studied inhibitor concentrations. The causality factors CF-2 and CF-3 in Table (6) are close to their theoretical values of 2.0 and 3.0, respectively indicating that the measured data are of good quality. The calculated inhibition efficiency obtained from weight loss, Tafel polarization and EIS measurements are in good agreement with that obtained from EFM measurements.
0.0 0.2 0.4 0.6 0.8 1.0 1.2 1.4 1.61E-9
1E-8
1E-7
1E-6
1E-5
1E-4
1E-3
0.0 0.2 0.4 0.6 0.8 1.0 1.2 1.4 1.61E-9
1E-8
1E-7
1E-6
1E-5
1E-4
1E-3
0.0 0.2 0.4 0.6 0.8 1.0 1.2 1.4 1.61E-9
1E-8
1E-7
1E-6
1E-5
1E-4
1E-3
0.0 0.2 0.4 0.6 0.8 1.0 1.2 1.4 1.61E-8
1E-7
1E-6
1E-5
1E-4
1E-3
0.0 0.2 0.4 0.6 0.8 1.0 1.2 1.4 1.61E-9
1E-8
1E-7
1E-6
1E-5
1E-4
1E-3
0.0 0.2 0.4 0.6 0.8 1.0 1.2 1.4 1.6
1E-6
1E-5
1E-4
1E-3C
urre
nt(A
)
Frequency(Hz)
5X10⁻⁶
Cur
rent
(A)
Frequency(Hz)
9X10⁻⁶
Cur
rent
(A)
Frequency(Hz)
13X10-6
Cur
rent
(A)
Frequency(Hz)
17X10-6
Cur
rent
(A)
Frequency(Hz)
21X10-6
Cur
rent
(A)
Frequency(Hz)
Blank
Fig. 9. EFM spectra for CS in 1 M HCl in the absence and presence inhibitor (L2).
IJSER

International Journal of Scientific & Engineering Research Volume 9, Issue 8, Augsut-2018 374 ISSN 2229-5518
IJSER © 2018 http://www.ijser.org
Table 6. Electrochemical kinetic parameters obtained from EFM technique for CS in 1 M HCl in the absence and presence of different concentrations of investigated derivatives.
% ηEFM CF-3 CF-2 βc ,
mV dec-1 βa,
mV dec-1 jcorr,
µA cm2 Conc., x106, M
Inhibitor
-- 2.9 1.8 117 100 1324 0.0 blank 83.8 2.7 1.8 97 90 215 5
L2 84.2 2.9 1.9 98 89 209 9
89.0 3.1 1.7 95 88 145 13
89.7 3.0 2.1 94 87 137 17 91.7 3.1 2.0 85 83 110 21 76.9 2.9 1.8 117 100 306 5
L1 80.4 3.1 1.8 97 85 260 9 83.4 3.0 2.2 100 88 220 13 85.6 2.9 1.9 97 90 190 17 90.6 3.0 2.0 98 89 125 21 69.7 2.9 2.1 102 88 401 5
L3 77.0 3.1 1.9 82 73 305 9
77.8 3.2 1.8 88 80 294 13
81.1 2.9 1.9 93 86 250 17 87.2 3.1 1.8 88 79 169.3 21
3.3. Surface Examinations
3.3.1. Scanning Electron Microscopy (SEM) Fig. (10), represents the micrography obtained for CS
samples in presence and in absence of azo derivatives after exposure for 1 day immersion. It is clear that CS surfaces help and severe corrosion attack in the blank sample. It is important to stress out that when the compound is present in the solution, the morphology of CS surfaces is quite different from the
previous one, and the specimen surface was smoother. We are obvious that the formation of a film which is distributed in order way on the whole surface of the CS. This may be due to the adsorption of the ligands on the CS surface and make the passive film in order to block the active site present on the CS surface. The inhibitors molecule interaction with active sites of CS surface, resulting in a decrease in the contact between CS and the corrosive medium and sequentially exhibited excellent inhibition effect [39-40].
Fig. 10. SEM micrographs for CS in the absence and presence of 21x10-6 M ligands after immersion for 1 day.
3.3.2. Energy Dispersion Spectroscopy (EDX) The EDX spectra were used to determine the elements
present on the surface of CS and after 1 day of exposure in1 M
HCl acid with optimum concentration of inhibitor. Fig. (11), gives the EDX analysis of CS in 1 M HCl with in the presence of 21x10-6 M ligands. The spectra show additional lines,
IJSER

International Journal of Scientific & Engineering Research Volume 9, Issue 8, Augsut-2018 375 ISSN 2229-5518
IJSER © 2018 http://www.ijser.org
demonstrating the existence of C (owing to the carbon atoms of some azo derivatives). These data shows that the carbon, Nitrogen and oxygen atoms covered the specimen surface. The EDX analysis indicates that only, carbon, nitrogen and oxygen was detected, and shows that the passivation film contained
the chemical formula of azo derivatives adsorbed on the surface of CS. It is seen that, the percent weight of adsorb elements C, N and O were present in the spectra and recorded in Table (7).
Fig. 11. EDX analysis on CS in the presence and absence of 21x10-6 M ligands for 1 day immersion. Table 7. Surface composition (% wt) of CS after one day of immersion in 1M HCl without and with the 21x10-6 M ligands.
(Mass %) Fe Mn P O N C Cl Free 98.28 0.82 0.03 - - 0.78 -
1M HCl 71.98 0.64 0.04 25.51 - 1.13 0.7 L2 60.12 0.54 0.01 14.3 10.2 15.1 0.13 L1 62.5 0.53 0.02 13.5 11.1 14.5 0.14 L3 65.8 0.51 0.04 12.1 10.9 13.5 0.15
3.3.3. Atomic Force Microscopy (AFM) AFM is a very important technique for measuring the roughness of a sample surface at a high resolution in the order of fraction of nanometer [41]. AFM measurements are able to give details about the surface morphology of CS metal which is useful to corrosion science research. The three dimensional (3D) of AFM images appear as
shown in Fig. (12). Root Mean square roughness and average roughness The average roughness Ra can be defined as the average deviation of all points roughness profile that are measured from a mean line. Also, Root mean square roughness, Rq is the average deviation that are measured from the mean line.
IJSER

International Journal of Scientific & Engineering Research Volume 9, Issue 8, Augsut-2018 376 ISSN 2229-5518
IJSER © 2018 http://www.ijser.org
Pure CS Blank
Ligand (L2) Ligand (L1) Ligand (L3)
Fig. 12. Three-dimensional (3D) AFM images CS metal before immersion in acid (free) CS metal immersed in 1M HCl alone (blank) and CS metal immersed in 1M HCl at 21x10-6 M of investigated azo compounds (L2, L1, L3 ) for 24 hours at 25°C.
The average roughness can be measured from AFM image. Sa sensitive to large and small high deviations from the mean. Table 8 gives the corresponding average roughness Sa values. A proportional view of the above roughness table clearly establishes that the surface of the metal is smoothened due to the adsorption coating formed due to active site in the inhibitors [42]. Table 8. AFM roughness data of investigated azo compounds (L2, L1 and L3 ) at 21x10-6 M for 24 hours at 25°C.
Specimen Average roughness (Sa) nm
Free 17 Blank 993
L2 53
L1 82 L3 161
3.5. Mechanism of corrosion protection These investigated compounds are present as protonated species (cationic form) in acid solution. So, it is easier for the protonated species to approach the negatively charged CS surface due to the electrostatic attraction [43]. Thus, we can achieve that protection of CS corrosion in HCl is mainly due to electrostatic
interaction. The order of decreasing %IE of the azo compounds from all tests utilized techniques is: L2 ˃ L1 ˃ L3. Inhibitor (L2) is the most efficient inhibitor due to: i) the existence of greatly electron donatingp-CH3 group (with Hammett constant σ = -0.17) [44] which improves the delocalized π-electrons on the molecule ii) also may add an additional active site to the molecule due to its oxygen atom. Inhibitor (L1) is the least efficient inhibitor, this may be due to the existence of substituent group in para position and existence of H atom (σ = 0.0) that donates no charge density to the molecule. Inhibitor (L3) is the least efficient one, due to the presence of p-Br (+0.22) group which acts as electron withdrawing groups; so it lowers the electron density on the active site and also the protection efficiency.
CONCLUSIONS The investigated azo derivatives display good concert as
corrosion inhibitors in HCl solution. The protection efficiency of studied derivatives obeys the order: L2 ˃ L1 ˃ L3. Polarization research displayed that these derivatives perform as mixed kind inhibitors for CS in HCl solution. Impedance data designated that Rct data raised, while Cdl data lowered in the existence of the inhibitors. The adsorption of the azo derivatives had established to follow the
IJSER
International Journal of Scientific & Engineering Research Volume 9, Issue 8, Augsut-2018 377 ISSN 2229-5518
IJSER © 2018 http://www.ijser.org
Langmuir isotherm signifying that the inhibition process happens via adsorption. The % η achieved from WL, polarization diagrams, EIS and EFM are in excellent agreement.
REFERENCES [1] S.Issaadi, T. Douadi, A. Zouaoui, S. Chafaa, M.A. Khan, G. Boue, Novel Thiophene Symmetrical Schiff Base Compounds as Corrosion Inhibitor for Mild Steel in Acidic Media. Corros Sci., 53(2011)1484–1488. [2] C.C. Nathan, Organic Inhibitors. NACE, Houston, TX, 1977. p. 7. [3] G. Trabanelli, Inhibitors-an old remedy for a new challenge. Corrosion, 47(1991) 410–419. [4] A. Raman, P. Labine, Reviews on Corrosion Inhibitor Science and Technology, NACE, Houston, 1(1986) p 5. [5] M. G. Hosseini, S. F. L. Mertens, M. Ghorbani, M. R. Arshadi, Asymmetrical Schiff bases as inhibitors of mild steel corrosion in sulfuric acid media. Mater Chem Phys., 78(2003)800–808. [6] A. K. Singh, M. A. Quraishi, Effect of Cefazolin on the corrosion of mild steel in HCl solution. Corros Sci., 52(2010)152–160. [7] A. K. S ingh, M. A. Quraishi, E. E. Ebenso, Inhibitive effect of cefuroxime on the corrosion of mild steel in hydrochloric acid solution. Int J Electrochem Sci., 6 (2011)5673–5688. [8] A. K. Singh, M. A. Quraishi, Study of some bidentate Schiff bases of isatin as corrosion inhibitors for mild steel in hydrochloric acid solution. Int J Electrochem Sci., 7(2012)3222–3241 [9] A. S. Fouda, A. A. Al-Sarawy, E. E.El-Katori, Desalination, 201(2006) 1. [10] Y. Abboud, A. Abourriche, T. Saffaj, M. Berrada, M. Charrouf, A. Bennamara, H. Hannache, Desalination, 237( 1–3) (2009) 175. [11] E. M. Mabrouk, S. Eid, M. M. Attia, J. of Basic and Environmental Sciences, 4 (2017) 351. [12] H. H. Al-Doori, M. S. Shihab, J.of Al-Nahrain University, 17(3) (2014) 59. [13] E. E. Ebenso, H. Alemu, S. A. Umoren, I. B. Obot, Int. J. Electrochem. Sci., 3 (2008) 1325. [14] M. N. El-Haddad, A. S. Fouda, H. A. Mostafa, J. Of Materials Engineering and Performance, 22(8) (2013) 2277. [15] S. M. A. Hosseini, A. Azimi, Corros. Sci., 51(4) (2009) 728. [16] M. A. Bedair, M. M. B. El-Sabbah, A. S. Fouda, H. M. Elaryian, Corrosion Science, , 128 ( 2017) 54. [17] S. Rangelov, V. Mircheva, The Influence of Metal Complexes of Tetramethyldithio-oxamide on the Rate of Acid Corrosion of Steel. Corros Sci., 38(1996)301–306. [18] K. F. Khaled, K. Babic-Samardzija, N. Hackerman, Cobalt(III) Complexes of Macrocyclic-bidentate Type as a New Group of Corrosion Inhibitors for Iron in Perchloric Acid. Corros Sci., 48(2006)3014–3034. [19] K. Aramaki, Y. Node, H. Nishihara, Adsorption and Corrosion Inhibition Effect of Polar Organic Compounds on
Iron in 1M HClO4 Containing SH. J Electrochem Soc., 137 (1990)1354–1358. [20] M. El-Deen, A.F. Shoair, M.A. El-Bindary, Synthesis, structural characterization, molecular docking and DNA binding studies of copper complexesJ. Mol. Liq. 249 (2018) 533-545. [21] D. A. Jones, Principles and Prevention of Corrosion, second ed., Prentice Hall, Upper Saddle River, NJ, (1983). [22] Gamry Echem Analyst Manual, (2003). [23] N. O. eddy, E. E. Ebenso , Adsorption and quantum chemical studies on claxxacillin and halides for the corrosion of mild steel in acidic media . Int.J.Electrochem.Sci.,5 (2010) 731-750. [24] F. M. Donahuce, K. Noor, Effect of P-phynylediamine on the corrosion of austenitic stainless steel in hydrochloric acid. J.Electrochem.Soc., 112 (1965) 886-891. [25] E. Kamis, F. Bellucci, R. M. Latanision, E. S. El-Ashry, Acid corrosion inhibition by 2-(triphenosphoranylidene)succinic anhydride. Corrosion, 47 (1991) 677-686. [26] M. A. Amin, S. S. Abd El-Rehim, M. M. El-Naggar, H. T. Abd El-Fattah, Adsorption and corrosion inhibitive properties of some tripodal pyrazolic compounds on mild steel in hydrochloric acid systems. J.Mater.Sci., 44 (2009) 6258-6272. [27] E. E. Oguzie, Studies on the inhibitive effect of occimium viridis extract on the acid corrosion of mild steel. Mater. Chem.Phys., 99 (2006) 441-446. [28] A. Popova, E. Sokolova, S. Raicheva, M. Christov, AC and DC study of the temperatureeffect on mild steel corrosion in acid media in the presence of benzimidazole derivatives. Corros. Sci., 45 (2003) 33-58. [29] A. S. Fouda, H. A. Mostafa, G. Y. Elewady, M. A. El-Hashemy, Low molecular weight straight –chain diamines as corrosion inhibitors for ss in HCl solution. chmical engineering communications, 195(8) (2008) 934-947 . [30] M. Kendig, S. Jeanjaquet, Cr(VI) Ce(III) inhibitionof oxygen reduction on copper. J. Electrochem. Soc., 149 ( 2002) B47-B51. [31] M. E. Nicho, H. Hu, J. G. Gonzalez-Rodriguez, V. M. Salinas, Protection of stainless steel by polyaniline films against corrosion in aqueos environments. J. Appl. Electrochem.,36(2) (2006) 153-160. [32] E. McCafferty, N. Hackerman, adoubl layer capacitance and corrosion inhibition with polymethylene diamines. J. Electrochem. Soc. 119 (1972) 146-154. [33] H. Shin, H. Mansfeld, Corros.Sci., 29 (1989)1235. [34] S. Martinez, M. Metikos-Hukovic, A nonlinear kinetic model introduced for the corrosion inhibitive properties of some organic compound. J. Appl. Electrochem., 33 (2003)1137-1142. [35] R. W. Bosch, J. Hubrecht, W. F. Bogaerts, B. C. Syrett, A new electrochemical technique for online corrosion monitoring. Corrosion, 57 (2001) 60-70. [36] K. F. Khaled, Molecular simulation, quantum chemical calculations and electrochemical studies for inhibition of steel by triazoles. Electrochim. Acta, 53 (2008) 3484-3492.
IJSER
International Journal of Scientific & Engineering Research Volume 9, Issue 8, Augsut-2018 378 ISSN 2229-5518
IJSER © 2018 http://www.ijser.org
[37] K. F. Khaled, New synthesized guanidine derivative as a green corrosion inhibitor for mild steel. Int. J. Electrochem. Sci., 3 (2008) 462-475. [38] D. A. Jones, Principles and Prevention of Corrosion, second ed., Prentice Hall, Upper Saddle River, NJ, 1983. [39] A. S. Fouda, Y. M.Abdallah, D. Nabil, Dimethyl pyrimidine Derivative as Corrosion inhibitors for Carbon Steel in Hydrochloric Acid solutions. IJIRSET 3(2014)12965-12982 [40] Y. Y. Enriadi, N. J. Gunawarman, Corrosion Inhibition Efficiency of mild Steel in Hydrochloric Acid by Adding theobroma Cacao Feel Extract. BCES 14(2014)15-19 [41] H. O. Curkovic, K. Marusic, E. Stupnisek-Lisac, J. Telegdi, Electrochemical and AFM study of Corrosion Iinhibition with Respect to Application Method. Chem Biochem Eng Q 23(1) (2009)61- 66
[42] S. B. Pralhibha, P. Kotteeswaran, V. Bheema Raju, Study on the inhibition of MU steel Corrosion by Cationic Surfactant in HCl Medium. IOSR Journal of Applied Chemistry (IOSRJAC) 2(2012)45-53. [43] R. M. Issa, M. K. Awad and F. M. Atlam, Quantum Chemical Studies on the Inhibition of Corrosion of Copper Surface by Substituted Uracils Appl. Surf. Sci., 255 (2008) 2433-2441. [44] G. N. Mu, T. P. Zhao, M. Liu and T. Gu, Effect of metallic cations on corrosion inhibition of an anionic surfactant for mild steel. Corrosion, 52 (1996) 853-856.
IJSER