experimental studies on nsc and scc short rc columns ... · member subjected to axial compression....
TRANSCRIPT
International Research Journal of Engineering and Technology (IRJET) e-ISSN: 2395-0056
Volume: 02 Issue: 06 | Sep-2015 www.irjet.net p-ISSN: 2395-0072
© 2015, IRJET ISO 9001:2008 Certified Journal 378
Experimental Studies on NSC and SCC Short RC Columns Subjected to
Axial Compression
Atul gopinath1, Chethankumar N E2, Sanjith J
3, Prabhakara R
4
1 Research Scholar, Civil Engineering, M.S.Ramaiah Institute of Technology, Karnataka, India
2 Research Scholar, Civil Engineering, M.S.Ramaiah Institute of Technology, Karnataka, India 3 Research Scholar, Civil Engineering, Adhichunchanagiri Institute of Technology, Karnataka, India 4 Professor and Head, Civil Engineering, M.S.Ramaiah Institute of Technology, Karnataka, India
---------------------------------------------------------------------***---------------------------------------------------------------------Abstract - Experimental study was conducted to know
the behavior of short columns under axial load made
out of NSC (Normal strength concrete) and SCC (Self
compacting concrete). Main objective of this study was
to compare the behavior of NSC short columns and SCC
short columns for various percentage of steel. Axial
load ratio, stiffness ratio were the main parameters
which increased as the axial load increased. A total of
six short columns with same cross sectional area of
125mm X 125mm were cast and tested. However in this
study, special attention was given to stiffness
degradation, energy absorption, ultimate load carrying
capacity, shortening index of each short column. The
results showed that shortening index, axial load ratio,
stiffness ratio and stiffness degradation increased with
increase in axial load. On the other hand as the
percentage of steel increased the ultimate load
carrying capacity increased while shortening index and
stiffness degradation decreased. SCC had an ultimate
load carrying capacity and ultimate deflection more
than NSC for same percentage of steel.
Key Words: slenderness ratio, percentage of steel, axial
load ratio, stiffness ratio, stiffness degradation,
shortening index
1. INTRODUCTION Concrete is a multiphase granular material consisting of aggregate particles of various sizes and irregular shape, embedded in hardened cement paste. Engineering properties like compression, flexure, and torsion are considered to be important. Column is a long cylindrical member subjected to axial compression. Column carries self-weight and load coming on it. Generally, load transfers through its longitudinal direction. Column is categorized based on its height. They are, Short, Intermediate and long column.
If the slenderness ratio is less than 12 then column will be a short column. Axially loaded columns are the one where load acts at the centroid of column cross-section. This is also known as concentric loaded column. Resistance of axial loaded column is more against buckling than eccentric loaded column. Failure pattern of short column is totally different than long column patterns. Short column directly fails at the maximum value of direct stress it can take. In result of this, column material fails and get crushed. Long column buckles on the application of load. Bending stress produces in result of buckling which results in column failure. Short column of same material and same cross section will carry more load as compared to longer column. Analytical works have been carried out on RC columns where as in this study, it has been carried out an experimental investigation on short columns to know their structural performance and compared over NSC and SCC. In the present study the short columns were experienced crushing failure (Fig 4 and 5). 2. SCOPE OF PRESENT INVESTIGATION:
1) To obtain M30 grade mix for NSC and SCC using
20mm and 12.5mm coarse aggregate respectively. 2) To observe the load transfer mechanism in NSC
and SCC Short RC columns with different reinforcement tested under axial compression load.
3) To observe the compression behavior and variation in load deflection of short RC columns for different reinforcement percentage and slenderness ratio.
4) To understand the stiffness degradation and the parameters which influence it in NSC and SCC.
5) Evaluation of shortening index over short RC column made out of NSC and SCC.
6) Analyzing the data on the compression behavior of RC columns with respect to geometric properties, concrete, reinforcement ratio.
7) Bench marking of experimental results with the available literature and codal equations.
International Research Journal of Engineering and Technology (IRJET) e-ISSN: 2395-0056
Volume: 02 Issue: 06 | Sep-2015 www.irjet.net p-ISSN: 2395-0072
© 2015, IRJET ISO 9001:2008 Certified Journal 379
3. MATERIALS AND MIX PROPORTIONS
The following materials were used in the present investigation. Cement: 43 Grade OPC as per IS 12269- 1989 with specific gravity 3.15. Fly Ash: Fly Ash conforming to ClassF IS 3812:2003. Coarse Aggregates: 20mm downsize Aggregates with specific gravity 2.65 for NSC. 12.5mm down size aggregates with specific gravity 2.62 for SCC. Coarse aggregates were conforming IS 383:1970[20]. Fine Aggregates: Manufactured Sand with specific gravity 2.57 and Fineness Modulus 3.05 conforming to zone II of IS 383:1970[20]. Super Plasticizers: Naphthalene based polymer. Glenium B233 Modified poly-carboxylic ether for SCC. Viscosity Modifying Agent: Glenium Stream 2 for SCC. Steel: longitudinal reinforcement varied as 2.01%, 2.89% and 5.15%.and lateral ties 8mm at 125mm c/c. Water: Potable water conforming to IS 456:2000[18]. Mix Proportions: Mix design adopted for the present investigations are as follows: NSC M-30 as per IS 10262:2009[19]; SCC M-30 NAN–SU method. 4. EXPERIMENTAL INVESTIGATION:
Based on the literature review and series of trial and errors the dimension of the column specimen was chosen. The specimens were cast using moulds of 125x125x1000mm. The specimens were reinforced with cage reinforcement of 8mmɸ tie bars 125mm c/c and longitudinal reinforcement of 2.09%, 2.89% and 5.15%. (TORKARI) of Fe500. Table 1: Mix Proportions of NSC, SCC.
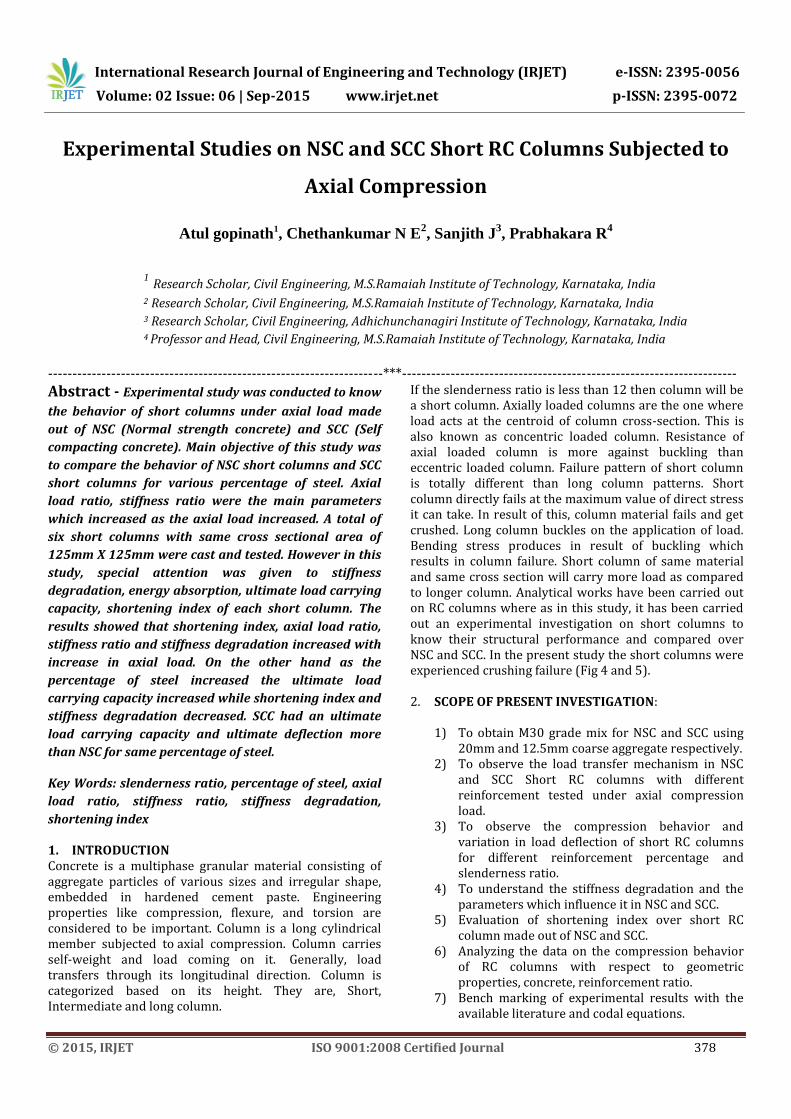
Fig 1: Cross Section Details of Columns
Fig 2: Schematic diagram of column specimen with cage reinforcement
In the present investigation, a total of six column specimens were cast using NSC (M30) and SCC (M30). Slenderness ratio 8 was maintained to study the behavior of short RC columns. In all the columns a constant cross sectional area of 125mmX125mm was maintained. Height of short column was 1m. Based on the literature and the facility available in the lab the dimensions of the columns are arrived. The typical pattern of column with cross section (125mmX125mm) and varying longitudinal reinforcement is as shown in Fig 1 and 2. The results of cube compressive strength of different grades of concretes NSC, SCC after trail mixes used to cast column specimens is as tabulated in the Table 2.
4.1 TESTING ARRANGEMENT AND TESTING PROCEDURE After the curing period was completed, the columns were white washed before mounting on the loading frame. All the columns were tested in the loading frame capacity of 1000 KN. All type of columns were fixed on both ends with an effective span of 0.96m. A typical loading arrangement of short column is shown in the Fig 3. Single cross bar was
NSC SCC
Cement in kg/m3 348.33 214.28
Fly Ash in kg/m3 - 248.43
Fine Aggregates in kg/m3 681.66 925.63
Coarse Aggregates in kg/m3
1146.8 (20mm)
743.69 (12.5 mm)
Water in lit/m3 191.58 148.07
Super Plasticizer - 1.3%
VMA - 0.18%
Concrete type and
max. aggregate
size
Grade of concrete
Average Cube compressive strength, fck (MPa)
28days
NSC M30 37.57
SCC M30 42.52
International Research Journal of Engineering and Technology (IRJET) e-ISSN: 2395-0056
Volume: 02 Issue: 06 | Sep-2015 www.irjet.net p-ISSN: 2395-0072
© 2015, IRJET ISO 9001:2008 Certified Journal 380
provided for short columns to prevent the danger of sudden lateral movements.
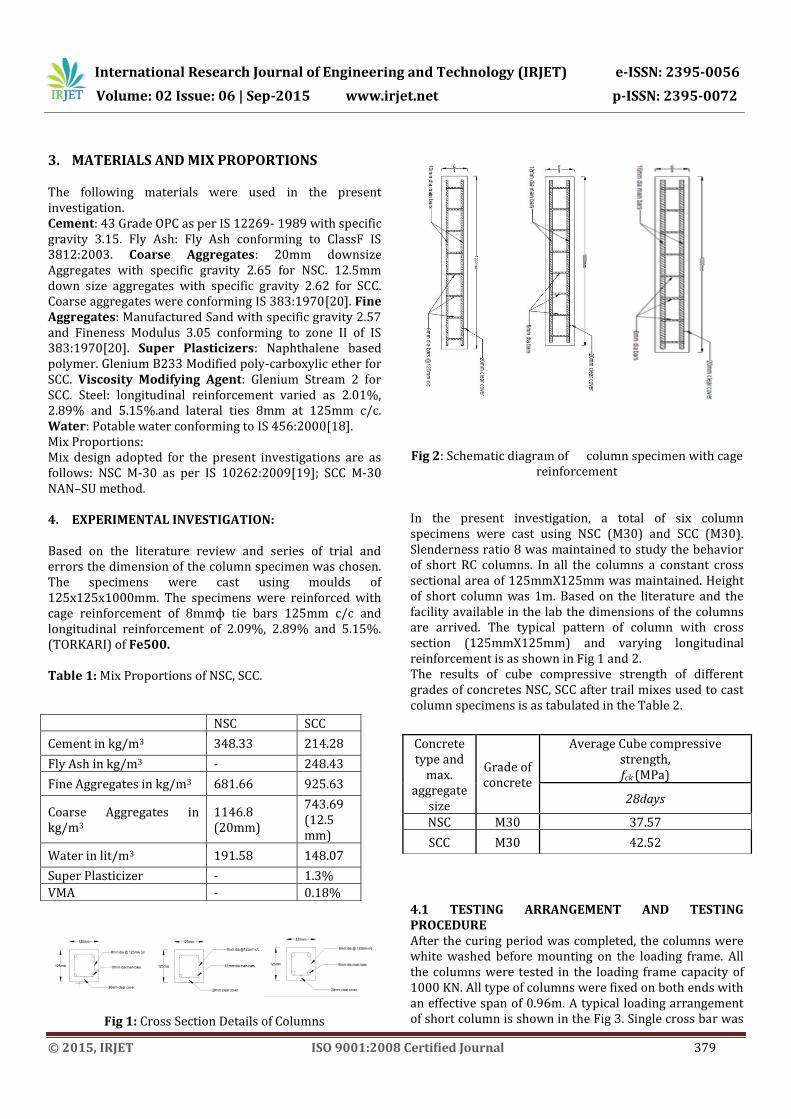
Fig 3: Test setup
All the short RC Columns were experienced crushing failure as shown in Fig 4 and 5.
Fig 4: Crack and failure patterns of short columns
Fig 5: Crack and failure patterns of short columns
The Table 3 shows the test results of all the six columns. For each specimen by applying axial load, ultimate Load Pu
(Exp) and axial deformation (∆u) was observed. Using Pu
(Exp) and ∆u, Energy Absorption (EA), Shortening Index (SI), Axial Load Ratio (ALR) and Stiffness Ratio (SR) was calculated. fck is the cube compressive strength.
Table 3: Test results of the column Specimen
The specimens are named as follows. NSC/8/2.09 means type of concrete/slenderness ratio/longitudinal percentage of steel. 5 RESULTS AND DISCUSSIONS A detailed analysis has been carried out on the following parameters to understand structural performance of RC columns.
Load deflection behavior Ultimate load Stiffness degradation Axial load ratio and stiffness ratio Shortening index Energy absorption
5.1 LOAD DEFORMATION BEHAVIOR OF RC COLUMNS An important aspect in the analysis and design of structures relates to the deformations caused by the loads applied to a structure. Clearly it is important to avoid deformations so large that they may prevent the structure from fulfilling the purpose for which it is intended. But the analysis of deformations may also help us in the determination of stresses. To determine the actual distribution of stresses within a member, it is necessary to analyze the deformations which take place in that member. This project deals with the deformations of column under axial loading. 5.1.1 Covers the compression behavior of short RC columns. 5.1.1 LOAD DEFORMATION BEHAVIOR OF SHORT RC COLUMNS It is necessary to plot the graph between axial load and axial deformation to understand the load deformation behavior of RC short columns with varying percentage of steel reinforcement for both NSC and SCC. The graphical representation of load-deformation behavior is as shown in Fig 6 and Fig 7.
SPECIMEN fck (MPa)
Pcr (kN)
Pu(Exp) (kN)
∆u (mm)
E A (kN-mm)
S I A L R S R FAILURE
NSC/8/2.09 38.8 236 531.65 8.99 2881.23 0.0090 1.43 56.66 Crushing
NSC/8/2.89 38.8 177.23 544.30 5.66 2247.00 0.0057 1.46 58.35 Crushing
NSC/8/5.15 38.8 329.11 582.28 4.85 2103.54 0.0049 1.56 63.56 Crushing
SCC/8/2.09 44.9 203.11 515.00 6.75 2081.75 0.0068 1.24 47.96 Crushing
SCC/8/2.89 44.9 215.18 569.62 5.90 1894.74 0.0059 1.37 54.08 Crushing
SCC/8/5.15 44.9 240.51 658.23 5.65 2111.23 0.0057 1.59 64.86 Crushing
International Research Journal of Engineering and Technology (IRJET) e-ISSN: 2395-0056
Volume: 02 Issue: 06 | Sep-2015 www.irjet.net p-ISSN: 2395-0072
© 2015, IRJET ISO 9001:2008 Certified Journal 381
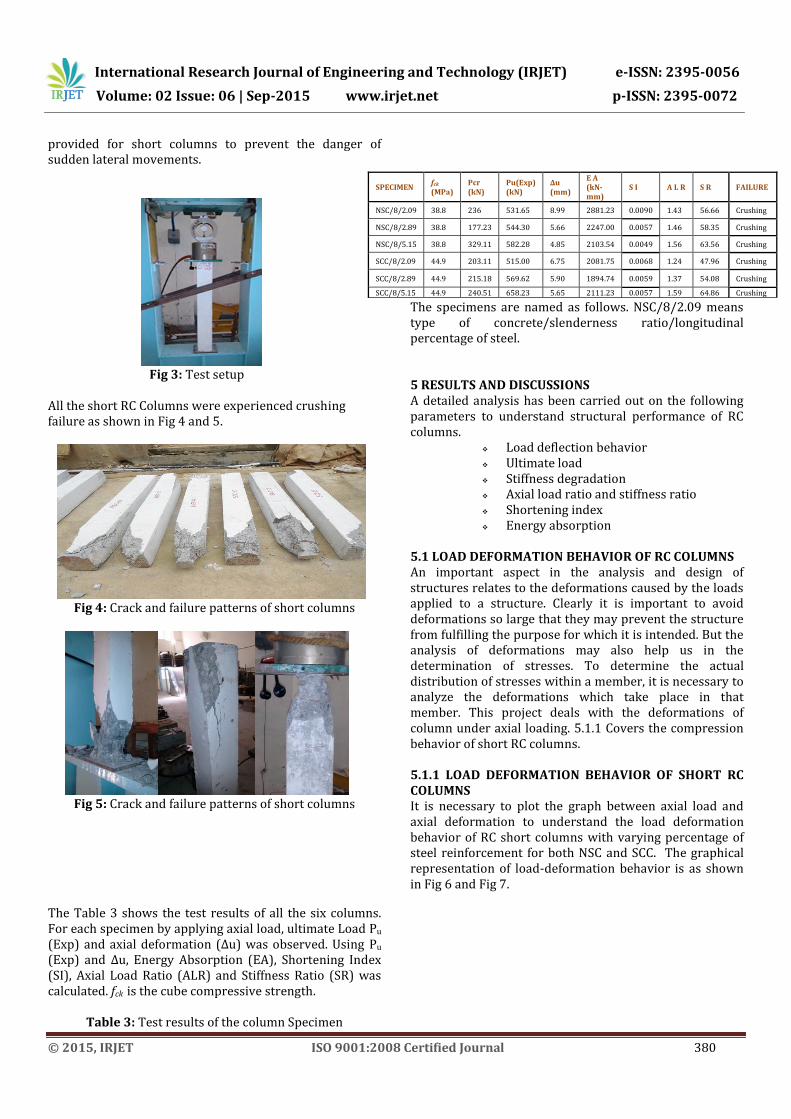
Fig 6: Combined load-deformation curve for NSC short RC
columns From the Fig 6, it has been observed that NSC10, NSC12 and NSC16 short columns have maximum axial deformations 9.00mm, 5.66mm and 4.85mm at an ultimate loads of 531.65 kN, 544.30 kN and 582.27 kN respectively. Also it is evident that with increase in percentage of steel, axial load carrying capacity has increased whereas axial deformations have decreased as shown in Fig 6. Fig 7 shows the graphical representation of the axial load vs axial deformation for SCC with varying percentage of reinforcement.
Fig 7: Combined load-deformation curve for SCC short RC columns
From the Fig 7 it is noticeable that, SCC10, SCC12 and SCC16 short columns have maximum axial deformations 6.758 mm, 5.9mm and 5.65mm at an ultimate loads of 515 kN, 569.62 kN and 658.23 kN respectively. With increase in percentage of steel, axial deformation decreased whereas load carrying capacity increased. Different concretes exhibits different properties. Since SCC has better flow ability than NSC, which directly influences the strength of concrete. Therefore in order to understand the difference in behavior of NSC and SCC columns, it is necessary to plot the graphical representations for same percentage of steel reinforcement. Following graphs show the comparison of axial load vs axial deformation NSC and
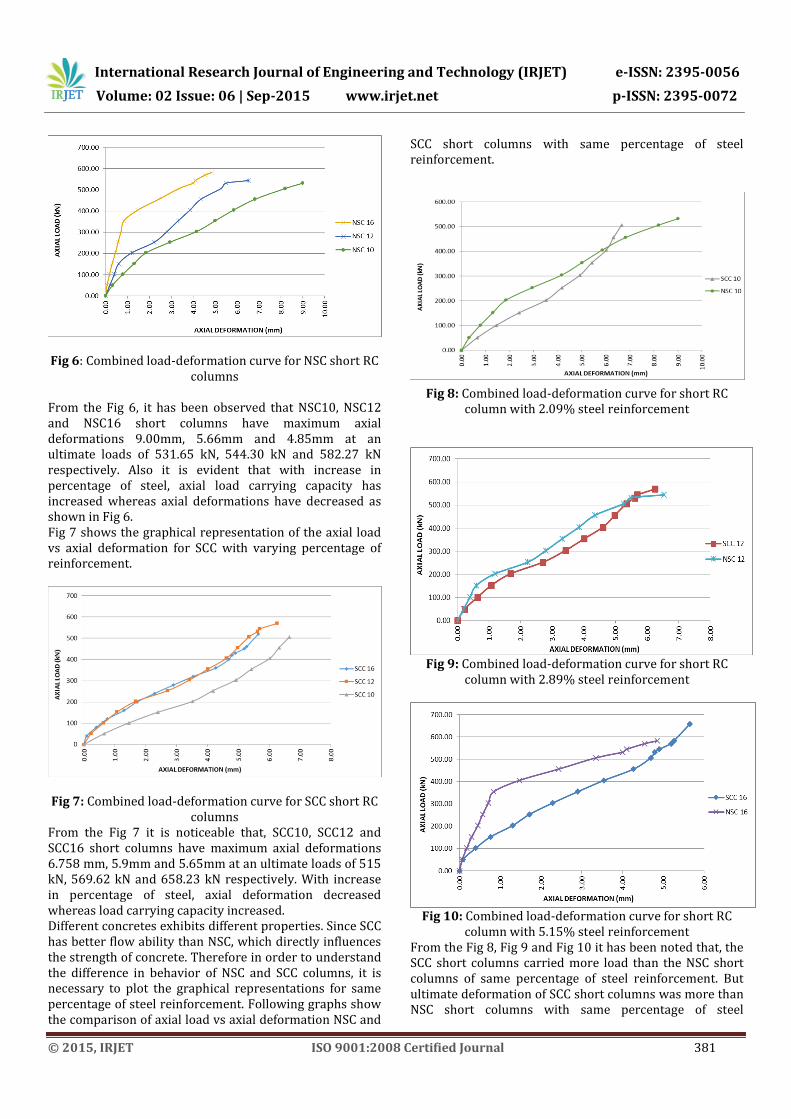
SCC short columns with same percentage of steel reinforcement.
Fig 8: Combined load-deformation curve for short RC column with 2.09% steel reinforcement
Fig 9: Combined load-deformation curve for short RC
column with 2.89% steel reinforcement
Fig 10: Combined load-deformation curve for short RC
column with 5.15% steel reinforcement From the Fig 8, Fig 9 and Fig 10 it has been noted that, the SCC short columns carried more load than the NSC short columns of same percentage of steel reinforcement. But ultimate deformation of SCC short columns was more than NSC short columns with same percentage of steel
International Research Journal of Engineering and Technology (IRJET) e-ISSN: 2395-0056
Volume: 02 Issue: 06 | Sep-2015 www.irjet.net p-ISSN: 2395-0072
© 2015, IRJET ISO 9001:2008 Certified Journal 382
reinforcement (this is because SCC has less young’s modulus ‘E’ than NSC, thus its flexural rigidity ‘EI’ is less). Load carrying capacity for SCC/8/2.09 was 3.23% lesser, SCC/8/2.89 was 4.44% higher and SCC/8/5.15 was 11.53% higher compared to NSC/8/2.09, NSC/8/2.89 and NSC/8/5.15 columns respectively. Axial deformation for SCC/8/2.09 was 25% lesser, SCC/8/2.89 was 4.2% higher and SCC/8/5.15 was 16.5% higher compared to NSC/8/2.09, NSC/8/2.89 and NSC/8/5.15 columns respectively. 5.2 COMPARISON OF ULTIMATE LOAD CARRYING CAPACITY OBTAINED FROM EXPERIMENTAL DATA AND ANALYTICAL METHOD Reinforcement percentage, type of concrete and slenderness ratio are the key parameters which influences the load carrying capacity of columns and it is shown in the following graphs. Analytically ultimate load carrying capacity of RC column was obtained using the formula as per IS 456 (Eq 1)[18]. Pu=0.45fck+0.67fyAst…………………………………………...……….Eq 1 Following graphs show the comparison of theoretical and experimental ultimate load carrying capacity for NSC and SCC short columns with same percentage of steel reinforcement as shown in Fig 11.
Fig 11: Combined Ultimate Load Carrying Capacity V/S steel percentage for short column From the Fig 11 it was observed that as the percentage of steel increased, ultimate load carrying capacity increased in case of both NSC and SCC columns. 5.3 STIFFNESS DEGRADATION OF RC COLUMNS Load required for producing unit deformation in a member is defined as Stiffness and stiffness degradation is defined as the damage to engineering materials essentially results in a decrease of the free energy stored in the body with consequent degradation of the material stiffness. To understand the stiffness degradation of RC columns, graphs have been plotted between stiffness and axial deformation with varying percentage of steel reinforcement for both NSC and SCC. 5.3.1 Covers the stiffness degradation of short columns.
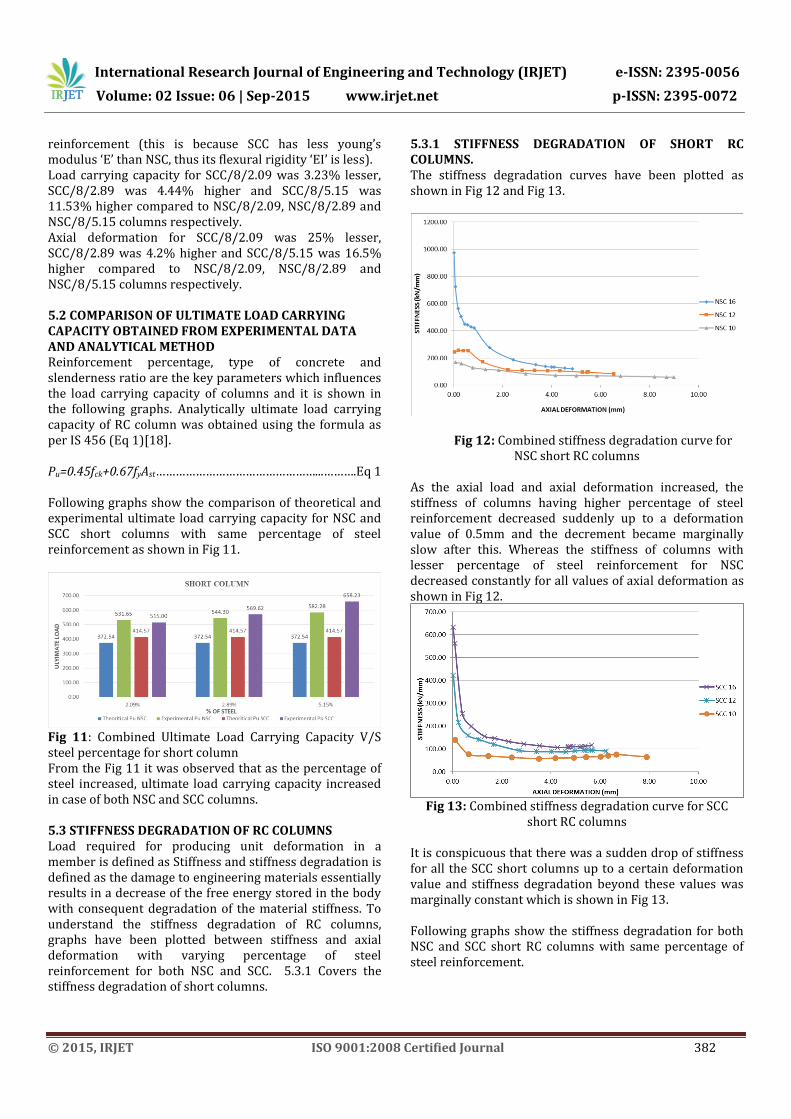
5.3.1 STIFFNESS DEGRADATION OF SHORT RC COLUMNS. The stiffness degradation curves have been plotted as shown in Fig 12 and Fig 13.
Fig 12: Combined stiffness degradation curve for NSC short RC columns
As the axial load and axial deformation increased, the stiffness of columns having higher percentage of steel reinforcement decreased suddenly up to a deformation value of 0.5mm and the decrement became marginally slow after this. Whereas the stiffness of columns with lesser percentage of steel reinforcement for NSC decreased constantly for all values of axial deformation as shown in Fig 12.
Fig 13: Combined stiffness degradation curve for SCC
short RC columns
It is conspicuous that there was a sudden drop of stiffness for all the SCC short columns up to a certain deformation value and stiffness degradation beyond these values was marginally constant which is shown in Fig 13. Following graphs show the stiffness degradation for both NSC and SCC short RC columns with same percentage of steel reinforcement.
International Research Journal of Engineering and Technology (IRJET) e-ISSN: 2395-0056
Volume: 02 Issue: 06 | Sep-2015 www.irjet.net p-ISSN: 2395-0072
© 2015, IRJET ISO 9001:2008 Certified Journal 383
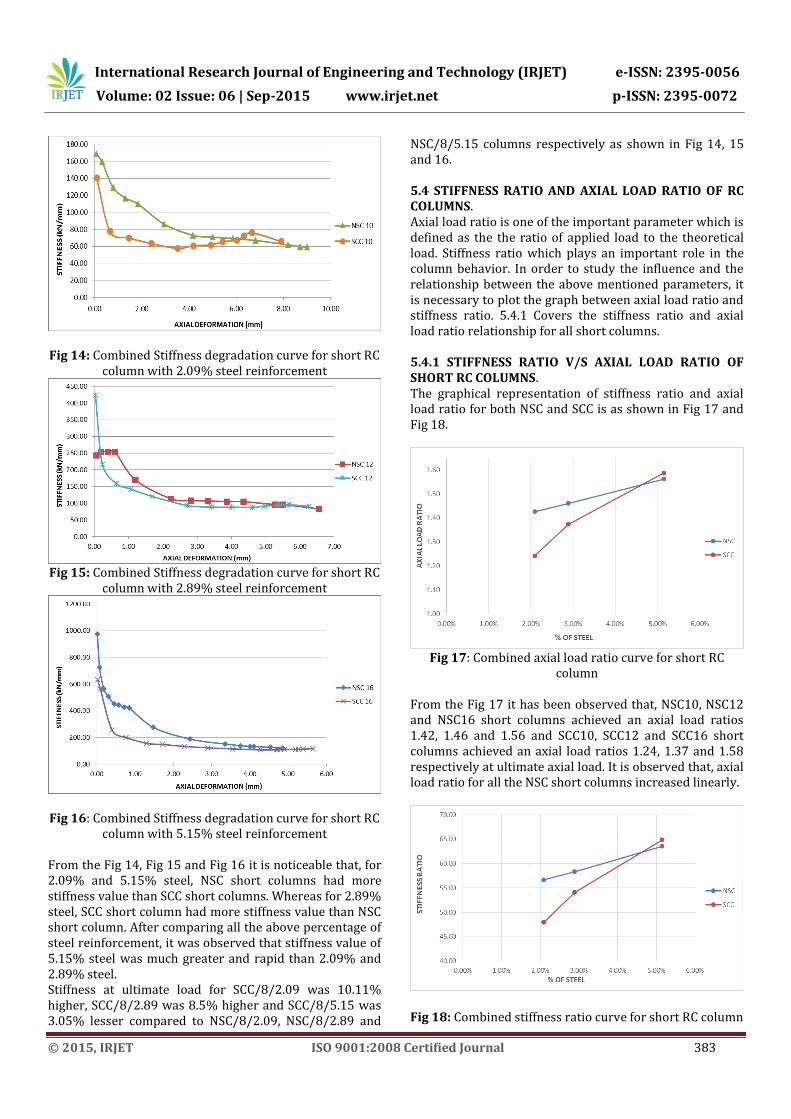
Fig 14: Combined Stiffness degradation curve for short RC column with 2.09% steel reinforcement
Fig 15: Combined Stiffness degradation curve for short RC
column with 2.89% steel reinforcement
Fig 16: Combined Stiffness degradation curve for short RC column with 5.15% steel reinforcement
From the Fig 14, Fig 15 and Fig 16 it is noticeable that, for 2.09% and 5.15% steel, NSC short columns had more stiffness value than SCC short columns. Whereas for 2.89% steel, SCC short column had more stiffness value than NSC short column. After comparing all the above percentage of steel reinforcement, it was observed that stiffness value of 5.15% steel was much greater and rapid than 2.09% and 2.89% steel. Stiffness at ultimate load for SCC/8/2.09 was 10.11% higher, SCC/8/2.89 was 8.5% higher and SCC/8/5.15 was 3.05% lesser compared to NSC/8/2.09, NSC/8/2.89 and
NSC/8/5.15 columns respectively as shown in Fig 14, 15 and 16. 5.4 STIFFNESS RATIO AND AXIAL LOAD RATIO OF RC COLUMNS. Axial load ratio is one of the important parameter which is defined as the the ratio of applied load to the theoretical load. Stiffness ratio which plays an important role in the column behavior. In order to study the influence and the relationship between the above mentioned parameters, it is necessary to plot the graph between axial load ratio and stiffness ratio. 5.4.1 Covers the stiffness ratio and axial load ratio relationship for all short columns. 5.4.1 STIFFNESS RATIO V/S AXIAL LOAD RATIO OF SHORT RC COLUMNS. The graphical representation of stiffness ratio and axial load ratio for both NSC and SCC is as shown in Fig 17 and Fig 18.
Fig 17: Combined axial load ratio curve for short RC
column
From the Fig 17 it has been observed that, NSC10, NSC12 and NSC16 short columns achieved an axial load ratios 1.42, 1.46 and 1.56 and SCC10, SCC12 and SCC16 short columns achieved an axial load ratios 1.24, 1.37 and 1.58 respectively at ultimate axial load. It is observed that, axial load ratio for all the NSC short columns increased linearly.
Fig 18: Combined stiffness ratio curve for short RC column

International Research Journal of Engineering and Technology (IRJET) e-ISSN: 2395-0056
Volume: 02 Issue: 06 | Sep-2015 www.irjet.net p-ISSN: 2395-0072
© 2015, IRJET ISO 9001:2008 Certified Journal 384
From the Fig 18 it has been observed that, , NSC10, NSC12 and NSC16 short columns achieved stiffness ratios 56.66, 58.35 and 63.56 and SCC10, SCC12 and SCC16 short columns achieved stiffness ratios 47.96, 54.08 and 64.86 respectively at ultimate axial load. It is observed that, stiffness ratio for all the SCC short columns increased linearly. Following graphs show the variation of axial load ratio and stiffness ratio for both NSC and SCC short columns with same percentage of steel reinforcement.
Fig 19: Combined stiffness ratio vs axial load ratio curve
for short RC column with 2.09% steel reinforcement
Fig 20: Combined stiffness ratio vs axial load ratio curve for short RC column with 2.89% steel reinforcement
Fig 21: Combined stiffness ratio vs axial load ratio curve
for short RC column with 5.15% steel reinforcement
From the Fig 19, Fig 20 and Fig 21 it has been observed that, Stiffness ratio and axial load ratio for NSC and SCC short columns having 5.15% steel was found to be greater than that of 2.89% and 2.09% steel. It was observed that the stiffness ratio and axial load ratio for all short columns were marginally same. Axial load ratio at ultimate load for SCC/8/2.09 was 14.51% lesser, SCC/8/2.89 was 6.57% lesser and SCC/8/5.15 was 1.26% higher compared to NSC/8/2.09, NSC/8/2.89 and NSC/8/5.15 columns respectively. Stiffness ratio at ultimate load for SCC/8/2.09 was 18.16% lesser, SCC/8/2.89 was 7.57% lesser and SCC/8/5.15 was 2.02% higher compared to NSC/8/2.09, NSC/8/2.89 and NSC/8/5.15 columns respectively. 5.5 SHORTENING INDEX Shortening index is a dimensionless property and is defined as the ratio of ultimate deformation to the length of column. Graphs of shortening index vs steel percentage have been plotted for all short columns as shown in Fig 22.
Fig 22: Combined shortening index V/S steel percentage
for short column From the Fig 22 it was observed that, the shortening index of both SCC and NSC short columns decreased with increase in percentage of steel. However in case of short columns, the shortening index of SCC with 2.01% was found to be less than NSC with same steel percentage. However the shortening index of SCC 2.89% and SCC 5.15% was more than NSC columns with same steel percentage. Shortening index for SCC/8/2.09 was 45.58% lesser, SCC/8/2.89 was 3.39% higher and SCC/8/5.15 was 4.03% higher compared to NSC/8/2.09, NSC/8/2.89 and NSC/8/5.15 columns respectively as shown in Fig 23. 5.6 ENERGY ABSORPTION Energy absorption is represented by the area enclosed under the load-deformation curve. The failure mechanism of RC columns is found to be very dependent on the loading path, which strongly affects both the ductility and energy dissipation capacity of the columns. The influence
International Research Journal of Engineering and Technology (IRJET) e-ISSN: 2395-0056
Volume: 02 Issue: 06 | Sep-2015 www.irjet.net p-ISSN: 2395-0072
© 2015, IRJET ISO 9001:2008 Certified Journal 385
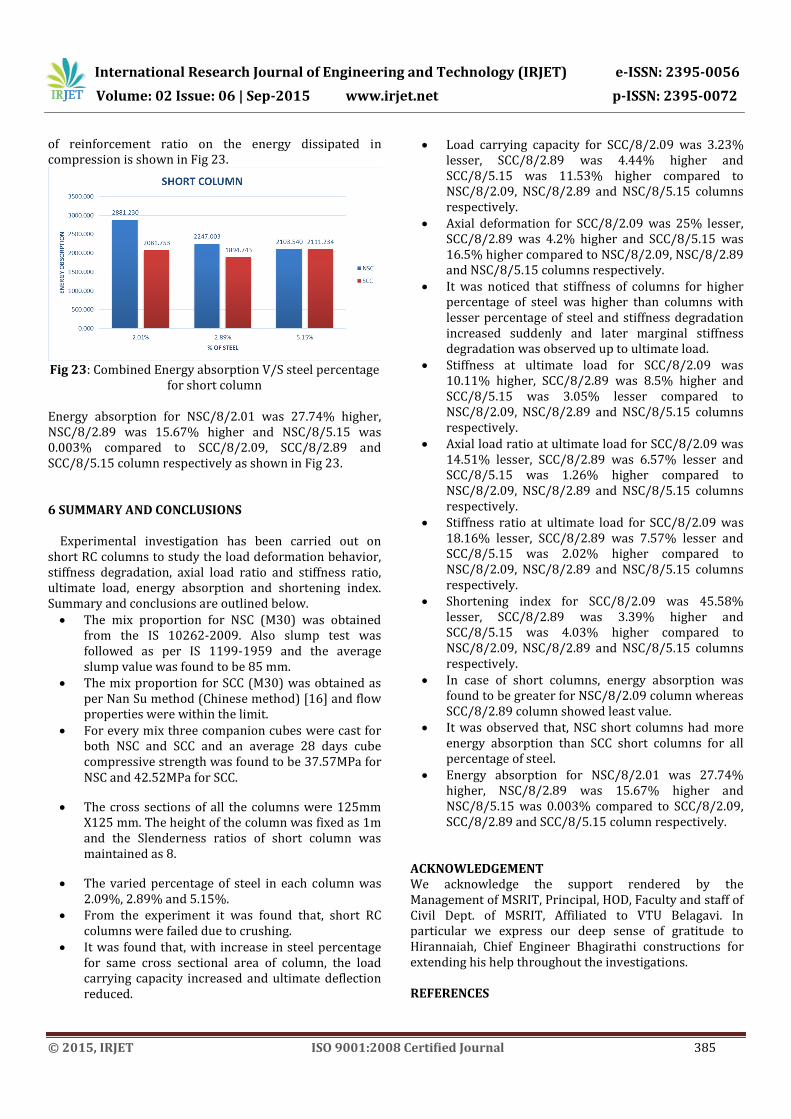
of reinforcement ratio on the energy dissipated in compression is shown in Fig 23.
Fig 23: Combined Energy absorption V/S steel percentage
for short column
Energy absorption for NSC/8/2.01 was 27.74% higher, NSC/8/2.89 was 15.67% higher and NSC/8/5.15 was 0.003% compared to SCC/8/2.09, SCC/8/2.89 and SCC/8/5.15 column respectively as shown in Fig 23. 6 SUMMARY AND CONCLUSIONS
Experimental investigation has been carried out on short RC columns to study the load deformation behavior, stiffness degradation, axial load ratio and stiffness ratio, ultimate load, energy absorption and shortening index. Summary and conclusions are outlined below.
The mix proportion for NSC (M30) was obtained from the IS 10262-2009. Also slump test was followed as per IS 1199-1959 and the average slump value was found to be 85 mm.
The mix proportion for SCC (M30) was obtained as per Nan Su method (Chinese method) [16] and flow properties were within the limit.
For every mix three companion cubes were cast for both NSC and SCC and an average 28 days cube compressive strength was found to be 37.57MPa for NSC and 42.52MPa for SCC.
The cross sections of all the columns were 125mm X125 mm. The height of the column was fixed as 1m and the Slenderness ratios of short column was maintained as 8.
The varied percentage of steel in each column was 2.09%, 2.89% and 5.15%.
From the experiment it was found that, short RC columns were failed due to crushing.
It was found that, with increase in steel percentage for same cross sectional area of column, the load carrying capacity increased and ultimate deflection reduced.
Load carrying capacity for SCC/8/2.09 was 3.23% lesser, SCC/8/2.89 was 4.44% higher and SCC/8/5.15 was 11.53% higher compared to NSC/8/2.09, NSC/8/2.89 and NSC/8/5.15 columns respectively.
Axial deformation for SCC/8/2.09 was 25% lesser, SCC/8/2.89 was 4.2% higher and SCC/8/5.15 was 16.5% higher compared to NSC/8/2.09, NSC/8/2.89 and NSC/8/5.15 columns respectively.
It was noticed that stiffness of columns for higher percentage of steel was higher than columns with lesser percentage of steel and stiffness degradation increased suddenly and later marginal stiffness degradation was observed up to ultimate load.
Stiffness at ultimate load for SCC/8/2.09 was 10.11% higher, SCC/8/2.89 was 8.5% higher and SCC/8/5.15 was 3.05% lesser compared to NSC/8/2.09, NSC/8/2.89 and NSC/8/5.15 columns respectively.
Axial load ratio at ultimate load for SCC/8/2.09 was 14.51% lesser, SCC/8/2.89 was 6.57% lesser and SCC/8/5.15 was 1.26% higher compared to NSC/8/2.09, NSC/8/2.89 and NSC/8/5.15 columns respectively.
Stiffness ratio at ultimate load for SCC/8/2.09 was 18.16% lesser, SCC/8/2.89 was 7.57% lesser and SCC/8/5.15 was 2.02% higher compared to NSC/8/2.09, NSC/8/2.89 and NSC/8/5.15 columns respectively.
Shortening index for SCC/8/2.09 was 45.58% lesser, SCC/8/2.89 was 3.39% higher and SCC/8/5.15 was 4.03% higher compared to NSC/8/2.09, NSC/8/2.89 and NSC/8/5.15 columns respectively.
In case of short columns, energy absorption was found to be greater for NSC/8/2.09 column whereas SCC/8/2.89 column showed least value.
It was observed that, NSC short columns had more energy absorption than SCC short columns for all percentage of steel.
Energy absorption for NSC/8/2.01 was 27.74% higher, NSC/8/2.89 was 15.67% higher and NSC/8/5.15 was 0.003% compared to SCC/8/2.09, SCC/8/2.89 and SCC/8/5.15 column respectively.
ACKNOWLEDGEMENT We acknowledge the support rendered by the Management of MSRIT, Principal, HOD, Faculty and staff of Civil Dept. of MSRIT, Affiliated to VTU Belagavi. In particular we express our deep sense of gratitude to Hirannaiah, Chief Engineer Bhagirathi constructions for extending his help throughout the investigations. REFERENCES
International Research Journal of Engineering and Technology (IRJET) e-ISSN: 2395-0056
Volume: 02 Issue: 06 | Sep-2015 www.irjet.net p-ISSN: 2395-0072
© 2015, IRJET ISO 9001:2008 Certified Journal 386
[1] Pin-Qi Xia and James M. W. Brownjohn (2003) “Residual stiffness assessment of structurally failed reinforced concrete structures by dynamic testing and finite element model updating” vol. 43, no. 4, Dec 2003
[2] Bing li, “Initial stiffness of reinforced concrete columns and walls”, 15 WCEE lisboa 2012.
[3] K.J. Elwood and M.O. Eberhard, “Effective Stiffness of Reinforced Columns”, Research digest No. 2006-1, pg 1-5, 2006.
[4] Nansu, Kung Chung Hsu and His-Wen chai, “A simple mix design method of self-compacting concrete”, cement and concrete research, 2001, vol 31, pp. 1799-1807.
[5] X.Zeng, B. Xu, X. Z. Zhang “Experimental study on axial compression behavior of RC columns under rapid loading” 15WCEE, LISBOA 2012, Hunan 410082, P.R.China.
[6] Jia Jinquing, Jiang Rui (2007) “Dynamic analysis of steel reinforced super high strength concrete columns”. Archit.civ.eng.china, 1 (2):240-246. DOI 10.1007/s 11709-007-0030-2
[7] M. Hajsadeghi, F.J. Alaee “Numerical analysis of rectangular reinforced concrete columns confined with FRP jacket under eccentric loading”, CICE 2010- The 5th International conference on FRP composites in civil engineering, September 27-29,2010, Beijing, china.
[8] R. Jansson, l. Bostrom “Factor influencing fire spalling of self-compacting concrete”, materials and structures (2013), 46:1683-1694, DOI 10.1617/s 11527-012-0007-z.
[9] Yishuo Ma, Yuanfeng Wang (2010 “Parametric analysis for creep of high strength concrete columns confined by AFRP”. ”, CICE 2010- The 5th International conference on FRP composites in civil engineering, September 27-29, 2010, Beijing, china.
[10] Jiaquan Zhong, S.M. ASCE, Paolo Gardoni, M.ASCE, David Rosowsky “Stiffness degradation and time cracking of cover concrete in reinforced concrete structures subject to corrosion”(2010), doi:10.1061/(ASCE)em.1943-7889.0000074. Vol.136, No.2.
[11] Stephen T. Rutledge; Mervyn J. Kowalsky,P.E; Rudolf Seracino, James M. Nau.“Repair of RC bridge columns containing buckle and fractured reinforcement by plastic hinge relocation” (2013), journal of bridge engineering, ASCE, 1SSN 1084-0702/a4013oo1 (10), DOI: 10.1061/ (ASCE) be.1943-5592.0000492
[12] Hugo Rodrigues, Humberto Varum1, Antonio Arêde and Aníbal G Costa1,“Behavior of reinforced concrete column under biaxial cyclic loading—state of the art”(2013),International journal of Advanced Structural Engineering 5:4.
[13] A.Bourouz, N .Chikh, R Benzaid, A. Laraba “Confinement of high strength concrete columns with CFRP sheets”(2014), Proceedings of the World Congress on Engineering, VOL II, July 2-4, London, UK.
[14] Biswajit Basu “Identification of stiffness degradation in structures using wavelet analysis” construction and building materials 19 (2005) 713-721, doi:10.1016/j.conbuildmat.2005.02.018
[15] Ramesh Kumar , Paolo Gardoni “Modelling of structural degradation of RC bridge columns subjected to earthquake and their fragility estimates”(2012),journal of structural engineering, vol. 138, no. 1, DOI:10.1061/(ASCE)st.1943-541x.0000450.
[16] Viorel Popa. Dragos Cotofana. Radu Vacareanu (2014) “Effective stiffness and displacement capacity of short reinforced columns with low concrete quality” bull earthquake engineering (2014) 12:2705-2721 DOI: 10.1007/s 10518-014-9618-9
[17] M. Neville, “Properties of Concrete”, Fourth Edition, Longman Group Limited. 1995, pp. 757-758.
[18] IS 456:2000, [Reaffirmed 2005], “Plain and Reinforced Concrete – Code of Practice”, Fourth Revision, Bureau of Indian Standards, New Delhi, India.
[19] IS 10262:2009, “Standards Concrete Mix Proportioning Guidelines”, First Revision, Bureau of Indian Standards, New Delhi, India.
[20] IS 383:1970, [Reaffirmed in 2002], “Specifications for Coarse & Fine Aggregates from Natural Sources for Concrete”, Bureau of Indian Standards, New Delhi, India.
[21] IS 2386 (Part I):1963, [Reaffirmed in 2011], “Methods of Tests for Aggregates for Concrete”, Bureau of Indian Standards, New Delhi, India.
[22] IS: 1199- 1959, [Reaffirmed 2004], “Methods of Sampling and Analysis of Concrete”, Bureau of Indian Standards, New Delhi, India.
[23] BS EN 12350-2: 2000, “Testing fresh concrete, slump test”, January 2000.
[24] MasterGlenium 8233 (formerly Glenium B233) a BASF company, BASF India Limited.
[25] Master Matrix 2 (formerly Glenium Stream 2) a BASF company, BASF India Limited.
[26] ISO 1920-2:2005, “Testing of concrete -- Part 2: Properties of fresh concrete” published on 2005-04-15.
[27] IS 10510, “Specification for Vee-Bee consistometer”, 1983
[28] IS 516:1959, [Reaffirmed 1999], Edition 1.2, “Methods of Tests for Strength of Concrete”, Bureau of Indian Standards, New Delhi, India.
International Research Journal of Engineering and Technology (IRJET) e-ISSN: 2395-0056
Volume: 02 Issue: 06 | Sep-2015 www.irjet.net p-ISSN: 2395-0072
© 2015, IRJET ISO 9001:2008 Certified Journal 387
BIOGRAPHIES
Name: Atul gopinath Qualification: ME Ph.D*(Civil Engg.) Research area: Material behavior
Name: Chethankumar N E Qualification: M-Tech (Structural Engg.) Research area: Material behaviour
Name: Sanjith J Designation: Assistant Professor Qualification: M.Tech (Structural Engg) Research Area: Materials and Structures Name: Dr. R.Prabhakara Designation: Professor and Head Qualification: M.Tech (Construction Technology) Ph.D (Civil Engg.) Research Area: Materials and Structures