experimental study on a new type of transverse connection
TRANSCRIPT

University of Nebraska - LincolnDigitalCommons@University of Nebraska - LincolnCivil Engineering Theses, Dissertations, andStudent Research Civil Engineering
Fall 11-30-2018
Experimental Study on a New Type of TransverseConnection for Nebraska County Bridge SystemAlexander BleyhlUniversity of Nebraska - Lincoln, [email protected]
Follow this and additional works at: http://digitalcommons.unl.edu/civilengdiss
Part of the Civil Engineering Commons, and the Other Civil and Environmental EngineeringCommons
This Article is brought to you for free and open access by the Civil Engineering at DigitalCommons@University of Nebraska - Lincoln. It has beenaccepted for inclusion in Civil Engineering Theses, Dissertations, and Student Research by an authorized administrator ofDigitalCommons@University of Nebraska - Lincoln.
Bleyhl, Alexander, "Experimental Study on a New Type of Transverse Connection for Nebraska County Bridge System" (2018). CivilEngineering Theses, Dissertations, and Student Research. 133.http://digitalcommons.unl.edu/civilengdiss/133

EXPERIMENTAL STUDY ON A NEW TYPE OF TRANSVERSE CONNECTION FOR NEBRASKA COUNTY BRIDGE SYSTEM
by
Alexander T. Bleyhl
A THESIS
Presented to the Faculty of
The Graduate College at the University of Nebraska
In Partial Fulfillment of Requirements
For the Degree of Master of Science
Major: Civil Engineering
Under the Supervision of Professor Chungwook Sim
Lincoln, Nebraska
December, 2018

EXPERIMENTAL STUDY ON A NEW TYPE OF TRANSVERSE CONNECTION FOR NEBRASKA COUNTY BRIDGE SYSTEM
Alexander T. Bleyhl, M.S.
University of Nebraska, 2018
Advisor: Chungwook Sim
Many county-owned bridges in Nebraska need replacement due to their structural
deficiency. Most of the bridges needing replacement are in the 40 to 60 ft range. This
span range lacks a standard design that fits Nebraska county practices in terms of speed
and simplicity of construction. The current systems being used are (a) Precast 1 by 2 ft
planks which can span up to 30 ft, (b) Cast-in-place slab bridges which can span up to 50
ft but require extensive field formwork, concrete placing, and curing, and are best when
constructed in three-span units, and (c) Inverted tees which can span 40 to 80 ft, but
require cast-in-place decks. The objective of this research project is to develop and
evaluate a cross section that can be easily configured for optimal structural efficiency
across a range of spans from 40 to 60 feet, while reducing the number of longitudinal
shear keys, and retaining the ease of construction presented by the plank design. To
achieve this objective, three phases of research were conducted. The first phase included
evaluating various sections for spans up to 60 ft. This phase was completed through an
extensive literature review and a, new type of cross-section was proposed in this study.
The second phase of the research evaluated a new type of transverse connection to
connect adjacent units of the proposed cross section for the proposed state county bridge
system through small-scale testing on ten slab specimens. Finally, two sets of full-scale
bridge specimens were tested to evaluate the system behavior, including the performance

of the proposed transverse connection that included the new type of mechanical
connection, and staggered rebar splice joints with a commercial high-performance
concrete used for the shear key. Test results indicated that the new type of mechanical
joint system (transverse connection of adjacent precast beam bridges) can resist an
experimental joint moment of 38 ft-kip on average, provided that the maximum spacing
between mechanical joints along the bridge span does not exceed 4 ft. It was also noted
that the high-performance concrete can carry a joint moment of 17.5 kip-ft per foot length
which is 2.5 times larger than the equivalent moment carried by the mechanical joint
system with self-consolidating concrete grout.

To my Fiancé,
Family,
and Friends
that have always supported me throughout this journey

ACKNOWLEDGEMENTS
This study was financially supported by the Nebraska Department of
Transportation. Their support is gratefully acknowledged. The experimental work in the
Large-scale Structures Laboratories in Lincoln and Omaha at University of Nebraska
would not have been possible with Peter Hilsabeck and Jacob Greenleaf through their
technical expertise, support, and management of the laboratories. I would like to thank
Dr. Maher Tadros and Dr. Amgad Girgis for their thoughtful advice and valuable
discussions that strengthened this work.

i
TABLE OF CONTENTS
TABLE OF CONTENTS .............................................................................................. i
LIST OF FIGURES .................................................................................................... iii
LIST OF TABLES ...................................................................................................... vi
CHAPTER 1. INTRODUCTION ................................................................................. 1 1.1 Background .......................................................................................................... 1 1.2 Research Objective .............................................................................................. 3 1.3 Research Scope .................................................................................................... 3
CHAPTER 2. LITERATURE REVIEW ..................................................................... 5 2.1 Introduction ......................................................................................................... 5 2.1 Computational Analysis....................................................................................... 5
2.1.1 University of Illinois Study (1965) .................................................................. 5 2.1.2 Texas A&M Study (1999, 2001) ...................................................................... 7 2.1.3 University of Nebraska Study (2011) ............................................................... 8
2.2 Experimental Testing, Field Monitoring, and Forensics .................................. 10 2.2.1 University of Washington Study (1986) ......................................................... 10 2.2.2 Case Western University Study (1995) .......................................................... 12 2.2.3 University of Cincinnati Study (1998) ........................................................... 13 2.2.4 Lehigh Study (2010) ...................................................................................... 15
2.3 Synthesis Study .................................................................................................. 17 2.3.1 University of Nebraska Study (1996) ............................................................. 17 2.3.2 University of Nebraska Study (2009) ............................................................. 19 2.3.3 Russell (2011) ............................................................................................... 21
2.4 Summary ............................................................................................................ 22
CHAPTER 3. MECHANICAL CONNECTION TEST PROGRAM ....................... 24 3.1 Introduction ....................................................................................................... 24 3.2 Slab Specimen Design and Variables ................................................................ 25 3.3 Material .............................................................................................................. 27
3.3.1 Concrete ........................................................................................................ 27 3.3.2 Steel .............................................................................................................. 28

ii
3.3.3 Grout ............................................................................................................. 28 3.4 Construction....................................................................................................... 30
3.4.1 Formwork ..................................................................................................... 30 3.4.2 Casting, Curing, and Storage ......................................................................... 32 3.4.3 Grouting ........................................................................................................ 34 3.4.4 Transportation ............................................................................................... 34
3.5 Test Setup and Test Procedure.......................................................................... 35 3.6 Test Results ........................................................................................................ 37
3.6.1 Specimen F-F-1 ............................................................................................. 37 3.6.2 Specimen C-C-1 ............................................................................................ 42 3.6.3 Specimen C-F-1 ............................................................................................ 48 3.6.4 Specimen C-C-2 ............................................................................................ 51 3.6.5 Specimen F-F-2 ............................................................................................. 55
3.7 Summary ............................................................................................................ 59
CHAPTER 4. FULL-SCALE TEST PROGRAM ..................................................... 61 4.1 Introduction ....................................................................................................... 61 4.2 Specimen Design ................................................................................................ 62 4.3 Material .............................................................................................................. 63
4.3.1 Concrete ........................................................................................................ 63 4.3.2 Steel .............................................................................................................. 63
4.4 Construction....................................................................................................... 63 4.4.1 Formwork and Steel Assembly ...................................................................... 63 4.4.2 Casting, Curing, and Storage ......................................................................... 69
4.5 Test Setup and Test Procedure.......................................................................... 73 4.6 Test Results ........................................................................................................ 76
4.6.1 Specimen F-M ............................................................................................... 76 4.6.2 Specimen F-UHPC ........................................................................................ 80
4.7 Summary ............................................................................................................ 82
CHAPTER 5. SUMMARY AND CONCLUSIONS ................................................... 83 5.1 Overview of Research ........................................................................................ 83 5.2 Experimental Program ...................................................................................... 84
5.2.1 Mechanical Connection Test Program ........................................................... 84 5.2.2 Full-Scale Test Program ................................................................................ 85
5.3 Future Research ................................................................................................. 85
BIBLIOGRAPHY ....................................................................................................... 87

iii
LIST OF FIGURES
Figure Page
Figure 1.1: Typical non-prestressed precast planks used for Nebraska county bridges (photos taken at the Midwest Underground casting facility) ..................................... 2
Figure 1.2: Steel casting forms and shear key details for the planks ................................. 2 Figure 1.3: Grouts between Longitudinal Shear Keys ...................................................... 3 Figure 2.1: Multibeam Bridge with Longitudinal Shear Keys (figure retrieved from Pool
et al. 1965) ............................................................................................................... 6 Figure 2.2: Four Spring Models Connecting Adjacent Beams (retrieved from Jones,
1999) ....................................................................................................................... 7 Figure 2.3: New Types of Keyway Details introduced in Texas Study for Double Tee
Multibeam Bridges (retrieved from Jones, 2001) ...................................................... 8 Figure 2.4: Wide-Joint and Narrow-Joint Connection Details Introduced in Nebraska
study (retrieved from Hanna et al., 2011) ................................................................. 9 Figure 2.5: Examples of Shear Keyway Details (retrieved from Stanton and Mattock,
1986) ..................................................................................................................... 11 Figure 2.6: Recommended Shape of Grout Key from University of Washington Study
(retrieved from Stanton and Mattock, 1986) ........................................................... 12 Figure 2.7: Grouted Shear Keyway Detail for Adjacent Box Girders (retrieved from
Huckelbridge et. al., 1995) ..................................................................................... 13 Figure 2.8: Top and Suggested Lower Keyway (retrieved from Miller et. al., 1998) ...... 14 Figure 2.9: Forensic Examination of Noncomposite Adjacent Precast Prestressed
Concrete Box Beam Bridge Failure in Pennsylvania (retrieved from Naito et al., 2010) ..................................................................................................................... 15
Figure 2.10: Various Practices in Adjacent Box Girder Bridge Design and Details (retrieved from Hanna et al., 2009) ......................................................................... 19
Figure 2.11: Major Problems Reported in Adjacent Beam Bridges: Longitudinal Crack along the Joint and Water and Chloride Penetration (retrieved from Russell, 2011) 22
Figure 2.12: Proposed Standardized “Flexible” Cross Section for Nebraska County Bridges .................................................................................................................. 23
Figure 3.1: Mechanical Connection Details for Precast Adjacent Beam Bridges ............ 24 Figure 3.2: Plan and Section View of Slab Specimens Connected ................................. 26 Figure 3.3: Concrete Strength Growth ........................................................................... 27 Figure 3.4: Grout Compressive Strength Growth ........................................................... 29 Figure 3.5: Formwork for Mechanical Connection Slab Panels...................................... 31 Figure 3.6: Finished Slabs After Anchor Placement....................................................... 33

iv
Figure 3.7: Slab Panels with Mechanical Joints ............................................................. 33 Figure 3.8: Slab Transportation ..................................................................................... 34 Figure 3.9: Four-Point Bending Test Setup .................................................................... 35 Figure 3.10: Three-Point Bending Test Setup ................................................................ 36 Figure 3.11: Four-point Bending Test Setup (Specimen F-F-1)...................................... 37 Figure 3.12: Initial Cracking at the Grout Interface (Specimen F-F-1) ........................... 38 Figure 3.13: Concrete Crushing at Top (Specimen F-F-1) ............................................. 39 Figure 3.14: Grouted Joint Close-up Photo at Failure (Specimen F-F-1) ........................ 39 Figure 3.15: Load-Displacement Curve (Specimen F-F-1) ............................................. 40 Figure 3.16: Specimen F-F-1 Joint Close-up Photo after Failure .................................... 41 Figure 3.17: Mechanical Joint Connecting the adjoining Slabs after Failure .................. 42 Figure 3.18: Four-point Bending Test Setup (Specimen C-C-1) ..................................... 43 Figure 3.19: Initial Cracking through the Grout (Specimen C-C-1) ................................ 43 Figure 3.20: Crack Propagation through the Grout (Specimen C-C-1) ........................... 44 Figure 3.21: Specimen C-C-1 at Failure (view from South side) .................................... 44 Figure 3.22: Specimen C-C-1 at Failure (view from North side) .................................... 45 Figure 3.23: Load-Displacement Curve (Specimen C-C-1) ............................................ 46 Figure 3.24: Mechanical Joint Shear Failure (Specimen C-C-1)..................................... 47 Figure 3.25: Four-point Bending Test Setup (Specimen C-F-1) ..................................... 48 Figure 3.26: Initial Cracking at the Grout Interface (Specimen C-F-1) ........................... 49 Figure 3.27: Crack Propagation (Specimen C-F-1) ........................................................ 49 Figure 3.28: Specimen C-F-1 at Failure ......................................................................... 50 Figure 3.29: Load-Displacement Curve (Specimen C-F-1) ............................................ 51 Figure 3.30: Three-point Bending Test Setup (Specimen C-C-2) ................................... 52 Figure 3.31: Initial Cracking at the Grout Interface (Specimen C-C-2) .......................... 52 Figure 3.32: Crack Propagation (Specimen C-C-2) ........................................................ 53 Figure 3.33: Specimen C-C-2 at Failure ........................................................................ 53 Figure 3.34: Load-Displacement Curve (Specimen C-C-2) ............................................ 54 Figure 3.35: Three-point Bending Test Setup (Specimen F-F-2) .................................... 55 Figure 3.36: Initial Cracking at the Grout (Specimen F-F-2) .......................................... 56 Figure 3.37: Inclined Cracking through the Grout (Specimen F-F-2) ............................. 56 Figure 3.38: Grout Joint Close-up Photo (Specimen F-F-2, South view) ........................ 57 Figure 3.39: Shear Key before Failure (Specimen F-F-2, North view) ........................... 57 Figure 3.40: Specimen F-F-2 at Failure ......................................................................... 58 Figure 3.41: Load-Displacement Curve (Specimen F-F-2) ............................................. 59 Figure 4.1: Cross Section of Full-Scale Specimens ........................................................ 62 Figure 4.2: Formworks for Full-Scale Bridge Specimens ............................................... 64 Figure 4.3: Full-Scale Formwork Assembly .................................................................. 65 Figure 4.4: Complete Full-Scale Formwork for County Bridge Specimen ..................... 66 Figure 4.5: Steel Reinforcement Assembly Placed in Formwork ................................... 67 Figure 4.6: Mechanical Joint with 8 in. Nelson Studs .................................................... 68 Figure 4.7: Casting Self-Consolidating Concrete for Full-Scale Bridge Specimens ........ 69 Figure 4.8: Finishing the Full-Scale Bridge Specimens .................................................. 70
v
Figure 4.9: Steel Assembly for the Second Pour ............................................................ 71 Figure 4.10: Proposed Standard County Bridge Section after Construction .................... 72 Figure 4.11: Test Specimens with Short Splice Length .................................................. 73 Figure 4.12: Full-Scale Specimen Test Setup ................................................................ 74 Figure 4.13: North-South and East-West view of the Test Setup .................................... 75 Figure 4.14: Close-up view of the Grouted Joint (Specimen F-M) ................................. 76 Figure 4.15: Specimen F-M at Failure ........................................................................... 77 Figure 4.16: Close-up view of the Grouted Joint (Specimen F-M) ................................. 78 Figure 4.17: Grout Shear Key Bond Failure (Specimen F-M) ........................................ 79 Figure 4.18: Load-Displacement of Specimen F-M ....................................................... 80 Figure 4.19: Test Setup and Loading of Specimen F-UHPC .......................................... 81 Figure 4.20: Load-Displacement of Specimen F-UHPC ................................................ 81

vi
LIST OF TABLES
Table Page
Table 3.1: Concrete Compressive Strength Data ............................................................ 28 Table 3.3: Grout Compressive Strength Data ................................................................. 29 Table 3.4: Experimental Joint Moment and Total Load Applied .................................... 60

1
CHAPTER 1. INTRODUCTION
1.1 Background
Across the country many states are faced with the same issue of an aging infrastructure,
and Nebraska is no different. Approximately, 60% of the bridges in the local system were
constructed between the 1930’s and 1960’s. Of the 11,763-local system (county) bridges, 2,373
have been deemed structurally deficient
(http://www.nebraskalegislature.gov/pdf/reports/committee/transport/2014_lr528.pdf).
These statistics make Nebraska the 7th worst state for structural deficiencies in their rural bridge
systems (approximately 1 in 5 rural bridges). Approximately 40% of the bridges built between
1930 and 1960 span between 40 to 60 ft, which is the primary focus of this project. This span
range appears to be lacking a standard design that fits Nebraska county practices in terms of
speed and simplicity of construction. The Nebraska Department of Transportation is working
towards creating standard bridge designs that are easily constructed anywhere in the state,
durable, and cost effective to replace these aging bridges.
The Nebraska counties currently use a relatively shallow plank cross section that is 2’-
10” wide and 1’-8” deep (Figure 1.1) that can span between 30 to 40 feet. This cross section was
selected many years ago due to it being within the weight constraints of the cranes that were
owned by many of the counties at the time. For example, every county had a Bantom crane and
the planks shown in Figure 1.1 were the largest size these cranes could pick up at that time.
These planks could also be easily cast anywhere in the state without a prestressing bed as
shown in Figure 1.2. These planks are connected transversely with a shallow longitudinal shear
key and welded together at the top of the planks (Figure 1.2). Although the planks have proven to
be a viable option over the years there are still some limitations. It currently takes 14 to 16 of these

2
planks to construct a typical country bridge with the necessary width (30 – 32 ft wide) which creates
a large number of longitudinal shear keys (Figure 1.3).
(a) Planks used in multi-beam bridges in Nebraska (b) Reinforcing steel cages
Figure 1.1: Typical non-prestressed precast planks used for Nebraska county bridges
(photos taken at the Midwest Underground casting facility)
(a) Simple steel forms to cast planks (photo
taken at the Midwest Underground
Casting Facility in Nebraska)
(b) Shear key details for the joint
connections
Figure 1.2: Steel casting forms and shear key details for the planks
The grout between these longitudinal shear keys easily cracks and creates a path
for water and chlorides to penetrate through. Even though deicing salt may not be used

3
in the counties, vehicles that cross the bridges can bring chlorides into these joints. The
structural performance of these pieces is governed by their shear key. In addition, some
of these shear keys are connected with a continuous weld which creates a tedious task in
construction and in some cases can create additional camber to the planks.
Figure 1.3: Grouts between Longitudinal Shear Keys
1.2 Research Objective
The objective of this research project is to develop and evaluate a cross section
that can be modified to be used for spans up to 40 to 60 feet, while reducing the number
of longitudinal shear keys, and retaining the ease of construction offered by the plank
design. In addition to the proposed section, a new type of transverse connection will be
evaluated as a proof of concept.
1.3 Research Scope
This research was conducted in three phases such that a comprehensive design
standard can be developed and implemented. The first phase evaluated various bridges

4
sections up to 60 ft. This included solid planks, voided planks, box beams, and stemmed
members. At the end of this phase, a preferred section was chosen. The second phase
was composed of an experimental program that includes a small-scale testing of these
longitudinal shear key connections and their joint capacity of the most promising section
for Nebraska. This phase included the development of a new connection joint detail.
The third phase included a full-scale testing of the proposed section with the new
transverse connection joint. The results of the three phases are used to provide a final
design for a simple, structurally efficient, and economical bridge option for bridges with
40 to 60 ft span length. The results of this research from the three phases will be
integrated into developing design and construction recommendations for Nebraska
Department of Transportation that can systematically be used for Nebraska County
Bridges.

5
CHAPTER 2. LITERATURE REVIEW
2.1 Introduction
Many of the Nebraska county bridges needing replacement are in the 30 to 60 ft
range. This span range appears to be lacking a standard design that fits Nebraska county
practices in terms of speed and simplicity of construction. The current systems being
used are 1) precast one by two ft planks introduced in Chapter 1 which can span up to 30
ft (heavily used in Nebraska counties), 2) cast-in-place slab bridges which can span up to
50 ft but require extensive field formwork, concrete placing, curing, and are best when
constructed in three-span units, and 3) inverted tees which can span between 40 to 80 ft,
but require cast-in-place decks. This chapter provides a literature review regarding cross
sections (including solid planks, void planks, box beams, and stemmed members) that
can span up to 60 ft and are adjacent to each other (butted up against each other).
Previous research that includes computational analysis, experimental testing, field
monitoring, or synthesis studies of the cross sections mentioned above are provided in
this chapter.
2.1 Computational Analysis
2.1.1 University of Illinois Study (1965)
The experimental and numerical studies conducted by Newmark and Siess (1942)
provided the guidelines for the load distribution factors that were introduced in the earlier
AASHTO Standard Specifications for Highway Bridges (1957) which was a study of
simple-span I-Beam bridges. Based on these earlier studies conducted at the University
of Illinois, Pool et al. (1965) who evaluated multibeam bridges (Figure 2.1) and

6
suggested a method of calculating joint forces in the longitudinal shear keys through
numerical studies.
Figure 2.1: Multibeam Bridge with Longitudinal Shear Keys (figure retrieved from Pool et
al. 1965)
Five multibeam bridges with four or eight elements were used in the parametric
studies of this research. The authors assumed that the longitudinal shear keys that are
used to connect these individual elements are a continuous hinge that transmits
longitudinal, lateral, and vertical force at the joint and has no relative displacements. A
number of tables that consisted of the longitudinal, lateral, and vertical joint forces for a
concentrated wheel load applied at specific locations were reported. The tabulated results
can be applied to similar types of structures and multi-beam bridges that are solid planks,
hollow sections, or box cross sections. The conclusions of this study found that there are
discontinuities in the longitudinal joint forces where the concentrated wheel load was
applied. Lateral and vertical joint forces were distributed along the joint as the wheel

7
loads passed over the bridge. However, high concentrated forces will not be seen in a
real bridge if some lateral post-tensioning is present as shown in this study. This research
at the end concludes that the limitations of the study can be corrected to adequately
model the joint behavior through further experimental research on shear keys.
2.1.2 Texas A&M Study (1999, 2001)
The research team at the Texas A&M University looked into the lateral
distribution factors of multi-beam prestressed concrete box girders with a composite
concrete deck slab for twenty-two Texas Department of Transportation bridge
configurations. The springs that were implemented in these models at the grouted joints
for parametric studies considered the longitudinal, lateral, vertical, and rotational stiffness
in the transverse direction (Figure 2.2).
Figure 2.2: Four Spring Models Connecting Adjacent Beams (retrieved from Jones, 1999)

8
This research team conducted further studies on the lateral connection of double
tee bridges and looked into various keyway details for multi-beam bridges. As a result of
this study, Jones (2001) proposed a new connection detail (Figure 2.3) for these types of
bridges and evaluated the new connection behavior through static and cyclic testing.
Figure 2.3: New Types of Keyway Details introduced in Texas Study for Double Tee
Multibeam Bridges (retrieved from Jones, 2001)
2.1.3 University of Nebraska Study (2011)
In this study, Hanna et al. (2011) suggested a different approach on how adjacent
box beam bridges should be designed without having post-tensioned transverse
connections. Instead of post-tensioning the adjacent girders, the research team looked
into two different joint systems that eliminate the need for post-tensioning, diaphragms at
the end and intermediate supports, and a cast-in-place concrete topping. Both connection
types (the wide-joint or narrow-joint shown in Figure 2.4) utilized the AASHTO PCI box
section. The wide-joint system connected the top and bottom flange by a ¼ in.
confinement spiral around high tensile coil rods with an extra cavity formed out to allow

9
development length to take place. To reduce the cost of the wide-joint system, the
research team recommended using self-consolidating concrete in the shear keys to reduce
the time and cost associated with grouting. The narrow-joint system utilized a ¾ in.
diameter threaded rod at every eight feet with a 5 in. long coupling nut to connect the two
pieces at the top and bottom.
Figure 2.4: Wide-Joint and Narrow-Joint Connection Details Introduced in Nebraska study
(retrieved from Hanna et al., 2011)
Both of these joints were modeled as shell and frame elements to develop design
charts before testing an actual specimen. These design charts displayed the required
tension force in the connection for various bridge widths, and span-to-depth ratios.
Based on these parametric studies, the research team built three specimens to verify their
design charts. An IDOT connection using diaphragms and a single mid-level transverse
tie, the narrow-joint connection, and the wide-joint connection made up the three
specimens to be tested. All three connections were tested both under static and fatigue
load conditions. The moment capacity of the IDOT system with a 5 in. non-composite
concrete topping was 179 kip-ft while the wide-joint system achieved a capacity of 126
kip-ft. The narrow-joint system achieved a moment capacity of 119 kip-ft. The research

10
team compared these test results to their finite element models and found a difference of
19%, 0.8%, and a 30.3% between the theoretical capacity and the actual tested capacity
for IDOT connection, wide-joint connection, and narrow-joint connection, respectively.
With this data the research team concluded that the connections could be designed to
achieve comparable results without diaphragms or post-tensioning, which would be an
economical and practical alternative.
2.2 Experimental Testing, Field Monitoring, and Forensics
2.2.1 University of Washington Study (1986)
This research conducted at the University of Washington was another milestone
study that newly included the load distribution factors for precast multi-beam bridges
which was not introduced in the earlier 1983 AASHTO Standard Specifications for
Highway Bridges that was based on the studies completed in University of Illinois.
Stanton and Mattock (1986) found through their parametric grillage analysis that the
span-to-width ratio and the ratio of flexural-to-torsional stiffness are the most important
factors in load distribution in these multi-beam systems and the results of their study will
apply to multi-beam bridges with any cross section. The authors stated that unless the
bridge is very short and wide, the load distribution factor introduced in this study can be
applied to various single-stem and multi-stemmed precast bridge sections. The live load
distribution per lane for moment in interior beams tabulated in Table 4.6.2.2.b-1 in the
current AASHTO LRFD Bridge Design Specifications (2010) is based on the results of
this study.
This research also looked into the details of the connections in precast multi-beam
bridges. The authors conducted a nationwide survey that was collected through state and

11
county bridge engineers and precast producers who provided details for the different
shear keys they used (Figure 2.5).
Figure 2.5: Examples of Shear Keyway Details (retrieved from Stanton and Mattock, 1986)

12
They summarized that the survey showed that standard design and details were
lacking in these connections and that most of the joints were designed based on previous
experience or so called “rules of thumb”. As a result, Stanton and Mattock (1986)
evaluated the shear strength of a typical type of joint (grouted shear keys and welded
connectors) through experimental testing and suggested a shape for grout keys (Figure
2.6). The authors did recommend that further research should be conducted to verify the
local joint forces in grouted joints caused by wheel loads.
Figure 2.6: Recommended Shape of Grout Key from University of Washington Study
(retrieved from Stanton and Mattock, 1986)
2.2.2 Case Western University Study (1995)
A series of field tests were conducted by researchers (Huckelbridge et al., 1995)
at the Case Western Reserve University to evaluate the shear key performance of
adjacent multibeam box girder bridges in Ohio. The typical grouted shear keys at the
longitudinal joints between adjacent girders are shown in Figure 2.7. The relative
displacement between the girders across joints were measured through multiple passes by

13
a pre-weighted, tandem-axle dump truck. All six bridges that were monitored throughout
this process showed differential displacement across joints indicating fractures in the
grouted keys. It is interesting to note that this research also identified that the typical tie
bars that were used by the Ohio Department of Transportation at the time of research (1
in. diameter mild steel tie bars at distances up to 25 ft) at the girder mid-height in
transverse diaphragms had little effect and still should signs of shear key failure and
relative deflection between girders. The research team recommended moving the shear
key to neutral axis of the box girder section.
Figure 2.7: Grouted Shear Keyway Detail for Adjacent Box Girders (retrieved from
Huckelbridge et. al., 1995)
2.2.3 University of Cincinnati Study (1998)
Full-scale testing on adjacent box girder bridges were conducted by Miller et al.
(1998) at the University of Cincinnati to evaluate the grouted shear keys under
temperature and cyclic loads. The variables selected for the full-scale testing includes 1)
a non-shrink grout at the top keyway, 2) an epoxy grout at the top keyway, and 3) non-

14
shrink grout with the keyway located near the neutral axis of the girder (lowered keyway
– see Figure 2.8).
Figure 2.8: Top and Suggested Lower Keyway (retrieved from Miller et. al., 1998)
One of the keyways were grouted in late fall while the other two keyways were
constructed during summer. All of the cracks initially found in the keyway were initiated
through large changes in strain due to temperature change. Based on the fatigue test with
HS20-44 truck wheel load, it was observed that no additional cracks initiated due to the
cyclic loads other than the crack formed due to thermal loads. However, the cracks
formed through temperature changes did propagate further into the section due to the
truck load. The specimen with a non-shrink grout keyway that was placed at the top of
the girder was subjected to 41,000 cycles while the other two specimens were loaded up
to 1,000,000 cycles. It was observed that epoxy grout did work well but the difference in
coefficient of thermal expansion with concrete could cause high stresses in the keyways
and this research team believed more studies would be required with epoxy grouts.
Although, some cracks were still found, this research study concluded that the neutral

15
axis keyway performs better than top keyways and recommended that the keyways in
most of the partial-depth joints should be moved down to the neutral axis of the girder.
2.2.4 Lehigh Study (2010)
In 2007, the state of Pennsylvania had 3,291 adjacent prestressed box beam
bridges in service and of those 590 were labeled as structurally deficient. On December
27th, 2005 a fascia beam of the Lake View Drive Bridge in Pennsylvania failed under
service loading (Figure 2.9). Although these incidents are never welcomed, it did allow a
team of researchers (Naito et al., 2010) to investigate what caused this bridge to fail. It is
interesting to note that this specific bridge was actually inspected by the state in 2004.
Figure 2.9: Forensic Examination of Noncomposite Adjacent Precast Prestressed Concrete
Box Beam Bridge Failure in Pennsylvania (retrieved from Naito et al., 2010)

16
From this inspection it was noted that an impact may have happened to a specific
beam, and that 20 of the 60 strands were broken in that member. The other members
were only moderately damaged and the bridge was rated as poor (four on a scale of zero
to nine). At this point beam replacement was labeled as a priority. It was later
discovered after the collapse through inspection that 39 of the 60 strands were severely
damaged through corrosion and it was believed that there was no indication of an impact
before the collapse. This bridge had four spans each of which had eight pretensioned box
beams with an approximate two-inch bituminous overlay with no water-proofing
membrane. The bridge beams were poured and erected in 1960. The clear cover from
the strands to the exterior surface for the beam that collapsed ranged from 1 5/16 inches
to 1 9/16 inches which met the 1953 AASHTO Standard Specifications for Highway
Bridges but was less than the minimum cover of 1.5 inches specified by the 1965
AASHTO specifications.
The next item the research team looked into was the shear reinforcement. The
shear stirrups were not placed below the bottom layer of prestressing strands and for the
ease of construction an L-shape was used and placed between the first and second layer
of strands which was common practice at the time the bridge was constructed. It should
be noted this is no longer a standard practice. It was also found that many of the top and
bottom L-shaped stirrups were not physically lap-spliced in the middle and were separate
from each other. Due to this lack of splice contact and also the short development length
provided (12 in.), the authors were concerned about the shear capacity for these box
girders. An interesting note for this bridge was the way in which the void was formed
and the drains that were used. The voids were constructed with the use of cardboard void

17
forms. It was found that these forms moved during concrete placement and created a
final product that did not match the design drawings with regards to wall thickness. In
the late 1950’s, ¾ inch diameter drains were placed in both the top and bottom flange.
These drains allowed moisture to enter the void and wet the cardboard. This cardboard
eventually degraded and possibly blocked the exit drains leading to excess water being
held inside the void. The excess water not only added to the potential corrosion of
strands but also increased the total live load on the member. Both air content and
concrete strength were found to be within the design requirements. Upon investigation it
was found that over 40% of the strands were found to be in serious or critical condition,
which means that the strands were deteriorated to a point that seriously affected the
primary structural components of the bridge and corrective action is needed based on the
PennDOT Superstructure Condition Rating Guidelines. With all the forensics of this
bridge, there were two major takeaways with respect to bridge inspection and evaluation
that the research team suggested to prevent a similar failure. The first was to deduct
125% of the total cross-sectional area from all exposed strands when calculating the
structural capacity. The other suggestion based on the observations of this collapse case
was that strands adjacent to or intersecting a crack should not be considered as an
effective strand due to possible corrosion.
2.3 Synthesis Study
2.3.1 University of Nebraska Study (1996)
Researchers at the University of Nebraska (El-Remaily et al., 1996) took an in-
depth look into the transverse design details of adjacent precast prestressed concrete box
girder bridges in the United States and in Japan. Their research began looking into

18
current practices here in the United States and associated problems with the current
practice that have been recorded during bridge inspections. The surveys showed it was
commonly noted that there was longitudinal cracking along the grouted shear keys with
reflective cracking in the overlay above the shear keys. These cracks often lead to
penetration of water and chemicals that later creates spalling, staining, and reinforcement
corrosion. When reviewing the common practice in Japan it was noted that the box
girders were very similar in design, except for the shape and size of the shear keys which
were much larger than the ones in the US. In addition, higher levels of transverse post
tensioning were used in Japan compared to the practice in the US. This practice in Japan
led to longitudinal cracking to be seldom reported. After comparing the practices in both
countries, El-Remaily et al. (1996) proposed a modification to the common practice in
the United States. A design chart consisting of the required effective prestressing force at
the diaphragm in the midspan for various bridge widths for four standard AASHTO-PCI
box girders (depth of 27, 33, 39, and 42 in.) were provided in this study. The study states
that the required post-tensioning force for the quarter-point diaphragms are found to be
similar with the force required in the midspan. For the end diaphragms, the study
suggests to provide a minimum of 250 psi for effective post-tensioning stress. All of
these post-tensioning forces are recommended to be applied through tendons at both the
top and bottom in order to provide sufficient flexural strength. Based on the recorded
history of Japanese bridges the researchers believe this would be an economical solution
to increase the longevity of adjacent precast prestressed concrete box girder bridges in the
United States.

19
2.3.2 University of Nebraska Study (2009)
Hanna et al. (2009) looked into the design practice of transverse post-tensioning
of precast, prestressed adjacent-box-girder bridges (Figure 2.8) and provided an extensive
literature review. Based on their literature review, they stated that the current design
practice of box girder bridges without post-tensioning often leads a recurring problem of
longitudinal cracking along the grouted joints. They introduced a bridge failure that took
place in Pennsylvania on December 27, 2005 and in a railroad bridge in Nebraska in 2007
that had a similar design. Hanna et al. (2009) also introduced numerous practices across
the United States, Canada, Japan, and Korea including composite or non-composite
systems, full-depth or partial-depth shear keys, and designs with or without the presence
of post-tensioning.
Figure 2.10: Various Practices in Adjacent Box Girder Bridge Design and Details (retrieved
from Hanna et al., 2009)

20
. The team noted a particular study that looked into practices in the state of New
York (Lall et al., 1998). After 1992, the state of New York changed their design
standards for precast concrete girders 1) to have full-depth shear keys, which was only
about 12 in. from the top previously, and 2) to increase the number of transverse tendons
to three for short span bridges less than 50 ft which had no transverse tendons prior to
1992. Lall et al. (1998) reported that after the standards were implemented only 23% of
these types of bridges built within the three-year span after the change showed
longitudinal cracking in the joints.
Another study (Greuel et al., 2000) introduced a high performance concrete
adjacent box girder bridge built by the Ohio DOT which consisted of a shear key at the
mid-depth of the section. These girders were transversely tightened with threaded rods at
the ends and quarter points of the bridge. The bridge was loaded with four DOT trucks
and the girders were observed to be working together based off the smooth deflection
curve the girders created. Lall et al. (1998) also listed the recommendations and input
provided from the PCI subcommittee survey conducted through the 29 states and 3
provinces in United States and Canada regarding the lessons learned from the design and
construction of adjacent box girder bridges. A few preventive actions that can be taken to
reduce or eliminate the cracks that were reported from many transportation agencies that
participated in the survey. These suggestions included 1) having a cast-in-place concrete
deck on top of the adjacent girders, 2) the use non-shrink grout, 3) the use full-depth
shear keys rather than partial-depth keys, 3) apply transverse post-tensioning that helps
with load distribution, minimizes differential deflections, and minimizes longitudinal
cracking, 4) have intermediate and end diaphragms to provide necessary stiffness in the

21
transverse direction, 5) include wide bearing pads and seats to eliminate rocking while
grouting the joints, 6) eliminate the use of welded connections between adjacent girders
that cause inadequate sealing of joints.
Based on the extensive literature review, Hanna et al. (2009) emphasized the
needs in studying the amount of post-tensioning needed to limit the differential deflection
between girders. They finalized the study by conducting a parametric study using grid
analysis to find the required amount of effective post-tensioning force for different bridge
widths, depths, span lengths, and skew angles. They provided a simplified formula that
gives a conservative estimate of the required transverse post-tensioning force for various
conditions and also provided a useful design example for a single span bridge as a
summary.
2.3.3 Russell (2011)
This research provides a good summary of design, construction, maintenance, and
inspection practices for adjacent precast concrete box beam bridges. From a nationwide
survey conducted through a NCHRP Synthesis 393 (Russell 2009), it was reported that
approximately two-thirds of the state departments of transportation use adjacent box
beam bridges. The two major problems identified were longitudinal crack along the joint
and water and chloride penetration through the joint (Figure 2.11). Most of the state
departments of transportation reported that sufficient transverse post-tensioning and the
use of concrete topping slab would be the most effective way to increase the long-term
performance. In addition, most of the longitudinal keyways between these adjacent
beams were reported to be partial depth and it would be beneficial to require full-depth
shear keys in design to also increase the long-term performance of these structures.

22
Figure 2.11: Major Problems Reported in Adjacent Beam Bridges: Longitudinal Crack
along the Joint and Water and Chloride Penetration (retrieved from Russell, 2011)
2.4 Summary
Based on the literature review that includes computational analysis, experimental
testing, field monitoring, and synthesis studies on bridges with adjacent beams it is
obvious that the lateral load distribution and load transfer between individual beams are
highly dependent on the keyway joint details. Although, many different types of shear
keyway details were developed from the nationwide surveys and field measurements, it
was identified that these grouted joints still crack, create longitudinal cracks on top of the
bridge deck, and create a path for water or chloride leakage. Many of the state and
county engineer, and precast producers identified that the solutions to this recurring
problem could be 1) providing a full-depth shear key, 2) post-tensioning the adjacent
beams in transverse direction, or 3) topping these adjacent beams with cast-in-place deck.
The objective of this research is to suggest a standard design that can span up to 40 to 60
feet (high needs in Nebraska counties) while retaining the ease of construction factor
presented by the plank design. In order to resolve the problems seen in this literature

23
survey without complicating the construction for counties (not introducing post-
tensioning, or including cast-in-place decks), this study is suggesting a “flexible” precast
cross section (Figure 2.12), which is 8 ft wide and depending on the span length varies
the depth to be between 1 to 3 ft. This cross section includes the deck which reduces the
cast-in-place construction and is wider than a typical single tee section. The width of the
web is wider than the typical single tee cross section but is shallower than a typical bulb
tee and is stable enough to stand alone. With an 8 ft wide cross section, that is not very
different than a wider plank with a stem in the middle, will allow a smaller number of
joints for a typical county bridge that has a width of 25-35 ft. The total weight for these
cross sections would be 13, 22, and 40 tons for a span length of 30, 40, and 60 ft span
length, respectively. This would allow type I, II, and III cross sections to be handled
easily by the county level cranes. Concrete diaphragms can be added at the ends to
increase the stability at supports. This study will conduct small-scale and full-scale
testing on various types of joint details for this cross section and also investigate the
possibilities of implementing high-strength steel reinforcement as main reinforcement.
Figure 2.12: Proposed Standardized “Flexible” Cross Section for Nebraska County Bridges

24
CHAPTER 3. MECHANICAL CONNECTION TEST PROGRAM
3.1 Introduction
The objective of this phase of the research is to investigate the shear and moment
capacity of a new type of mechanical connection that is proposed to be used in
connecting adjacent precast bridge sections proposed in the previous chapter. Each
mechanical joint consists of four all threads (coarse or fine threaded) with nuts, an
alignment plate, an anchor plate, and a 1.25 in. ASTM A490 bolt with nut to connect the
two slabs as shown in Figure 3.1. Three and four-point bending tests were conducted to
evaluate the shear and moment capacity of the proposed mechanical connection for the
adjacent bridge sections.
Figure 3.1: Mechanical Connection Details for Precast Adjacent Beam Bridges

25
3.2 Slab Specimen Design and Variables
Each slab was built to be 3 ft-11.5 in. by 4 ft having the grouted keyway in the
middle of the slab. After grouting the 1 in. gap left between the slabs the connected slab
specimen becomes 8 ft by 4 ft. This is to represent a cut section of half of the precast
beam connected with half of the other adjacent beam, simulating having transverse
connections every 4 ft for the 8 ft wide precast section. Each slab was reinforced with
top and bottom mat of #4 bars as shown in Figure 3.2. The slab specimens are 7.5 in.
deep which is the depth of the proposed section (Figure 2.12) including the deck.
(a) rebar layout (b) bolt connection (c) threaded bar connection

26
Figure 3.2: Plan and Section View of Slab Specimens Connected
Two types of threaded bars, fine and coarse all-threads, anchoring the mechanical
plates to the slab were tested. Five small-scale slab specimens that included these
mechanical connections were tested. Two specimens with fine threaded bars, two
specimens with coarse threaded bars, and one specimen with a mix of fine threaded bars
on one side and coarse threaded bars on the other side were tested.

27
3.3 Material
3.3.1 Concrete
The concrete was obtained from a local ready-mix supplier (Lyman-Richey Co.).
Five specimens were poured with the same mix with one truck which had a target
compressive strength of 5,000 psi. Standard compression tests using 6 by 12 in. cylinders
were performed to determine the average compressive strength at 7, 14, 21, and 28 days
after the cast. The target strength was achieved after 7 days and the average compressive
strength at 28 day was 6,790 psi. The strength-gain curve is shown in Figure 3.3 and the
test results of the measured strength are provided in Table 3.1.
Figure 3.3: Concrete Strength Growth

28
Table 3.1: Concrete Compressive Strength Data
Maturity Compressive Strength
(psi) Ea. Avg.
7 (4/27/2017)
5,230 4,970 4,520
5,160
14 (5/4/2017)
5,950 5,890 6,050
5,940
21 (5/11/2017)
6,450 6,560 6,780
6,430
28 (5/18/2017)
6,960 6,790 6,690
6,720
3.3.2 Steel
Conventional Grade 60 steel was used for this project and was provided by Carrol
Supply in Council Bluffs, Iowa.
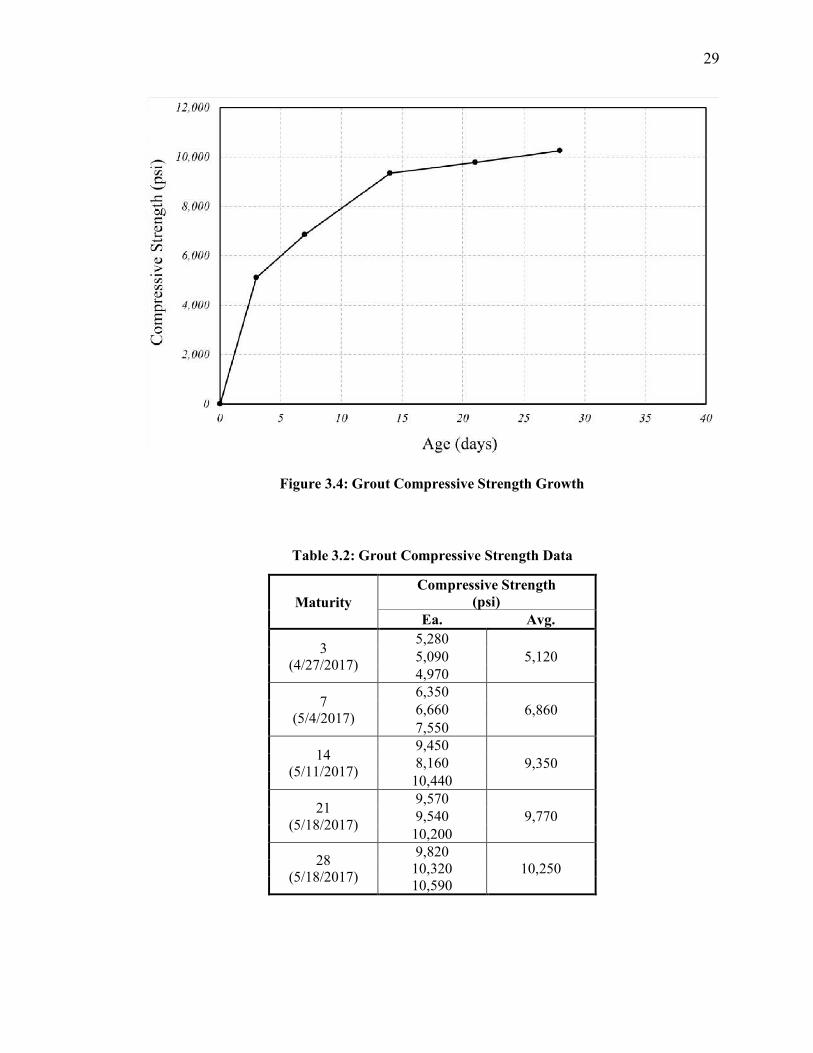
3.3.3 Grout
A non-shrink grout with an expected compressive strength higher than the
compressive strength of concrete used for the slab specimens was selected (MasterFlow
928 from the BASF Corporation). Grout specimens were standard 2 by 2 in. cubes per
ASTM C109/C109M. These specimens were tested at 3, 7, 14, 21, and 28 days after the
pour. The average compressive strength at 28 day was 10,250 psi. The strength-gain
curve is shown in Figure 3.4 and the measured data are provided in Table 3.3.
29
Figure 3.4: Grout Compressive Strength Growth
Table 3.2: Grout Compressive Strength Data
Maturity Compressive Strength
(psi) Ea. Avg.
3 (4/27/2017)
5,280 5,120 5,090
4,970
7 (5/4/2017)
6,350 6,860 6,660
7,550
14 (5/11/2017)
9,450 9,350 8,160
10,440
21 (5/18/2017)
9,570 9,770 9,540
10,200
28 (5/18/2017)
9,820 10,250 10,320
10,590

30
3.4 Construction
3.4.1 Formwork
Five platforms were built with each platform providing the formwork for two
slabs as shown in Figure 3.5 The base platforms were built with 4 by 8 ft (¾ in. thickness,
BC sanded) plywood supported with 2 by 4 in. lumber at 12 in. spacing. The 7.5 in. form
walls were constructed out of 4 by 8 ft plywood ripped down to a 7.5 in. height, which is
the thickness of the slab specimens. The side walls were reinforced along the bottom by
a flat 2 by 4 in. lumber around the entire perimeter. The two slabs were divided by the
same plywood and a keyway block out was provided by a 1 by 8 in. board cut to size with
45-degree cuts on each end as shown in the top right photo of Figure 3.5. The divider
was built to allow the mechanical joint to be fastened together and ensure the two slab
specimens would match up after they are poured. Finally, a block out was built around
the mechanical plate, nut, and bolt as shown in Figure 3.5.
It should be noted that the block out around the mechanical joint follows the
details provided in Figure 3.2. It should also be noted that these block out designs should
be redesigned to allow more space for the removal and replacement of the connection
bolt. This was learned after the building experience.

31
Figure 3.5: Formwork for Mechanical Connection Slab Panels

32
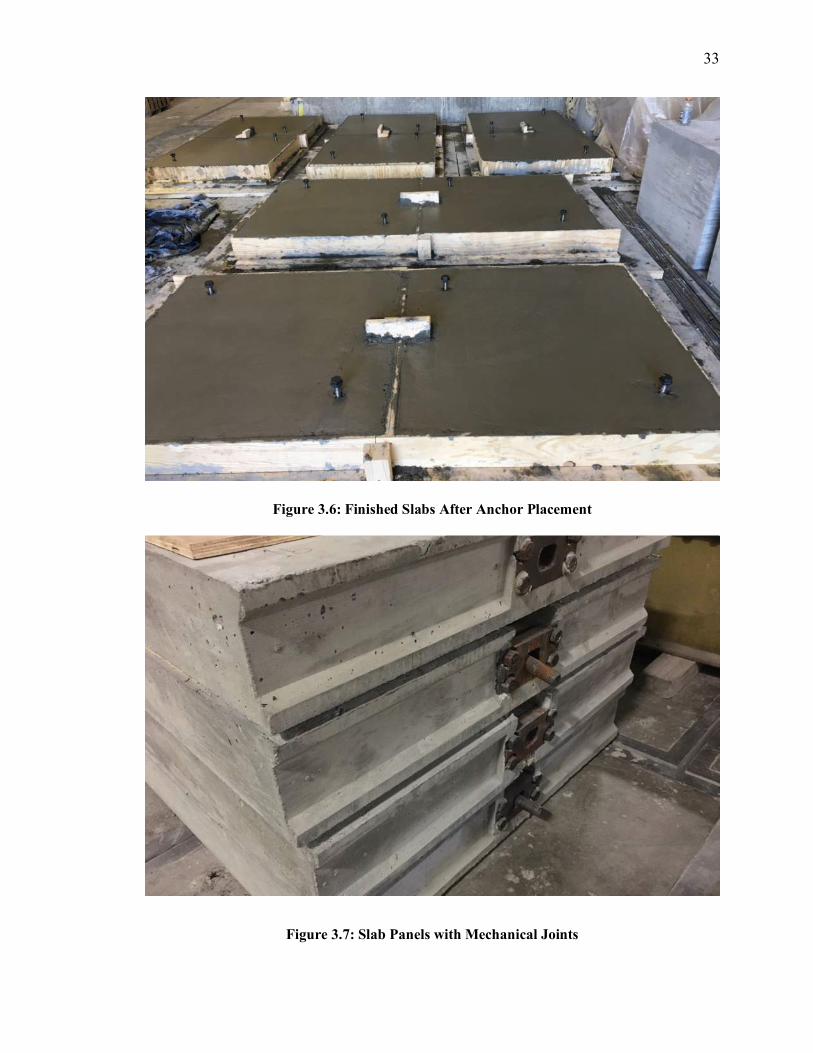
3.4.2 Casting, Curing, and Storage
All ten slabs were casted on April 20th, 2017 at the Large-Scale Structures Lab
located inside the Peter Kiewit Institute at University of Nebraska, Omaha Campus. The
concrete was provided by a local ready-mix supplier. Concrete cylinders (6 by 12 in.)
were poured with the first concrete to come off of the truck. Seven individuals worked
together to pour, place, and finish the specimens. Each slab was finished first with a
magnesium trowel and edged. Once the surfaced hardened, each slab was again finished
with a steel trowel to get a smooth surface. Around this time in the operation the
concrete was ready to have the pick point anchors placed as shown in Figure 3.6.
The slabs were then allowed to rest for around two hours before they were
covered with burlap, covered with water, and finally had plastic placed over the top. The
same covering process was also used for the cylinders to ensure they had similar curing
conditions. For the next seven days after the pour the slabs and cylinders were watered at
least once every day and twice when needed to insure the burlap remained saturated. The
slabs were then removed from the forms after seven days. The test cylinders were also
removed from their plastic forms around the same time. Both the slabs and cylinders
were stored in the lab until the test date (Figure 3.7).
33
Figure 3.6: Finished Slabs After Anchor Placement
Figure 3.7: Slab Panels with Mechanical Joints

34
3.4.3 Grouting
Each slab was laid together to provide a one-inch gap between the slabs as per the
drawings provided in Figure 3.2. The gap width was kept with the help of plastic shims
placed in between the metal plates (Figure 3.1). Each mechanical joint was tightened to
“snug tight”. Plywood was used to form up the bottoms and ends of the keyway. The
slabs were grouted with the MasterFlow 928 as described before.
3.4.4 Transportation
Due to scheduling conflicts at the Large-Scale Structures Lab in PKI (Omaha
Campus), it was decided that the slabs would be transported to Lincoln to be tested at the
Large-scale Structures Lab at the University of Nebraska-Lincoln Campus. Ayars &
Ayars, Inc. provided the transportation of these slabs. Excellent care was taken during
loading, transportation, and unloading of the specimens as shown in Figure 3.8.
Figure 3.8: Slab Transportation

35
3.5 Test Setup and Test Procedure
The testing rig was setup in two separate configurations. The first setup is a four-
point bending test with two supports placed at the far ends of the specimen and two
spreader beams were placed on either side of the joint 9 in. from the center. Rollers were
placed at all four contact points and a rubber pad was provided between the slab
specimen and roller loading plates as shown in Figure 3.9. Load cells were used to
measure the loads applied. String potentiometers were used to measure the displacement
and six of these sensors were placed on each side of the specimen as shown below.
Figure 3.9: Four-Point Bending Test Setup

36
The second configuration for three-point bending consists of the same locations
for the support but the center of loading placed 2.5 in. from the center of the slab as
shown in Figure 3.10. For the three-point bending test both load cells were placed on the
spreader beam on each side of the rods where load was applied. Four string
potentiometers were placed on each side of the specimen as shown in Figure 3.10.
Figure 3.10: Three-Point Bending Test Setup
For both the three-point and four-point bending tests the same basic procedures
were used. Each specimen was lifted into place and set squarely on the supports. At this
point all the hooks for the string pots were placed with adhesive to the specimen. The

37
spreader beams were then lifted as an assembly and placed on the specimen. Hydraulic
lines were hooked up and the data acquisition system was checked to make sure sensors
were reading correctly. Force was applied through a hydraulic pump. Load was
continually added in a small increment (0.5-1 kip) until there was a significant drop in the
load capacity of the specimen.
3.6 Test Results
3.6.1 Specimen F-F-1
This section provides the test results of four-point bending test on the specimen
containing fine all-threads on each side (Specimen F-F-1, Figure 3.11). The first crack
was observed at the interface between the grout and the specimen as shown in Figure
3.12, which was also within the constant moment region where the moment was the
highest.
Figure 3.11: Four-point Bending Test Setup (Specimen F-F-1)

38
Figure 3.12: Initial Cracking at the Grout Interface (Specimen F-F-1)
As more load was applied, the crack at the interface opened up at the bottom
allowing rotation and eventually crushed the concrete on the top part of the slab as shown
in Figure 3.13, and the grout can be seen eventually pulling away from the concrete on
the bottom side at failure from a close-up photo (Figure 3.14). The load-displacement
curve for Specimen F-F-1 is shown in Figure 3.15. The maximum load reached was 8.5
kips on one side of the slab (from two hydraulic rams) and the deflection at peak load
was 1.6 in. The test was terminated when there was an obvious drop in the load-
displacement curve as shown in Figure 3.15 and the slab was not able to take more load
but deflection was increasing due to the rotation at the joint. Considering the reading at
failure load from the two load cells which were 8.5 kips, the spreader beam weight under
the hydraulic ram which was 2 kips, and including the moment caused by the self-weight
(4.6 kip-ft), the total experimental joint moment was 37 kip-ft.

39
Figure 3.13: Concrete Crushing at Top (Specimen F-F-1)
Figure 3.14: Grouted Joint Close-up Photo at Failure (Specimen F-F-1)

40
Figure 3.15: Load-Displacement Curve (Specimen F-F-1)
Figure 3.16 shows a close-up photo of the joint taken after the test was complete.
Other than the shear crack that initiated at the corner of the joint where the shape changes
that propagated through the slab to the loading points and some cracks initiating from the
corners of the block out area, no other cracks were observed in the two slabs connected.
The grout was taken out after the testing was complete to observe the performance of the
mechanical joint after failure. As shown in Figure 3.17, the two slabs were still
connected by the ASTM A490 bolt through the mechanical joint. All fine threaded bars
were embedded in concrete well.

41
Figure 3.16: Specimen F-F-1 Joint Close-up Photo after Failure

42
Figure 3.17: Mechanical Joint Connecting the adjoining Slabs after Failure
3.6.2 Specimen C-C-1
This section provides the test results of the four-point bending test on the
specimen containing coarse all-threads on each side (Specimen C-C-1, Figure 3.18). The
first crack was observed at a similar location as shown in Specimen F-F-1 at the interface
between the grout and the specimen in the south side (front). However, on the north side
(back), as shown in Figure 3.19, the crack that initiated from bottom started to shear
through the grouting. As more load was applied, the crack propagated in an inclined
direction towards the loading point as shown in Figure 3.20. The crack at the joint
opened up wide allowing the two slabs to rotate until the top of the grout crushed (Figure
3.21). However, the top of the concrete slab did not crush as much as Specimen F-F-1.

43
Figure 3.18: Four-point Bending Test Setup (Specimen C-C-1)
Figure 3.19: Initial Cracking through the Grout (Specimen C-C-1)

44
Figure 3.20: Crack Propagation through the Grout (Specimen C-C-1)
Figure 3.21: Specimen C-C-1 at Failure (view from South side)

45
Figure 3.22: Specimen C-C-1 at Failure (view from North side)
Figure 3.23 is the load-displacement curve for Specimen C-C-1. The maximum
load reached was 8.4 kips and the deflection at the peak load was 1.46 in. The test was
terminated when there was a significant drop in the load and the slab were not able to
take more load but deflection was increasing due to the rotation at the joint. As shown in
Figure 3.23, although the maximum load was similar to Specimen F-F-1, the load drop
occurred at a deflection less than the case with F-F-1 and there was large rotation at
failure as shown in Figure 3.22. This is probably the reason crushing was mainly seen in
the grouting rather than the concrete slab. It is also possible that the fine threads bond
better than the coarse threads and this may be the reason there are less obvious cracks
around the block out area. Considering the reading of the failure load from the two load
cells was 8.4 kips, the spreader beam weight under the hydraulic ram was 2 kips, and

46
including the moment caused by the self-weight (4.6 kip-ft), the total experimental joint
moment was 36.6 kip-ft.
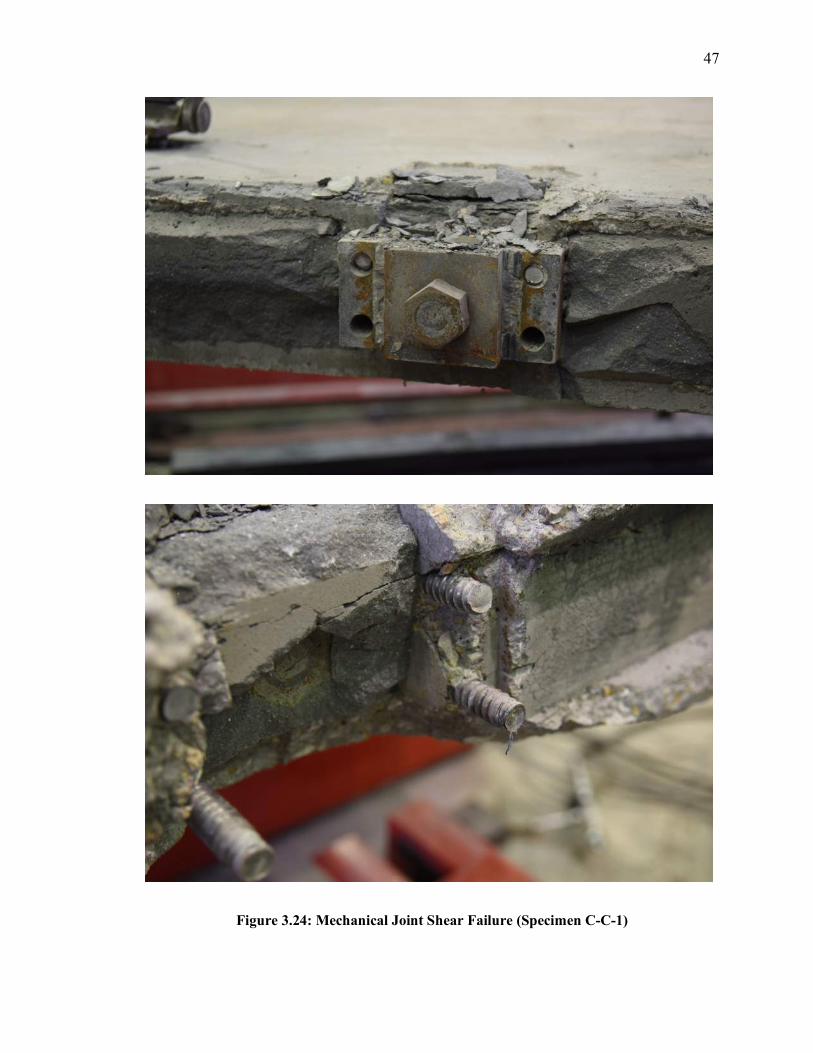
Figure 3.23: Load-Displacement Curve (Specimen C-C-1)
After the test was complete, all the grout was taken out to check the mechanical
connection. The coarse threaded bars were noted to have sheared off as shown in Figure
3.24. This was possibly caused by less bond of the coarse threads compared to the fine
threaded bars. If the threaded bars were slipping near failure, there is a possibility that all
the moments were taken by these threaded bars before failure, which is the reason
Specimen C-C-1 was not able to take more rotation and the load capacity dropped
suddenly at a smaller deflection value than Specimen F-F-1.
47
Figure 3.24: Mechanical Joint Shear Failure (Specimen C-C-1)

48
3.6.3 Specimen C-F-1
This section provides the test results of the four-point bending test that was
conducted on the specimen containing fine all-threads on one side and coarse all-threads
on the other side (Specimen C-F-1, Figure 3.25). Initial cracking was shown at the
interface between the slab and the grouting similar to other specimens as shown in Figure
3.26. This crack shown in the interface opened larger as more load was applied. And, as
load increased, the crack at the interface started to propagate in an inclined direction
starting from where the shape of the grout shear key changes towards the loading point as
shown in Figure 3.27. There was no crack through the grout as shown in the case with
Specimen C-C-1. The top of the grouting crushed before failure as shown in Figure 3.28.
Figure 3.25: Four-point Bending Test Setup (Specimen C-F-1)

49
Figure 3.26: Initial Cracking at the Grout Interface (Specimen C-F-1)
Figure 3.27: Crack Propagation (Specimen C-F-1)

50
Figure 3.28: Specimen C-F-1 at Failure
The load-displacement curve for Specimen C-F-1 is shown in Figure 3.29. The
maximum load reached was 7.8 kips and the deflection at peak load was 1.2 in. The test
was terminated when there was an obvious drop in the load-displacement curve as shown
in Figure 3.29 and the slab was not able to take more load while deflection was
increasing due to the rotation at the joint. Considering the reading at failure load from
the two load cells which was 7.8 kips, the spreader beam weight under the hydraulic ram
which was 2 kips, and including the moment caused by the self-weight (4.6 kip-ft), the
total experimental joint moment was 35 kip-ft. This was the specimen that carried the
least load. It is interesting to note that although the load dropped earlier, unlike
Specimen C-C-1, this specimen was able to rotate and deflect more than C-C-1. The
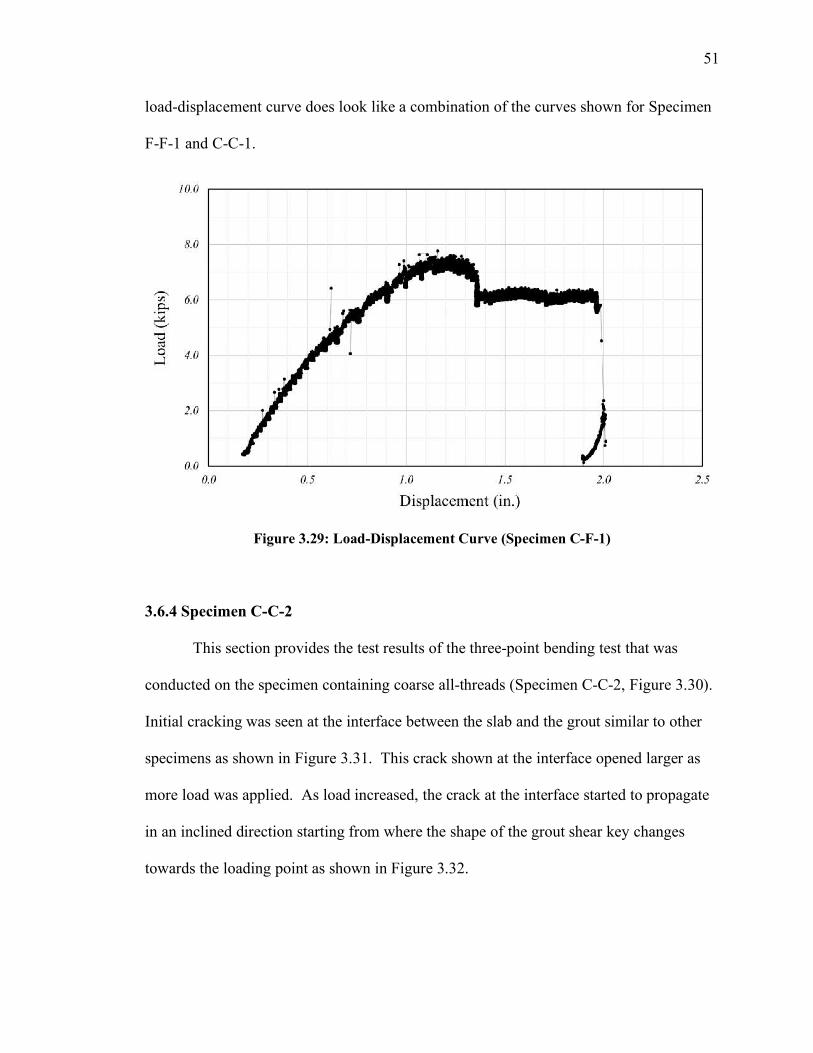
51
load-displacement curve does look like a combination of the curves shown for Specimen
F-F-1 and C-C-1.
Figure 3.29: Load-Displacement Curve (Specimen C-F-1)
3.6.4 Specimen C-C-2
This section provides the test results of the three-point bending test that was
conducted on the specimen containing coarse all-threads (Specimen C-C-2, Figure 3.30).
Initial cracking was seen at the interface between the slab and the grout similar to other
specimens as shown in Figure 3.31. This crack shown at the interface opened larger as
more load was applied. As load increased, the crack at the interface started to propagate
in an inclined direction starting from where the shape of the grout shear key changes
towards the loading point as shown in Figure 3.32.

52
Figure 3.30: Three-point Bending Test Setup (Specimen C-C-2)
Figure 3.31: Initial Cracking at the Grout Interface (Specimen C-C-2)

53
Figure 3.32: Crack Propagation (Specimen C-C-2)
Figure 3.33: Specimen C-C-2 at Failure

54
Figure 3.34: Load-Displacement Curve (Specimen C-C-2)
The failure mode was relatively more brittle in this test compared to the identical
specimen tested in four-point bending. There was not much crushing seen in the grout or
the concrete slab at failure but rather a huge gap at the interface between the shear key
and the slab that was loaded as shown in Figure 3.33. The load-displacement curve for
Specimen C-C-2 is shown in Figure 3.34. The maximum load reached was 15.4 kips and
the deflection at peak load was 1.4 in. Unlike the four-point bending tests, the load
dropped suddenly and it was not possible to see further deflection due to rotation (without
further load increase). The shear span for this test was rather slender (a/d = 5.8) where it
is known that the member fails at a disrupt inclined cracking load. The reading at failure
load from the two load cells was 15.4 kips and the reaction force at each support would
be 7.7 kips. Considering that the spreader beam weight under the hydraulic ram was 2
kips and including the moment caused by self-weight (5.4 kip-ft) of the slab, the total
experimental joint moment was 36.9 kip-ft.

55
3.6.5 Specimen F-F-2
This section provides the test results of the three-point bending test that was
conducted on the specimen containing fine all-threads (Specimen F-F-2, Figure 3.35).
Initial cracking was shown at the interface between the slab and the grout and inside the
grout key as shown in Figure 3.36. As load was increased, it is interesting to note that
there was an inclined shear crack through the grout as shown in Figure 3.37. This crack
was inclining towards the loading point. As additional load was applied, these cracks
opened wider and an additional inclined shear crack was observed as shown in Figure
3.38. The close-up photo of the joint taken from the North side of the specimen indicates
that the grout key as a whole is about to fall out from the joint before failure (Figure
3.39).
Figure 3.35: Three-point Bending Test Setup (Specimen F-F-2)

56
Figure 3.36: Initial Cracking at the Grout (Specimen F-F-2)
Figure 3.37: Inclined Cracking through the Grout (Specimen F-F-2)

57
Figure 3.38: Grout Joint Close-up Photo (Specimen F-F-2, South view)
Figure 3.39: Shear Key before Failure (Specimen F-F-2, North view)

58
The failure mode was similar to Specimen C-C-2 and relatively more brittle
compared to the identical specimen tested in four-point bending (Figure 3.40), showing a
sudden drop in load. However, the load-displacement curve shown in Figure 3.41
demonstrates that Specimen F-F-2 reached to a higher load and deflected more than what
was seen in Specimen C-C-2. The maximum load reached was 18.3 kips and the
deflection at peak load was 3.8 in. The reading at failure load from the two load cells
were 18.3 kips providing a reaction force at each support of 9.15 kips. Considering that
the spreader beam weight under the hydraulic ram was 2 kips and including the moment
caused by self-weight (5.4 kip-ft) of the slab, the total experimental joint moment was
42.2 kip-ft.
Figure 3.40: Specimen F-F-2 at Failure

59
Figure 3.41: Load-Displacement Curve (Specimen F-F-2)
3.7 Summary
Ten slabs were casted to evaluate the joint capacity of five connected slab
specimens. A new type of mechanical joint system for precast adjacent beams was
proposed. This mechanical joint which is comprised of four all threads with nuts, an
alignment plate, an anchor plate, and a 1.25 in. ASTM A490 bolt with a nut can connect
the deck portion of the precast adjacent beams. Threaded bars with fine threads, coarse
threads, and a mix of each of them were tested. The threaded bars with fine threads had
the best performance. It was noted that although the joint did not carry more moment
after exceeding the capacity, it did allow additional rotation to take place. After
completion of the testing, the grouted keys were demolished to check the mechanical
connections, and for the case with fine threaded bars, the mechanical joint was holding
the adjoining slab specimens together. The following table is a summary of the moment

60
and shear strengths of each specimen. On average, the experimental joint moment was
37.5 ft-kip and the tested joint shear was 16.6 kip.
Table 3.3: Experimental Joint Moment and Total Load Applied
Specimen
Experimental Joint
Moment
(ft-kip)
Total Load Applied
(kips)
F-F-1 37.0 17.0
F-F-2 42.2 18.3
C-C-1 36.6 16.8
C-C-2 36.9 15.4
C-F-1 35.0 15.6
Avg. 37.5 16.6

61
CHAPTER 4. FULL-SCALE TEST PROGRAM
4.1 Introduction
The objective of this phase of research is to investigate the shear and moment
capacity of the new type of mechanical connection that was tested in small-scale as a
proof of concept, in full-scale with the cross sections that would be used in the field. In
this phase of research, a single full-scale formwork will be constructed which allows us
to build a 1) 8 ft wide section that is 1 ft deep, which is similar but wider than the plank
sections that are currently being used in Nebraska counties, 2) 8 ft wide section that is 2 ft
deep, which can span up to 50 ft, and 3) 8 ft wide section that is 3 ft deep, which can span
up to 60 ft. One formwork will allow casting of all three sections which may serve most
of the Nebraska county bridges applications.
For this testing program, the 8 ft wide, 2 ft deep cross section which can span up
to 50 ft will be divided into five 10 ft long specimens. Two sets of these specimens will
be cast. These 10 ft long sections will be connected through the mechanical connection
proposed in Chapter 3. In addition to the mechanical joint with self-consolidating
concrete grout, a staggered rebar splice joint grouted with a commercial mix of ultra-
high-performance concrete, new types of Nebraska fiber-reinforced high-performance
concrete, a new type of super high-performance concrete, and ultra-high-performance
concrete will be tested to evaluate various systems. This portion of the chapter will only
introduce the test results of mechanical joint and the commercial mix of high-
performance concrete used for grouting in a staggered rebar splice joint. All other
connected specimens will be tested as part of another program.

62
4.2 Specimen Design
Each specimen was a 10 ft long T-beam that measured 8 ft wide and had a 28.5
in. deep, 14 in. wide stem as shown in Figure 4.1. The top flange depth was 7.5 in.
Shear keys were provided along the length of each specimen and a total of five specimens
were cast together. A second pour followed to create the adjoining specimens. All
specimens had a top and bottom mat of No. 4 bar while the stem had 8 No. 11 bars at the
bottom. No. 4 stirrups were provided as transverse reinforcement. All bars were
ChromX 9100 bars from MMFX Technologies with a yield strength of 130 ksi.
Figure 4.1: Cross Section of Full-Scale Specimens

63
4.3 Material
4.3.1 Concrete
The concrete was obtained from a local ready-mix concrete supplier (Lyman-
Richey Co.). For each pour, three trucks were required to cast the five specimens and
forty-two 6 by 12 in. cylinders which had a target compressive strength of 6,000 psi.
Self-consolidating concrete was used for the pour for ease of construction. The mix
contains ½ in. aggregates (UNO SCC 0.5 LS Mix from Lyman Richey Co.). Standard
compressive and splitting-tensile tests for 6 by 12 in. cylinders were performed at 3, 7,
14, 21, and 28 days after testing.
4.3.2 Steel
ChromX 9100 bars from the MMFX Technologies was used for the reinforcing
steel bars which has a typical yield strength of 130 ksi. The reason high-strength
reinforcement was used in this study is because based on a feasibility study conducted by
e-Construct it was noted that the span length when using this reinforcement for short span
bridges is comparable to having prestressing strands and the span length can increase up
to 20-30% with the identical cross section using convention Grade 60 steel. The
possibility of using ChromX 9100 steel bars as an alternative to the strands in this design
was one of the expected benefits for the newly proposed precast bridge section.
4.4 Construction
4.4.1 Formwork and Steel Assembly
The formwork for these specimens was built by a specialized contractor (Hunt
Construction) and was shipped to the Large-Scale Structures Lab at Peter Kiewit Institute
at the University of Nebraska-Omaha Campus. All formwork was shipped in partially
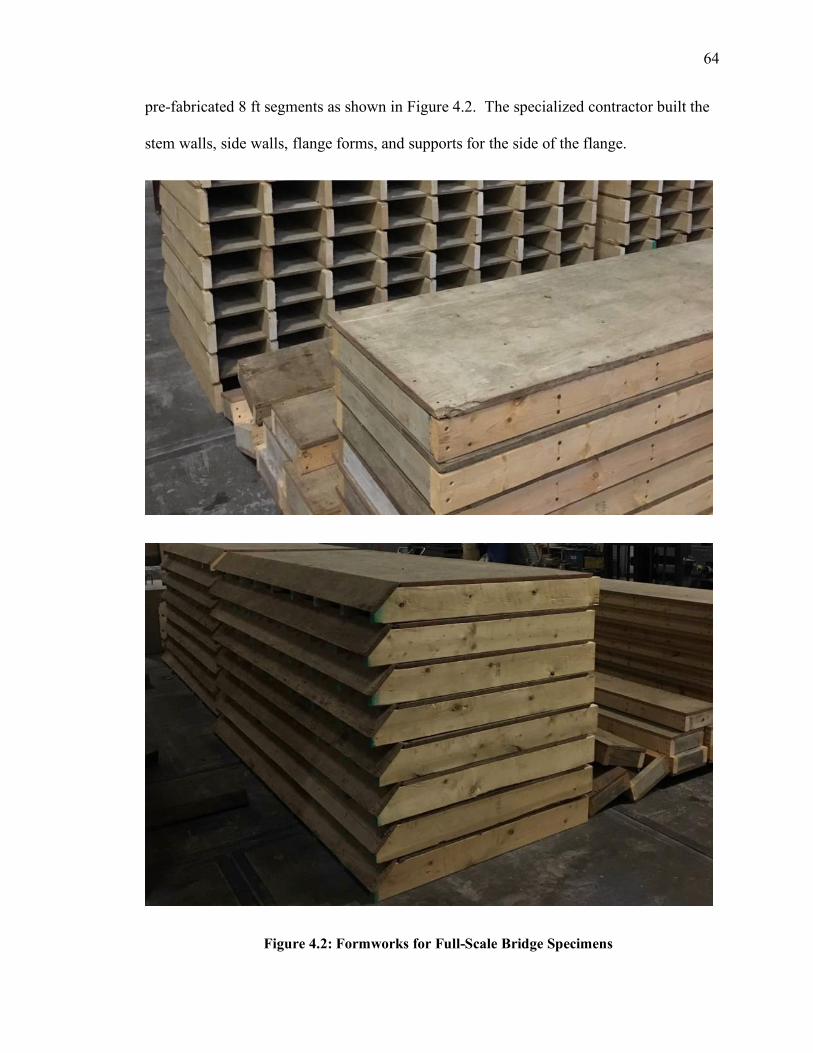
64
pre-fabricated 8 ft segments as shown in Figure 4.2. The specialized contractor built the
stem walls, side walls, flange forms, and supports for the side of the flange.
Figure 4.2: Formworks for Full-Scale Bridge Specimens

65
A base of 4 by 8 ft (3/4 in. thickness) plywood supported by 2 by 4 in. studs was
built to cover a 12 ft by 56 ft lab space. The stem walls were then secured to this base
and kickers were used to secure the top of the stem wall. The flange form was then
attached to the stem wall form. The side walls were attached to the flange form and the
kickers were placed between the platform base and the top of the side wall forms to
secure the top as shown in Figure 4.3. Dividers were then installed along the length of
the full form to create five 10 ft sections. The complete assembled formwork with
diagonal supports is shown in Figure 4.4.
Figure 4.3: Full-Scale Formwork Assembly

66
Figure 4.4: Complete Full-Scale Formwork for County Bridge Specimen
All steel bars for tied by the research team consisting of graduate students and
faculty members. No. 11 longitudinal bars which were placed in the stem were built
outside the formwork with No. 4 transverse reinforcement tied together. The
reinforcement cage was then dropped into the stem using the overhead crane. Top and
bottom mat of No. 4 bars were placed as deck reinforcement to finalize the work. Figure
4.5 shows a photo of the assembled steel reinforcement placed inside the entire
formwork.

67
Figure 4.5: Steel Reinforcement Assembly Placed in Formwork
For the mechanical joint system, an alternative joint was designed with Nelson
stud shear connectors welded 45 degrees to the plate (Figure 4.6) spanning out in
longitudinal direction. The reason, the mechanical joint system tested in Chapter 3 was
not used in this case was due to the threaded bar material availability at the time of

68
testing. A block out was built around the plates on the side walls. For specimens that
were planned to have high performance fiber-reinforced concrete, super high-
performance concrete, or ultra-high-performance concrete in the shear key holes were
drilled through the side walls so that the reinforcing bars could pass through creating a
staggered rebar splice joint.
Figure 4.6: Mechanical Joint with 8 in. Nelson Studs

69
4.4.2 Casting, Curing, and Storage
The following procedure described in this section was identical for both pours
with three trucks used in each case. Two people ran the chute and raked concrete while
two other people ran the screed board. While this process was going on six people filled
the test cylinders for all three trucks. The process was relatively simple with the use of
self-consolidating concrete.
Figure 4.7: Casting Self-Consolidating Concrete for Full-Scale Bridge Specimens
After the concrete was poured the casting crew waited until the concrete started to
set up and ran a bull float over every specimen while also edging as shown in Figure 4.8.
The team then waited another 45 minutes to set anchors in all four corners of each of the
specimen. After the anchors were set and two hours had past, burlap and plastic sheeting

70
was placed on top of the specimens for curing. Water was applied right before the plastic
was placed and re-applied every day for the next seven days. After these seven days, the
specimens were removed and the formwork and steel reinforcement assembly were
prepared for the second pour as shown in Figure 4.9. The test cylinders were all capped
after they were filled and removed from the forms after seven days to mimic the
environment of the actual bridge specimen. All the specimens were kept inside the lab
until the test program could commence.
Figure 4.8: Finishing the Full-Scale Bridge Specimens

71
Figure 4.9: Steel Assembly for the Second Pour

72
Figure 4.10 shows one of the precast sections taken out from the formwork. As of
special note, unlike the concerns of the stability of these cross sections, due to the fact
that the bottom stem was 14 in. wide and only 28 in. deep, the specimen was standing
with no further support required. Figure 4.11 shows the specimens in storage. These
specimens will have staggered splice joint. Considering that No. 4 bars were used for the
deck reinforcement, the required splice length for conventional concrete to develop 60 ksi
in a 6,000 psi concrete would be approximately 30 bar diameters. This would require 15
in. development length. As shown in Figure 4.11, note that the splice length is much
shorter than what would be typically be required at these joints. This was made be
possible by the use of the high-performance concrete placed in shear keys.
Figure 4.10: Proposed Standard County Bridge Section after Construction

73
Figure 4.11: Test Specimens with Short Splice Length
4.5 Test Setup and Test Procedure
The testing rig was setup for a three-point bending test with a hydraulic ram
placed in the middle of the specimen and supports at the two ends of the specimen as
shown in Figure 4.12. However, since two specimens were connected, the stem portion
of the precast section were placed on four supports. Each specimen was placed in
position using the overhead crane in the Large-Scale Structures Lab at the Peter Kiewit
Institute in University of Nebraska-Omaha campus and the grout for the shear key were
cast while specimens are placed in testing configuration. Due to the stroke limitation
with the hydraulic ram, a steel member or steel plates were placed between the hydraulic

74
ram and the specimen. Load was applied at the interface of grouted shear key and the
slab specimen as shown in Figure 4.13. The hydraulic loads were applied in a small
increment during testing until there was a significant drop in load and the specimens were
under rotation. Displacement was measured through string potentiometers placed next to
the shear key in both sides at the location of loading point, quarter point, and at supports.
Figure 4.12: Full-Scale Specimen Test Setup

75
Figure 4.13: North-South and East-West view of the Test Setup

76
4.6 Test Results
4.6.1 Specimen F-M
Full-scale specimen with the mechanical joint (F-M) was tested first. Figure 4.14
is a close-up view of the grouted joint during testing. Similar to the behavior observed
with small-scale specimens, the first crack initiated at the interface between the grout and
the slab specimen.
Figure 4.14: Close-up view of the Grouted Joint (Specimen F-M)

77
The test was terminated when the specimens were not able to take more load but
started to rotate creating large deflections at the joint. Because no neoprene pads were
supplied at the interface of the steel support and the slab specimens, inclined shear cracks
were observed in the stem portion of the specimen near the supports and concrete cover
started to spall off in that location as shown in Figure 4.15.
Figure 4.15: Specimen F-M at Failure
Figure 4.16 shows two photos taken from the bottom of the specimen. It is
interesting to note that the shape of the crack close to the interface was how the Nelson-
stud shear connectors on the mechanical joint were placed in 45 degrees. After the
completion of the testing, the two slab specimens were removed from the test setup, and
as shown in Figure 4.17, the shape of the grout attached to the mechanical joint is the

78
shape of the crack that was observed underneath the slab specimen that is orientated
based on the shape of the mechanical joint. It can be concluded that the failure mode was
govern by insufficient length in development with the 8 in. Nelson studs in the joint
system introduced in Figure 4.6.
Figure 4.16: Close-up view of the Grouted Joint (Specimen F-M)

79
Figure 4.17: Grout Shear Key Bond Failure (Specimen F-M)

80
The load-displacement curve for Specimen F-M is shown in Figure 4.17. The
maximum load reached was 25.8 kip and the deflection at this load was 0.45 in. The
tested joint moment would be 57 kip-ft (including the self-weight of the half of the
flange) with the two mechanical connections in the 10 ft specimen. Each mechanical
connection would carry approximately 28.5 kip-ft which are spaced at 4 ft spacing.
Figure 4.18: Load-Displacement of Specimen F-M
4.6.2 Specimen F-UHPC
The full-scale specimen with the staggered splice joint filled with a commercial
ultra-high-performance concrete (Ductal - LafargeHolcim) joint was tested (F-UHPC).
Figure 4.19 shows the test setup and loading in process. Figure 4.20 shows the load-
displacement curve for Specimen F-UHPC.

81
Figure 4.19: Test Setup and Loading of Specimen F-UHPC
Figure 4.20: Load-Displacement of Specimen F-UHPC

82
With the ultra-high-performance concrete joint, the specimen was able to take
84.7 kips and the peak deflection was 0.72 in. After testing reached this maximum load
the load did not increase and remained at the peak level while rotation was taking place.
The test was terminated when cracks on the flange section were seen on the slab and
inclined cracks were observed at the stem of the slab specimen. The tested joint moment
would be 174.8 kip-ft (including the self-weight of the half of the flange) for the 10 ft
specimen. This would be approximately 17.5 kip-ft per foot length. Comparing with the
mechanical joint that was placed at 4 ft spacing, this would be more than two times the
joint moment observed in the mechanical joint system.
4.7 Summary
Ten full-scale specimens that are 10 ft long were cast to evaluate the joint moment
strength of various connections. This would include a mechanical joint, and staggered
splice joints with ultra-high-performance concrete (Ductal - LafrageHolcim), Nebraska
high-performance concrete, super-high-performance concrete, and ultra-super-high-
performance concrete. Two connected specimens, one with the mechanical joint and
self-consolidating concrete grout (Specimen F-M) and the other with the ultra-high-
performance concrete (Specimen F-UHPC,) were tested and the results are summarized
in this chapter. The joint moment carried per foot was 2.5 times larger when the ultra-
high-performance concrete was used as the grouting material in the shear key compared
to the equivalent moment carried by mechanical joint system.

83
CHAPTER 5. SUMMARY AND CONCLUSIONS
5.1 Overview of Research
Many of the Nebraska county bridges need replacement due to their structural
deficiency. Most of the bridges needing replacement are in the 40 to 60 ft range. This
span range appears to be lacking a standard design that fits Nebraska county practices in
terms of speed and simplicity of construction. The current system being used are (a)
Precast 1 by 2 ft planks which can span up to 30 ft, (b) Cast-in-place slab bridges which
can span up to 50 ft but require extensive field formwork, concrete placing, and curing,
and are best when constructed in three-span units, and (c) Inverted tees which can span
40 to 80 ft, but require cast-in-place decks.
The objective of this research project is to develop and evaluate a cross section
that can be modified to be used for spans up to 40 to 60 feet, while reducing the number
of longitudinal shear keys, and retaining the ease of construction by the plank design.
Three phases of research were conducted to achieve this objective. The first phase
included evaluating various sections for spans up to 60 ft. This was completed through
an extensive literature review and a new type of cross-section was proposed in this study.
The second phase of the research included evaluating a new type of transverse connection
that could possibly be used for the proposed state county bridge system through small-
scale testing on 10 slab specimens. Finally, two-sets of full-scale bridge specimen were
tested to evaluate the behavior of transverse connection that includes the new type of
mechanical connection, and staggered splice joint with commercial high-performance
concrete used for the shear key.

84
Based on the literature review that includes computational analysis, experimental
testing, field monitoring, and synthesis studies on bridges with adjacent beams it was
clear that the lateral load distribution and load transfer between individual beams are
highly dependent on the keyway joint details. Although, many different types of shear
keyways were developed from the nationwide surveys and field measurements, it was
identified that these grouted joints still crack, create longitudinal cracks on top of the
bridge deck, and create a path for water or chloride leakage. Many state and county
engineers and precast producers identified that the solutions to this recurring problem
could be 1) providing a full-depth shear key, 2) post-tensioning the adjacent beams in
transverse direction, or 3) topping these adjacent beams with cast-in-place deck.
In order to resolve the problems seen in this literature survey without
complicating the construction for counties (not introducing post-tensioning, or including
cast-in-place decks), this study suggested a precast cross section that could be constructed
with a single formwork that works for variable depth.
5.2 Experimental Program
5.2.1 Mechanical Connection Test Program
The objective of this phase of the research is to investigate the shear and moment
capacity of a new type of mechanical connection that is proposed to be used in
connecting adjacent precast bridge sections proposed in this study. Each mechanical
joint consists of four all threads with nuts, an alignment plate, an anchor plate, and a 1.25
in. ASTM A490 bolt with nut to connect the two slabs. Three and four-point bending
tests were conducted to evaluate the joint shear and moment of the proposed mechanical
connection for adjacent bridge sections.

85
Ten slabs were casted to evaluate the joint capacity of five connected slab
specimens. Threaded bars with fine threads, coarse threads, and a mix of each of them
were tested. The threaded bars with fine threads had the best performance. It was noted
that although the joint did not carry more moment after exceeding the capacity, it did
allow additional rotation to take place. On average, the experimental joint moment was
38 ft-kip and the tested joint shear was 17 kip.
5.2.2 Full-Scale Test Program
The objective of this phase of research is to investigate the shear and moment
capacity of the new type of mechanical connection that was tested in small-scale as a
proof of concept, in full-scale with the cross sections that would be used in the field. For
this testing program, the 8 ft wide, 2 ft deep cross section which can span up to 50 ft was
divided into five 10 ft long specimens. Two sets of these specimens were cast. The 10 ft
long sections were connected through the mechanical connection proposed in small-scale
test program. In addition to the mechanical joint, a staggered rebar splice joint grouted
with a commercial mix of ultra-high-performance concrete joint was tested to evaluate
different systems. Test results indicated that the ultra-high-performance concrete carried
a joint moment of 17.5 kip-ft per foot length which is 2.5 times larger than the equivalent
moment carried by the mechanical joint system with non-shrink grouts.
5.3 Future Research
Based on the findings from this study, it is recommended that further research
should be conducted to extend the understanding of these newly proposed mechanical
joints for transverse connections in adjacent precast beam bridges. The following
requires more study:

86
1. Computational modeling of the new mechanical joint using spring models that
can resist longitudinal, vertical, horizontal forces, and bending moment would
allow evaluating the load distribution factors for the proposed section. This
would additionally provide information for the adequate spacing between these
transverse mechanical joints in the longitudinal direction.
2. Small-scale pull-out tests with the threaded bars may provide more information
regarding the bond strength of these bars in concrete and could provide insight
towards the behavior that was observed in the small-scale experimental program
in this study.
3. Static test on the proposed Full-scale specimens will provide the flexural and
shear strength of these sections. It is also expected with additional parametric
studies with different types of reinforcement, reinforcing steel bar area, cover
details, bar spacing and development requirements, a standard design chart can be
provided for the proposed section.

87
BIBLIOGRAPHY
AASHTO (1957), Standard Specifications of Highway Bridges, 7th Edition, American
Association of State Highway and Transportation Officials, Washington, D.C., 22
pp.
AASHTO (2010), AASHTO LRFD Bridge Design Specifications, American Association of
State Highway and Transportation Officials, Washington, D.C., 1591 pp.
American Society for Testing and Materials (ASTM). (2018), “Standard Test Method for
Compressive Strength of Cylindrical Concrete Specimens.” C 39-18, West
Conshohocken, Pa.
American Society for Testing and Materials (ASTM). (2017), “Standard Test Method for
Splitting Tensile Strength of Cylindrical Concrete Specimens.” C 496-17, West
Conshohocken, Pa.
American Society for Testing and Materials (ASTM). (2016), “Standard Test Method for
Compressive Strength of Hydraulic Cement Mortars (Using 2-in. or [50-mm] Cube
Specimens).” C 109-16a, West Conshohocken, Pa.
El-Remaily, A., Tadros, M.K., Yamane, T., and Krause, G. (1996), “Transverse Design of
Adjacent Precast Prestressed Concrete Box Girder Bridges,” PCI Journal, Vol. 41,
No. 4, pp. 96–113.
Greuel, A., Baseheart, T.M., Rogers B.T., Miller, R.A., and Shahrooz, B.M. (2000),
“Evaluation of a High Performance Concrete Box Girder Bridge,” PCI Journal,
Vol. 45, No. 6, pp. 60–71.
Hanna, K.E., Morcous, G., Tadros, M.K. (2009), “Transverse Post-Tensioning Design and
Detailing of Precast Prestressed Concrete Adjacent Box Girder Bridges,” PCI
Journal, Vol. 54, No. 4, pp. 160–174.

88
Hanna, K., Morcous, G., Tadros, M.K. (2011), “Adjacent Box Girders without Internal
Diaphragms or Post-tensioned Joints,” PCI Journal, Vol. 56, No. 4, pp. 51–64.
Huckelbridge, A.A., El-Esnawi, H., and Moses, F. (1995), “Shear Key Performance in
Multibeam Box Girder Bridges,” Journal of Performance of Constructed Facilities,
Vol. 9, No. 4, pp.271-285.
Jones, H. L. (1999), “Multi-Box Beam Bridges with Composite Deck,” FHWA/TX-
00/1709-1, Texas Transportation Institute, Texas A&M University, College
Station, TX, 123 pp.
Jones, H. L. (2001), “Lateral Connections for Double Tee Bridges,” FHWA/TX-01/1856-
2, Texas Transportation Institute, Texas A&M University, College Station, TX, 101
pp.
Lall, J., Alampalli, S., and Dicocoo, E.F. (1998), “Performance of Full-Depth Shear Keys
in Adjacent Prestressed Box Beam Bridges,” PCI Journal, Vol. 43, No. 2, pp. 72–
79.
Miller, R. A., Hlavacs, G.M., and Long, T.W. (1998), “Testing of Full Scale Prestressed
Beams to Evaluate Shear Key Performance,” FHWA/OH-98/019, Federal Highway
Administration, Washington, D.C., 96 pp.
Naito, C.J., Sause, R., Hodgson, I., Pessiki, S., and Macioce, T. (2010), “Forensic
Examination of a Noncomposite Adjacent Precast Prestressed Concrete Box Beam
Bridge,” ASCE Journal of Bridge Engineering, Vol. 15, No. 4, pp.408-418.
Newmark, N.M., and Siess, C.P. (1942), “Moments in I-Beam Bridges,” Engineering
Experiment Station Bulletin No. 336, College of Engineering, University of
Illinois, Urbana, IL, 149 pp.
Pool, R.B., Arya A.S., Robinson, A.R., and N. Khachaturian, N. (1965), “Analysis of
Multibeam Bridges with Beam Elements of Slab and Box Section,” Engineering
Experiment Station Bulletin No. 483, Vol. 62, No. 106 (July), College of
Engineering, University of Illinois, Urbana, IL, 33 pp.
89
Russell, H.G. (2009), “Adjacent Precast Concrete Box-Beam Bridges: Connection
Details,” National Cooperative Highway Research Program (NCHRP) Synthesis
393, Transportation Research Board, National Research Council, Washington,
D.C., 83 pp.
Russell, H.G. (2011), “Adjacent Precast Concrete Box-Beam Bridges: State of the
Practice,” PCI Journal, Vol. 56, No. 1, pp. 75–91.
Stanton, J. F., and Mattock, A.H. (1986), “Load Distribution and Connection Design for
Precast Stemmed Multi-Beam Bridge Superstructures,” NCHRP Report 287,
Transportation Research Board, National Research Council, Washington, D.C., 137
pp.