experimental testing of a saddle type hyperbolic
TRANSCRIPT

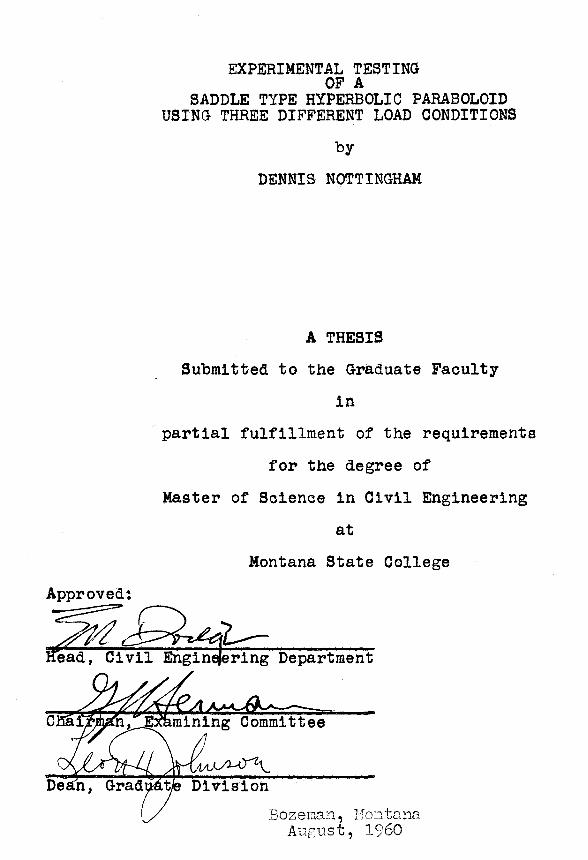
Experimental testing of a saddle type hyperbolic paraboloid using three different load conditionsby Dennis Nottingham
A THESIS Submitted to the Graduate Faculty in partial fulfillment of the requirements for the degreeof Master of Science in Civil Engineering at Montana State CollegeMontana State University© Copyright by Dennis Nottingham (1960)
Abstract:Results of tests performed on a saddle type ten foot square hyperbolic paraboloid with rigid supportsand a two Inch shell ard shown in the following text in the form of tables and grriphs. Thrde types ofloads were employed -uniform load, concentrated center load, and uniform load over half the surface.These are probably the most common loads used and. were chosen for that reason.
The basic design arid problems encountered in the construction of forms arid placing the concrete arealso covered. Photographs and illustrations give a good picture of the procedure and apparatus used.
SR-4 strain gages Were used to determine strains in the concrete. Methods employed in attaching gagesto concrete and the nature of the readings are discussed.
EXPERIMENTAL TESTING OF A
SADDLE TYPE HYPERBOLIC PARABOLOID USING THREE DIFFERENT LOAD CONDITIONS
byDENNIS NOTTINGHAM
A THESISSubmitted to the Graduate Faculty
inpartial fulfillment of the requirements
for the degree ofMaster of Science in Civil Engineering
atMontana State College
Approved:
iL—ead, Civil Engineering Department
.mining Committee
Dean, Gradudtfe Division
2// &Z-
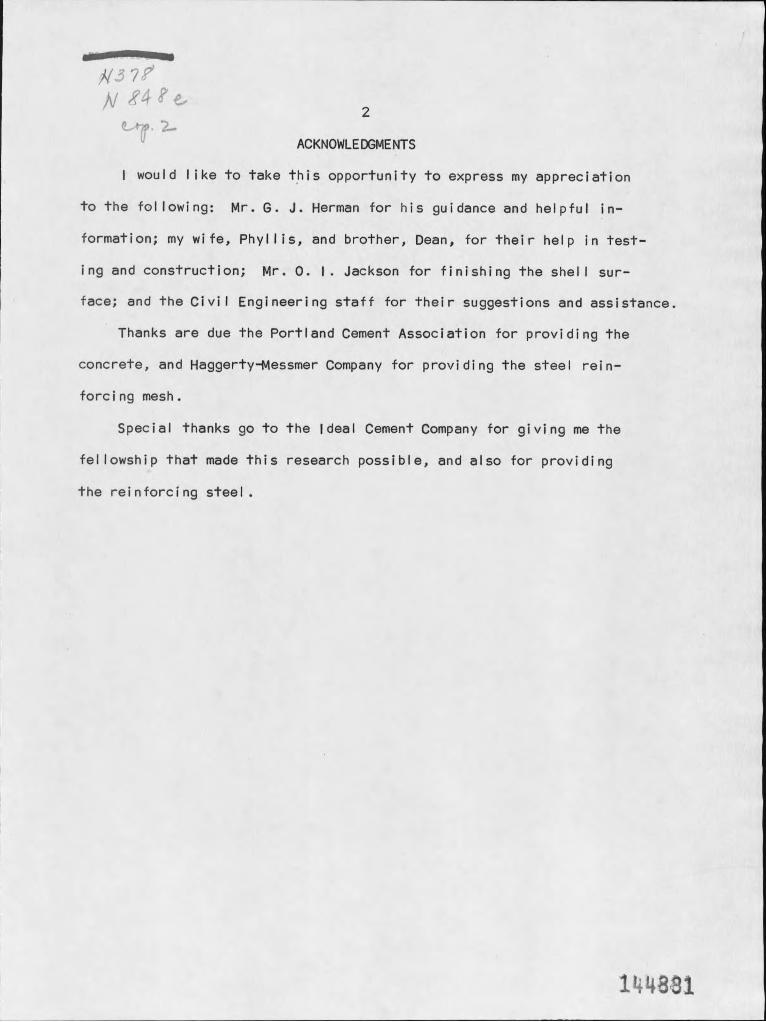
ACKNOWLEDGMENTS
I would like to take this opportunity to express my appreciation
to the following: Mr. G . J. Herman for his guidance and helpful in
formation; my wife, Phyllis, and brother. Dean, for their help in test
ing and construction; Mr. 0. I. Jackson for finishing the shell sur
face; and the Civil Engineering staff for their suggestions and assistance.
Thanks are due the Portland Cement Association for providing the
concrete, and Haggerty-Messmer Company for providing the steel rein-
forcing mesh.
Special thanks go to the Ideal Cement Company for giving me the
fellowship that made this research possible, and also for providing
the reinforcing steel .
144331
I
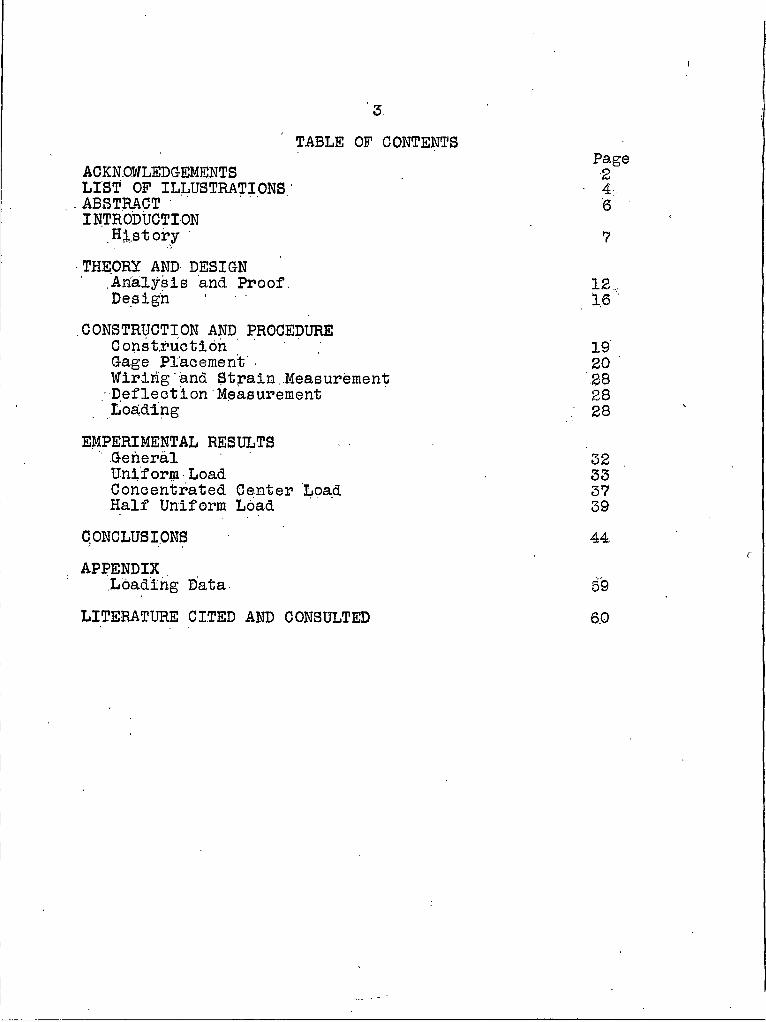
TABLE OF CONTENTSPageACKNOWLEDGEMENTS
LIST OF ILLUSTRATIONS'. ABSTRACT INTRODUCTION
History ' 7THEORY AND DESIGN
.Analysis and Proof. 12...Design 16'
CONSTRUCTION AND PROCEDUREConstruction 19Gage Placement 20Wiring and Strain.Measurement .28Deflection Measurement 28Loading . 28
EXPERIMENTAL RESULTSGeneral 32Uniform Load 33Concentrated Center Load 37Half Uniform Load 39
CONCLUSIONS 44.APPENDIX .
Loading Data 59LITERATURE CITED AND CONSULTED 6.0
'3.
Olt
M1O
4
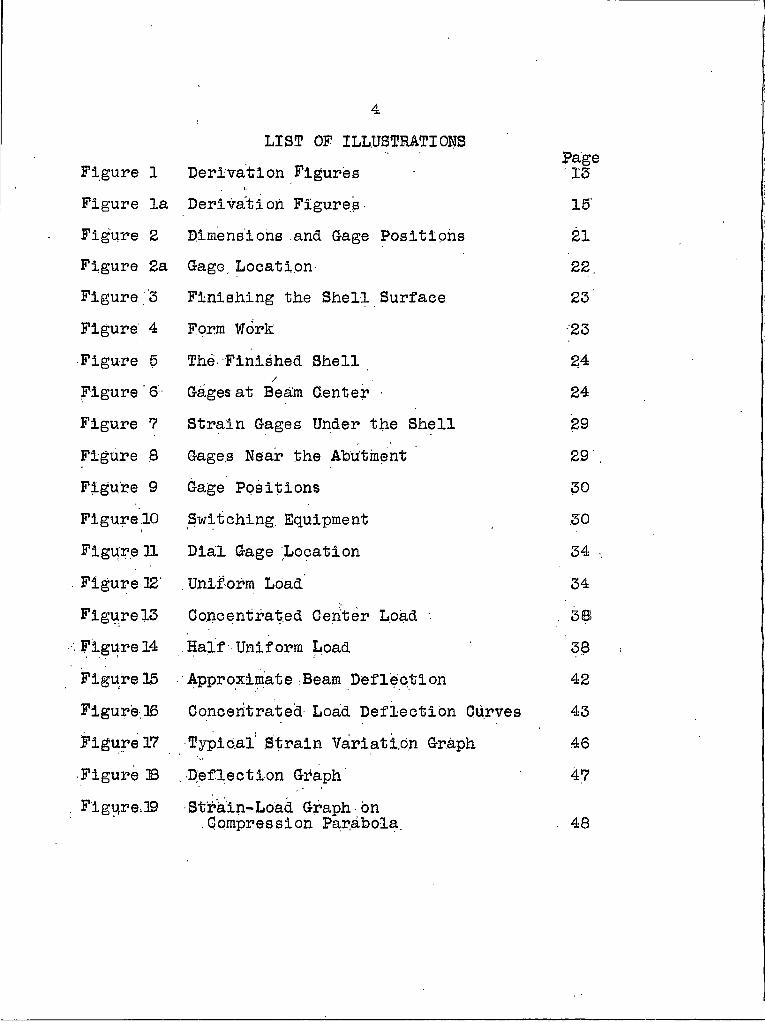
Figure ILIST OF ILLUSTRATIONS
Derivation FiguresPage15
Figure la DerivatIon Figures■ 15Figure 2 Dimensions and Gage Positions 21Figure 2a Gage, Location 22.Figure 3 Finishing the Shell Surface 23Figure 4 Form Work 23Figure 5 The Finished Shell 24Figure"6
/Gagesat Beam Center 24
Figure 7 Strain G-ages Under the Shell 29
Figure 9 Gages Near the Abutment 29 .Figure 9 Gage Positions 30Figure .10 Switching. Equipment 50Figure U Dial. Gage Location 34 .Figure 32' .Uniform Load 34FigurelS Concentrated Center Load . 38Figure 14 .Half■ Uniform Load 38Figure 15 Approximate Beam Deflection 42Figure. 36 Concentrated Load Deflection Curves 43Figure 17 Typical Strain Variation Graph 46Figure B , Deflection Ghaph 47FigureJS Strain-Load Graph bn
.Compression Parabola. . 48

5
LIST OF ILLUSTRATIONS (CONT4Figures 20-24 Strain-Load .Graphs For Gages
at Center of Edge Beams 49Figures' 25-29 Strain-Load.Graphs For Gages
Neap Abutments 54
6/ ' .ABSTRACT
. . . .
Results of tests performed on a saddle type ten foot square hyperbolic paraboloid with rigid supports and a two inch shell ari shown in the following text iji the form of tables and graphs. Thrde types of loads were employed - uniform load, concentrated center load, and uniform load over half the surface. These are probably the most common loads used and were chodpn for that reason.
The basic design arid problems encountered in the construction of forms arid placing the concrete are also covered. Photographs arid illustrations give a good picture,.,, of the procedure and apparatus used.
.SRi-4 strain gages Were used to determine strains in the concrete. Methods deployed in attaching gages to concrete and the nature of the readings are discussed.

7INTRODUCTION
HISTORYShell forms which are becoming Increasingly popular
today are not a new type of construction. These forms found- their beginning In vaults, barrels, and domes In Middle Eastern and Byzantine building. Structures of this.type were early attempts at spanning space beybnd the, capacity of post and lintel construction. Economi- . cally, these early shells were also justified. Brick.andfstone provided the materials for craftsmen with no formal mathematical training, yet many of these ancient buildings still stand.I The dome of St. Peter's spans 131 feet and weighs 10,000 tons. This may seem ponderous when compared with concrete st^ell domes in the market hall in Leipzig which span 240 feet and weigh 2,16,0 tons, but' the latter was built in 1.929.^
Even before early building began, nature was at work carving} shells from stone? These shells are usually doubly- curved, thus avoiding the tendency for bending moments to . occur. This shows that shapes of this, type, can, be utilized when building with.materials which have a low tensile
. TT tihermayeff, Serge, "History of, Thin Concrete Shells,11. Proceedings'of a Conference oh Thin Concrete Shells, June 21 to 23, .1954, MIT, p.2.
2. "Shell Concrete for Spanning Large Areas," Architectural Forum. December 1949, p.101. ■

8
Strength.3■The appearance of podern ■ shells • evolved .from two
Independent sources, namely, a development In mathematical analysis and a perfection In structural materials. Lame and Olapeyron formulated some mathematical, expressions for stress analysis of shells in the early nineteenth century. Results of these findings led to further studies by Love in 1892, which involved the way that shells support loads. .By this time, tp.e advancement in analytical methods' was sufficient, for practical application to the design of actual structures.
Construction materials, such as concrete, were available in the late nineteenth century, but the greatest contribution in this field was the introduction of steel reinforced.concrete. This discovery may be partly attributed to J.'Monier, a French gardener, who built a reinforced concrete flower pot in 1867.
The combination of concrete and steel plus the proper methods of analysis set the stage for a period of increasing shell construction.
Antoni Gaudi was probably one of the first men to use reinforced concrete in imaginative fashions foreign
3. Candela, Felix, ’’The Shell As a Space Encloser,1?. ■Proceedings of a Conference on Thin Shells. June 21 to '23, 1954, MIT, p.5.

9 :to existing styles of construction. In 1909 he designed, a parochial school; in Barcelona which may have .been the first modern shell roof ever built. G-audi probably didn't analyze his., shell mathematically. An example of a mathematically designed shell was the Zeiss dome built in 1924. The formal analysis was based on mathematical expressions by Love. In countries, where material was scarce, the popularity of shells began to increase.This growth in interest accounts for the improved design practices of the present time.4
One great advantage of concrete shell structures is their resistance to fire'. Severe fires in a shell, concrete textile plant in Buenos Aires and a shell concrete hanger in the XJ.. S „ both failed to collapse "the structures. A similar- building with a steel" frameisork would have surely fallen down. Shell type buildings have withstood impact due to bombs during wartime. • The shell, roof of .the Fronton Ricaleto6 s in Madrid was hit by a shell which knocked a six foot hole in it, but the roof remained standing. .These examples refer to cylindrical shells which are surfaces of single curvature and are ,more, exposed to failure than shells of double curvature.®
.4. Levy, Matthys P.., "Thin Shells: Some Basic References'.for Architects and Engineers, Architectural Record, June 1959, p.224.
5. "Shell Concrete for Spanning Large,Areas,V Architectural Forum, December 1949, p.103.'

10
Although shell technique ip now at home In the United States, many more advanced ideas are being produced outside our borders. The United Stptes was slow to start building shells because, pf the. high cost of labor and forming. New construction methods, movable forms, and high strength materials pre gradually overcoming costs.The customer is just beginning to realize' that shell roofs are not just a novelty, but relatively inexpensive handsome structures. ..The- men "who have done much to start this trend in the United States began more than a decade ago working in South America and Mexico. Two of these men are Felix Candela and Guillermo Gonzalez.®
The one doubly curved shell that cuts costs through easier forming is the hyperbolic paraboloid. The use of. reinforced concrete in the hyperbolic paraboloid offers the same advantages inherent to all shells of this material — lightness, incpmbustibility, economy of materialsi security against impact, and little sensitiveness to foundation settlement. Felix Candela is probably, greatly responsible for the present interest in hyperbolic paraboloids. Se has built many of these shells in Mexico where the cost of labor is relatively low. 6 7 * *
6. Candela, Felix, "Market Project, Bandshell, 11 Architectural. F o r u m January IL957-,, p.132.
7. Candela, Felix, "Structural Applications of HyperbolicParaboloidical Shells?" Journal of the AmericanConcrete.Institute, January 1955, p.397.

11 ,Shells of this type have:,:heeh-'-.uied for entrance canopies, churches, footings, ^hrehous,h"'Foofs, gas stations, dwellings, factories, bowlihg llanes, and many other buildings.
Actual'controlled tests on concrete.hyperbolic paraboloids have.been run recently by the Portland Cement Association, Investigations of this nature are rapidly Increasing with the coming interest in shells.
The simple beauty and many advantages of the hyperbolic paraboloid mark.it as a structure which.will bd progess- ively .utilized in the future.
12
THEORY AND DESIOH
..ANALYSIS AND PROOFThe..following is an analysis of a hyperbolic paraboloid
loaded.with a ,uniform load..A description of the. shell surface is obtained in the
following manner. Referring to Figure Ito/h = x/f&. and z/c, = y/b from, similar triangles.
Thereforec = hx/a - bz/yjz = xyb/ab..-.
If. k -s h/ab, then..■ z = kxy.F.or.,.convenience an axis rotated an angle theta from
the. original axis is chosen. See Figure I. Using this" new' .. 'axis
x “ X 51COS ©-{-y1 sin © and y “ X 5Sin 9 - y 1 cos. 9 If theta is equal to 4j5° then x _ O,. 707 (x 5 4- y ! ) andy'- 0.707(xl - y 5-)»;
.Substituting the values of #nd y, z s 0.5k.(x°-2 - y«2).
When x 5' ® O then z s o.5k(-y5 ) and when yt-.s, o then z s 0.5k(x52)t .these are both equations for parabolas.

13
S h e l l Q u a d r a n t
I GURE
D e r i v a t i o n F i g u r e s .
14
A parabolic arch, under uniform load has zero bending moment throughout. Using this fact, the horizontal thrusts can be found. Kote Figure la. The.sum of the moments about the center of the span is equal to zero or H(-h') «(wL/4.) (l /2), - (w/2) (L/2) (L/4) = wli^/16. w/2 is used as the uniform"load since it is assumed that half the load goes to the tension parabola and half tq the compression parabola.Therefore
H = -wL^/lSh1.z = -0.5ky’ If y *. =, L/2 and z h' then h 5 =
-0.5kL2/4.
Therefore H =(-w L2/16)(-4/0.SkL2 ) =.w/2k or H- .=». .wab/2h ;:Up to this point, it has been assumed that the edges
' ' '
of the. structure are rigidly restrained./ 'It will now be. ' ' ' '
shown that this.assumption is valid. From Figure la it,.• '
can be shown that the thrusts perpendicular to the edgebeam are equal in magnitude and opposite in direction.Therefore, the edge beam iq restrained from moving laterally.A ..force exists along th,e beam horizontally. This force(S) = 2H sin Q ds/dx => 2H pin © cos .©.. .When theta equals 45.° and .H - wab/2h then
S. = wab/^h per unit length-of beam,..The vertical forces at the edge beam are equal to

15
4 J f I \
T y p i c .a u P a r a b o l i c A r c h
Edge B 6 a m S e c t i o n
F IGU-RE <X»D E R I V A T I O N ^ K a U R E S e

is, V tan <f) a H dz/dy1 4 H dz/dx1 .■
Since z = -O.SkCx1? - y^2 ), then dz/dy = -ky1 and dz/dx = kx1. At any point on the horizontal edge x 1. - y « and the vertical components cancel each other. Along the sloping edge AB, y 1 will not equal x ‘, but instead equals x 8 - How dz/dy = -k(x8 -\a$%) and dz/dx = kx8 .•
Substituting these, value;, V =£H tan (J) =. HQ-kCx1 - a<2)3 4 Hkx8 or
V = a # k H =. af2 H(Vab) - Hh#/b.V in this case is applied to a length d.s. V 8 per unit length of beam is equal to Vds/dx = Hh^S- cos O/b. For angles equal to.45°, V 1 s Hh/b along an edge parallel to edge b. Similarly, alo^g an edge parallel to edge a, ..V1 .=' Hh/a. This shows that the. vertical force in the edge beam is the# H tan tf where is the angle of rise of the edge beam. Therefore, the e$ge beam is in direct tension or compression,
-3"he proceeding propf and analysis was taken mainly from Elementary Analysis of Hyperbolic Paraboloid Concrete Shells, an edition of, t^e Portland Cqrnent Association^ DESIGN '
Available laboratory space limited the size of the hyperbolic paraboloid tjo ten feet square in plan. A rise of four feet was chosen as a maximum height. This was to keep.the fresh concrete from moving during placing
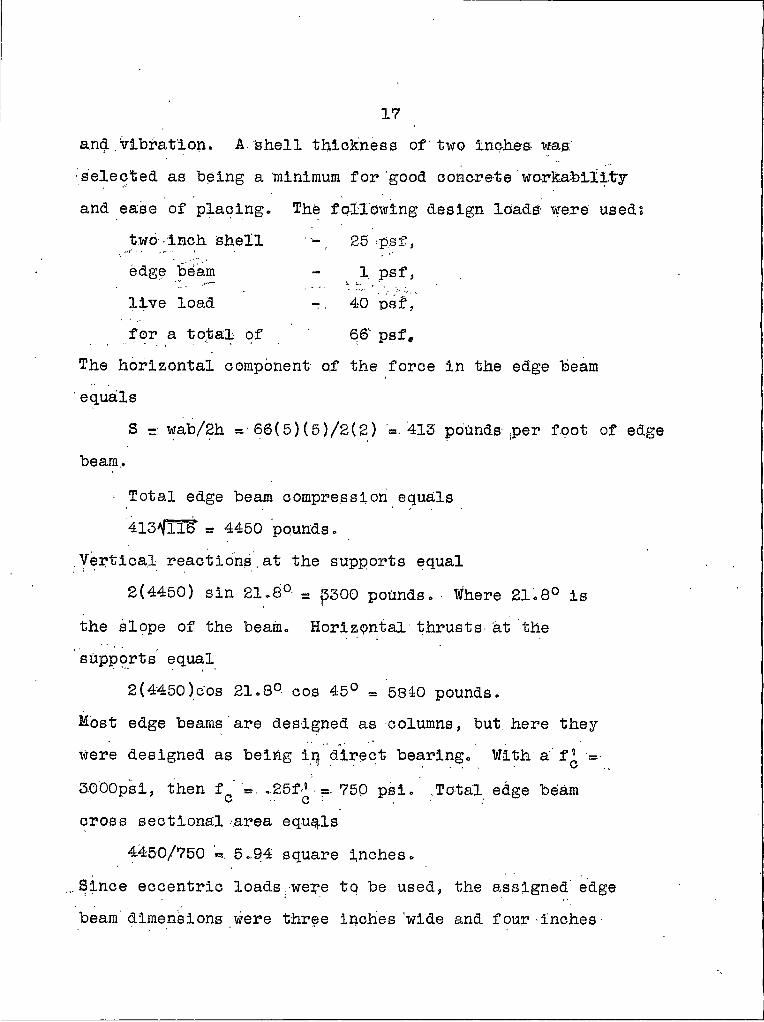
17any., vibration. A. !shell thickness of' two Inches was selected as being a minimum for good concrete workability and ease of placing. The following design loads- were used!
two inch shell 25 psf,edge beam - I psf,live load T . 40 psf,for a total of 66" psf,
The horizontal component of the force in the edge beam equals
S — wab/2h =■66(5)(5)/2(2) = 413 pounds,per foot of edgebeam.
■ Total edge beam compression equals 413^118 = 4450 pounds.
.Vertical reactions.at the supports equal2(4450) sin 21.8°- - 5300 pounds. ■ Where 21.8° is
the slope of the beam. Horizontal thrusts at the supports equal
2(4450)cos 21.8° cos 45° = 5840 pounds.Most edge beams are designed as columns, but. here they were designed as being ip direct bearing. With a f£ ■=■30OOpsI, then f =. ,..25f-e • =. 750 psi. Total edge beam cross sectional area equals
4450/750 «=. 5 ..94 square inches».,.Since eccentric loads were to be used, the assigned edge beam dimensions were three inches wide and foup inches

18deep on the outside edge. A.number three-reinforcing rod was run-along each beam, two Inches up from the hot-tom and continued into thS footings. ,Shell!tension and compression along.the - parabolic arches was equal to
■ 413/24 17.2 psi.
This "has reinforced with six by six number ten welded wire fabric. The steel in ths1shell and beams was used primarily to prevent shrinkage or temperature cracks. Footing dimensions were 5 ft x 3& ft x Si in reinforced two ways with number five rods on eix inch.centers. The,footings were greatly over designed to insure no footing failure under eccentric loads. The length'of connection between the shell and footing was arbitrarily chosen.. The tie .rod had a 7/8 in diameter with :a tufnbuckle in the center. Six inch lengths of.3| in x Si in x i in angle were welded . to.the ends..of the tie rod as bearing-plates.
The proceeding shell design was based on the assumption -that the structure was uniformly loaded. In the following text a comparison will be made between stresses and strains predicted by the design ,aqd those that are created by several types of loading.
. 19
CONSTRUCTION AND.PROCEDURE
CONSTRUCTIONTo begin forming, the bottom edge two-by four beams'
were fitted together in the proper position. These beams constituted all that was necessary to generate the required surface. The beams were, braced and the interior two by four beams were added parallel to one set of parallel sides. Stringers were run under the beams at the one-third points and shored at the end' and one-"third points. The entire group of shoring was- strengthened with diagonal one by four bracing. Sheeting was placed parallel to the other set of parallel edge beams. Six inch shiplap had to be ripped into three inch strips for easy handling, since the boards assumed a"warped form. Py 'placing the covering in this manner, small cracks were developed near the "edge's of the forms. These cracks .were eliminated when the entire surface was covered with roofing paper." Edge forms consisting of two by six lumber were placed next:and'braced to the existing'structure» The. bottom of the.
; ■
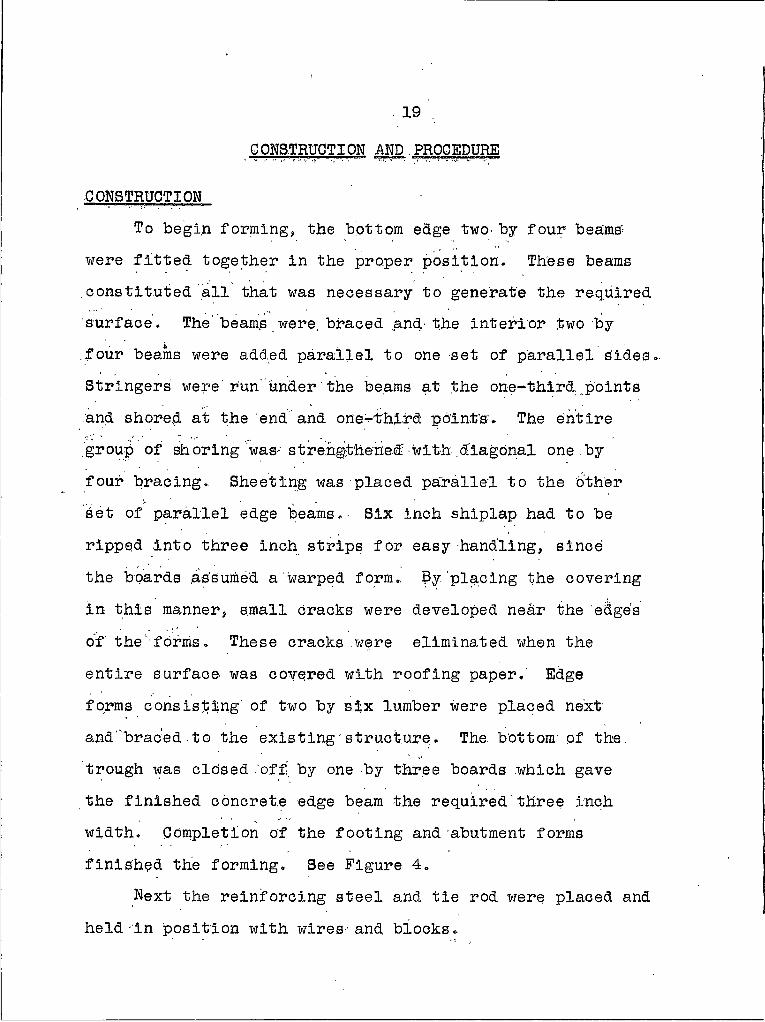
trough was closed 'off by one by three boards which gave the finished concrete edge beam the required three inch width. Completion of the footing and abutment forms finished the forming. See Figure 4.
Next the reinforcing steel and tie rod were placed and held in position with wires and blocks.

20
Concrete yids brought- to the - laboratory In a reMy- ralx truck which was located, as close as possible, to the •forms. .However, It was gtill necessary to. use a wheelbarrow . Slump of the one and oqe half cubic yards of concrete was about one to two Inches» This presented some problems In placing, most of which were eliminated when a vibrator was put to use. .Surface finishing was done by troweling followed by a light brooming. See Figure 3.
The. structure was kept damp with a wet canvass for a five day curing period. Stripping the’.forms began after five days and was accomplished with little difficulty.Test cylinders' broke at a five day strength of 1950 psi and 3910 psi.
.Many curious and interested people viewed the completed hyperbolic paraboloid duping the annual High School, Week?? " festivities. See Figure 5.GAGE- PLACEMENT I
A?-! and AR-I were the two type's of SR-4 strain gage chosen for .use on. the hyperbolic paraboloid. The.A-I type- measures strain in one direction while the AR-I type is a rosette made up of three gage similar to the A-I gage.
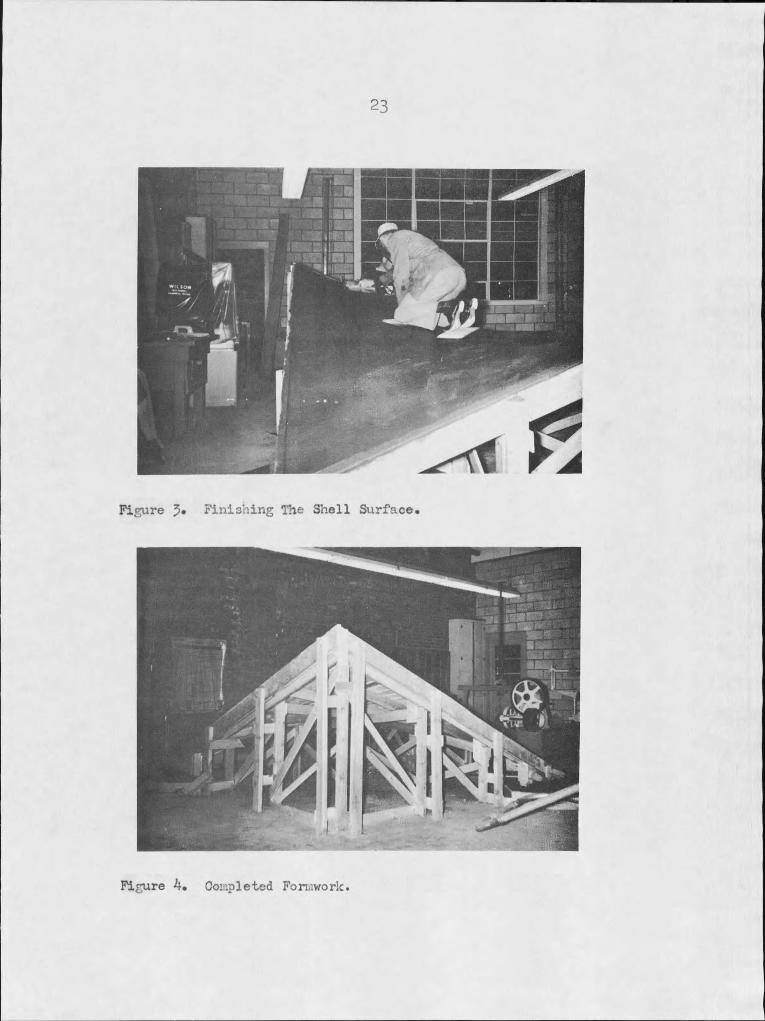
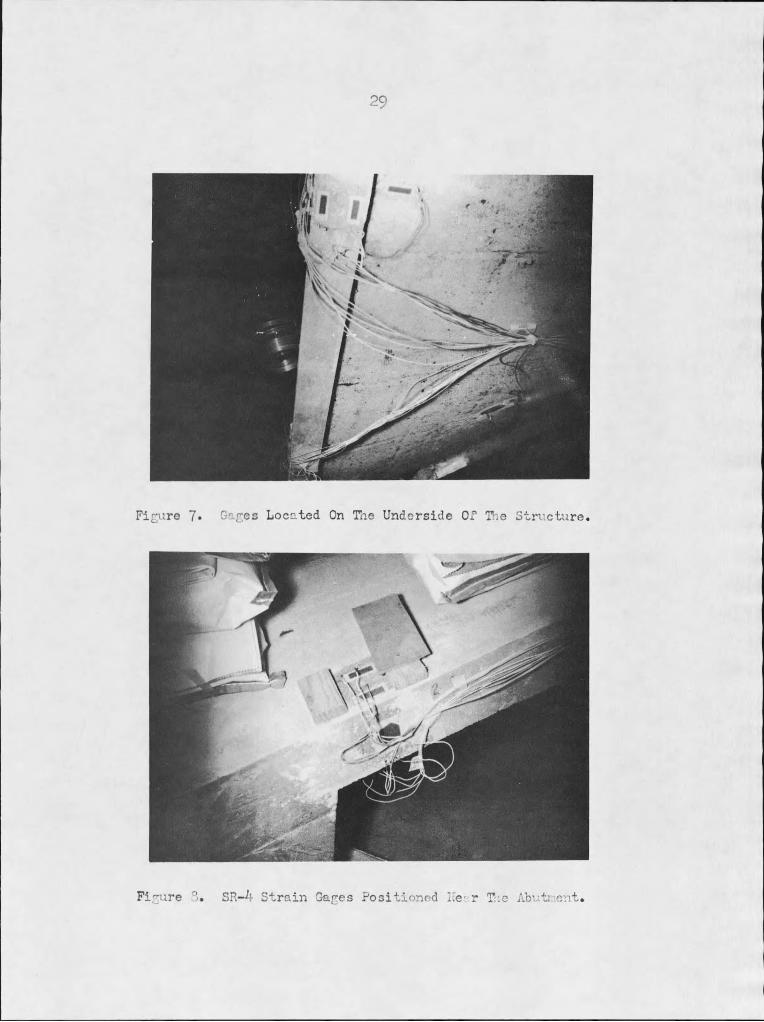
Twelve positions were selected for gage placement. ■Their exact location .cap be seen on Figure 2, Figure 9, and Figure 2a. ■ By symetric placement of the gage's at the

21
j GAGe Po s i t i o n s
F i g u r e 2 . .A n d G a g e P o s i t i o n sD I M E-NSlONS

22
S R -4 Strain G ag.es
A b u t m e n t G a g e sS ection A~A
S ection B-BF IGURE /2 a.
G ag e L o c a t i o n .
23
Figure 4. Completed Formwork.

21+
Fi-ure 6. Sn-4 Strain Gages Located At The Bean Center.

2,5.
TABLE I gage Location Key,11- Tib12- TIw13- Tlr14- BibI S-B-ir16- Blw17- T2b . .18-.T.2W19-B2bIlO-BSw■ Yl-TSy .7S-C2y 73-B27 74'-T3y ■75- C3y76- B3y77- T6y ,78.-CGy 79-BEy
Sl-TSb 31-T5b 41-T7b 51*-T9r 61-Tllr.22—T3w 32?T5w 42-T7w 52-T9y 6SrTlly23-B3b 33-T5r 43-B7b 53-,B9r 63-BIIr24-B3W 34rB5b 44—,B7w 54-B9y 64-B.lly25-T4b 35-B5w 45-T8b 55-T10r 65-TlSr ..26-T4w 36-rB5r . 46-TSw 56^T10y 66-T12y'27-T4r 37?T6b 47-TSr 57-BlQr GTrBlSr28-B4b 38rT6w 48-B8b 68-BlOy 68-Bl2y29—B4w 39r.B6b 49rB8w 59-C8y
SlOrBlr 310-tB 6 w 410-BSr SlO-CSy- ' Abutment81-T7y Gage . 5 -.- 3 982-C7y Positions 11 IS 783-B7y84-T5b Plan 4 Q85-T5r View O
86-T5w 10 9 . Measuring
Abutm ent3 2 I Table
Example: IBox,No, Box Switch.Np. Location (top) Cage Position
. b6 olbr-.
,Symbols:T - Tpp of i.Beam' or. Shell B - Bottom of Beam, or ,Shell 0 -Center of Beam on the Outside Edge b — Blue Wire, / w .White. Wire , r - Bed Wire;. . j: - "Yellow- Wife
For gage numbers from, 11. through 410 blue is bn the outside of the edge beam,.white is on the insIde edge of the edge beam and red. is Idqated on the shell at the numbered positiorisGages numbered frp;m 51 t hi ough 58 and from 61 through .68 are located on,the shell,.- with .yellow .being closer. to the ceriter in plan. -
Gages numbered from 71 to 83 are on rosettep and- arelocated at the center of the beams near,the supports.

26
Gages numbered from, 84 to 86 are.,, on a rosette loeated on the shell at position 5. , 84 is perpendicular, to the edge beam, 85 lies along the compression parabola and 86 lies along the tension parabola.

27
center of each beam, at the.supports and on the shell, It was possible
to obtain readings of a similar nature. The following graphs were pro
duced by using from one to an average of eight readings for each point.
The exact number of readings represented by each point can be seen by
referring to the tables containing the data. Gages placed on the
beams were located 5/8 in. from the edge because of the rough nature
of the concrete near the. edge, and also to keep away from irregular
strain near the corners. Location of the gages four inches from the
abutments along the edge beams was also to get away from irregular
strains. Gages on the bottom of the shell are located beneath gages on
the top such that the perpendicular distance between them is two inches.
Attachment of the gages to the concrete created some problems.
These were overcome when the following procedure was used:
1. the surface was ground to a fairly smooth finish with
a power grinder and carborundum wheel ,
2. remaining pores were filled with hydrostone capping
compound, which was allowed to set,
3. the surface was sanded smooth and thoroughly cleaned,
4. a coat of SR-4 cement was applied and allowed to dry.

5.. a ,.second coat, of SR-4 cement was applied and the gage placed over the fresh■cement,
6.' the gage was held in place and a pressure , applied either by\a weight' or. by hand for about.twenty minutes.
Gages placed on test" cylinders in the same manner served as compensating gages.WIRING AND . STRAIN' MEASUREMENT
Godeid. wires from the various gages located on the structure were run to a common point nehr which the instrument table was located. See Figure 10. A Baldwin SR-4 strain Indicator was used for taking strain readings. Seventy-three pairs of gage leads required the Use of eight .Switch boxes- containing ten sets-, of terminals each
r "•'* -J.:...,r- ‘ . . , ■ 'for connection to the'circuit» These boxes were controlled by the master switch box which was connected to the indicator,.- See. Figure 10. Both types of compensating gages, were ..connected, to the master, .switch.,
iDEFLECTION.MEASUREMENT
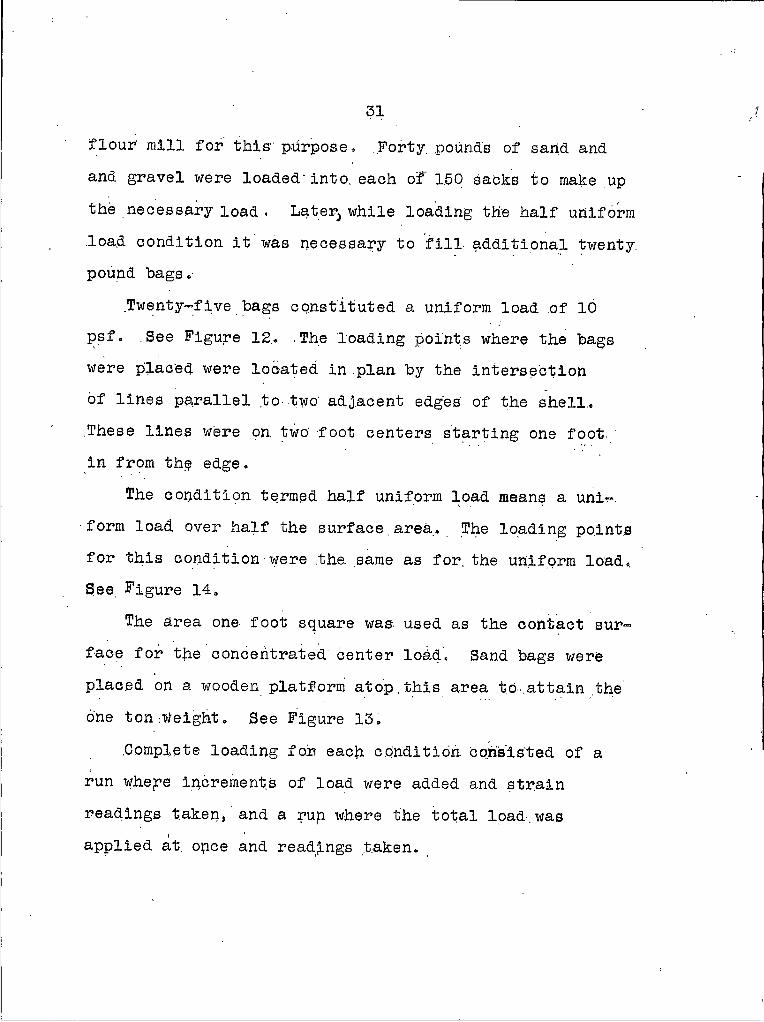
Deflections were only measured on the free ends of the shell. ' Readings were taken using a dial gage supported on.a wooden post. See figure 11.LOADING
Sand bags provided tha means for applying loads to the structure. Paper feed bags were procured from p local
28
29
Figure I. SR-A Strain Gapes Positioned He r The Abuteent
30
Figure 10. Switching And Heasuring Equipment
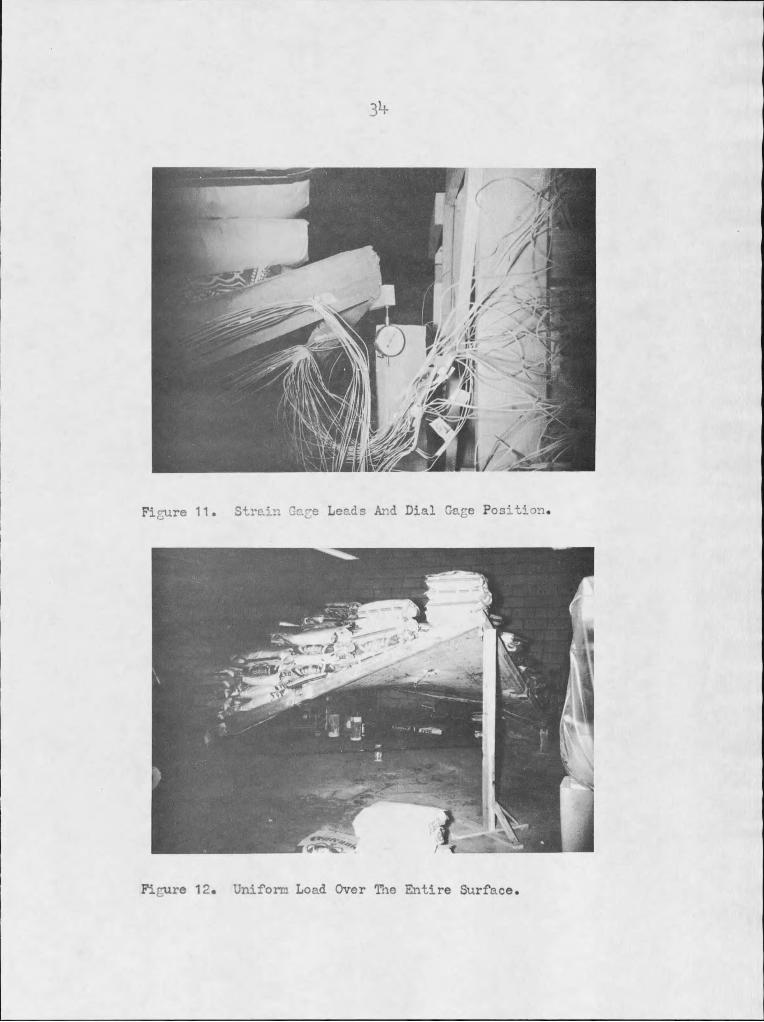
flour' mill for this" purpose» Forty, pound's of sand and and gravel were loaded into, each of' 1,50 saoks to make up the necessary load . Later5 while loading the half uniform load condition it was necessary to fill additional twenty, pound bags.
Twenty-five bags cqnst'ituted a uniform load .of 10psf. See Figure 12. .The loading points where the bags • !
were placed were located in plan by the intersection of lines parallel .to two adjacent edges' of the shell,. These lines were on two foot centers starting one foot, ' in from th<? edge.
The condition termed half uniform load means a uni^. form load over half the surface,area. The loading points for this condition were the, same as for. the uniform load. See Figure 14.
The area one foot square was used as the contact surface for the concentrated center load. Sand bags were placed on a wooden platform atop,this area to.attain the one ton/Weight. See Figure 13.
Complete loading for each condition consisted of a run wheye increments of load were added and strain readings taken, and a rup where the total load.was applied at. opce and readings taken.
31

32
EXPERIMENTAL RESULTSGeneral
Tests of this type haye many variables. The following is an attempt to discuss ■ tJp.ese variables, the accuracy of the results and some of the assumptions made.
-Average -time for one complete increment loading was about three hours. During this time the temperature (usually about 95°F) was h^ld to within one degree of - the initial. .After each ipcrement of load was added,all seventy-three gage readings were taken, a procedure which took about fifteen minutes. A check back on the first gages read was done following the completion of each such reading. .Maximum variation was usually around three to five ..micro inches per inch. Several things could contribute to this, mainly variable switch.resistance. The erratic behavior of the lipes plotted on the foilSwing graphs for small values of strain show this variation quite clearly. .As a,result these small values have no value except to indicate- practically no strain. When large values of strain are obtained, small variations are not as noticeable, however, readings do not have pinpoint accuracy. .
On the example graph (Figure 17) individual gage strains are plotted for a typical.point. These strains jump back and forth, but on the average one gage will

35
have higher readings- than ttye others> This also sJntows up under other types■of loadings* Again the many variables involved with this type work can account for these differences. .NoriAhomogeneity of the concrete,., slight beam size or shell thickness variation, gage placement over paste as opposed to over aggregate as well as many others could• be cited, .At best then, the information that is shown by these tests is approximate arid shows more of a trend, than absolute accuracy.
Modulus of elasticity for concrete is needed to give some relation.of stress or total force to.strain* The stress strain relationship for concrete is not linear, but an approximation that E] = IOOOf i is sometimes used*A design f '. = 3000 psi was prescribed, but test cylindersObroke at much higher valueq* A 3 in by 6 in cylinder cured in the same fashion as the shell broke at 4660 psi. at a 30. day age, while two 3 in by 6 in moist room cured cylinders broke at 9560. psi and 9050 at the . same age. .The structure was tested at about two to three months age. -It would not seem unreasonable that a strength .at . this age might be around 6Q00 psi. Therefore, for purpose of approximate comparison the-value of the modulus of elasticity will be assumed to be equal to 6 x IP®psi* ■Uniform Load
Points of highest stress for this load condition
31+
Figure 12. Uniforn Load Over The Entire Surface

I
are located mainly,on th$ edge beams. Shell stresses are quite low and as previously discussed, low strains tend to give erratic.readings from the. indicator. .
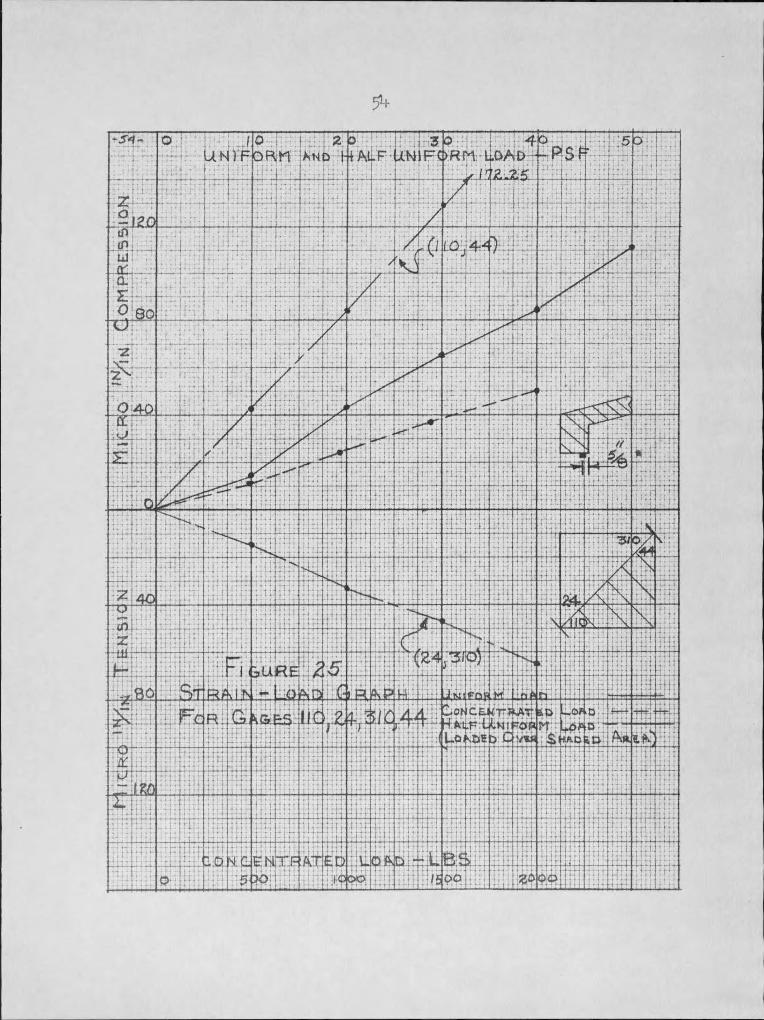
•Gages (13, 27, 33, 47, 15, 210, 36, 410) placed perpendicular to the edgp beqm at the,beam center, show some,., interesting strains.- TJqe gages are located five inches Ih from the edge of the beam.. From the .theory . it seemed justified that there would be no force per- pendicular to the edge bpam, ,.yet these gages show a definite tensile force. .The strains varied wlt^ two.separate loadings from around 20 picrp in/ih to lower numbers.Perhaps deflection of thp edge beam paused a slight tensile force. • More tests with more gages applied would have to be run.before p definite answer could be obtained.
The average values of strain for the edge beam at the)
center showed the following -ptrain distribution. See 'Figures 20-24 for strain valpes. ,If we looked at the strain distribution across a plane perpendicular to the beam, a 40 psf live load would give average values as shown in the following sketch* Column action due to an eccentric axial load seems tp be functioning here..Assuming E- = 6xl06, psi and that the total force (F) is carried by the edge beam, then F = (20 * 30 + 20)(2)(3)(6)/? = 1260 lbs.
35

363 0 MicRn irVimi The theoretical force
2 0 M ic r o % ^
equalsF = 40(5)(5) 116/2(2)(2)=1350 lbsFrom this distribution Itappears that the free
end should deflect up, however, this is a localized condition due to the column action by the eccentrically located edge beam.
Stresses in general were very low, but some in the vicinity of the abutments provided some interest. From Figures 25-29 the strains at various locations can be seen. Tensile stress developed in the concrete near the abutment was of most concern and appeared to be caused by bending in both directions. The beam at this point seemed to bend down and in. See Figure fs . The main reason for bending here is the rigidity of the abutment.The structure natually will deflect under loads, but here the abutment prevents the deflection thus causing fairly large bending stresses. Using E = 6xl06 psi, maximum average tensile stress reached for uniform loading was 240 psi and maximum average compressive stress was 666 psi. Final end deflection at 50 psf live load was downward about 10 thousandths of an inch. The eccentric location of the edge beam undoubtedly limited

37
this to a lesser value than would have been seen had the beam been more
symmetrically located.
Concentrated Center Load
A concentrated load was built up over the center of the hyper
bolic paraboloid on a one foot square area. This area was larger thus
only small contact and shearing forces were developed'under the load.
Gages placed along the compression arch showed some strain was
present and that it increased nearer the support. See Figure 19. Local
bending or the dent caused by the one ton load extended somewhere beyond
a 2.83 foot diameter as shown by the shell gages. See Figure 16.
Compression on the top and tension on the bottom changed to compression
on the bottom and tension on top of the arch somewhere between the in
side and outside shell gages. . Near the-supports> the direction of the
strain in the shell agrees with;:that in the edge beam. Maximum average
compressive stress developed in;the shell under a gage was 274 psi and
the maximum average tensile stress was about 48 psi. Both of these are
sufficiently small to term negligible. Higher tensile stresses definitely
existed directly under the load, but none of these were recorded.
At the center of the edge beams, the SR-4 strain gages showed
bending in one direction. See Figures 20-24.
Compressive stresses were small, but tensile stress reached

38
Pirure Ih V n ifo n - Load Over J Ia lf TJic Surface Are-.

values up to 190 psi. This stress distribution or one similar was
apparently prominent over^most of the beam because the final end de
flection was up*
Strains at the abutment for the maximum concentrated load condition
are very similar to those created by a uniform load of 40 psf. The
differences being that the compressive stresses On the top of the beam
are lower, and the tensile stresses on the bottom are higher for the
concentrated case. This condition could have been caused by most of
the force created by the load going to the abutments on the compressive
parabola. Maximum average tensile stress reached at the abutment was
about 270 psi for a one ton load.
Free end deflection was up with a magnitude of about 16 thousandths
of an inch.
Malf Qni form Load- .
The half uniform load was a uniform load over half the projected
surface area of the shell; A load of this type is entirely possible
in practice, and presents an eccentric condition.
Again, the shell stresses were very low as for the previous load
ings In fact, stresses of any magnitude failed to show up except at
the abutment.
Strains recorded for the beam center location under
the load showed an almost identical strain plot as did

40
the pure uniform load. See Figures 20-24. For the beam center not
under the load, strains were of negligible size.
The free end under the load deflected down 60 thousandths of an
inch, and the other end went up 55 thousandths of an inch. With this
information, the stress distributions can almost be visualized. Edge
beams under the load at the abutment are acting somewhat as canti
levers.. They develop high tensile stresses on the top and high
compressive stresses on the bottom. Maximum average tensile stress
on the top reaches 441 psi, while average compressive stress on the
bottom reaches 1030 psi. See Figures 25-29. For edge beams on the
other side of the abutment, the strain distribution is reversed.
Here, maximum average tensile stress occurs on the bottom with a
magnitude of 330 psi, while average compressive stress is about
252 psi.
Loading was carried to only 40 psf for this condition because
high tensile stresses were being developed at the abutment and failure
was not the present objective. Further tests on the shell and beams
around the abutment for eccentric loads may be done in the future.
Stresses discussed in the proceeding test and approximate, varying
with the modulus of elasticity and were used only to give some idea of
existing stresses. Maximum average stress as termed in the text means the

average of the number of • readings at one-gage-and not an ^average of the stresses along a side or position. Principal stresses were not found iri these tests, just stresses perpendicular -to“: deB'ihed planes..
41
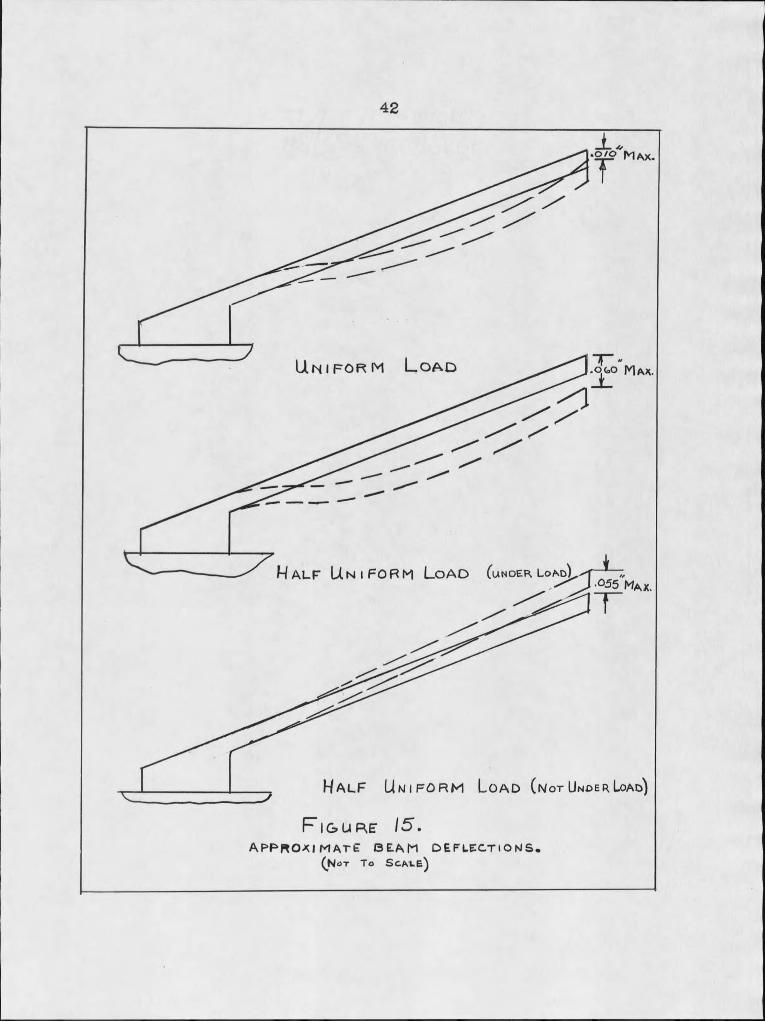
42
U n i f o r m L o a d
H a l f U n i f o r m Lo a d (under load) '0 s max-
N alf U n i f o r m Lo a d ( not Under Load)
a p p r o x i m a t e b e a m d e f l e c t i o n s.(Not To ScM.e)

43
C o m p r e s s /on Pa r a b o la
F i g u r e 16.C O N C E K i r R A r e o L o a d D e f l e -c t i o n C u r v e s
( Not ro Scale.)

44
CONCLUSIONS
The results of these tests do not entirely uphold the uniform
load theory as derived when applied to a hyperbolic paraboloid with
fixed abutments. When abutments are extended along the edge beams
with the intent of taking eccentric loads, then some design alterations
might have to be made. The present system of designing edge beams as
tied columns should be sufficient where abutments are rigidly fixed
to the shell along short lengths, but do not take the entire eccentric
load. Edge beams, down to a point somewhere between the center of
the beam and the abutment seem to exhibit column action mainly, except
for a concentrated load. H e r e t h e beam would be more efficient if
it were more symmetrically located. The sharp departure of the edge
beam from the shell' probably causes some stress concentration and
should be eliminated. This procedure is presently being done.
Near the abutments, an edge beam with a variable cross-section
should take care of eccentric loads and stress caused by the rigidity
of the abutment. The beam should have some tensile reinforcement on
top and bottom.
Shell stresses at the highest are of a. very low magnitude and
seem to be the least of the worries in design.
The preceeding discussion is basically what showed

up In these tests on the hyperbolic paraboloid. The magnitudes of the results are probably of little use for the design of larger structures, but' the; stress distributions' should give a more basic, idea of what is actually happening in 'a, shell of this type.

46
'
-4- 4 • - 4— j
I'j~i ~i ' t"I*
t f-
I T I"+■

^7

48
-H - -
—*— p — -f
■j — I— —f------4-
44 --
T-r--
i 1 - i
J 11"
4.4 L-;-
-i -1- -i , , -4
i.-i-*— I— I— I—4—| —|—• -f 4 ■+ T

4I i : : O-U-I-U UK
t r f r
—1—
5I F e I r -WWrgT tT#
T U ^roRFj f i r
S |wElof1 r l L
t PB f
rSffij::fU — 45 B T T
#r o t
y ko
-14 •- t j i )- - • -• - -
-1-4 — -- ±—t-4 | f f l t I
| --WWr
U-H-L-(- I —4—4-. . :I f± : I I L :- W f
d d fw JwW- ---I I-
7 5g f i H
=ud±IfU ---L.-W :;
I L, I ##.-I-LL-I-t 1 t I I I
W-t :H- a :
fS
—L—U- II-Li
i f Uwt4 U " U w t .
ttf - ♦
r 20 If i ±
L U -
S f r o
- i j-i -It, , .■ '
-TO-J-W1444:u -irf-
WfiH ■ I f fW
-W WWJ id L i41dJ-
I T f i"S B
O rH • •----H-h j B e
I t r tr o tr o t
U -IJ ff # M
U iL L
I -M—S # L B r
S f IH t F U -j—| f -L ■t / U f t
f : :*■ VO
U lf---H-ro-- # S I--I f-j rSIf l L L
-w - l lB i-I I—r 4—#
Ui I L.L td t- f-4 WWH ufi I
U —5r u t- -j—|—I—41 _J-
Al WP DjH d rJ f B
u r r—f-4 wU •B-f 4 7 ■W—f-W -+- -. . , 4 .
W -H id #
-U tT UU; —f
- I Id r
-I f I±
wT-B4L U
r o -f tH
f t4EEl
,B B tU f f
B-H-JZM""
I H T t
t i t --■El- -TO
# p5■ r_tIL:
rpf
-I I UU|I ; | T1
: : ; : .IJw
--ILW fro|:t4 L -
fJd- LL-
U t 1 :IJ Lc
-rI ^ t
i f± :II=CIII UfU
mLTL-F3 mI j L
WWW• f i t r r i i rw-i- 4- 4I I i I
iIIB u t
B u w_I_• • >
Hfw-U—f-4-U r Wiuuu- -U-d—I—W- - - -j--+—+ U -#
: IOH I W I
u f
-WWWU I tW n
::i l r
1114 I E- - 1I-
i 1 '-Jw 4-4—LU
J U w# . j-.| Z)4 . /UW fiii y x7B ; - U m
V fUI WfT
• --t- f—4-4 -
" g-4-4-O H;y*zo
# ...L I 4 4 -M-T-r
! J • 1 . . . ,.Lj-Ui--i-
x i 4 —f x
S r j :f roT
d U L# B'WfL
. - \# -U-U -W I LT-Wji ■
I I ] '- t-t I | - -Wro+-
Il-W -ro - W4-4 ' I. LU.rtJ RP Zn
! NU -:-UBLI I I
-W-U- j—- •- f t+ 1-X L L
f t #: Con
r<a/ithNtRT
Bqad jWwfw FLd U ao fro
J-W r
- . f-WI # : o
: St r wn
:Fo r :Gf H -T I - W-*-- T- 4 —I -1 4 j—*—J—|— —I #- - j-.u -4- —4 -4—< —
m—j—r t~|—
SEE
I r B l
RAP8 ;3 4
-+--W-J
4 T-Xl-•4 L U- wt~
. HalWUMlF! L ( OAdm Qv•\* f f U T—r -f- -
LU. MuJ LfOiM URjitiAO
i .1 I I !
I W-'46 A-ff-t-- I | t
■
r&h)--f-4 J- i ---4" * f -U --J- f-t -
• ■
t s L 8E-Ii-Jf- -Tt-T L
EjL'TTTO-
I-LHI- U- W -J- - ♦- --W-4 -W I ■W WI ! 1 : :- 4 —f—Stu-T -WtwH I- WWt Wh - ro-! I "rtiroSE ::
. ,-U J I Uj- ;r: ' j ! [Ti■ I'1 +4%W
- L r o i -L—riu'; I j 4-
u 4W f -
3S4±
:j|W
X
C
-4—H - "• 4-i— 4-* |--—f -I U--^— 4-. —t"'41 ■ I ~■
- r' ;" iu4-t-f4 H'i i : i1°Q-:4 * i: j
•- ro J - * - 4—- L-X-U - I—j w-f
-LL-uU l : I : CO!O ■ ^ t 1 -4
JCEtW
&UL,■ R f t r
u mCD 1C.) 4 B |
)AD:-.j.vs
LEOQ
-!-Li--J— L-L-

5o

51

52

53
i : UtMlFORK !XkUJH A H F iLkK iF U R M U O A D S U P S jF
—i 4-+-jify * • 4-4 -H----H 4' Irrti 4 I fH-H- ■ • I—H"
. . .T t t f
—j--1-I—I -j—j-* - -f » «t-t r 4
1444-4
4.444
-j +- f tHr---j—H r
Hr--Hr- - -4 - j —4-
trfr
- •
*--- - - - L —4 "* T r - 4 i 1- - f - f r' To LaM art-I K nlf UatFOK.r Lq^d,^— • : QveX ihAbcb AvRifi)4-i- — L4 4--j-4— ♦
tTTTI
3 lO -'j:; 1 : 4UNIFORM U-OAD -
ONCEteriikAr iu
::!!. .Ht!

55
/0 ; I :-fcNH FC #-R 1*1 ^nd. i 3 2 .:- . 4- 3 i
HALF LLN ! F1ORM •L.-qA.O-HSF
x
-Lill lii

56
M AND
TD."'"
t zrfrr
ft 4.ii

57/o O 1 • • Wf WfH', .( ,.I
\LF LkNlFORM LOAD - P S l K : "• j • • •• • r • - I • • ■ i - ' t ■• j ' * • ...................
': : J- • . . . . ............I j * I *
'Ir l' T

58
APPENDIX• T--.- • -
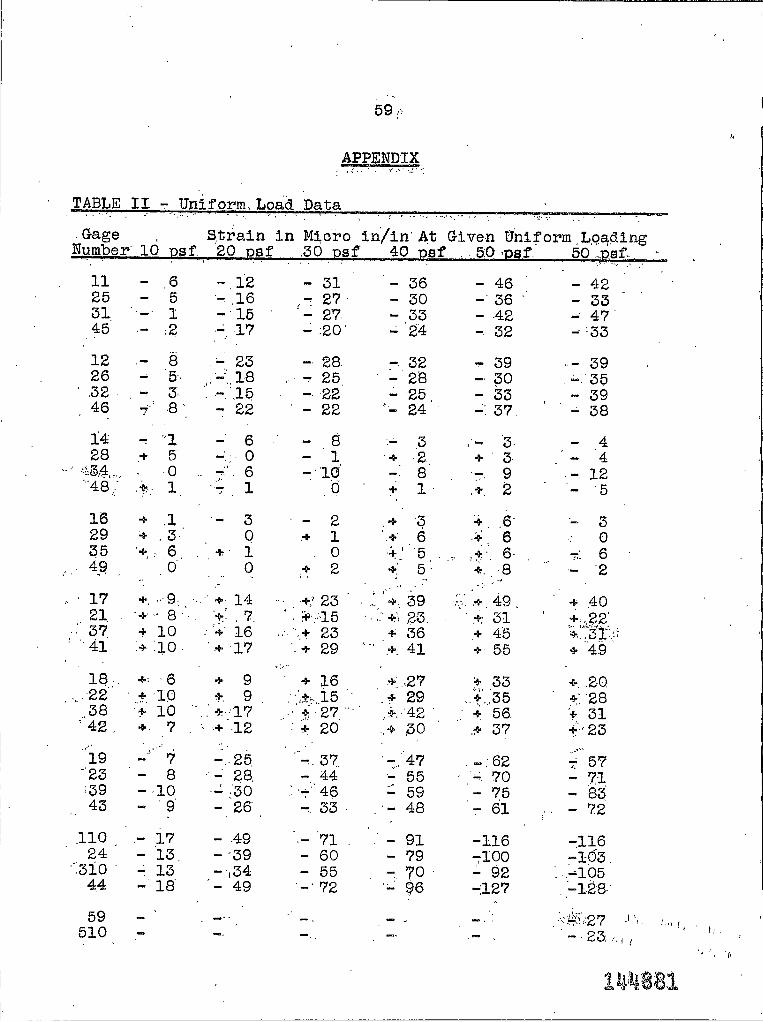
Gage Strain In Micro in/in At Given Dniform LoadingNumber' .I Q psf. 20 osf .30 oaf 40 oaf . . 5:0 -oaf 50 loaf.
- '' ' ” • ■ • ■ ■ ■ - -----------------
TABLE II T Uniform, Load Data ______________ _________
11 - .6 -.12 - 31 - 36 - 46 - 4225 - 5 - .16 ,T 27 - 30 36 ■' - 3331 I - 15 ' - 27. - 33 — 42 - 4745 ;2 - 17 - '20 - 24 — 3.2 - 3312 - 8 23 - 28. - 32 r. 39 — 3926 - 5 . - 18 .. -f 25 - 28 - 30 .-35.32 . - 3- ■ - 15 — 22 - 25 - 33 - ,39
, 46 "i' 8 - 22 - 22 24 - 37. - 3814 T "I - 6 - 8 - 3 3 - 428 .+ 5 -:■ 0 - I + 2 ♦ 3 ' - 4•4.34,,., 0 .. 6 -'10 8 . - 9 ■ -. 12"48/ ■tv I. T . I . P ' + I .+. 2 - '516 .1 - 3 - 2 + '3 .6 - 329 * , 3 0 .+ I .+ 6 ■+. 6 035 >.-,6. . + • I . 0 + ' 5 . , *. 6 . —'. 6
, 49 . 0 P > 2 t 5 ' +. . 8 - 217 +. 9; X 4 ■■■ + 23 ‘ 39 ■:/ * 49 + 40
.. 21 + " 8 • ■• >■ ■ 7. ’ • + 1 5 .*',25. ' + 31 ' +,22, 37 + 10 V 16 23 +■ 36 ,+ 4541 :+ io ■ '* 17 ■■+ 29 "■ 41 + ■ 55 + 4918. +; 6 + 9 + 16 .+■ ,27 * 33 +. .20, 2 2 ■ t IP *. 9 . '.'*,15 '■ .* 29 .t,.35 ' +:28.38 > 10 ' + 1 7 ..-.t'27 ' .*.42' . + 56 t 311 42 . + . 7 . + 12 ■' * 20 ,+ 30 > 37 + 23..."19 '-"'7 -,25 ■ - 37 - 47 .-62 T 5723 - 8 - 28. — 44 - 55 ■ 4 70 - 7139 - 1.0 - 30 .: - ' 46 - 59 - 75 - 8343 - 9' - 26 -r. 33 . - 48 - 61 .. - 72
.110 - 17 - .49 - 71 . — 91 -116 -11624 - 13. - -39 - 60 - 79 -100 -103.:3lo44 - 13
- 18- ,34— 49
- 5572 . - 70
- 96- 92 -127
-105 . -128
59 — w • \4::27510 — — - 23,.

60
Strain in Micro in/in At Given Uniform LoadingTABLE III - Uniform Load Data v ■ _______ . .
Number 10 d CO H3 20 oaf 30 oaf 40 oaf 50 oaf 50 oaf
13 + I . 4 • 3 4 9 4. 19 4 21 4 427 * 12 4 10 4 Ip 4 24 ' 4 26 4 633 > .10 4 11 4 16 4 23 4 29 047 6 4. 12 4 ]L9 4 26 4 30 4 . 615 .5. . 4. 3 4 7 4 17 4 22 4 2
210 + 3 4 , 8 4. ]LO -4.20 4 24 4 536 > 2 .4 2 ■ "fr 7 4 17 ■ 4. 20 - 3
410 4- 2 4 8 . 4 15 4.20 4 25 , 2'71 .5 13 • 1.5 . - 2074 — 3 m. 6 — 7 . - 9 . - 11 - 1177 — 4 — . 9 - H - 14 - 1.3 — 981 • . — 6 — 10 - 11 - 18 - 20 - 1172 3 . 5 4 {LI 4 11 4 16 4 1575 + 8 .4 11 4' ]L8 4 26 .4 37 -4 3078 4- 5 4 8 4 J.4 4 19 4 28 4 27,82 4- 7 4' 12 + $4' 4 30 4 41 4 3673 _ 3 mrm 5 — 3 - ,3 - I 4 3.76 4- 4 4 4 4 8 4 8 .4 15 4 879 - 2 **» ' 3 0 0 4 ' I 4* 4:83 6 0 4 7 .4 5 .4 7 4 884 _ 4.1285 — - - ~ -• 786 - - - - 4 651 4- I 3 •4 .5 4' 8 4 15 ■ 4 861 11 - .15 " IL2 - 5 0 4 353 0 «e 4 4 I ■ 4' 7 4 12 - 563 . - I - 4 0 4 8 4. 12 4 552 4 4 4 4 I 4 6 4 7 - 462 — 7 - 13 - 6 - . 3 - 2 - 254 4 I 0 4 7 4 16 4 20 .4 2
64 4 I - I 4 6 4 7 '4 17 4 8

61
TABLE IV
GageNumber 10 osf
Strain in .20 osf
Micro, in/in At 30 osf 40 osf
Given Uniform Loading 50 psf . 50 osf
m . - .6 - 16 - 6 ' - 6 - 7 — 1465. - 10 ^ 12 - 4 - 2 + 3 - 757 - 3 - 12- - ■ 9 ... - '5 - 2 - 1767 - 6 - 11 9' + . 2 + 5 - 756 - 7 - 15 - .9 - 8 ' - 8 - 2066 • — 6- - 11 ' - ■ 5 - 8 • — 4 - 14.' •58 - 2 — 4 +. 2 + .8 + 15 - 468 - 2 — 4 4 -i + ■10 . + 16 . + 6DialGage #1 +1.5 +3.6 +6.0 . +8.9 +11.4
+2.5 .+4.8 +7,5 +8.5 +10.4 +7.0+2.0 . +4.5 +7.0 +9.5 +12.5
DialGage#2 +1,5 +2.5 +5.Q. +7.8 +11.3
+1.0 +2 ,4 +4.1 +6:i —- ■ +9.3+2.0 +5.6 +7.Q +9.0 +10.0
0 Dial 0age readings ^re In thousandths of an inch with plus Indicating a downward.deflection.•
0 Mrius'prepeedfng the strain readings indicates compression and plus indicates tension
0 The two identical Ipad columns representseparate loading. Tljie first belongs with the increment loads, the spcdnd was loaded all at once.

62TABLE V - C o n c e n t r a t e d .Center Load Data
Number Strain ,480 lbs In Micro in/ln At
960 lbs 1440 lbsGiven Concentrated Load 2.000 lbs 2000 lbs' H * I — 4 - 11 - 17 - 2225 • - '4- -. 8 —■ 13 - 17 - 1 331 - 3 - 10 -.17 - 23 - 2245 - 4 - 10 - 13 - 17 ■4 16
E I - 4. - 12 - 20 - 2226 - 4 - 8 - 15 - - 17 - 1932 - 5 - 1.1 - 16 - 23 - 2346 - 4 — 8 - I? - 17 - 1714 * 14 -«• 20 + .28 + 40 * 3428 + 11 ..+ 20 + 31 + 42 + 4034 - I + 3 • + 11 + 21 .+ 2648 + 5 + ii + 17 + 26 + 2616 + 3 + .10 + 15 + 21 * 2629 + 7 *■■13 t 21 + 27 + 2935 2 * 7 + 15 + 24 ■+. 3049 ,+ 6 + .11 + .17 + .26 + 28 -17 + 9 * 21 + 32 + 43 + 4821 > 9 + 16 + 24 + 38 + 3537 + 4' + 15 .+ 23 + 33 + 3841 + 17 .+ 28 + 42 + 63 + 6618 ■.+ I 8 + 13. + 21 + .2722 .*$> 9 * 18 .+ 24 + 39 + 3238 + 5 + 15 • * 2;,9.: ■o*. 44 + 4742. . * 9 +.13 • +• 21 ' + 34 + 3619 - 11 - 17 - 22 - 31 - 2423 - 2 - 5 - 10 - 17 1639 - 6 - 14 - 22 - 35 - 2443 — 10 - 17 • - 28 - 30 - 24
H O - 15 -. 31 - 47 - 66 - 5424 - 7 - 15 - 24 - 39 - 30310 — 9 — 19 - 31 - 46 - 3944 - 15 - 32 — 48 - 62 5959 + . 2 — I + I + 7 + . 9510 ■+ I - 4. > 2 + 3 +' 9

6.3
Strain in ,Micro irj/ln At. Giveih Concentrated LoadNumber ..480 lbs .96(3 lbs 1440 lbs 2000 lbs 2000 lbs
• ' • 1 1 . 1 , ............. - , ■ .
TABLE VI Concentrated Center Load D a t a _______________________
13 . * '■ 9 . + . 9 + 9 4 10 ' -4, 727. .* . 3 . + 4., + 5 4: 11 . 4 733 I ■*“ 2 .' . I 4 4 4 .. 647 2 + . 4 ■ ■* .5 4 10 4 8/15, _ 2 0 ■- Q T- " 4 - 3.210 I 6 - '• I — I ” 236 — 2 - . I 0 - : 5 - I410 . -- 2 - 3 - .2 — 4 - 6.71 4 -J- 9 < 11. '4 .19 4 974 + 6 + 12 ^ 18 . 4 22 4 1277 . 4,, ,6 4 13 , 18 . 4.20. 4 2381 + 6 + 9 ,+ 10 4 13 4 772 .9 + 18 ,-Sr 25 -t-35 4 2775 . 8 + 20 4.30 . •4 43 4 3578 ■C* - .9 -s- 19. 4 28 ** 37 4 3482 12 +. 21 31 " 4 45 4 4273 + 2 + .5 ■ -J-. 4 4 8 ' > I76 . 4- 3, -s- 8 .+ . 9 4 10. '4 479' + 3 + .5 > . 4. 4 5/ ■f I83 .+ ' 2 *■ 3 -»■ 7 4 7 O84 7 + 9 * 14 4 ■ 14 4- 1085 -0> .4 -J- .5' + ■ 8 ' 4 .. 6 - I86 . + 3 0 O —' 6 - 1451. — 4 t 2 * 3 4 5 + .361 ’ 6 . * 8 . .* . -7 4 10 4 . 253 .V 4 t 2 + 5 ■ 4 6 4 563 + 3 t 6 -j* . 4 4 " 8 4 452 0 T 3 — .6 - id 4 .768 5 f 6 Tt- .6 4 6 . 4 754 . ■— . 4 I 4 7 4 13 4 2564 + . 6 rs-19 * 12. 4 17 4 1.6
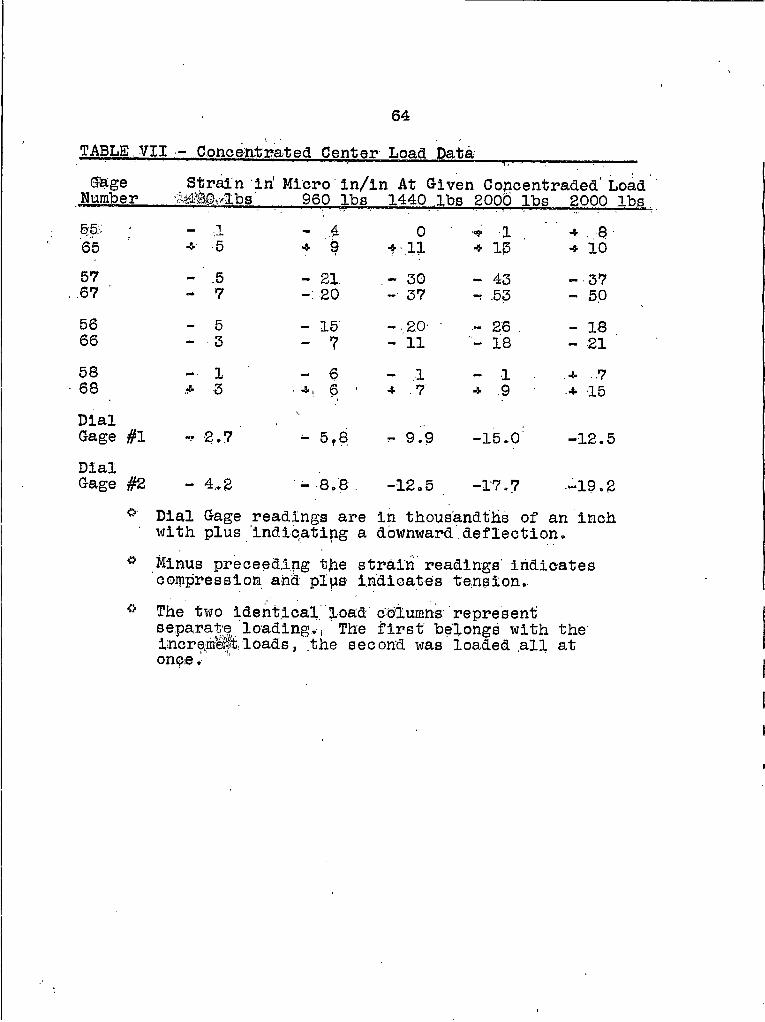
64
TABLE,VII - Concentrated Center Load Data ©age Strain lri Micro in/in At Given Concentrated LoadNumber b si 960 lbs 1440 lbs 200b lbs 2000 .
65- - ,1 .■4 0 -I , -«■ ,865 * ■5 * 9 * 11 * 13 1057 — .5 21 - 30 - 43 - 37.67 7 20 - 37 -i .53 - 5056 — 5 — 15 - 20 " 26 . - 1866 — 5 — 7 - 11 - 18 - 2158 F* ■ I 6 - I — I .* 768Dial
.!*• 3 ■ i 6 ' 4 7 + 9 * 15
Gage #1 2*7 5^8 T- 9.9 -15.0 -12.5DialGage #2 — 4*2 ’ - 8/8 . -12.5 -17.7 -19.2
O Dial Gage readings are with plus indicating a
in thousandths of an inch downward deflection.
* Minus proceeding tjie strain readings' indicates compression arid pips indicates tension*.
° The two identical JLnad' columns: representseparate Ioading.*! The first belongs with the i;nprei:me$tloads, the second was loaded all at onp.e .■ ’
I
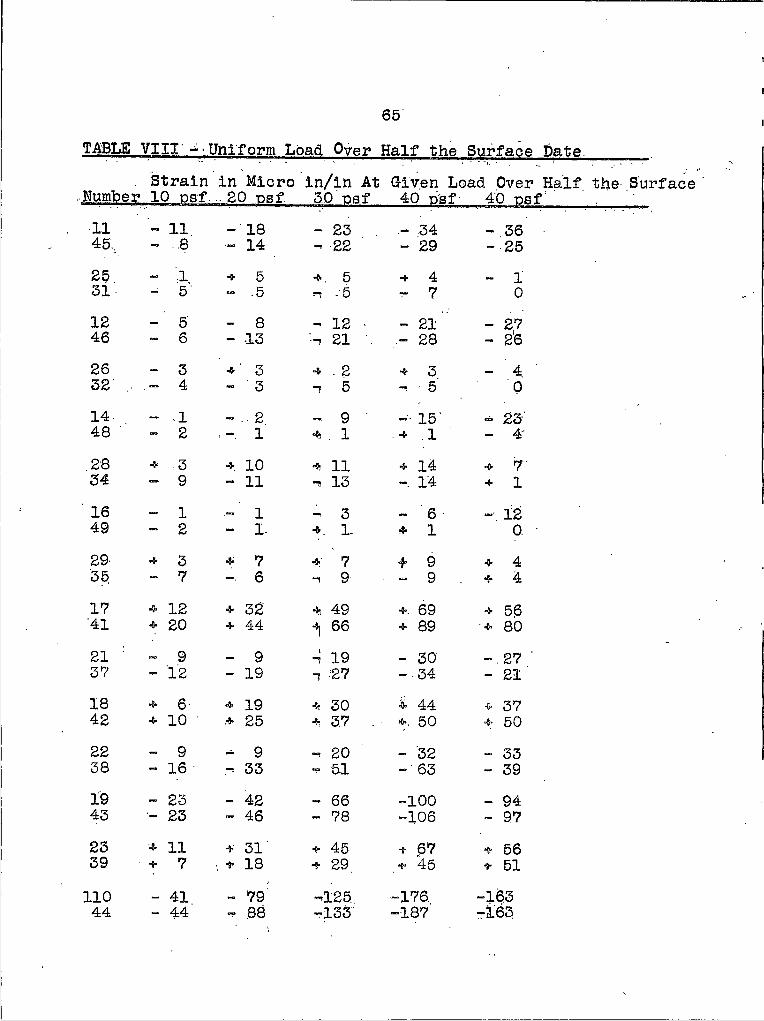
TABLE VIII ^-Uniform Load Over Half the Surface Date . Strain in Micro
ps f.in/in At Griyen Load Over Half the- Surface 5.0 psf 40 psf 40 psf______ .
11 - 11. —- 18 - 23 34 - .3645, .8 — 14 - 22 - 29 - 2525. — 5 •fr.. 5 4 - I31 5 .5 51 -'5 - 7 O
12 — 5 — 8 - 12 ■ - 21 - 2746 — 6 — -13 •1 21 . 28 - 2626 — 3 4- 3 -» • 2 + 3 - '432 , . “ 4 — ' 3 -? 5 - ■ 5 O14 — -I 2 -T 9 - 15' - .2348 '■ — 2 ; —. I . I I - 4'.28 3 •* 10 ^ 11 + 14 ■» 734 9 — 11 i 13 - 14 + I16 — I I T 3 - 6 1249 — 2 — 1- * . 1- * I 0.
29 3 * 7 * 7 f 9 + 435. — 7 "■ 6 I 9 - 9 + 417 12 * 32' 49 ♦. 69 + 5641 -O- 20 4- 44 t 66 * 89 ■* 8021 ' 9 — 9 4 19 - 30 -.2737 — 12 — 19 -T 27 — 34 — 2118 6 4 19 ■It 30 i 44 + 3742 4. 10 4 25 + 3.7 ■ 50 + 5022 — 9 9 -T 20 - 32 - 3338 ” 16 r 33 i 51 - 63 - 3919 — 23 42 - 66 -100 - 9443 23 — 46 - 78 -106 - 9723 4- 11 4 31 + 45 f 67 I- 5639 + 7 ; + 18 * 29 .+ 45 •9- 51H O 41 79 -t125. -176. -16344 - 44 mT 88 -133' -187 rl63

6E'TABLE IX. -Uhlform Load Over Half the Surface DataGage
NumberStrain Ii
10 DSf i Micro in/in At Given Load 20 nsf 30 psf . 40 tisf
Over Half T 40 osf
24... .
4 16 4 38 .4 55 4 7.9 4 .69310 V 13 4 29 4 39 4 .59 4 535.9 - 3 ■ - 8 ■ - '14 I to O 18
510 + ’ 4 4 7 .4. 8 4 7 ■4. 10 •
13 t I 4 4 4 4 .4 I 647 f 3 4 6 4 7 4 7 4 I27 - ' 2 4 5 4 5 4 6 4 233 5 - 4 - 4 - 4 ' 4 215 4 3 4 6 • 4 10 4 14 I410 - 4 ' - 3 4 2 4. 4 ■ 4 2
210 - I 4 - 6 4 3 4 2 336 ™ 11 - 1 2 - 13 - 12 271 - 6 — 9 - 15 - 20 1881 - 2 5 - 9 - 10 974 O 4 4 . 4 .. 5 4 8 4 977 3 4 3 ' 4 5 4. 9 4 1072 + 4 4 12 4 16 4 , 1 9 '4 2182 +. 10. 4 20 4 27 4 39 4 4275 - 2 - 3 . - 5 + 3 I78 - 2 0 4 I 41 4 4 773 * 2 4 7 4 11 4 13 4 1483 4. 8 4 13 4 18 4 1876 o - 2 - 5 - 4 779 ^ 3 - 2 =» 4 - 3 084 + 3 4 7 .4 5 4 8 4 685 .4 I 4 6 f 5 4 10 . 4 686 O .4 2 4 2 . 4- 2 4,51 4 VijjfSi.- . 4 16 .4 20 .+.. 22- 553. 2 - 2 - I 1 > , I 0
■ •

67
TABfcS X. r .Uniform Load Over Half the Surface Data
Ohge Strain in. MicroNumber. . 10 nsf 20
in/in At osf 30
Given Load Over Half The Surface osf 40 osf 40 osf
61. - . 3 2 I +: 2 - 763 - I - 3 - ' 3 - I. - 252 .4 8 4 5 2 - 5 - 12,54 + 7 4- 11 *■']L5 , 4. 18 + 1062 - 2 4* I 4. 6 * 9 * 4.64 - 2 -• 3 - I .-.2 - . 255 - I ■ O I ” 5 - 1066 - .6 - 8 7 - 9 — 1457 - 2 O 0 0 T 267 - 3 - 5 - 7 - 12 - 1156 ♦ I 4 . 2 t I 0 - 9.66 - 6 - 8 7 - 12 — 1458 0 > 2 2 . -o- 5- 4- 5.68 0 t I 6 * , 8 * 5Dial . Gage #1 *15.0 *30.0 *45,0 *60.0 *60.0DialGage #2 -15.0 .. . “26,4 ”4(X O , -55.0 . -56,0.
.P , Dial Oage readings are in thousandths, of an inch with plus indicating a downward deflection,
^ Minus proceeding the ptrain, readings indicates compression and plus Indicates tension.
^ The two identical:lh'a?d oolumns representseparate loading. ,The first belongs with the increment1 loads, the second was loaded all at once.

LITERATURE CITED AND CONSULTED
Candela, Felix, Market Project, Bandshell," Architectural JJsium,, .January 1957,. pp. ..i52~34.
Candela, Felix,^Structural Applications of Hyperbolic ParaboloIdical Shells, Journal of. the .American Concrete institute. January 1955," pp. .397-415.
Elementary Analysis - of Hyperbolic Paraboloid Concrete Shells. Portland'Cemehf Association. 1958.
Elementary Analysis of Hyperbolic Paraboloid Shells,11 Reinforced, Concrete. Portland Cement Association,1960, \
Hyperbolic Paraboloid .and .Other Shells,11 American Society of Civil Engineers Proceedings, 82(ST 5 no, 1057) September 1956,. pp, 1-32.
Levy, Matthys P,,. 11 Thip Shells: Some Basic References forArchitects and Engineers,H- Architectural Record.June 1959, pp. 22#-25.
Parme, A., "Shells of Double Curvature, "• American Society of Civil Engineer^ Transactions, v. 1.23,'1958, pp,989- 1013.
Proceedings ..of a .Conference on Thin Concrete Shells. .'.... June 21 to 23,"19.54 at Massachusetts Institute of
Technology,"Shfll Concrete for.Spanning'Large Areas, Architectural
Forum; December 1949, pp. 1.01-6,

MONTANA STATE UNIVERSITY LIBRARIES
762 1001115102 4
N378 N848e cop .2 144881
Nottingham, DennisExperimental testing of afcvpg h vp<a t* r*
2-3,LA. s-z.y
WPPEC 840 -f*izn-A. <2o*>j±'
mFii-FeT <4 it S 4 c
M /JWl fa%4R2rZ - L -^lTvf- . //
/V 8 48flop' A-
144881/W.