experimentalstudieson eects of dieton lawsonia … · 2018-04-12 · visscher et al. acta vet scand...
TRANSCRIPT

Visscher et al. Acta Vet Scand (2018) 60:22 https://doi.org/10.1186/s13028-018-0378-4
RESEARCH
Experimental studies on effects of diet on Lawsonia intracellularis infections in fattening boars in a natural infection modelChristian Visscher1* , Anne Kruse1, Saara Sander1, Christoph Keller2, Jasmin Mischok1, Robert Tabeling3, Hubert Henne4, Ricarda Deitmer5 and Josef Kamphues1
Abstract
Background: Lawsonia intracellularis is one of the most economically important pathogens in swine production. This study tested the hypothesis that the composition of diets for pigs has an impact on the excretion of L. intracellularis in a natural infection model.
Results: Fifty boars (~ 90 kg BW) from a SPF-farm with a strict hygiene and management regime for reducing the spread of an L. intracellularis infection up to the beginning of the final fattening period were transported, regrouped and randomly allotted to groups of five animals each at the research facility. After a 1-week acclimatisation period groups were fed one of five diets 4 weeks before slaughter. These were either a finely ground pelleted diet (FP) or a coarsely ground meal diet (CM), both consisting of wheat (40.0%), barley (39.3%), soybean meal (16.0%), soybean oil (2.0%) and minor components. In the other meal diets parts of wheat, barley and soybean meal were substi-tuted either with 22% cracked corn (CORN), 16.9% dried whey (WHEY) or 30% raw potato starch (RPS). The animals had a comparable serological status in a blocking-ELISA immediately before the start and at the end of the feeding experiment. Values increased significantly during the trial. In all subgroups (FP/CM/CORN/WHEY/RPS), shedding was detected in week 0 (genome equivalents = GE; log10 GE L. intracellularis/g faeces: 2.46 ± 2.64/3.58 ± 2.54/3.43 ± 2.37/2.30 ± 3.16/2.58 ± 2.73). The average number of L. intracellularis microbes in faeces during the trial period did not differ between the groups (log10 GE L. intracellularis/g faeces: 3.40 ± 1.53/3.01 ± 1.41/3.80 ± 1.71/3.98 ± 2.20/4.08 ± 2.13). In animals fed the WHEY-diet, significantly lower counts of L. intracellularis were found in the caecal content. The acetate content in the caecum was negatively correlated with the serological results at the end of the trial (r = − 0.36; P = 0.010). Butyrate concentrations in the caecal content were negatively correlated with the number of L. intracellula-ris in the caecum (r = − 0.32; P = 0.023).
Conclusion: Therefore, this study provides preliminary evidence that there might be specific dietary effects on the course of a L. intracellularis infection.
Keywords: Boar, Diet, Infection, Lawsonia intracellularis, Whey
© The Author(s) 2018. This article is distributed under the terms of the Creative Commons Attribution 4.0 International License (http://creativecommons.org/licenses/by/4.0/), which permits unrestricted use, distribution, and reproduction in any medium, provided you give appropriate credit to the original author(s) and the source, provide a link to the Creative Commons license, and indicate if changes were made. The Creative Commons Public Domain Dedication waiver (http://creativecommons.org/publicdomain/zero/1.0/) applies to the data made available in this article, unless otherwise stated.
BackgroundThe infection with Lawsonia intracellularis is a disease present in all pig-producing countries regardless of hus-bandry systems [1–7]. In a Europe-wide study, a total of 93% of all surveyed fattening units and 97% of all
breeding farms were positive for L. intracellularis. For Germany, an even higher prevalence was achieved. About 94% of all fattening farms and 99% of the breeding units investigated had been in contact with the pathogen [8].
The degree of severity of the clinical symptoms is reflected by the level of excretion of L. intracellula-ris in faeces [9]. Increasing pathogen concentrations in faeces are significantly associated with significantly reduced daily weight gains [5]. Excretion of only very few
Open Access
Acta Veterinaria Scandinavica
*Correspondence: [email protected] 1 Institute for Animal Nutrition, University of Veterinary Medicine Hannover, Foundation, Bischofsholer Damm 15, 30173 Hanover, GermanyFull list of author information is available at the end of the article

Page 2 of 12Visscher et al. Acta Vet Scand (2018) 60:22
numbers of L. intracellularis does not seem to have any effects on daily weight gains [5]. However, the extent of this dependency was lower with increasing dry matter (DM) content in faeces [5]. An increase in one log level concerning numbers of L. intracellularis in faeces means the probability of that pig having a lower growth rate by a factor of 1.97 [6]. Especially when more than 106 patho-gens per gramme of faeces were detected, this was also a significant risk factor for a lower body weight gain [6].
So far, only two main dietary factors have been investi-gated more systematically depending on the course of an L. intracellularis infection: on the one hand, the effect of packaging (meal versus pellets or crumbles), on the other hand the possible effects of lactic acid-rich diets. On the basis of a survey conducted on 79 Danish pig farms, a reduced in-herd prevalence of L. intracellularis was asso-ciated with home-mixed and (or) non-pelleted diets [10]. On farms using commercially prepared pelleted diets the prevalence was higher [10]. Therefore, an indirect influence of diet on L. intracellularis colonisation would appear possible. This has already been reported in pigs [11, 12] as well as in hamsters [13]. A relative reduction in the numbers of L. intracellularis in the total ileal micro-biota of pigs fed a non-pelleted diet could be shown [11]. Overall, an effect of diet on the course of an experimental L. intracellularis infection was found [12]. Reproducing the effects with a ‘home-mixed diet’ (coarsely ground, non-pelleted diet) following experimental infection with L. intracellularis failed [12]. Feeding a fermented liquid diet (rich in lactic acid) to pigs following experimental infection with L. intracellularis delayed the excretion of the organism [12]. Offering a standard diet in the same study (based on wheat, barley and soybean meal) sup-plemented with 2.4% lactic acid led to limited pathologi-cal lesions in pigs. Examination was done 28 days after inoculation [12].
The present study was based on the hypothesis that both, the packaging and the potential of a diet to foster the concentrations of specific fermentation products (lactic acid, butyrate) specifically minimise the effects of L. intracellularis infections in pigs. A natural infection model was used because it simulates the conditions in practice more than an experimental infection approach. Transport and regrouping of subclinically infected indi-viduals from a high health herd was the starting point for the model. This was intended to simulate the phenom-enon observed under natural conditions [14]; namely, the spread of infection after transporting animals from a high health herd to other herds. This is the first study testing five diets differing in terms of the nature of the ingredi-ents in a natural L. intracellularis infection model in fat-tening boars in the final finishing phase.
MethodsThe study consisted of three stages of sampling, which require an explanation regarding classification in accord-ance with the German Animal Protection Act or the Council Regulation (EC) No 1099/2009 on the protection of animals at the time of slaughter.
First, serological results from routine examinations of organ samples of boars (L. intracellularis serostatus of boars) previously carried out on the supplier farm for boars were provided by the corresponding field veterinar-ian prior to the trial. The sampling was thus not subject to an approval in accordance with the Animal Protection Act.
Second, before starting the experiments, the feeding trial itself was examined routinely by the Animal Welfare Officer of the University of Veterinary Medicine, Han-nover, Foundation, Hanover, Germany. This evaluation categorically stated, that the study was not based on an animal experiment requiring notification or approval in accordance with the Animal Protection Act.
Third, at the end of the trial, the animals were anaes-thetised using a new method. This method required notification and approval from the relevant authority (exemption: file 32.22.2, Department of Law and Order, state capital of Hanover). The slaughtering process took place at the abattoir in Hannover. The pigs were subse-quently killed by bleeding after finishing the trial.
Natural infection model, animals and housingFifty boars from a specific pathogen-free (SPF) pig fat-tening unit were chosen for the experiments. The animals were selected at a specific date. At ~ 90 kg body weight (BW) at the farm, already 50% of the animals had been serologically positive for the pathogen in the blocking ELISA (PI value ≥ 30) in the past. This was also the case in the experiment. At this time, it can be assumed that an intensive pathogen exchange can be expected within the following few weeks. In particular, if transport and regrouping additionally take place. Under these circum-stances, it can be assumed that the pathogen excretion is high, especially if the herd of origin has a high health sta-tus and the infection occurs late [14].
The animals were transported to the Institute for Animal Nutrition, University of Veterinary Medicine Hannover.
The 50 boars from the German Federal Breeding Pro-gramme were genetically defined animals of five lines with regard to inheritance factors for androstenone and skatole. Groups of five boars each were newly formed, with one representative of each genetic line per group. The boars were kept in groups of five animals each (Table 1) in 2 × 3 m boxes with solid floors. Each box
Page 3 of 12Visscher et al. Acta Vet Scand (2018) 60:22
had two feeding troughs, each 1 m in length. Chains and playing balls were offered as environmental enrichment material. Covered metal pits, each 20 cm wide, were placed at the back of the boxes.
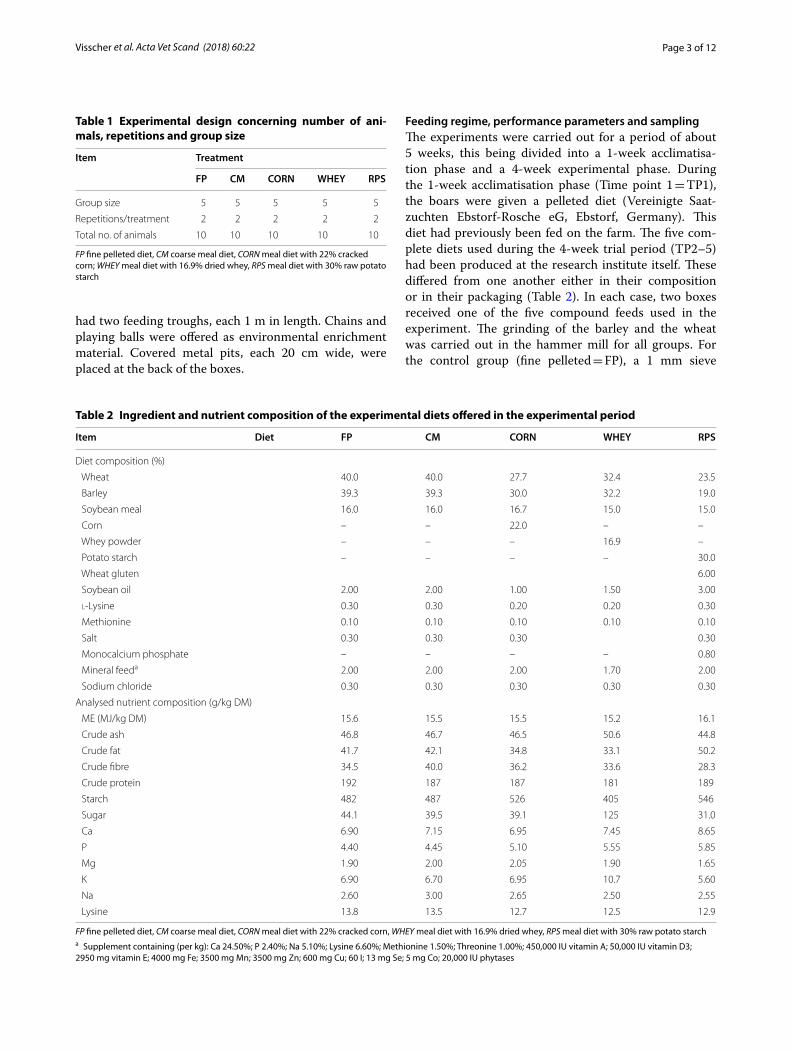
Feeding regime, performance parameters and samplingThe experiments were carried out for a period of about 5 weeks, this being divided into a 1-week acclimatisa-tion phase and a 4-week experimental phase. During the 1-week acclimatisation phase (Time point 1 = TP1), the boars were given a pelleted diet (Vereinigte Saat-zuchten Ebstorf-Rosche eG, Ebstorf, Germany). This diet had previously been fed on the farm. The five com-plete diets used during the 4-week trial period (TP2–5) had been produced at the research institute itself. These differed from one another either in their composition or in their packaging (Table 2). In each case, two boxes received one of the five compound feeds used in the experiment. The grinding of the barley and the wheat was carried out in the hammer mill for all groups. For the control group (fine pelleted = FP), a 1 mm sieve
Table 1 Experimental design concerning number of ani-mals, repetitions and group size
FP fine pelleted diet, CM coarse meal diet, CORN meal diet with 22% cracked corn; WHEY meal diet with 16.9% dried whey, RPS meal diet with 30% raw potato starch
Item Treatment
FP CM CORN WHEY RPS
Group size 5 5 5 5 5
Repetitions/treatment 2 2 2 2 2
Total no. of animals 10 10 10 10 10
Table 2 Ingredient and nutrient composition of the experimental diets offered in the experimental period
FP fine pelleted diet, CM coarse meal diet, CORN meal diet with 22% cracked corn, WHEY meal diet with 16.9% dried whey, RPS meal diet with 30% raw potato starcha Supplement containing (per kg): Ca 24.50%; P 2.40%; Na 5.10%; Lysine 6.60%; Methionine 1.50%; Threonine 1.00%; 450,000 IU vitamin A; 50,000 IU vitamin D3; 2950 mg vitamin E; 4000 mg Fe; 3500 mg Mn; 3500 mg Zn; 600 mg Cu; 60 I; 13 mg Se; 5 mg Co; 20,000 IU phytases
Item Diet FP CM CORN WHEY RPS
Diet composition (%)
Wheat 40.0 40.0 27.7 32.4 23.5
Barley 39.3 39.3 30.0 32.2 19.0
Soybean meal 16.0 16.0 16.7 15.0 15.0
Corn – – 22.0 – –
Whey powder – – – 16.9 –
Potato starch – – – – 30.0
Wheat gluten 6.00
Soybean oil 2.00 2.00 1.00 1.50 3.00
l-Lysine 0.30 0.30 0.20 0.20 0.30
Methionine 0.10 0.10 0.10 0.10 0.10
Salt 0.30 0.30 0.30 0.30
Monocalcium phosphate – – – – 0.80
Mineral feeda 2.00 2.00 2.00 1.70 2.00
Sodium chloride 0.30 0.30 0.30 0.30 0.30
Analysed nutrient composition (g/kg DM)
ME (MJ/kg DM) 15.6 15.5 15.5 15.2 16.1
Crude ash 46.8 46.7 46.5 50.6 44.8
Crude fat 41.7 42.1 34.8 33.1 50.2
Crude fibre 34.5 40.0 36.2 33.6 28.3
Crude protein 192 187 187 181 189
Starch 482 487 526 405 546
Sugar 44.1 39.5 39.1 125 31.0
Ca 6.90 7.15 6.95 7.45 8.65
P 4.40 4.45 5.10 5.55 5.85
Mg 1.90 2.00 2.05 1.90 1.65
K 6.90 6.70 6.95 10.7 5.60
Na 2.60 3.00 2.65 2.50 2.55
Lysine 13.8 13.5 12.7 12.5 12.9

Page 4 of 12Visscher et al. Acta Vet Scand (2018) 60:22
insert was used, whereas for the other groups either a 6 mm sieve insert (coarse meal = CM) or a 3 mm sieve insert (corn = CORN, whey = WHEY and raw potato starch = RPS) was selected for preparing the diet. Fur-ther processing (pelleting) was done for the control group (FP). All other groups received the diet in meal form ad libitum. The amounts of feed consumed were recorded on a daily basis. Quantification was done at group level (n = five animals/group). The animals always had free access to drinking water.
Body weight of finishing boars was measured individu-ally on the day of delivery as well as at the start and at the end of the four-week trial period with a pair of mobile scales (WA 200, Meier-Brackenberg GmbH & Co. KG, Exterlal, Germany). Body weight gain and feed intake on group basis were used to calculate the feed conversion ratio (FCR) per kg gain.
Once a week, samples from all individual animals were collected during defaecation or directly from the rec-tum. One part of the sample was used for analysis (DM), another part being frozen for further analyses (volatile fatty acids, L. intracellularis qPCR).
At the end of the 4-week experimental period (TP6), the animals were killed in a mobile chamber by means of a CO2:N fumigation (30:70) at the abattoir in Hano-ver. The slaughtering process was done in small groups. In each group, genetic lineage and feeding variants were equally represented. On the morning before the dissec-tion all the boars were given their respective experimen-tal diets. In order to avoid unnecessary stress for the animals, only those boars were loaded and transported to the abattoir, which were also going to be killed directly afterwards in the chamber.
During the bleeding, blood samples were taken. After the evisceration by the abattoir personnel, the caecum was ligated before at the base of the caecum with a dou-ble ligature. Subsequently, the organ was separated with a pair of scissors and removed. The tip of the caecum was opened. The entire contents were collected and cooled until storage for further processing. For the histological examination, a piece tissue from the intestinal wall (about 3 × 2 cm in size) was taken of each boar in the vicinity of the appendix of the caecum. Care was taken to save the taenia-area. The samples obtained from the caecum wall were clamped on cork plates with needles. Afterwards, tissue was transferred to a cup filled with 10% formalin. After a fixation time of about 24 h, the tissue samples were further processed.
Analytical methodsDiets were analysed by standard procedures in accord-ance with the official methods of the VDLUFA [15]. The
dry matter content (DM) was determined by drying to the weight constancy at 103 °C. The raw ash was ana-lysed by means of incineration in the muffle furnace at 600 °C for 6 h. Determining the crude protein content was done by analysing the total nitrogen content using the catalytic tube combustion method (DUMAS combus-tion method; Vario Max®, Elementar, Hanau, Germany). The crude fat content was determined after acid diges-tion in the soxhlet apparatus. The content of crude fibre was determined after washing in dilute acids and alkalis. Starch determination was carried out polarimetrically (Polatronic E, Schmidt und Haensch GmbH & Co., Ber-lin, Germany). The sugar content was analysed using the Luff-Schoorl method by titration with sodium thiosul-phate. The mineral content was determined by atomic absorption spectrometry (Unicam Solaar 116, Thermo, Dreieich, Germany). Amino acids were determined by ion-exchange chromatography (AA analyser LC 3000, Biotronic, Maintal, Germany). The content of volatile fatty acids in the homogenised caecal chyme was meas-ured by means of a gas chromatograph (610 Series, Uni-cam, Kassel, Germany). After the sample had been mixed with an internal standard (10 mL of formic acid 89% and 0.1 mL of 4-methylvaleric acid), the mixture was centri-fuged and then subjected to gas chromatography with a column temperature of 155 °C (injector: 175 °C, detector: 180 °C).
The serological tests were carried out using a sand-wich blocking ELISA [16]. This ELISA has a specificity of 98.7% and a sensitivity of 96.5% and works with specific monoclonal antibodies. Cut-off values for the blocking ELISA test are given as percent inhibition (PI) with a cut-off value of PI 30.
The mean L. intracellularis content was determined from the aliquot of the homogenised faeces via quanti-tative PCR using established methods [17]. Results are given in genome equivalents (GE) per gramme faeces.
For histopathological analysis, the fixed tissue speci-mens were processed by routine methods, embed-ded into paraffin, and sectioned at 2 μm; three series (with three cuts per series) with a minimum distance of 25 μm were prepared and fixed on microscope slides (Superfrost® plus, Menzel GmbH & Co. KG, Brunswick, Germany) per block.
To measure the crypt depth of the caecal epithelium, a hematoxylin–eosin (HE) staining was performed in accordance with a standard protocol (two tissue sections per animal with a minimum separation of 50 μm). For each boar, these two HE stained sections were examined with regard to the crypt depth of the caecal epithelium. The measurement was carried out with a photomicro-scope (Axiophot, Zeiss, Oberkochen, Germany) and the

Page 5 of 12Visscher et al. Acta Vet Scand (2018) 60:22
program analysisSIS® 3.0 (Soft Imaging Systems, Mün-ster, Germany). For each slide, ten completely cut crypts were measured from their base to the opening to the intestinal lumen.
Statistical analysesThe statistical analyses were performed using the Statisti-cal Analysis System for Windows SAS®, version 9.3, (SAS Institute Inc., Cary, North Carolina, USA). The group comparison for performance parameters (BW, ADWG), results of serological analyses (PI values), quantitative detection of L. intracellularis in faeces and caecal con-tent, DM content in faeces, short chain fatty acids in caecal content and crypt depth of caecal wall were per-formed by a one-way analysis of variance (ANOVA) for independent samples. The Ryan-Einot-Gabriel-Welsch multiple range test was used for the multiple pairwise means comparisons. The distributions of the residuals from the linear models belonging to the analyses of vari-ance were close to the normal one.
In the case of non-normalised data, overall differences in parameters between groups were assessed by the Kruskal–Wallis equality of populations rank test followed by comparisons with a Wilcoxon signed-rank test. The latter was carried out in pairs to investigate differences in the mean values. The transition from the comparative to the experimental-related error probability was achieved by the so-called “α-adjustment” according to Bonferroni.
Differences in concentration between L. intracellula-ris counts at different time points depending on group as well as differences between DM content in faeces between groups were examined by means of one-way analyses of variance for repeated measures.
For the correlation-analysis of data with normal distri-bution, the correlation coefficient of Pearson was used. In non-normally distributed residuals the Spearman`s rank correlation coefficient was calculated.
All statements of statistical significance were based upon P values smaller than 0.05. This approach controls the comparison-wise error rate.
ResultsThe experiment ran as planned. There were no animal losses. Changes in faecal consistency, which were asso-ciated with the detection of L. intracellularis, were not treated with antibiotics due to the short duration of the clinical manifestation.
The experimental diets could be regarded as almost isoenergetic (15.6 ± 0.33 MJ ME/kg DM) and isonitrog-enous (187 ± 4.02 g/kg DM). The lysine contents were comparable (13.1 ± 0.55 g/kg DM) as intended when for-mulating the diets (Table 2).
Performance parametersOverall, there were no significant differences in the final body weight (Ø at group level: 134 ± 3.42 kg), or in the weight development between the groups (Ø at group level: 1227 ± 82.8 g/day; (Table 3). In numerical terms, the performance in the RPS group was the low-est (1104 ± 336 g/day). If, however, independent of the diet, the mean L. intracellularis excretion by category during the experimental period showed numerical differ-ences in terms of performance. Animals with an excre-tion greater than 5 × log10 GE/g faeces had a numerically lower ADWG (log10 GE/g faeces < 4: 1.246 kg ADWG; log10 GE/g faeces ≥ 4 < 5: 1.252 kg ADWG; log10 GE/g faeces ≥ 5 < 6: 1.150 kg ADWG; log10 GE/g faeces ≥ 6: 1.147 kg ADWG).
Blood analysisThe PI values before the start of the experiment (Ø PI values at group level: 29.8 ± 2.77; 50% of animals with PI values ≥ 30) and at the time of slaughter (Ø PI values at group level: 55.5 ± 3.59) did not differ between groups
Table 3 Body weight, average daily weight gain and feed conversion ratio in finishing boars (n = 10/treatment) fed diets with different compositions during the 4-week trial period
FP fine pelleted diet, CM coarse meal diet, CORN meal diet with 22% cracked corn, WHEY meal diet with 16.9% dried whey, RPS meal diet with 30% raw potato starch, ADWG average daily weight gain, FCR feed conversion ratio in kg diet per kg weight gain, Ø abbreviation for mean value, TP1 time point 1 (start), TP2 (week 1), TP3 (week 2), TP4 (week 3), TP5 (week 4), TP6 (slaughter)a 30 days later; no significant differences between values in a row detectable at P < 0.05
Item Time Treatment
FP CM CORN WHEY RPS
Mean SD Mean SD Mean SD Mean SD Mean SD
Body weight (kg) TP1 (start) 98.7 6.97 97.0 6.85 99.1 6.77 97.0 7.77 96.1 8.12
TP6 (final)a 138 13.7 135 8.22 136 7.48 133 10.1 129 13.1
ADWG (kg) Ø TP2–5 (week 1–4) 1.326 0.272 1.273 0.161 1.225 0.164 1.208 0.250 1.104 0.336
ADFI (kg DM) Ø TP2–5 (week 1–4) 3084 3217 3242 3261 2861
FCR (kg/kg) Ø TP2–5 (week 1–4) 2.64 2.87 2.93 2.94 2.94
Page 6 of 12Visscher et al. Acta Vet Scand (2018) 60:22
at each time point. There was a significant increase in each single group between PI values from the start of the experiment to slaughter (Table 4). The comparison of delta values in PI values between the start and end-points of the different groups showed no differences.
Faecal analysisThe excretion of L. intracellularis with the faeces did not differ between the groups at the different time points, nor did the mean excretion in the experimental period. The difference between the mean excretion in the experimental period (TP2–5) and the initial value (TP1) was positive with the exception of group CM. Group CM, however, showed the highest numbers of L. intracellularis in faeces at time TP1 in numerical terms. Within some of the groups (FP, CM, RPS), significant differences were seen as a function of time. In the FP group, the most significant excretion was found for TP3 (4.32 ± 3.16 log10 GE/g) and TP5 (4.55 ± 3.33 log10 GE/g). In group CM, on the other hand, the excretion at TP3 was the lowest (0.59 ± 1.87 log10 GE/g), and the highest at TP4 (5.83 ± 2.36 log10 GE/g). In group RPS, a signifi-cantly higher excretion with faeces was observed at the end of the trial phase (TP4 7.25 ± 1.44 log10 GE/g; TP5 5.46 ± 3.85 log10 GE/g).
The DM content in the faeces of the boars did not dif-fer at the beginning of the experiment (Ø DM content at group level: 236 ± 16.8 g/kg). At TP2 in groups WHEY and RPS, at TP3 (numerically), TP4 and TP5, the DM content in group RPS was the lowest, whereas at TP2, TP4 and TP5, the DM content in the control group (FP) was highest. When comparing the average DM con-tent during the experimental period (TP2–5), group FP showed the highest DM content in faeces, group RPS the lowest (P < 0.001). Depending on the time, there were no significant differences within each group.
Caecal contentIn the groups CORN and RPS, the L. intracellularis genome equivalents were significantly highest (Table 4). In the WHEY group, numbers of L. intracellularis in the caecal content were the lowest. The butyrate concen-tration in the caecal content was the largest in the RPS group, the lowest in the CORN group. In the RPS group the crypt depths were significantly highest.
CorrelationsVery strong negative correlations (r = correlation coef-ficient) occurred between the PI TP1 and the PI Δ TP1 to TP6 (r = − 0.90, P < 0.001) as well as between the log10 GE TP1 and the Δ log10 GE TP2–5 − TP1 (r = − 0.85, P < 0.001; Table 5). A strong positive correlation occurred
between the log GE at TP5 and the log GE in the caecum content (r = 0.66, P < 0.001).
In terms of L. intracellularis status in faeces, there were significances between DM at TP1 and crypt depth in the caecum (r = − 0.40, P = 0.006), as well as between the log GE in the caecal content and the butyrate concentration at this location (r = − 0.32, P = 0.023). These correlations were moderate (DM) and weak (butyrate).
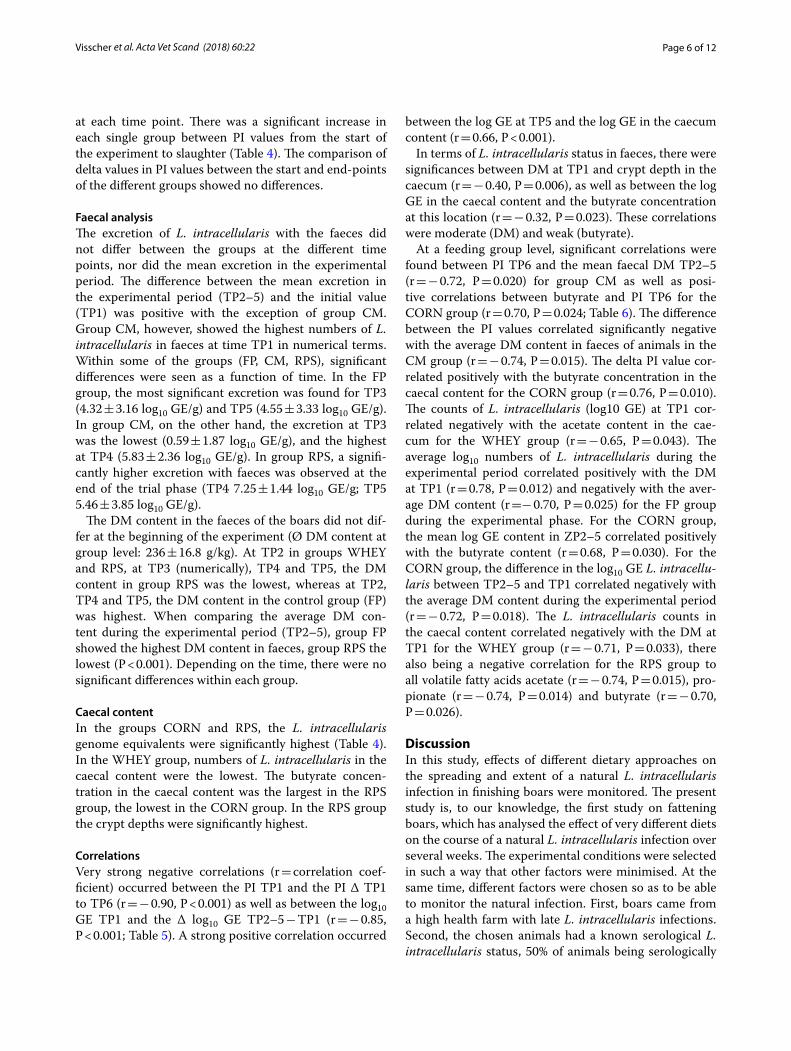
At a feeding group level, significant correlations were found between PI TP6 and the mean faecal DM TP2–5 (r = − 0.72, P = 0.020) for group CM as well as posi-tive correlations between butyrate and PI TP6 for the CORN group (r = 0.70, P = 0.024; Table 6). The difference between the PI values correlated significantly negative with the average DM content in faeces of animals in the CM group (r = − 0.74, P = 0.015). The delta PI value cor-related positively with the butyrate concentration in the caecal content for the CORN group (r = 0.76, P = 0.010). The counts of L. intracellularis (log10 GE) at TP1 cor-related negatively with the acetate content in the cae-cum for the WHEY group (r = − 0.65, P = 0.043). The average log10 numbers of L. intracellularis during the experimental period correlated positively with the DM at TP1 (r = 0.78, P = 0.012) and negatively with the aver-age DM content (r =− 0.70, P = 0.025) for the FP group during the experimental phase. For the CORN group, the mean log GE content in ZP2–5 correlated positively with the butyrate content (r = 0.68, P = 0.030). For the CORN group, the difference in the log10 GE L. intracellu-laris between TP2–5 and TP1 correlated negatively with the average DM content during the experimental period (r = − 0.72, P = 0.018). The L. intracellularis counts in the caecal content correlated negatively with the DM at TP1 for the WHEY group (r = − 0.71, P = 0.033), there also being a negative correlation for the RPS group to all volatile fatty acids acetate (r = − 0.74, P = 0.015), pro-pionate (r = − 0.74, P = 0.014) and butyrate (r = − 0.70, P = 0.026).
DiscussionIn this study, effects of different dietary approaches on the spreading and extent of a natural L. intracellularis infection in finishing boars were monitored. The present study is, to our knowledge, the first study on fattening boars, which has analysed the effect of very different diets on the course of a natural L. intracellularis infection over several weeks. The experimental conditions were selected in such a way that other factors were minimised. At the same time, different factors were chosen so as to be able to monitor the natural infection. First, boars came from a high health farm with late L. intracellularis infections. Second, the chosen animals had a known serological L. intracellularis status, 50% of animals being serologically

Page 7 of 12Visscher et al. Acta Vet Scand (2018) 60:22
Tab
le 4
Res
ult
s o
f se
rolo
gic
al in
vest
igat
ion
s, a
nal
yses
in f
aece
s (q
PC
R L
awso
nia
intr
acel
lula
ris
and
DM
) as
wel
l as
cou
nts
of
L. in
trac
ellu
lari
s an
d c
on
cen
trat
ion
s o
f sh
ort
ch
ain
fatt
y ac
ids
in c
aeca
l co
nte
nt a
nd
cec
al c
ryp
t dep
th in
gro
up
s o
f fin
ish
ing
bo
ars
(n =
10/
trea
tmen
t) fe
d d
iets
wit
h d
iffer
ent c
om
po
siti
on
s
Up
per
cas
e le
tter
s (A
, B) s
igni
fy d
iffer
ence
s in
col
umns
(ver
tical
) on
the
leve
l of a
sp
ecifi
c fe
edin
g gr
oup
bet
wee
n TP
s (b
etw
een
TP1
and
TP6
for “
PI v
alue
s b
lock
ing
ELIS
A”; b
etw
een
TP1–
5 fo
r “lo
g 10 G
E L.
intr
acel
lula
ris”,
bet
wee
n TP
1–5
for “
DM
con
tent
”) d
epen
ding
on
time
poi
nt a
t P <
0.0
5
Low
er c
ase
lett
ers
(a, b
, c) s
igni
fy d
iffer
ence
s in
a ro
w (h
oriz
onta
l) b
etw
een
feed
ing
grou
ps
on p
aram
eter
and
TP-
leve
l at P
< 0
.05
FP fi
ne p
elle
ted
diet
, CM
coa
rse
mea
l die
t, CO
RN m
eal d
iet w
ith 2
2% c
rack
ed c
orn,
WH
EY m
eal d
iet w
ith 1
6.9%
drie
d w
hey,
RPS
mea
l die
t with
30%
raw
pot
ato
star
ch, Ø
ab
bre
viat
ion
for m
ean
valu
e, T
P1 ti
me
poi
nt 1
(sta
rt);
TP2
(wee
k 1)
, TP3
(wee
k 2)
, TP4
(wee
k 3)
, TP5
(wee
k 4)
, TP6
(sla
ught
er),
PI p
erce
nt in
hib
ition
, cut
-off
val
ues
for t
he b
lock
ing
ELIS
A te
st w
ith a
cut
-off
val
ue o
f PI 3
0, G
E ge
nom
e eq
uiva
lent
s p
er g
ram
me
faec
es, † 30
day
s la
ter
Item
Tim
eTr
eatm
ent
FP M
ean
SDC
M M
ean
SDCO
RN M
ean
SDW
HEY
Mea
nSD
RPS
Mea
nSD
Bloo
d
PI v
alue
s bl
ocki
ng E
LISA
TP1
(sta
rt)
31.0
B12
.930
.5B
16.9
25.5
B13
.129
.0B
14.7
32.9
B14
.6
TP6
(fina
l)53
.7A
10.3
50.1
A10
.357
.9A
4.84
57.3
A3.
9258
.7A
7.15
Δ T
P1 to
TP6
†22
.718
.919
.623
.332
.414
.228
.316
.225
.817
.6
Faec
es
log 10
GE
L. in
trac
ellu
laris
(per
g)
TP1
(sta
rt)
2.46
AB
2.64
3.58
AB
2.54
3.43
2.37
2.30
3.16
2.58
B2.
73
TP2
(wee
k 1)
1.08
B2.
321.
54BC
2.48
2.52
2.68
3.75
3.51
1.90
B2.
46
TP3
(wee
k 2)
4.32
A3.
160.
59C
1.87
3.06
3.32
4.11
2.99
2.45
B3.
33
TP4
(wee
k 3)
3.64
AB
3.23
5.83
A2.
365.
063.
095.
053.
287.
25A
1.44
TP5
(wee
k 4)
4.55
A3.
334.
27A
3.35
4.98
3.42
3.11
3.37
5.46
A3.
85
Ø T
P2–5
(wee
ks 1
–4)
3.40
3.23
3.03
3.25
3.78
3.19
3.95
3.23
4.08
3.59
∆ (Ø
TP2
–5−
TP1)
0.93
3.14
− 0
.57
3.30
0.38
2.65
1.68
3.58
1.51
3.80
DM
con
tent
(g/k
g)TP
1 (s
tart
)23
778
.924
724
.725
428
.824
884
.724
029
.1
TP2
(wee
k 1)
273a
40.9
248bc
10.1
266ab
24.8
241c
19.9
238c
32.1
TP3
(wee
k 2)
259
84.7
238
18.0
257
97.7
245
16.7
214
18.1
TP4
(wee
k 3)
274a
49.2
249ab
24.0
246ab
17.9
241ab
16.8
226b
55.4
TP5
(wee
k 4)
268a
27.4
245ab
17.7
263a
24.6
245ab
17.5
222b
25.9
Ø T
P2–5
(wee
ks 1
–4)
269a
53.0
245bc
17.9
258ab
51.1
624
3bc17
.222
5c35
.4
Caec
al c
onte
nt o
r rat
her c
aeca
l wal
l
log 10
GE
L. in
trac
ellu
laris
(per
g)
TP6
4.34
ab3.
835.
46a
3.03
5.16
ab3.
631.
57b
3.32
5.82
a3.
51
Star
ch g
/kg
DM
)TP
641
.4b
7.97
164a
35.4
136a
40.6
85.1
b22
.417
9a11
0
Ace
tate
(mm
ol/k
g FM
)TP
614
86.
6414
58.
0713
114
.414
36.
9013
627
.1
Prop
iona
te (m
mol
/kg
FM)
TP6
50.5
3.98
53.8
5.82
51.0
3.03
49.4
2.80
48.6
9.28
Buty
rate
(mm
ol/k
g FM
)TP
620
.3b
3.32
24.8
b3.
8321
.2b
8.38
24.4
b6.
0933
.7a
9.53
Cry
pt d
epth
cae
cum
(μm
)TP
648
2b57
.547
3b50
.049
9b10
647
5b66
.057
0a18
9

Page 8 of 12Visscher et al. Acta Vet Scand (2018) 60:22
positive in blocking ELISA at the time of transport and regrouping. Third, effects of transport and regroup-ing were used to provoke the spreading of the pathogen within new groups at the research facility.
Performance parametersIn the present study, no effect of diet on the performance parameters could be seen. If, however, independent of the diet, the mean L. intracellularis excretion by category during the experimental period showed numerical differ-ences in terms of performance. In literature, an effect on the ADWG was seen only for an excretion greater than 106 GE per gramme faeces [7]. However, these previous experiments were conducted with artificial L. intracellu-laris infection. Also, these animals were only 6 or 9 weeks old at the time of artificial infection. In another study on animals of similar age, an effect of the level of L. intra-cellularis excretion on the ADWG (P < 0.001) was shown [5]. The authors of the study emphasise, however, that this effect was particularly important with low DM con-tent in the faeces. In pigs with higher faecal DM (20%) the association between ADG and L. intracellularis was
minimal. In pigs with faecal DM above 25%, no effect on ADWG was reported [5].
In the experimental period of the present study, the group RPS showed the lowest average DM content in faeces (225 ± 35.4 g/kg). The correlation analysis showed only for the group RPS that the average L. intracellularis counts in faeces were significantly negatively correlated with ADWG (r = − 0.78). The present investigations thus confirm that the known relationship applies to RPS. The numerically lowest ADWG in the comparison between the feeding groups was associated with the numerically highest excretion in this group.
In the present study, a negative correlation was observed between the mean values of ADWG of the dif-ferent feeding groups and excretion levels of L. intracel-lularis between TP2 and TP5 (Spearman`s correlation coefficient: r = − 0.90; P = 0.038). At group average level a higher L. intracellularis excretion could be the reason for a lower performance. Nonetheless, also factors such as the palatability of the feed can provoke a different feed intake. Thus, this relation could also be a reason for the
Table 5 Crosstab regarding intercorrelations between Lawsonia intracellularis status, DM content in faeces, volatile fatty acid concentra-tions in caecal content and ADWG in finishing boars with natural L. intracellularis infection
Correla�on coefficienta
PI T
P1
PI T
P6
Δ PI
TP1
to T
P6
log 1
0 GE
L.i.
TP1
log 1
0 GE
L.i.
TP2
log 1
0 G
E L.
i. TP
3
log 1
0 G
E L.
i. TP
4
log 1
0 G
E L.
i. TP
5
Ø lo
g 10 G
E L.
i. TP
2–5
∆ lo
g 10 G
E L.
i. (Ø
TP2
–5 –
TP1)
DM T
P 1
Ø D
M T
P2–5
log 1
0 GE
L.i.
caec
um (T
P6)
Cryp
t dep
th
caec
um (T
P6)
Acet
ate
caec
um (T
P6)
Prop
iona
te
caec
um (T
P6)
Buty
rate
ca
ecum
(TP6
)
ADW
G (T
P2–6
)
P value
PI TP1 − 0.26 − 0.90 0.01 − 0.24 − 0.25 − 0.39 − 0.21 − 0.44 − 0.23 0.20 0.13 − 0.12 − 0.00 0.14 0.04 0.22 0.10
PI TP6 0.070 0.56 − 0.03 0.05 0.26 0.47 0.14 0.37 0.17 − 0.05 − 0.23 − 0.04 0.06 − 0.36 − 0.27 0.08 − 0.26
Δ PI TP1 to TP6 < .001 < .001 − 0.01 0.23 0.34 0.50 0.22 0.51 0.24 − 0.17 − 0.20 0.09 − 0.00 − 0.24 − 0.09 − 0.18 − 0.14
log10 GE L.i. TP1 0.932 0.8109 0.939 0.11 − 0.20 − 0.04 − 0.16 − 0.09 − 0.85 0.29 − 0.03 − 0.01 − 0.22 − 0.04 0.15 − 0.04 − 0.14
log10 GE L.i. TP2 0.099 0.742 0.110 0.450 0.12 0.15 0.19 0.54 0.13 0.14 − 0.12 0.04 0.11 − 0.23 − 0.07 − 0.03 − 0.13
log10 GE L.i. TP3 0.084 0.074 0.015 0.174 0.426 0.33 − 0.18 0.51 0.41 0.10 − 0.09 − 0.24 0.05 0.03 − 0.16 0.11 0.00
log10 GE L.i. TP4 0.007 0.001 < .001 0.770 0.328 0.022 0.39 0.72 0.38 0.07 − 0.34 0.19 0.19 − 0.06 − 0.11 0.11 − 0.05
log10 GE L.i. TP5 0.165 0.362 0.135 0.283 0.203 0.240 0.010 0.57 0.42 − 0.04 − 0.14 0.66 0.30 − 0.02 0.01 − 0.24 − 0.14
Ø log10 GE L.i. TP2–5 0.002 0.008 < .001 0.531 < .001 < .001 < .001 < .001 0.59 0.04 − 0.26 0.14 0.25 − 0.10 − 0.16 0.01 − 0.06
∆ log10 GE L.i. (Ø TP2–5 –TP1) 0.104 0.234 0.096 < .001 0.362 0.003 0.009 0.004 < .001 − 0.28 − 0.16 0.06 0.34 0.04 − 0.18 0.08 0.11
DM TP 1 0.182 0.740 0.251 0.048 0.358 0.523 0.671 0.803 0.778 0.058 − 0.08 − 0.06 − 0.40 0.01 0.14 0.14 0.00
Ø DM TP2–5 0.387 0.110 0.155 0.853 0.395 0.552 0.020 0.346 0.073 0.279 0.587 − 0.02 − 0.12 0.19 0.17 − 0.24 − 0.13
log10 GE L.i. caecum (TP6) 0.411 0.777 0.521 0.966 0.782 0.092 0.191 < .001 0.327 0.679 0.707 0.917 0.18 − 0.23 − 0.02 − 0.32 − 0.19
Crypt depth caecum (TP6) 0.991 0.669 0.981 0.118 0.441 0.731 0.200 0.041 0.081 0.015 0.006 0.407 0.214 − 0.05 0.04 0.06 0.16
Acetate caecum (TP6) 0.321 0.010 0.096 0.759 0.101 0.851 0.687 0.891 0.508 0.780 0.941 0.193 0.102 0.734 0.40 0.30 0.25
Propionate caecum (TP6) 0.802 0.057 0.545 0.289 0.647 0.260 0.443 0.926 0.257 0.215 0.353 0.244 0.880 0.787 0.004 − 0.03 0.04
Butyrate caecum (TP6) 0.133 0.589 0.217 0.807 0.859 0.450 0.478 0.115 0.924 0.560 0.353 0.089 0.023 0.681 0.034 0.829 − 0.03
ADWG (TP2–6) 0.499 0.069 0.371 0.318 0.352 0.995 0.724 0.370 0.673 0.437 0.981 0.351 0.194 0.282 0.083 0.790 0.838
Ø abbreviation for mean value, TP1 time point 1 (start); TP2 (week 1), TP3 (week 2), TP4 (week 3), TP5 (week 4), TP6 (slaughter), L.i. L. intracellularis, PI percent inhibition, cut-off values for the blocking ELISA test with a cut-off value of PI 30, r Correlation coefficient
P P value, statistical significance is based on P values smaller than 0.05 (italics)a Pearson correlation coefficients—for combination of parameters between grey boxes; Spearman’s rank correlation coefficients—combination of unshaded boxes); correlations: 0.00–0.19 “very weak”; 0.20–0.39 “weak”; 0.40–0.59 “moderate”; 0.60–0.79 “strong”; 0.80–1.0 “very strong”
Page 9 of 12Visscher et al. Acta Vet Scand (2018) 60:22
Table 6 Crosstab regarding intercorrelations between Lawsonia intracellularis status, DM content in faeces, volatile fatty acid concentra-tions in caecal content and ADWG in finishing boars with natural L. intracellularis infection
ItemItem DM TP1 Ø DM TP2–5 Acetate caecum
(TP6)Propionate
caecum (TP6)Butyrate
caecum (TP6)r P r P r P r P r P
PI TP1
FP − 0.28 0.460 0.35 0.322 − 0.41 0.241 − 0.06 0.803 0.50 0.138
CM 0.41 0.243 0.58 0.078 0.24 0.513 − 0.15 0.679 0.09 0.811CORN 0.01 0.977 0.47 0.171 − 0.29 0.418 0.08 0.829 − 0.57 0.085
WHEY 0.31 0.410 − 0.22 0.541 0.44 0.207 − 0.17 0.630 0.60 0.067
RPS 0.62 0.072 − 0.20 0.577 0.27 0.446 0.13 0.716 0.53 0.115
PI TP6
FP 0.11 0.773 − 0.32 0.362 − 0.17 0.637 − 0.32 0.366 − 0.36 0.310
CM − 0.21 0.552 − 0.72 0.020 − 0.24 0.506 − 0.11 0.760 − 0.31 0.377
CORN 0.08 0.832 0.31 0.378 − 0.42 0.225 − 0.13 0.716 0.70 0.024
WHEY − 0.22 0.576 0.12 0.751 − 0.21 0.556 0.09 0.803 − 0.02 0.960
RPS − 0.07 0.852 − 0.06 0.860 − 0.26 0.467 0.18 0.627 − 0.41 0.235
Δ PI TP1 to TP6
FP 0.25 0.512 − 0.41 0.234 0.19 0.607 − 0.15 0.676 − 0.48 0.162
CM − 0.39 0.265 − 0.74 0.015 − 0.28 0.440 0.06 0.869 − 0.20 0.577
CORN 0.02 0.964 − 0.33 0.358 0.12 0.736 − 0.12 0.746 0.76 0.010
WHEY − 0.34 0.366 0.14 0.693 − 0.46 0.179 0.12 0.737 − 0.56 0.089
RPS − 0.54 0.130 0.15 0.681 − 0.44 0.200 0.02 0.960 − 0.61 0.063
Log10 GE L.i. TP1
FP − 0.02 0.963 0.19 0.604 0.11 0.763 0.12 0.735 − 0.05 0.901
CM 0.19 0.599 − 0.52 0.122 0.25 0.483 0.28 0.440 − 0.06 0.880CORN 0.36 0.304 0.52 0.122 0.42 0.223 0.15 0.672 − 0.15 0.672
WHEY 0.57 0.112 − 0.27 0.457 − 0.65 0.043 − 0.14 0.693 0.17 0.637
RPS 0.31 0.416 − 0.17 0.630 − 0.05 0.901 0.01 0.986 − 0.06 0.873
Ø log10 GE L.i. TP2–5
FP 0.78 0.012 − 0.70 0.025 − 0.13 0.718 − 0.36 0.310 − 0.62 0.054
CM 0.05 0.892 − 0.06 0.873 0.15 0.675 − 0.12 0.747 0.04 0.916
CORN − 0.05 0.881 − 0.29 0.411 0.02 0.955 − 0.08 0.826 0.68 0.030
WHEY 0.01 0.982 − 0.33 0.358 − 0.27 0.455 − 0.01 0.979 − 0.11 0.761
RPS − 0.32 0.398 0.16 0.654 − 0.10 0.777 0.18 0.627 − 0.46 0.178
∆ log10 GE L.i. (Ø TP2–5−TP1)
FP 0.42 0.251 − 0.45 0.188 − 0.18 0.618 − 0.15 0.676 − 0.15 0.676
CM − 0.17 0.649 0.51 0.136 − 0.08 0.820 − 0.30 0.396 0.03 0.927
CORN − 0.40 0.252 − 0.72 0.018 − 0.16 0.652 − 0.38 0.278 0.38 0.277
WHEY − 0.47 0.202 0.02 0.947 0.53 0.115 0.12 0.751 − 0.14 0.706
RPS − 0.54 0.134 0.22 0.532 0.19 0.603 0.08 0.829 0.01 0.979
log10 GE L.i. caecum (TP6)
FP 0.53 0.146 0.09 0.810 − 0.22 0.544 − 0.11 0.757 − 0.31 0.389CM 0.01 0.973 0.21 0.555 − 0.26 0.477 0.12 0.738 − 0.60 0.066
CORN 0.52 0.122 0.33 0.359 0.15 0.684 0.46 0.186 − 0.27 0.445
WHEY − 0.71 0.033 0.07 0.849 − 0.24 0.500 0.03 0.924 − 0.59 0.074
RPS − 0.65 0.057 − 0.36 0.309 − 0.74 0.015 − 0.74 0.014 − 0.70 0.026
Crypt depth caecum (TP6)
FP 0.21 0.586 − 0.14 0.706 0.52 0.120 0.49 0.150 − 0.05 0.881
CM − 0.19 0.592 0.43 0.210 0.15 0.672 0.37 0.295 0.02 0.964
CORN − 0.30 0.405 − 0.21 0.556 − 0.53 0.117 0.22 0.533 0.20 0.580
WHEY − 0.46 0.208 − 0.14 0.702 0.47 0.167 − 0.13 0.729 0.16 0.665
RPS − 0.23 0.546 − 0.24 0.511 − 0.35 0.328 − 0.41 0.244 − 0.49 0.150
FP fine pelleted diet, CM coarse meal diet, CORN meal diet with 22% cracked corn, WHEY meal diet with 16.9% dried whey, RPS meal diet with 30% raw potato starch; TP1 time point 1 (start), TP2 (week 1), TP3 (week 2), TP4 (week 3), TP5 (week 4), TP 6 (slaughter); L.i. L. intracellularis, PI percent inhibition, cut-off values for the blocking ELISA test with a cut-off value of PI 30, r Correlation coefficient
P P value, statistical significance is based on P values smaller than 0.05 (italics)
Pearson correlation coefficients—grey boxes; Spearman’s rank correlation coefficients—unshaded boxes); correlations: 0.00–0.19 “very weak”; 0.20–0.39 “weak”; 0.40–0.59 “moderate”; 0.60–0.79 “strong”; 0.80–1.0 “very strong”

Page 10 of 12Visscher et al. Acta Vet Scand (2018) 60:22
numerically different weight development between the different feeding groups.
Dynamics of infection and dietThe results of the serological tests are clear in the pre-sent study. During the acclimatisation and experimental period, in each group an intense L. intracellularis spread within the animal group is to be assumed. In each feeding group, a significant increase in the serological response provided evidence of this confrontation with the patho-gen. It is known from the literature that the antibodies can fall off already 2 weeks after the excretion peak [9, 18]. This infers that our investigations took place in an intensive infection phase. Antibody titres were high at the end of the trial. This is the best prerequisite for test-ing a feeding concept in the field.
The haemorrhagic form of an L. intracellularis infec-tion is termed proliferative haemorrhagic enteropathy [14]. This form is commonly observed in replacement gilts and boars from high health herds that are intro-duced onto a new farm site [14]. In the present experi-ment, the boars had also been obtained from a high health herd. The farmer raised boars of defined genetics from a German breeding company. The animals were transferred to the research facilities and regrouped. In four animals, the acute form of L. intracellularis infection occurred during the experiment (divided into groups: 1×FP, 2×WHEY, 1×RPS). These animals showed numer-ically significant serological characteristics. The initial PI values were lower (20.2 ± 8.74). The final values tended to be higher (59.1 ± 6.69). The ΔPI values were more pro-nounced during the experiment (∆PI: 38.9 ± 7.39). The average excretion was higher in the experimental phase (TP2–5: 5.86 ± 3.45 log10 GE/g) and the ADWG was lower (0.946 ± 0.477). This also indicates the intensive infection in the groups.
Overall, however, during the experimental phase in the present study there was no difference in the quantitative excretion of L. intracellularis in faeces as a function of the diet. Feeding of whey powder showed, however, sig-nificantly lower L. intracellularis levels in the caecum.
In literature, it could be proven that a fermented liquid diet (uncontrolled fermentation for 3–4 days at 24 °C) delayed the excretion of L. intracellularis [12]. Further-more, pigs fed the standard diet supplemented with lac-tic acid (2.4%) had limited pathological lesions when the intestines were examined 4 weeks after inoculation [12]. High lactate concentrations are also to be expected for the fermented diet. Lactic acid concentration of 5.45% at DM level after an 8 h fermentation process were seen [19]. For a ration with 25% whey on DM basis, an 18–27% share of lactic acid on total organic acids in the caecum was shown [20].
Against this background, for the WHEY group higher concentrations of lactate in the gastrointestinal tract can be presumed. Therefore, it can be assumed that the lac-tic acid has a certain influence on the level of L. intracel-lularis in the intestine. This could be very promising for future dietetic approaches in swine.
CorrelationsRegardless of the diet`s nature, two significant correla-tions were identified. First, the acetate content in the cae-cum was negatively correlated with the serological results at the end of the trial. Second, the butyrate contents in the caecum were negatively correlated with the num-ber of L. intracellularis in the caecum. This is a first link between parameters describing the extent of an infection and the substrate properties at the site of the main infec-tion (caecum). In both cases, however, the correlation was weak.
A direct effect is not yet known [21]. However, it is known that the concentration and production of vola-tile fatty acids in the large intestine is a function of sub-strate availability for fermentation [22]. Therefore, it depends on feed intake. This, in turn, is lower when animals develop L. intracellularis infections. In a US study, a reduction in feed intake (1.27 and 7.85, respec-tively) in animals aged 28 to 49 days could be observed for different inoculation doses (counts per pig: compari-son 1: 7.2 × 10⁷ to 3.8 × 10⁵; comparison 2: 7.2 × 10⁷ to 2.2 × 10⁶) [23]. In pigs at 38–58 days of age a reduction in feed intake of about 3.79% after experimental infection (1.26 × 10¹⁰ L. intracellularis organisms in the inoculum) was demonstrated. As a control animals were treated with 50 ppm tylvalosin for 14 further days after experi-mental infection [24].
In the present trial, for group FP a positive correla-tion was found between the DM content in faeces in the acclimatisation phase and the average L. intracellu-laris excretion in the experimental phase. At the same time, however, there was a negative correlation between DM content and L. intracellularis excretion during the experimental phase. Animals show more severe clinical symptoms during initial L. intracellularis infection [18]. The DM content in the faeces is lower with high excre-tion of the pathogen [5]. Conversely, this means for our study: The higher dry matter content in the faeces in the acclimatisation phase is indicative of a lower excre-tion. Therefore, when infected in the experimental phase, these animals will possibly react with a higher level of L. intracellularis excretion. During the experimental phase, a negative correlation between the DM content in faeces and the amount of excretion is to be expected. A previ-ous study described that higher excretion is associated with softer faeces [5, 7]. In the present study there was

Page 11 of 12Visscher et al. Acta Vet Scand (2018) 60:22
a significant correlation between the ΔPI concerning serological tests and the average excretion in the experi-mental phase (r = 0.68). The level of excretion is thus also reflected in the extent of the serological response.
For the CM group, the serological response to the infection with L. intracellularis was reflected relatively clearly in the faecal consistency. Both, the final PI value and the change in the PI value were negatively correlated with the DM content in the faeces during the experimen-tal phase. An effect of L. intracellularis is only relevant to performance when it is also reflected in the DM content [5]. This relationship cannot be confirmed on the basis of the available results for group CM. There was no cor-relation with the ADWG. Under the conditions of CM feeding the excretion level was too low to lead to perfor-mance losses, as described for higher excretion [7].
For the CORN group, there were positive correlations of serological results (PI TP6 and Δ PI) with the butyrate concentration in the caecal content. However, this group was characterised by the numerically lowest butyrate concentrations. At low butyrate concentrations, no posi-tive effect on the excretion of L. intracellularis could be observed. Also, in this group there are indications that a clearer response to the pathogen (ΔPI ↑) leads to changes in fecal consistency (softer).
When feeding whey (WHEY), few correlations were detectable. On the one hand, the number of L. intracel-lularis in faeces at TP1 was negatively associated with the acetate content in the caecum. On the other hand, there was a negative correlation between the DM content in faeces in the acclimatisation phase and L. intracellularis counts in the caecum. The period between acclimatisa-tion and slaughter is relatively long (more than 30 days). A possible effect can certainly only be achieved if the cor-responding feeding regime creates constant conditions in the animal. The measured parameters should also be causally related to the living conditions and characteris-tics of the pathogen. This is not proven for acetate. For the WHEY group, no correlation between the excretion and DM content in faeces could be determined for TP1 (Spearman: r = 0.57; P = 0.112). It is also known from the literature that high amounts of pathogens in the caecum or adjacent areas need not be found in the colon [25] and therefore could be easily be found in faeces.
The RPS group had the highest concentrations of butyrate and the highest L. intracellularis counts in the caecum as well as the deepest crypt in the caecum. For this group a negative correlation of all volatile fatty acids with the L. intracellularis content in the caecum could be shown. The PI at TP6 as well as the average L. intracellu-laris content in the faeces were negatively correlated with the ADWG (r = − 0.66 and r = − 0.78), respectively. Thus, the question is whether the disease leads to less substrate
or if less substrate favours the disease. The fact that less L. intracellularis was detected at absolutely lower butyrate concentrations in the caecal content of the CORN group rather suggests that the butyrate content within this group is more likely to be an indicator function than it being causally related to L. intracellularis counts.
ConclusionsThe present investigations indicate that the model of a natural infection in the finishing boars fundamentally works. Therefore, it is a good tool to analyse possible feeding influences on L. intracellularis infections. Dietet-ics can be a starting point for limiting the extent of infec-tion at an early stage. Nevertheless, further tests over longer periods have to be performed first. In this context, feeding concepts with higher original lactic acid contents or provoking lactic acid production, such as from con-trolled fermentation, could prove promising to limit the effects of an L. intracellularis infection on performance and health.
AbbreviationsADFI: average daily feed intake; ADWG: average daily weight gains; BW: body weight; CM: coarse meal diet; CORN: meal diet with 22% cracked corn; DM: dry matter; FCR: feed conversion ration; FP: fine pelleted diet; GE: genome equivalents Lawsonia intracellularis; L. intracellularis: Lawsonia intracellularis; ME: metabolisable energy; PI: percent inhibition; RPS: meal diet with 30% raw potato starch; SPF: specific pathogen free. The herd was considered free from infection with Porcine reproductive and respiratory syndrome virus and Act-inobacillus pleuropneumoniae serotype 1/9/11, 5a/b, 2 (serological confirmed); Pasteurella multocida (free from—clinical confirmed); TP: time point; VDLUFA: Verband Deutscher Landwirtschaftlicher Untersuchungs- und Forschungsan-stalten e. V; WHEY: meal diet with 16.9% dried whey.
Authors’ contributionsJK, RT, HH (study itself ) and CV (L. intracellularis topic) were the initiators of the idea. JK, SS (study itself ) and CV (L. intracellularis topic) designed the study. AK, SS, CK, JM, RT, CV performed the study and made the analyses. CV did the sta-tistics. CV wrote the paper. All authors read and approved the final manuscript.
Author details1 Institute for Animal Nutrition, University of Veterinary Medicine Hannover, Foundation, Bischofsholer Damm 15, 30173 Hanover, Germany. 2 Boehringer Ingelheim Veterinary Research Center GmbH & Co. KG, Bemeroder Str. 31, 30559 Hanover, Germany. 3 Veterinärgesellschaft im BHZP, Veerßer Str. 65, 29525 Uelzen, Germany. 4 BHZP GmbH, An der Wassermühle 8, 21368 Dahlen-burg-Ellringen, Germany. 5 Boehringer Ingelheim Vetmedica GmbH, Binger Str. 173, 55218 Ingelheim am Rhein, Germany.
AcknowledgementsWe would like to thank Frances Sherwood-Brock for proof reading the manu-script to ensure correct English.
Competing interestsCK is an employee of Boehringer Ingelheim Veterinary Research Center GmbH & Co. KG, Hanover, Germany; RD is an employee of Boehringer Ingelheim Vetmedica GmbH, Ingelheim am Rhein; Germany.
Availability of data and materialsThe datasets used and/or analysed during the current study are available from the corresponding author on reasonable request.
Page 12 of 12Visscher et al. Acta Vet Scand (2018) 60:22
• fast, convenient online submission
•
thorough peer review by experienced researchers in your field
• rapid publication on acceptance
• support for research data, including large and complex data types
•
gold Open Access which fosters wider collaboration and increased citations
maximum visibility for your research: over 100M website views per year •
At BMC, research is always in progress.
Learn more biomedcentral.com/submissions
Ready to submit your research ? Choose BMC and benefit from:
Consent for publicationNot applicable.
Ethics approval and consent to participateThe animal trial was carried out in accordance with German regulations. At the end of the trial, the animals were anaesthetised using a new method (exemp-tion: file 32.22.2, Department of Law and Order, state capital of Hanover) at the abattoir in Hanover. The study itself was denoted as not based on an animal experiment requiring either notification or approval in accordance with the Animal Protection Act (according to the evaluation of the design by the university`s Animal Welfare Officer prior to starting the trials).
FundingParts of the project were supported by funds of the Federal Ministry of Food and Agriculture (BMEL) based on a decision of the Parliament of the Federal Republic of Germany via the Federal Office for Agriculture and Food (BLE) under the innovation support programme. Parts of the study were also financially supported by Boehringer Ingelheim Vetmedica GmbH, D-55216 Ingelheim am Rhein, Germany (qPCR analysis).
Publisher’s NoteSpringer Nature remains neutral with regard to jurisdictional claims in pub-lished maps and institutional affiliations.
Received: 14 January 2018 Accepted: 9 April 2018
References 1. Jacobson M, Fellstrom C, Jensen-Waern M. Porcine proliferative enteropa-
thy: an important disease with questions remaining to be solved. Vet J. 2010;184:264–8.
2. McOrist S, Barcellos D, Wilson R. Global patterns of porcine proliferative enteropathy. Pig J. 2003;51:26–35.
3. Marsteller TA, Armbruster G, Bane DP, Gebhart CJ, Muller R, Weatherford J, et al. Monitoring the prevalence of Lawsonia intracellularis IgG antibodies using serial sampling in growing and breeding swine herds. J Swine Health Prod. 2003;11:127–30.
4. Brandt D, Kaim U, Baumgartner W, Wendt M. Evaluation of Lawsonia intracellularis infection in a group of pigs in a subclinically affected herd from weaning to slaughter. Vet Microbiol. 2010;146:361–5.
5. Pedersen KS, Skrubel R, Stege H, Angen O, Stahl M, Hjulsager C, et al. Association between average daily gain, faecal dry matter content and concentration of Lawsonia intracellularis in faeces. Acta Vet Scand. 2012;54:58.
6. Johansen M, Nielsen M, Dahl J, Svensmark B, Baekbo P, Kristensen CS, et al. Investigation of the association of growth rate in grower-finishing pigs with the quantification of Lawsonia intracellularis and porcine circo-virus type 2. Prev Vet Med. 2013;108:63–72.
7. Collins AM, Barchia IM. The critical threshold of Lawsonia intracellularis in pig faeces that causes reduced average daily weight gains in experimen-tally challenged pigs. Vet Microbiol. 2014;168:455–8.
8. Hardge T, Keller C, Steinheuer R, Tessier P, Salleras J, Rubio P, et al. Serologi-cal prevalence of Lawsonia intracellularis across european pig herds. In: Proceedings of the 19th international pig veterinary society congress. Copenhagen: International Pig Veterinary Society; 2006. p. 77.
9. Guedes RMC, Winkelman NL, Gebhart CJ. Relationship between the severity of porcine proliferative enteropathy and the infectious dose of Lawsonia intracellularis. Vet Rec. 2003;153:432–3.
10. Stege H, Jensen TK, Moller K, Baekbo P, Jorsal SE. Risk factors for intestinal pathogens in Danish finishing pig herds. Prev Vet Med. 2001;50:153–64.
11. Molbak L, Johnsen K, Boye M, Jensen TK, Johansen M, Moller K, et al. The microbiota of pigs influenced by diet texture and severity of Lawsonia intracellularis infection. Vet Microbiol. 2008;128:96–107.
12. Boesen HT, Jensen TK, Schmidt AS, Jensen BB, Jensen SM, Moller K. The influence of diet on Lawsonia intracellularis colonization in pigs upon experimental challenge. Vet Microbiol. 2004;103:35–45.
13. Jacoby RO, Johnson EA. Transmissible ileal hyperplasia. In: Streilein JW, editor. Hamster immune responses in infectious and oncologic diseases. New York: Springer; 1981. p. 267–89.
14. Naumann C, Bassler R. Methoden der landwirtschaftlichen Forschungs- und Untersuchungsanstalt, Biochemische Untersuchung von Futtermit-teln. Darmstadt: Methodenbuch III (einschließlich der achten Ergänzun-gen) (VDLUFA); 2012.
15. Keller C, Ohlinger V, Bulay A, Maala C. A blocking ELISA for the detection of antibodies against Lawsonia intracellularis. In: Proceedings of the 18th international pig veterinary society congress. Hamburg: International Pig Veterinary Society; 2004. p. 293.
16. Nathues H, Holthaus K, Beilage EG. Quantification of Lawsonia intracellula-ris in porcine faeces by real-time PCR. J Appl Microbiol. 2009;107:2009–16.
17. Collins AM, Love RJ. Re-challenge of pigs following recovery from prolif-erative enteropathy. Vet Microbiol. 2007;120:381–6.
18. Kroll JJ, Roof MB, Hoffman LJ, Dickson JS, Harris DL. Proliferative enteropa-thy: a global enteric disease of pigs caused by Lawsonia intracellularis. Anim Health Res Rev. 2005;6:173–97.
19. Mikkelsen LL, Jensen BB. Performance and microbial activity in the gas-trointestinal tract of piglets fed fermented liquid feed at weaning. J Anim Feed Sci. 1998;7:211–5.
20. Friend D, Cunningham H, Nicholson J. The production of organic acids in the pig. Can J Anim Sci. 1963;43:156–68.
21. Vannucci FA, Gebhart CJ. Recent advances in understanding the patho-genesis of Lawsonia intracellularis infections. Vet Pathol. 2014;51:465–77.
22. Argenzio RA, Southworth M. Sites of organic acid production and absorp-tion in gastrointestinal tract of the pig. Am J Physiol. 1975;228:454–60.
23. Paradis M, McKay R, Wilson J, Vessie G, Winkelman N, Gebhart C, et al. Subclinical ileitis produced by sequential dilutions of Lawsonia intracel-lularis in a mucosal homogenate challenge model. Am Assoc Swine Vet. 2005;189–91.
24. Guedes RMC, Franca SA, Machado GS, Blumer MA, Cruz ECD. Use of tylvalosin-medicated feed to control porcine proliferative enteropathy. Vet Rec. 2009;165:342–6.
25. Boutrup TS, Boesen HT, Boye M, Agerholm JS, Jensen TK. Early pathogen-esis in porcine proliferative enteropathy caused by Lawsonia intracellula-ris. J Comp Pathol. 2010;143:101–9.