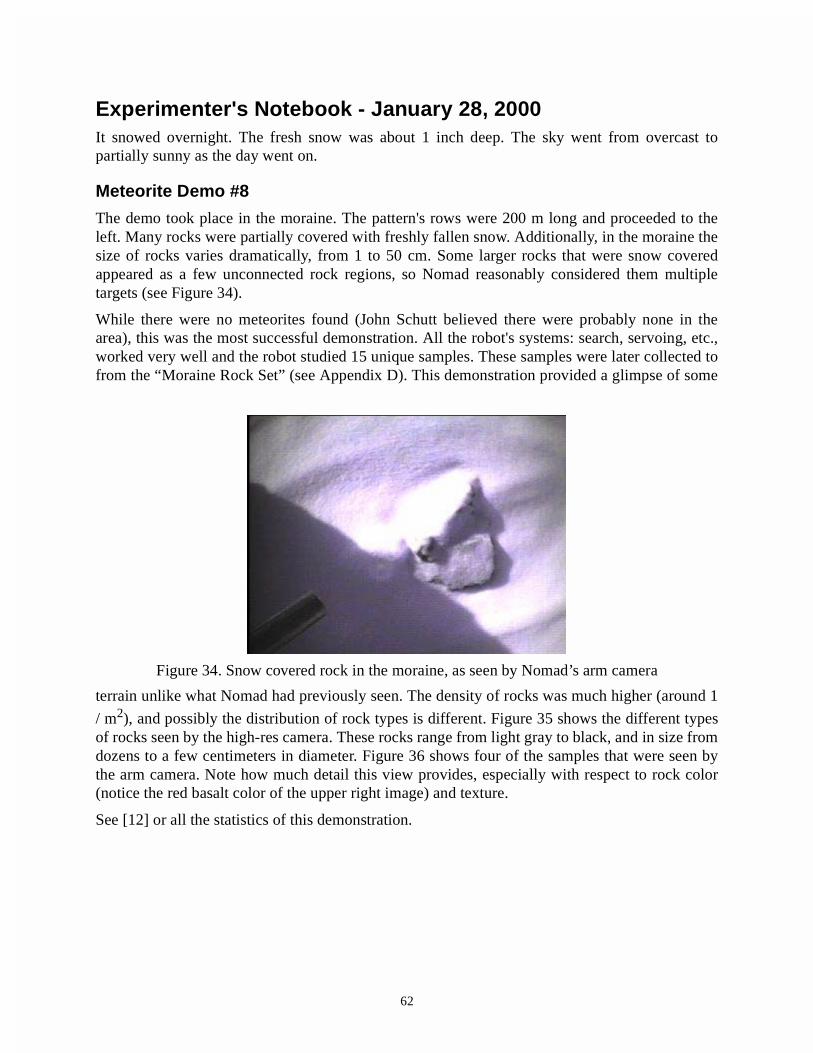
experimenter’s notebook: robotic search for antarctic ... · robotic search for antarctic...
TRANSCRIPT

Experimenter’s Notebook:Robotic Search for Antarctic Meteorites 2000 Expedition
CMU-RI-TR-00-13
Michael D. WagnerEmail: [email protected]
Field Robotics Center, The Robotics InstituteCarnegie Mellon University
Pittsburgh, PA 15213Phone: (412) 268-8158; Fax: (412) 268-5895
June 2000
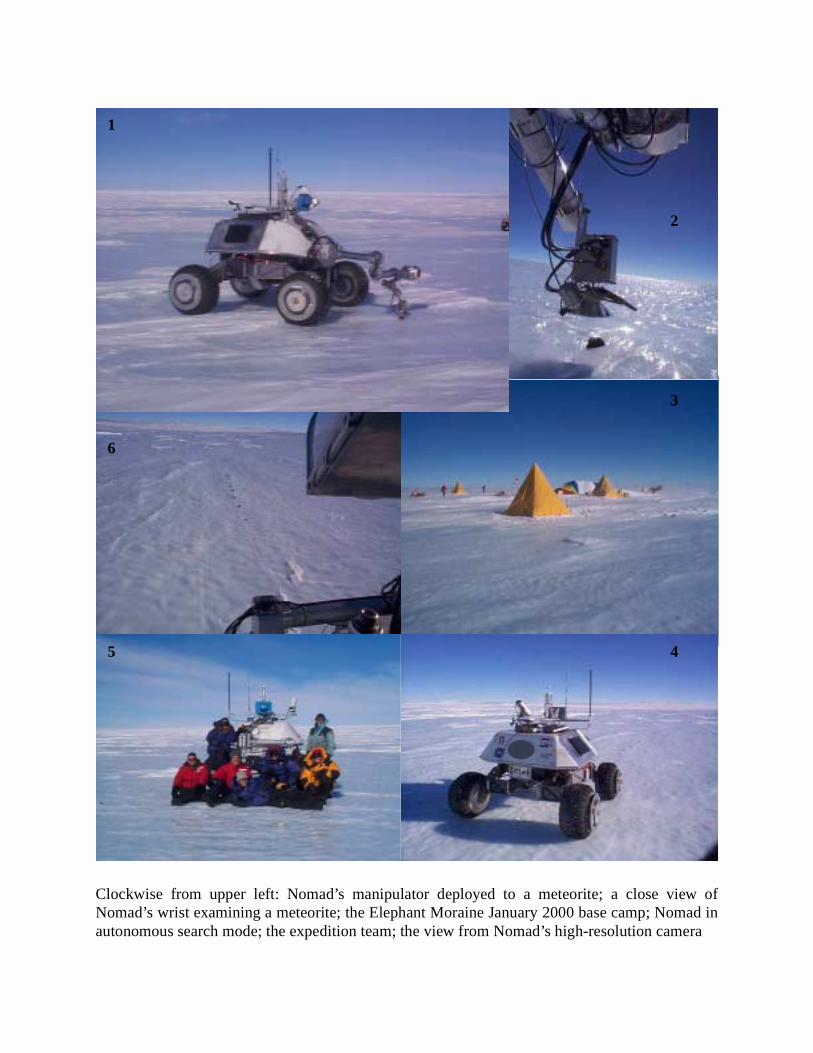
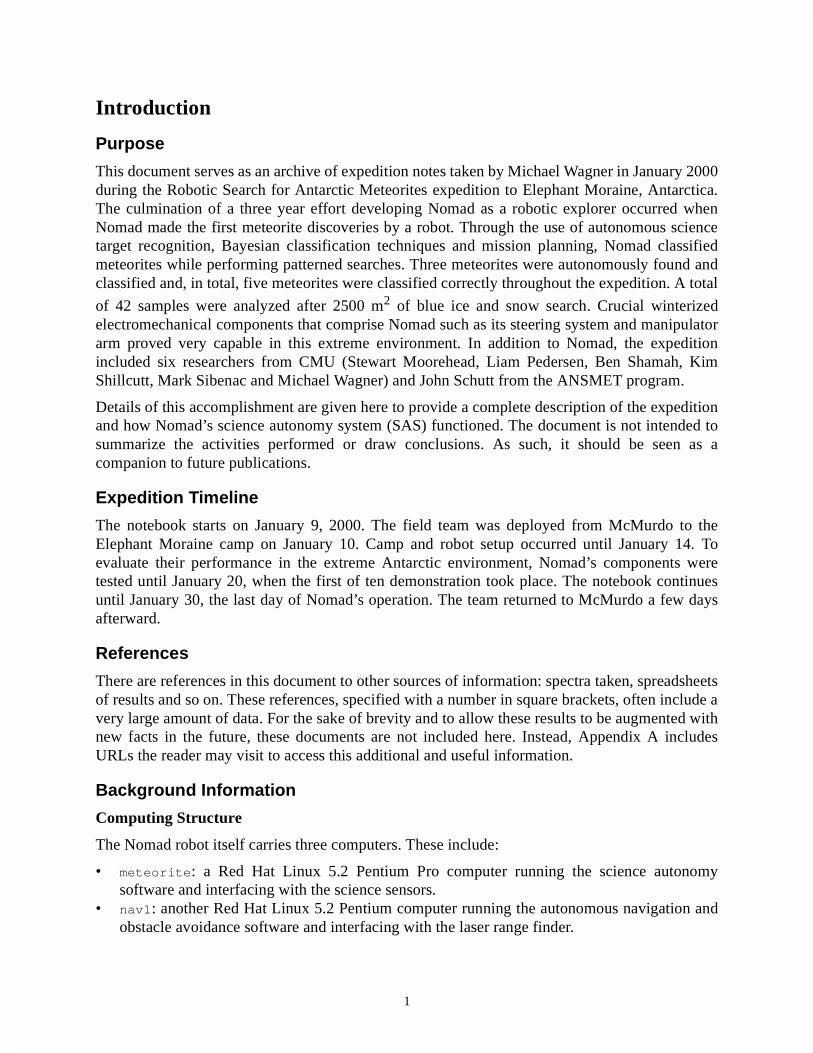
Clockwise from upper left: Nomad’s manipulator deployed to a meteorite; a close view ofNomad’s wrist examining a meteorite; the Elephant Moraine January 2000 base camp; Nomad inautonomous search mode; the expedition team; the view from Nomad’s high-resolution camera
2
3
45
1
6
1
Introduction
Purpose
This document serves as an archive of expedition notes taken by Michael Wagner in January 2000during the Robotic Search for Antarctic Meteorites expedition to Elephant Moraine, Antarctica.The culmination of a three year effort developing Nomad as a robotic explorer occurred whenNomad made the first meteorite discoveries by a robot. Through the use of autonomous sciencetarget recognition, Bayesian classification techniques and mission planning, Nomad classifiedmeteorites while performing patterned searches. Three meteorites were autonomously found andclassified and, in total, five meteorites were classified correctly throughout the expedition. A total
of 42 samples were analyzed after 2500 m2 of blue ice and snow search. Crucial winterizedelectromechanical components that comprise Nomad such as its steering system and manipulatorarm proved very capable in this extreme environment. In addition to Nomad, the expeditionincluded six researchers from CMU (Stewart Moorehead, Liam Pedersen, Ben Shamah, KimShillcutt, Mark Sibenac and Michael Wagner) and John Schutt from the ANSMET program.
Details of this accomplishment are given here to provide a complete description of the expeditionand how Nomad’s science autonomy system (SAS) functioned. The document is not intended tosummarize the activities performed or draw conclusions. As such, it should be seen as acompanion to future publications.
Expedition Timeline
The notebook starts on January 9, 2000. The field team was deployed from McMurdo to theElephant Moraine camp on January 10. Camp and robot setup occurred until January 14. Toevaluate their performance in the extreme Antarctic environment, Nomad’s components weretested until January 20, when the first of ten demonstration took place. The notebook continuesuntil January 30, the last day of Nomad’s operation. The team returned to McMurdo a few daysafterward.
References
There are references in this document to other sources of information: spectra taken, spreadsheetsof results and so on. These references, specified with a number in square brackets, often include avery large amount of data. For the sake of brevity and to allow these results to be augmented withnew facts in the future, these documents are not included here. Instead, Appendix A includesURLs the reader may visit to access this additional and useful information.
Background Information
Computing Structure
The Nomad robot itself carries three computers. These include:
• meteorite: a Red Hat Linux 5.2 Pentium Pro computer running the science autonomysoftware and interfacing with the science sensors.
• nav1: another Red Hat Linux 5.2 Pentium computer running the autonomous navigation andobstacle avoidance software and interfacing with the laser range finder.
2
• vw2: the realtime control computer, running VxWorks 5.3 on a Motorola 68060 CPU in a VME cage.
Several laptops were also used to supervise Nomad’s autonomous operations during theexpedition. These are:
• needsfixed: a Dell Inspiron 7000 laptop running Red Hat Linux version 5.2. This laptopincluded software to connect to and compile software for Nomad’s realtime computer.
• sweeper: a Dell Inspiron 3200 laptop also running Red Hat Linux version 5.2. This laptopincluded software to display video from Nomad’s cameras for verification of rock finds androbot location.
• author: an IBM ThinkPad running Windows 98. This laptop ran a prototype Java applicationthat graphically displayed Nomad’s telemetry.
When mentioned in this document, host names are listed in courier. Please see Figure 1 for ahigh-level description of how these computers interface with each other.
Science Autonomy System
Most of the information in this document pertains to the SAS onboard Nomad. The SAS is acontrol architecture for exploration and in situ science that integrates sensing, navigation,classification and mission planning. Its development is an ongoing effort to enable autonomousrobotic scientists. Specifically, it enables Nomad to search Antarctic ice fields and discriminatepotential meteorites from terrestrial rocks. Several software modules are required to achieve this:sensors must be deployed, samples must be classified and search patterns must be executed. Thenames of these modules are also shown in courier in this document. These programs aredescribed in Appendix B.
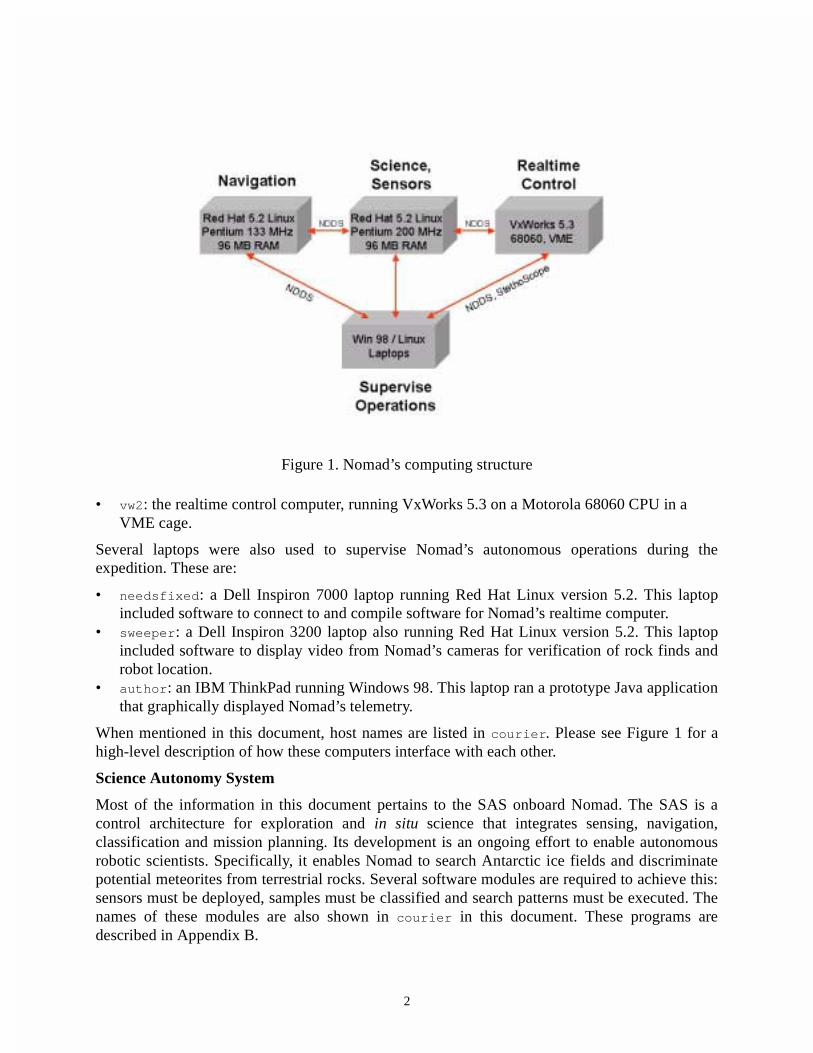
Figure 1. Nomad’s computing structure

3
The science autonomy system is configured by the values of several dozen variables. Whenreferenced in the text, these variables are shown in italics. The values of these variables are set bythe SAS_Config program. Changing a variable’s value can often alter a science autonomymodule’s behavior at runtime. See Appendix C for a description of each variable.
Aspects of this expedition such as autonomous navigation, real-time computing and otherexperiments may not be suitably detailed here.
Other Supplementary Information
Many rock samples that Nomad examined are listed in this document as “Rock A” or “Liam’srock #1”. For a description of each of these rocks, see Appendix D.

4
Experimenter's Notebook - January 9, 2000The team met today outside our temporary offices in McMurdo Station to list the most importantaction items to be finished upon arrival to Elephant Moraine camp.
• Set up camp. Obviously, setting up tents and HF radio contact with McMurdo Station is ofprimary concern.
• Set up five scott tents. These include four living tents and a kitchen tent.
• Set up endurance tent. This is the work tent where operations will take place. It islarge enough to comfortably seat five or six people at a time.
• Set up expedition (bathroom) tent.
• Set up and turn on generators to provide camp with power.
• Verify HF radio functionality.
• Test Iridium phone.
• Set up and test INMARSAT satellite phone equipment.
• Set up robot. Once the camp is complete, Nomad can be assembled, both physically and froma software standpoint.
• Remove the robot from palette that was used during airlift from McMurdo Station.
• Turn on Nomad’s on-board generator.
• Drive the robot off the palette using its joystick and test steering.
• Attach Nomad’s sensor mast and sensors (high-res camera, pan / tilt unit, laserrangefinder, panoramic camera).
• Install ARLAN, radio modem and DGPS antennas.
• Attach Nomad’s manipulator arm.
• Check Java and Tcl/Tk user interfaces.
• Calibrate robot. Before autonomous operation is possible, the robot’s subsystems must to becalibrated. These subsystems include Nomad’s high-resolution camera, laser rangefinder,magnetic compass and image segmentation software.
• Calibrate high-res camera with its calibration sheet. This white sheet with red dotsis used to calibrate camera parameters such as pan, tilt, roll, focal length, aspectratios, CCD width and translation from the DGPS sensor to the camera. Theseparameters are used to make estimates of the location of new science targets found.
• Calibrate laser rangefinder. This involves accurately measuring the angle at whichthe laser is mounted on the sensor mast so accurate distances to potential obstaclescan be calculated.
• Check compass magnetic north offsets. These are very different in Antarctica thanin Pittsburgh, so they must be verified and entered into the system, or else thecompass will fail.
• Tune high-res and arm camera segmentor. The high-res and arm cameras both useone image segmentation algorithm to pick out rocks. This algorithm thresholds

5
pixels based on color ratios and calculates centroids of connected “rock pixel”regions. There are several parameters that needed to be hand-tuned (see AppendixC). To accomplish this, many images from each camera must be taken andsegmentation results examined.
• Train classifier segmentor. Nomad’s target classifier has yet another segmentationroutine used on zoomed in images taken of rocks. This algorithm requires than aninitial target centroid be given, which comes from the high-res segementationalgorithm. The classifier segmentor uses statistics to pick out a rock from thebackground. It is trained with 10 to 30 zoomed in images of rocks.
• Test subsystems. Once calibrated, specific functions of the robot can be tested.
• Test video from robot’s cameras (using pxc_ui interface). Make sure thebandwidth of the wireless ethernet connection is high enough to support thisfeature.
• Test the touch probe to see if it trips properly, and only when it should.
• Verify automatic classification from spectral data. Make sure that a spectrum takenby the SAS will automatically be properly processed by the target classifier.
• Observe the auto-calibration of spectrometer. This involves placing themanipulator arm over a white reference target, taking a spectrum and checking thatthe results match white reference spectra taken in the lab.
• Record wind direction sensor readings to test their validity. This sensor’sreliability has been brought into question recently.
• Perform search patterns with laser-based obstacle avoidance. One unansweredquestion is: how will search patterns be executed when Nomad’s obstacleavoidance module is running? The laser rangefinder data is a single stripe three orfour meters in front of the robot. Therefore at times the robot has no informationabout areas closer than that single stripe. However, tight (3 m radius) turnsrequired by some search patterns may be force the robot into these closer regions.How will the system handle this? Will obstacle avoidance still be effective in thesesituations?
• Record images from the panoramic camera and see if the mirror and lens arealigned properly. Additional problems could include fogging of the glassenclosure.
• Experiments. These integrated tests validate multiple subsystems at once.
• Rock density experiment. Rocks will be placed in a line on the ice at locationssurveyed with John Schutt’s DGPS. The robot will drive along this line andacquire as many of these rock targets as possible. This will test the image andtarget acquisition systems and provide data about the limits of rock distributiondensity acceptable to the software.
• Arm visual servoing and spectrometer placement will be tested to provide data onquality of autonomously taken sample spectra and repeatability of arm visualservoing.

6
Other general information:
• Goal: hold initial demonstrations during week 2
• Download data from the robot at the end of each day
• Record latitude and longitude of DGPS base station as soon as it is set up
• Operator must always be cognizant of robot's status (still or moving, etc.)
• Hold at least 2 email links / day: one in the morning to receive email, one at night to respond
• General work strategy: morning meeting, perform demonstration, meet to analyze results,change code, debug changes

7
Experimenter's Notebook - January 12, 2000Today was a bad weather day. Tried to set up robot components despite a strong wind.
8:00pm: Mounted sensor mast with laser. Briefly started generator. No problems.

8
Experimenter's Notebook - January 13, 20004:00pm: Aligned laser, mounted PTU and high-res camera, ARLAN antenna and wirelessmodem antenna. Removed front shell without difficulty even with wind speeds around 30 mph.Hooked up all cables to units on the mast, including back shell of high-res housing. Startedgenerator and main ebox power. Drove Nomad off the palette with the joystick to behind a scotttent for minimal wind protection. Realtime computer works well, ARLANs connect fine to robotinside camp. Have not yet turned power on to the meteorite or nav1 computers, or the PTU.
Note: Altered high-res software to save images during all steps for debugging.
6:00pm: Turned on all systems on Nomad (minus arm, which is not connected). PTU started upand went through its calibration procedure. It did not require human assistance to move wires, etc.Inside the tent users could telnet to meteorite and nav1. There were problems mountingmeteorite's /usr volume via NFS - it mounted but the access rights on sweeper:/mnt/meteorite/mwagner are not set correctly. Nothing can be read in the directory. However, filescan be changed in subdirectories like mwagner/nomad. Files can be edited on sweeper but mustbe compiled on meteorite. NDDS started up fine - no problems with licenses or Y2K. Usingpxc_ui on meteorite, images were displayed from the high-res camera. The videoServer /pxc_ui combination did not work, however. Using grabImages another image was received andthe PTU was commanded to a pan of 0 degrees and a tilt of -10 degrees. When this was finished,it returned to its home position properly. Then transportStow was used, and it worked. ThenhiResSensor was started and it servoed the PTU to the target acquisition position. Then thefollowing SAS programs were started up on meteorite:
dbServer -vdbClienthiResSensor hiResSensor
sensManMain (after the arm code was #defined out in smManipulatorDriver andrecompiled)targetAcqMain -test
On sweeper, sensManClient was started. On meteorite a target with a DGPS position of (0, -5,-1.84) was inserted into the database. With sensManClient the high-res camera was deployed tothis target. It of course detected many small targets, as it's looking at a scott tent. It auto-focusedand zoomed without any noticeable problems. The saved images looked reasonable. Then onsweeper we ran targetAcqMsgs_client to start targetAcqMain up. It detected 20 targets in oneimage and inserted them all into the database normally.
The database automatically saved itself, providing an archive of today’s activities. Code wasupdated on meteorite for the software changes made since the robot left Pittsburgh, but firstCVS needs to be pointed at the repository on needsfixed so we can tag the current version.
9:00pm: Attempted to point CVS'd files on meteorite to the repository on needsfixed. Itseemed to work, but when an attempt was made to tag all files as Jan13_2000, it seemed as ifsome file somewhere is still looking at an AFS directory.
9
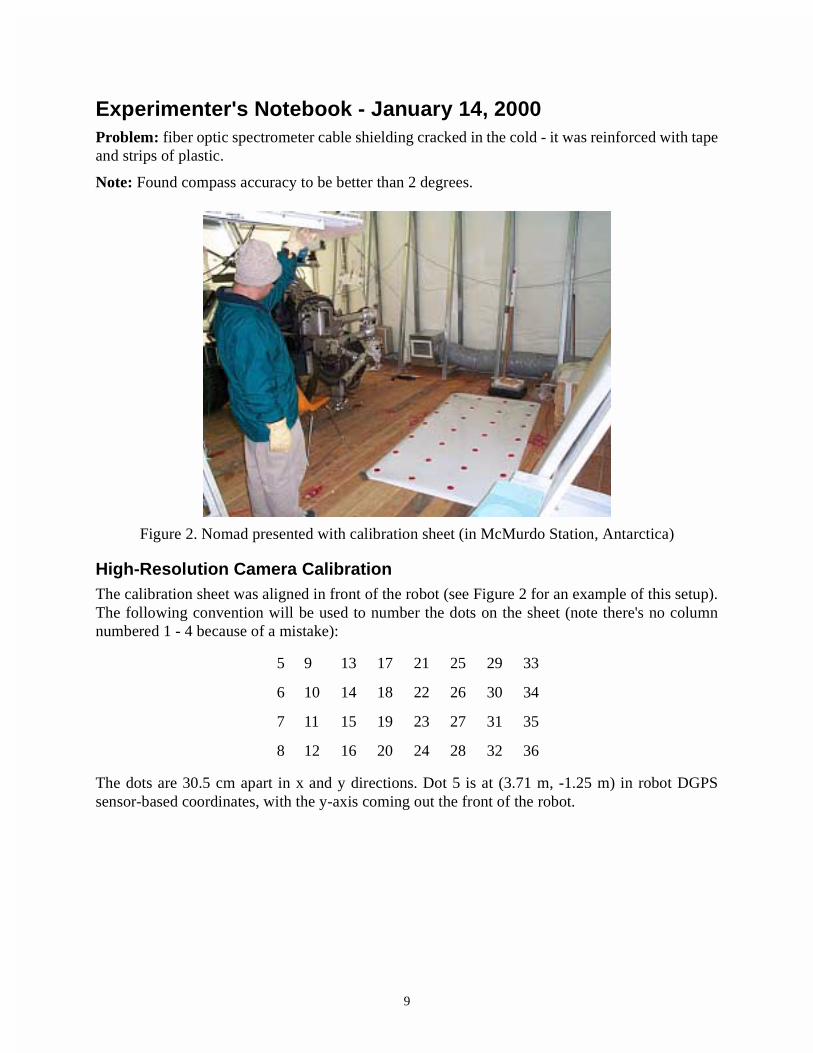
Experimenter's Notebook - January 14, 2000Problem: fiber optic spectrometer cable shielding cracked in the cold - it was reinforced with tapeand strips of plastic.
Note: Found compass accuracy to be better than 2 degrees.
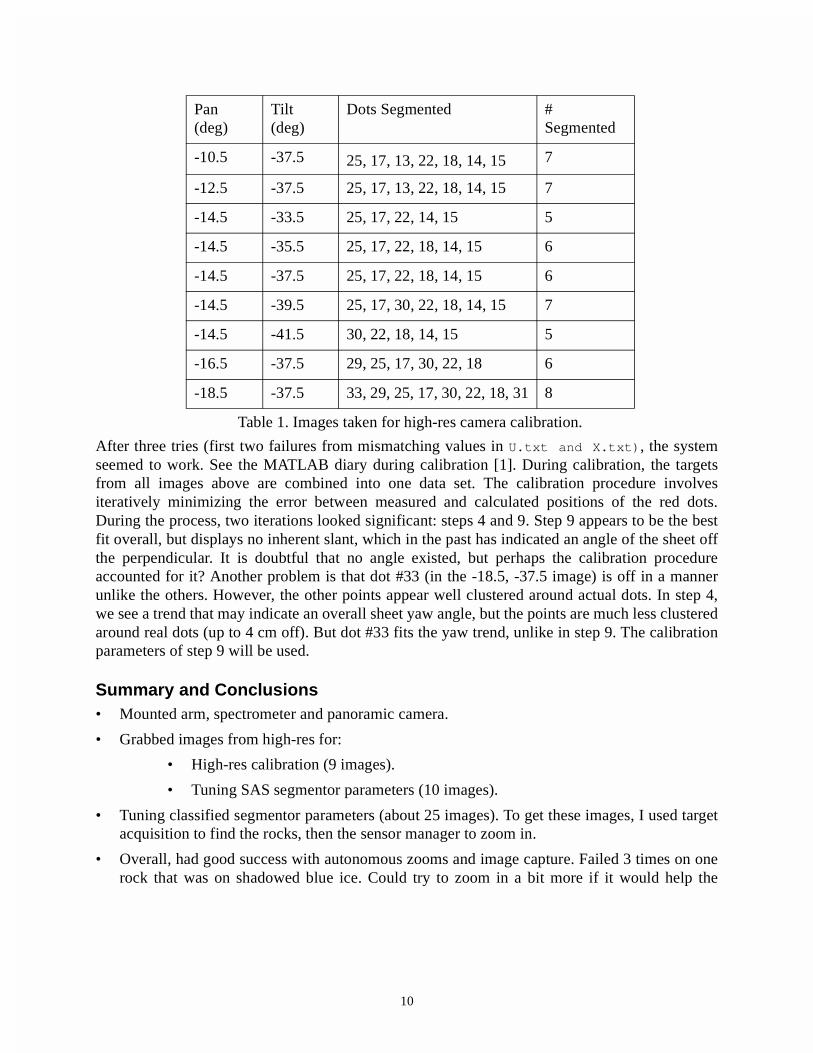
High-Resolution Camera Calibration The calibration sheet was aligned in front of the robot (see Figure 2 for an example of this setup).The following convention will be used to number the dots on the sheet (note there's no columnnumbered 1 - 4 because of a mistake):
The dots are 30.5 cm apart in x and y directions. Dot 5 is at (3.71 m, -1.25 m) in robot DGPSsensor-based coordinates, with the y-axis coming out the front of the robot.
5 9 13 17 21 25 29 33
6 10 14 18 22 26 30 34
7 11 15 19 23 27 31 35
8 12 16 20 24 28 32 36
Figure 2. Nomad presented with calibration sheet (in McMurdo Station, Antarctica)
10
After three tries (first two failures from mismatching values in U.txt and X.txt), the systemseemed to work. See the MATLAB diary during calibration [1]. During calibration, the targetsfrom all images above are combined into one data set. The calibration procedure involvesiteratively minimizing the error between measured and calculated positions of the red dots.During the process, two iterations looked significant: steps 4 and 9. Step 9 appears to be the bestfit overall, but displays no inherent slant, which in the past has indicated an angle of the sheet offthe perpendicular. It is doubtful that no angle existed, but perhaps the calibration procedureaccounted for it? Another problem is that dot #33 (in the -18.5, -37.5 image) is off in a mannerunlike the others. However, the other points appear well clustered around actual dots. In step 4,we see a trend that may indicate an overall sheet yaw angle, but the points are much less clusteredaround real dots (up to 4 cm off). But dot #33 fits the yaw trend, unlike in step 9. The calibrationparameters of step 9 will be used.
Summary and Conclusions• Mounted arm, spectrometer and panoramic camera.
• Grabbed images from high-res for:
• High-res calibration (9 images).
• Tuning SAS segmentor parameters (10 images).
• Tuning classified segmentor parameters (about 25 images). To get these images, I used targetacquisition to find the rocks, then the sensor manager to zoom in.
• Overall, had good success with autonomous zooms and image capture. Failed 3 times on onerock that was on shadowed blue ice. Could try to zoom in a bit more if it would help the
Pan(deg)
Tilt(deg)
Dots Segmented #Segmented
-10.5 -37.5 25, 17, 13, 22, 18, 14, 15 7
-12.5 -37.5 25, 17, 13, 22, 18, 14, 15 7
-14.5 -33.5 25, 17, 22, 14, 15 5
-14.5 -35.5 25, 17, 22, 18, 14, 15 6
-14.5 -37.5 25, 17, 22, 18, 14, 15 6
-14.5 -39.5 25, 17, 30, 22, 18, 14, 15 7
-14.5 -41.5 30, 22, 18, 14, 15 5
-16.5 -37.5 29, 25, 17, 30, 22, 18 6
-18.5 -37.5 33, 29, 25, 17, 30, 22, 18, 31 8
Table 1. Images taken for high-res camera calibration.

11
classifier.
• Still need to check centroid calculation code.
• Is the color balance too far off? Unfortunately, there's no good way to calibrate here.
• Improved performance by playing with new parameters for the segmentor based on lightingand terrain: sun, shadow, ice, snow. Keep track of these trends.
• Some fogging on high-res camera.
• Grabbed panoramic and arm camera images.
• Panoramic camera seriously fogged up.
• Haven't yet checked alignment of arm camera rotation angle.
• Performed most of high-res calibration procedure.
• Set spectrometer attenuator and verified that signal strength looked good even after cableshielding cracked.
12
Experimenter's Notebook - January 15, 2000
Segmentation Findings from January 14• targetAcqMaxStddevRatio in SAS_Config is now set at 50 (see Appendix C). This is good for
all conditions.• targetAcqPercentage changes depending on weather? Yesterday (partly sunny) it worked at
around 0.70. On a bright day at Willy Field, it worked at 0.55, so we believe that when the sunis bright it should be set < 0.70. If it is set higher, more false positives seem to appear.
• Only on sunny days did targetAcqPercentage not equal armCamPercentage.
Arm Testing• Arm stowed properly.• Positioned arm at (-1 m, 1 m) arm-relative position. Position looked good.• Stowed arm again when an oil leak was detected from Nomad's generator.• Spectrometer head intrudes well into arm camera image - need to move back or visual
servoing will be adversely affected. Spectrometer will be removed for the rest of these tests.• Visually servoed to (-1 m, 1 m). Found 3 targets, failed in IK (bad segmented blob chosen as
real target?). The false targets were found along the sides of the image. Need to update code tothe version written in McMurdo so the arm camera's segmentation can be tweaked withoutchanging those of target acquisition. Should wait for new CVS repository to be completedbefore changing code.
CVS Tagging
On meteorite:/usr/mwagner/nomad, the following directories were CVS committed to theneedsfixed repository, and tagged as Jan13_2000:
• Science autonomy code• Video teleoperation code• NDDS messages
Now changes made on sweeper can be copied to meteorite. This will change the followingcomponents:
• Target acquisition
• SAS configuration code
• Database
• Sensor manager
• Arm controller code
• Camera controller code
Panoramic Camera.
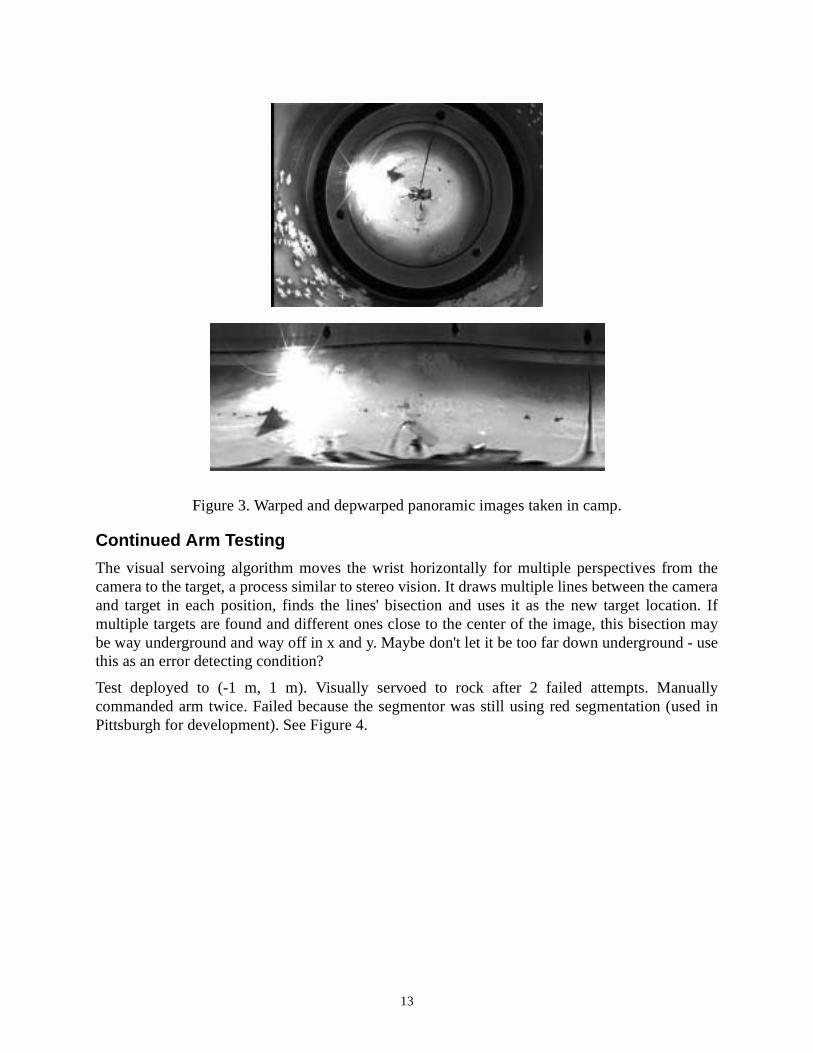
Dewarped a panoramic image: it is very pixelated and low resolution, especially at the bottom.See Figure 3. One reason for this could be that the mirror and lens are misaligned.
13
Continued Arm Testing
The visual servoing algorithm moves the wrist horizontally for multiple perspectives from thecamera to the target, a process similar to stereo vision. It draws multiple lines between the cameraand target in each position, finds the lines' bisection and uses it as the new target location. Ifmultiple targets are found and different ones close to the center of the image, this bisection maybe way underground and way off in x and y. Maybe don't let it be too far down underground - usethis as an error detecting condition?
Test deployed to (-1 m, 1 m). Visually servoed to rock after 2 failed attempts. Manuallycommanded arm twice. Failed because the segmentor was still using red segmentation (used inPittsburgh for development). See Figure 4.
Figure 3. Warped and depwarped panoramic images taken in camp.

14
Test deployed arm to an initial estimate of (0 m, 1.2 m) on the same rock as above. Failed to findit well, as it found a few other targets (see Figure 5). Changed armCamMinCol to 20 andarmCamMinRow to 30 (see Appendix C).
Tried again. Still lost the target. Changed armCamMaxCol to 310.
Tried again. Found target, but didn't align wrist well (this was probably not a segmentationproblem).
Moved robot onto blue ice without shadows to verify the procedure in the simplest case(segmentation has always worked better on blue ice than snow). Deployed to the same rock, again
with an initial estimate of (0 m, 1.2 m). Found the rock centered in the 2nd step, so triggered"already centered" code and immediately moved the wrist down on it.
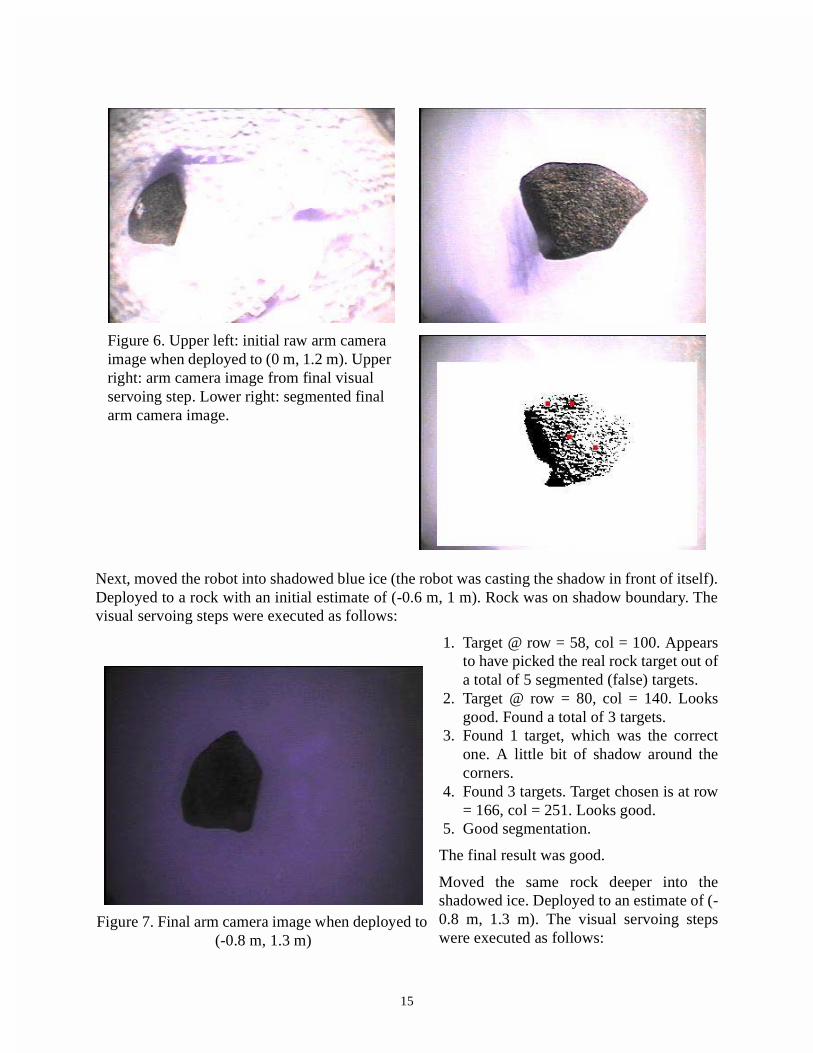
Note that the rock was centered but was segmented strangely, seeing it as 4 targets because of therock's texture (See Figure 6).
Now tried going to the same rock, but with an initial estimate of (0 m, 1.1 m). Same rock, sameposition, same result.
Figure 4. Raw and segmented images from arm camera when deployed to (-1 m, 1 m)
Figure 5. Raw and segmented images from arm camera when deployed to (0 m, 1.2 m)
15
Next, moved the robot into shadowed blue ice (the robot was casting the shadow in front of itself).Deployed to a rock with an initial estimate of (-0.6 m, 1 m). Rock was on shadow boundary. Thevisual servoing steps were executed as follows:
1. Target @ row = 58, col = 100. Appearsto have picked the real rock target out ofa total of 5 segmented (false) targets.
2. Target @ row = 80, col = 140. Looksgood. Found a total of 3 targets.
3. Found 1 target, which was the correctone. A little bit of shadow around thecorners.
4. Found 3 targets. Target chosen is at row= 166, col = 251. Looks good.
5. Good segmentation.
The final result was good.
Moved the same rock deeper into theshadowed ice. Deployed to an estimate of (-0.8 m, 1.3 m). The visual servoing stepswere executed as follows:
Figure 6. Upper left: initial raw arm camera image when deployed to (0 m, 1.2 m). Upper right: arm camera image from final visual servoing step. Lower right: segmented final arm camera image.
Figure 7. Final arm camera image when deployed to (-0.8 m, 1.3 m)

16
1. Found 7 targets total. 2 were the rock. Target is @ row = 56, col = 137. Looks like it picked arock target.
2. Found 3 targets, chose the rock row = 78, col = 167. 3. Segmentation good. Found the rock. 4. Segmentation combined the rock and a surrounding shadow into one target. 5. Segmentation split up rock into 5 targets, like an above case.
Result was good (see Figure 7).
Classifier / Spectrometer Tests
Issues: bellows could not be used because the cut out too much of the arm camera images.
Note: spectrometer automatically turns lamps on at startup.
Note: software could not read if lamps were on or off (digital I/O in didn't have properinformation). Therefore, just assume that the digital output operation has worked properly.
Problem: scaling is done incorrectly in high-res images. This may be due to a software bug,because the process seems correct.
Problem: MATLAB spectrum file reader in classifier won't read filenames starting with anumber.
Idea: perhaps the quality of spectrometer calibration can be quantified by comparing it to a handsampled "good calibration". For a well-taken reference spectrum, the absolute difference betweenthe two should be small. Therefore, we can describe the reference spectrum's quality by:
Quality Rating = � ° �known good ref spec (O)- robot sampled ref spec(O�)° GO
Increased quality of spectrum results in a lower quality rating.
17
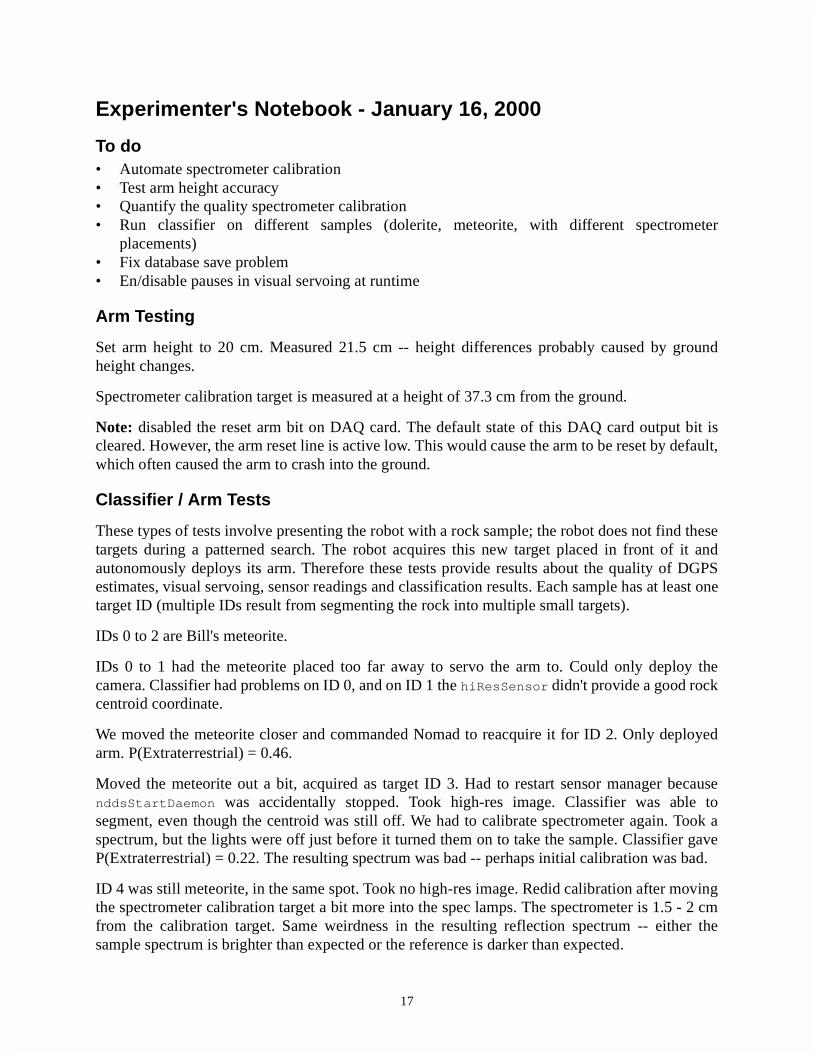
Experimenter's Notebook - January 16, 2000
To do• Automate spectrometer calibration• Test arm height accuracy• Quantify the quality spectrometer calibration• Run classifier on different samples (dolerite, meteorite, with different spectrometer
placements)• Fix database save problem• En/disable pauses in visual servoing at runtime
Arm Testing
Set arm height to 20 cm. Measured 21.5 cm -- height differences probably caused by groundheight changes.
Spectrometer calibration target is measured at a height of 37.3 cm from the ground.
Note: disabled the reset arm bit on DAQ card. The default state of this DAQ card output bit iscleared. However, the arm reset line is active low. This would cause the arm to be reset by default,which often caused the arm to crash into the ground.
Classifier / Arm Tests
These types of tests involve presenting the robot with a rock sample; the robot does not find thesetargets during a patterned search. The robot acquires this new target placed in front of it andautonomously deploys its arm. Therefore these tests provide results about the quality of DGPSestimates, visual servoing, sensor readings and classification results. Each sample has at least onetarget ID (multiple IDs result from segmenting the rock into multiple small targets).
IDs 0 to 2 are Bill's meteorite.
IDs 0 to 1 had the meteorite placed too far away to servo the arm to. Could only deploy thecamera. Classifier had problems on ID 0, and on ID 1 the hiResSensor didn't provide a good rockcentroid coordinate.
We moved the meteorite closer and commanded Nomad to reacquire it for ID 2. Only deployedarm. P(Extraterrestrial) = 0.46.
Moved the meteorite out a bit, acquired as target ID 3. Had to restart sensor manager becausenddsStartDaemon was accidentally stopped. Took high-res image. Classifier was able tosegment, even though the centroid was still off. We had to calibrate spectrometer again. Took aspectrum, but the lights were off just before it turned them on to take the sample. Classifier gaveP(Extraterrestrial) = 0.22. The resulting spectrum was bad -- perhaps initial calibration was bad.
ID 4 was still meteorite, in the same spot. Took no high-res image. Redid calibration after movingthe spectrometer calibration target a bit more into the spec lamps. The spectrometer is 1.5 - 2 cmfrom the calibration target. Same weirdness in the resulting reflection spectrum -- either thesample spectrum is brighter than expected or the reference is darker than expected.

18
ID 5: Liam's rock #1. ID 5 is this rock. ID 6 is bogus. Deployed high-res camera on rock.Successfully segmented rock in image. P(Igneous) = 0.55, P(Extraterrestrial) = 0.15 after imageclassification. Arm couldn't get to ID 5.
Acquired IDs 7, 8, and 9. They are all on the same rock, rock #1. The rock was in the robot'sshadow. Deployed arm only on ID 7. Visual servoing seemed to be a bit off, but at least the rock ison the side of the spectrometer. Spectrum seemed to be good, results seemed promising althoughit could've been a bit corrupted by ice.
Acquired IDs 10, 11 and 12. The rock is Liam's rock #2, and is very white -- much whiter than anymeteorite. Deployed arm to ID 10. Visual servoing seemed to work well even though the rock wasso white. Spectrum seemed bad to our visual inspection, but somehow the classification resultseemed reasonable.
See [2] for more results and a description of each sample.
An ideal white reference is depicted in [3].
Problem: the hiResSensor scaling fixes made yesterday had a bug. Fixed today, and recompiled.
Problem: target centroid in hiResSensor not always reliable. The classifier displays the imagesegmented and marks the given centroid. By visual examination these can be far from the actualcentroid, near the rock’s outer edge. Need to change this.
Problem: spectrometer lamps are not fully illuminating calibration target. Moved target a bit -seems better.
Note: segmentation works well in visual servoing on overcast days like today.
Note: need to add code to automatically calibrate spectrometer in arm software.
Error: database still breaks when saving? Don't know why.
Problem: spectrometer lamps not turned on BEFORE taking sample spectrum.
Improvement: zoom in high-res camera more, if possible.
Conclusions:
• Move spectrometer sensor head closer to target - this means it will occlude more of the armcamera image, but it's necessary to get good readings.
• Verify that the calibration target is being illuminated well.• Get lamps working right.• Check out database saving ASAP.• Implement calibration quality measurement.• Zoom in high-res more?
Pattern Test
A pattern test involves Nomad executing a search pattern and examining targets found along theway. The entire procedure is autonomous, although the robot can be paused during the test to
19
evaluate results, verify findings and possibly even change software.
Test started test at 13:05 local time.
Rocks from Liam's collection (representative of the moraine) placed on blue ice.
Using target acquisition (in test logging mode), sensor manager, hiResSensor, database andclassifier. Both camera and spectrometer will be deployed.
Transcript from the test:
ID 0: a real rock
Deployed high-res, classifier segmented resulting image properly. Performed spectrometercalibration. Deployed arm. Couldn't see a rock in first arm cam image, so the ID was thrown outand the arm stowed. DGPS estimates were probably off.
Restarted mission planner and classifier. The mission planner was not responding to commands,so the system should be started fresh.
Observer with the robot said the robot passed two rocks without detecting them. Cause unknown:bad segmentation? Rocks outside target acquisition area, which is very small?
IDs 1 and 2: real rocks. One might be the same as ID 0? Deployed high-res to ID 1. Classifiersegmented properly. Arm was deployed to completely the wrong place.
Restarted the row, with rocks spaced further apart so the robot observer could tell what target thearm is trying to go to, to get an idea about what type of error is being encountered. Navigationplanning software reported a 3 deg heading error, which could result in a error of 33 cm.
Found target ID 3, failed to get a good image. Failed to deploy arm. Position in arm coordinates(0.25 m, 0.50 m).
Found target ID 4. Target acqusition is running slower than it will during real demonstrationsbecause every image captured is saved to disk and logged. Several targets required backing up forhigh-res images because by the time the mission planner knew about a new target it had traveledtoo close to it. High-res failed to see anything.
Found target ID 5. High-res segmented a shadow that was closer than the rock was, and found itinstead.
Restarted targetAcqMain without saving images. It will therefore run faster.
Acquired ID 6, which appears to be the same rock as ID 5. This time it found the rock instead ofthe shadow, and zoomed in properly. Robot still had to back up however. Classifier segmented theimage properly. Arm was deployed poorly again. Position in arm coordinates was (-0.40 m, 0.60m).
Replaced the calibration parameters found on January 14 with those calculated on December 30 atWilly Field. This calibration had worked well in McMurdo. Tried again.
Found target ID 7. Didn't have to back up, but failed to get anything in the high-res image.

20
All errors measured are around 1 meter. This is more than can be expected from the apparentcompass error.
Error: targets are NOT being re-acquired before deploying arm. This probably requiresrecompilation.
Error: arm deployment failed to pick up rock on the initial visual servoing image. Arm servoingworked when the robot is not moving, so the initial DGPS estimates are very wrong. The errorcould be caused by the robot's pose (roll, pitch or yaw) being nonzero during calibration. InPittsburgh this was not a problem, since we calibrated on the floor, but on the ice it certainly couldbe different.
Stopped test because DGPS estimates were too far off to continue. The high-res camera should berecalibrated.
See [4] for more results.
Recalibrating the Camera
The camera was recalibrated, this time sweeping the tilt angles from -41 to -31 degrees in steps of5 degrees with a nominal tilt of -37.5 degrees, and pan angles from -5 to -20 degrees in steps of 5degrees with a nominal pan of -14.5 degrees. Here are how the dots on the calibration sheet werenumbered. Note that this time, it starts with 1 rather than 5. Also, note that it is quite difficult tolay the sheet down flat on the rippled ice when any type of wind is blowing. Next time a betterway of doing this should be used - perhaps something attached to the robot, or perhaps a rigidsheet.
The sheet’s dots are numbered:
The dots are 30.5 cm apart in x and y directions. Dot 1 is at (3.95, -0.84) in robot DGPS sensor-based coordinates, with the y-axis coming out the front of the robot.
1 5 9 13 17 21 25 29
2 6 10 14 18 22 26 30
3 7 11 15 19 23 27 31
4 8 12 16 20 24 28 32
21
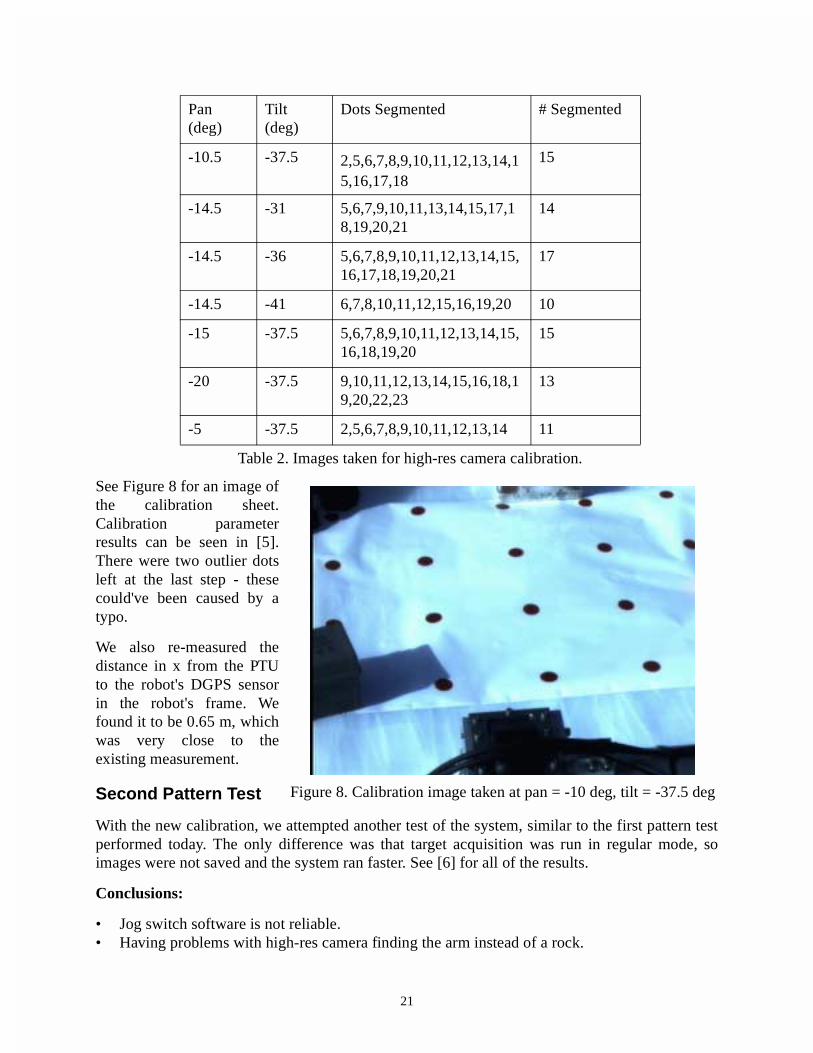
See Figure 8 for an image ofthe calibration sheet.Calibration parameterresults can be seen in [5].There were two outlier dotsleft at the last step - thesecould've been caused by atypo.
We also re-measured thedistance in x from the PTUto the robot's DGPS sensorin the robot's frame. Wefound it to be 0.65 m, whichwas very close to theexisting measurement.
Second Pattern Test
With the new calibration, we attempted another test of the system, similar to the first pattern testperformed today. The only difference was that target acquisition was run in regular mode, soimages were not saved and the system ran faster. See [6] for all of the results.
Conclusions:
• Jog switch software is not reliable.• Having problems with high-res camera finding the arm instead of a rock.
Pan(deg)
Tilt(deg)
Dots Segmented # Segmented
-10.5 -37.5 2,5,6,7,8,9,10,11,12,13,14,15,16,17,18
15
-14.5 -31 5,6,7,9,10,11,13,14,15,17,18,19,20,21
14
-14.5 -36 5,6,7,8,9,10,11,12,13,14,15,16,17,18,19,20,21
17
-14.5 -41 6,7,8,10,11,12,15,16,19,20 10
-15 -37.5 5,6,7,8,9,10,11,12,13,14,15,16,18,19,20
15
-20 -37.5 9,10,11,12,13,14,15,16,18,19,20,22,23
13
-5 -37.5 2,5,6,7,8,9,10,11,12,13,14 11
Table 2. Images taken for high-res camera calibration.
Figure 8. Calibration image taken at pan = -10 deg, tilt = -37.5 deg
22
Experimenter's Notebook - January 17, 2000
Code Development• Spectrometer lamps now turn on immediately after each dark reference spectrum.• Centroids of targets in high-res images are now calculated more correctly, although there are
cases where the new method would fail. Now we simply return the point halfway between thefirst (upper left) and final (lower right) corners as the centroid.
Centroid row = (firstPixel.row + lastPixel.row) / 2
Centroid col = (firstPixel.col + lastPixel.col) / 2
• Added hiResTargetZoomVal to SAS_Config. It can be set to 140 (it's current setting) or anyother 8-bit number and the software will step down to this lowest (i.e. most zoomed) value.
• Updated dbServer to timestamp archive file names.
Hard Drive Failure
Some directories on meteorite started having “I/O Errors” when a user would attempt to cd intothem. Then the next time it was booted up, it never appeared on the network. The robot wasopened and a portable keyboard / monitor was connected. It was asking for the root password todrop to a shell. The /dev/hda6 (7.5 GB) partition was fsck’d manually. However, each time itrebooted afterwards, the partition failed. So the computer was removed from Nomad and taken tothe tent to have its hard drive replaced. The spare hard drive was unpacked and placed inmeteorite. This drive was identical to meteorite's hard drive when it left Pittsburgh in December.It booted fine, so all of the source code was updated and recompiled.
Arm Testing
This test was designed to take data for arm segmentation tuning, and to test visual servoing withthe new spectrometer placement. When the wrist is moved into calibration position, the arm
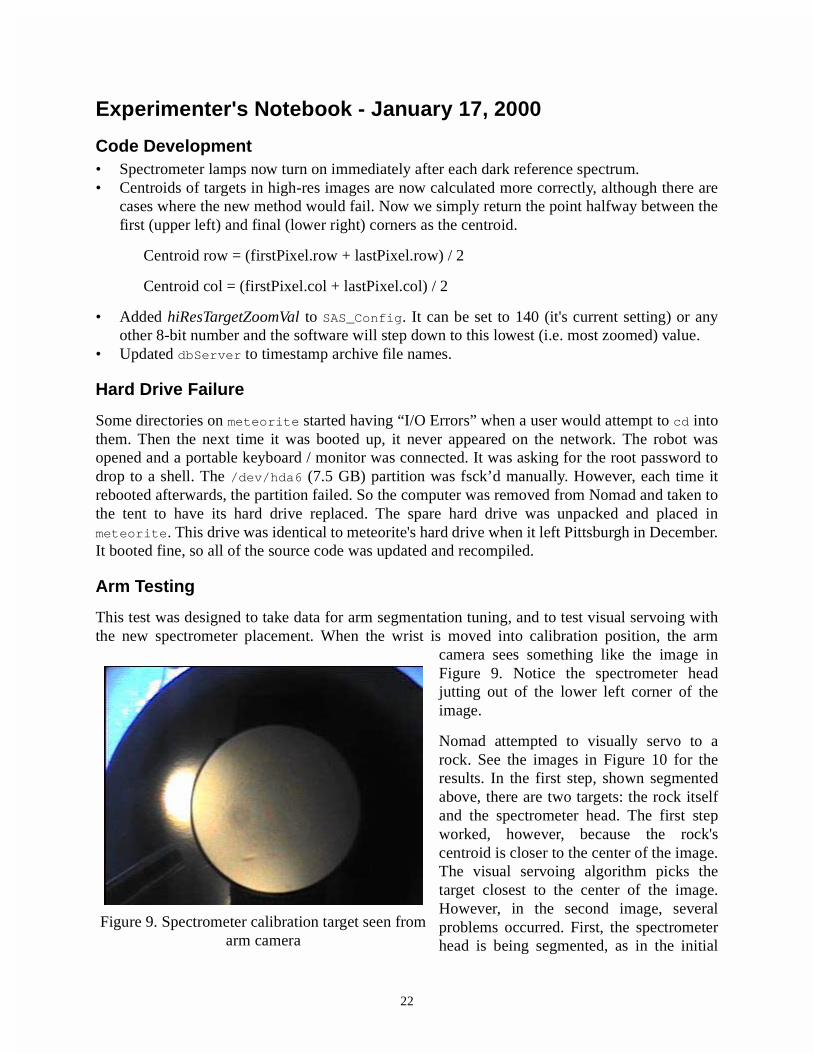
camera sees something like the image inFigure 9. Notice the spectrometer headjutting out of the lower left corner of theimage.
Nomad attempted to visually servo to arock. See the images in Figure 10 for theresults. In the first step, shown segmentedabove, there are two targets: the rock itselfand the spectrometer head. The first stepworked, however, because the rock'scentroid is closer to the center of the image.The visual servoing algorithm picks thetarget closest to the center of the image.However, in the second image, severalproblems occurred. First, the spectrometerhead is being segmented, as in the initial
Figure 9. Spectrometer calibration target seen from arm camera
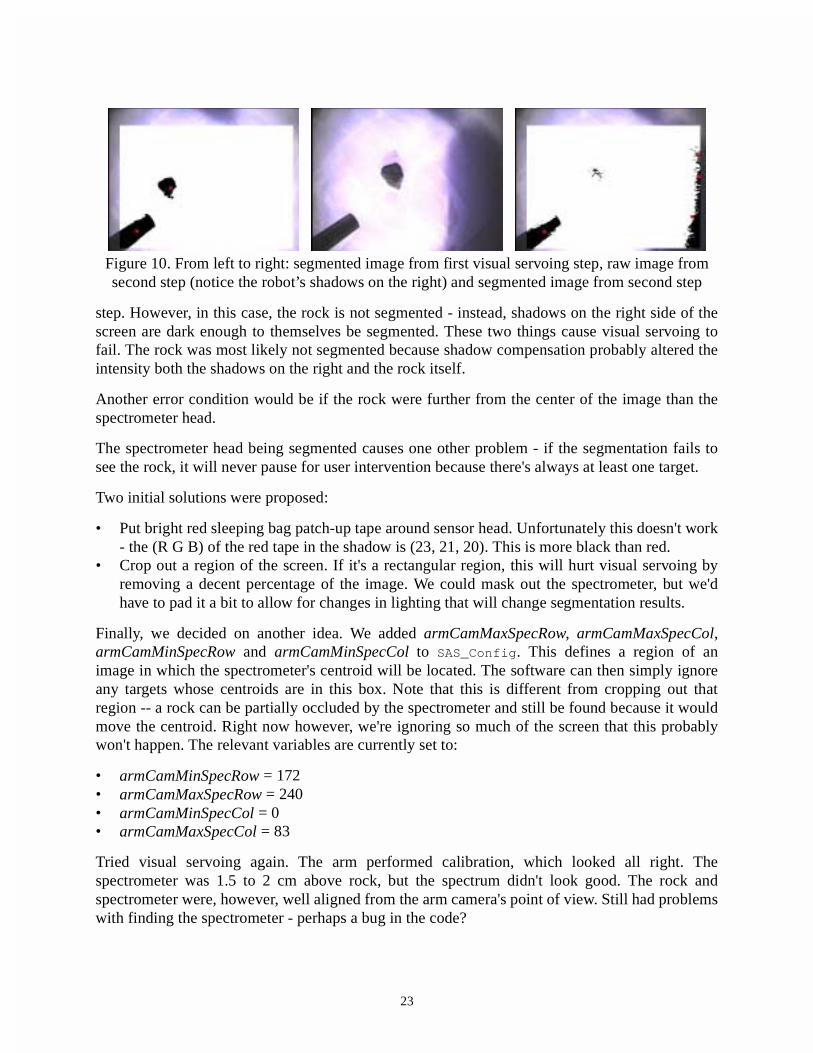
23
step. However, in this case, the rock is not segmented - instead, shadows on the right side of thescreen are dark enough to themselves be segmented. These two things cause visual servoing tofail. The rock was most likely not segmented because shadow compensation probably altered theintensity both the shadows on the right and the rock itself.
Another error condition would be if the rock were further from the center of the image than thespectrometer head.
The spectrometer head being segmented causes one other problem - if the segmentation fails tosee the rock, it will never pause for user intervention because there's always at least one target.
Two initial solutions were proposed:
• Put bright red sleeping bag patch-up tape around sensor head. Unfortunately this doesn't work- the (R G B) of the red tape in the shadow is (23, 21, 20). This is more black than red.
• Crop out a region of the screen. If it's a rectangular region, this will hurt visual servoing byremoving a decent percentage of the image. We could mask out the spectrometer, but we'dhave to pad it a bit to allow for changes in lighting that will change segmentation results.
Finally, we decided on another idea. We added armCamMaxSpecRow, armCamMaxSpecCol,armCamMinSpecRow and armCamMinSpecCol to SAS_Config. This defines a region of animage in which the spectrometer's centroid will be located. The software can then simply ignoreany targets whose centroids are in this box. Note that this is different from cropping out thatregion -- a rock can be partially occluded by the spectrometer and still be found because it wouldmove the centroid. Right now however, we're ignoring so much of the screen that this probablywon't happen. The relevant variables are currently set to:
• armCamMinSpecRow = 172• armCamMaxSpecRow = 240• armCamMinSpecCol = 0• armCamMaxSpecCol = 83
Tried visual servoing again. The arm performed calibration, which looked all right. Thespectrometer was 1.5 to 2 cm above rock, but the spectrum didn't look good. The rock andspectrometer were, however, well aligned from the arm camera's point of view. Still had problemswith finding the spectrometer - perhaps a bug in the code?
Figure 10. From left to right: segmented image from first visual servoing step, raw image from second step (notice the robot’s shadows on the right) and segmented image from second step

24
Put specCalibTargetHeight in SAS_Config so the spectrometer calibration target height can bechanged at runtime. Set it to 0.378 m.
Tried calibrating and servoing again. It still found the spectrometer, but visual servoing worked.The spectrum looked good.
Line of Rocks Test
The robot did a search along a DGPS-surveyedline of rocks (see Figure 11). In addition tosimply acquiring the targets, it also ran themission planner and sensor manager, so sensorswould be deployed.
See [7] for more results.
Figure 11. Nomad driving along surveyed line of rocks
25
Experimenter's Notebook - January 18, 2000
Segmented Spectrometer Test
This test was designed to get more experience visual servoing with the spectrometer head in theimage. The coordinates of the spectrometer head in the image will be recorded each time.
There were six visual servoing attempts: four to gather data on how large an area needs to besearched to find the spectrometer head’s centroid and another two to test the new settings.
Attempt 1
A rock was placed in front of the robot, with estimated arm relative coordinates of (0 m, 1 m).Later discovered the rock was discovered to be closer to (0 m, 1.2 m). The visual servoing saw toomany shadows and failed.
Attempt 2
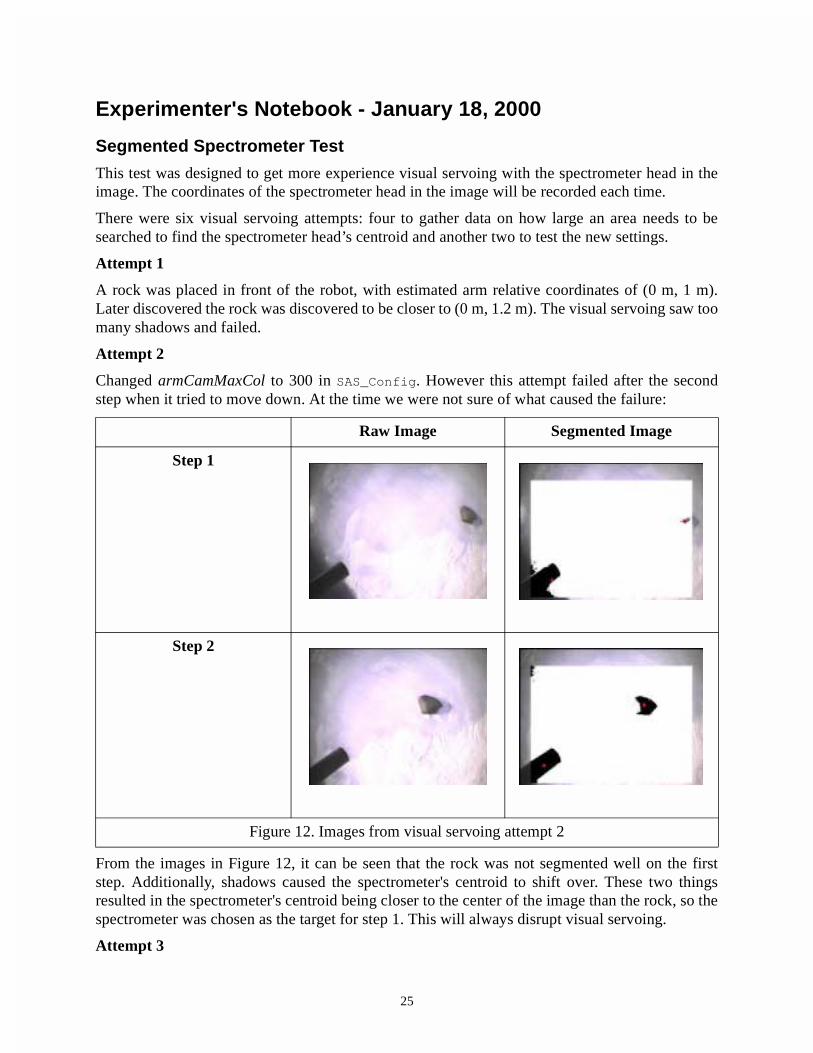
Changed armCamMaxCol to 300 in SAS_Config. However this attempt failed after the secondstep when it tried to move down. At the time we were not sure of what caused the failure:
From the images in Figure 12, it can be seen that the rock was not segmented well on the firststep. Additionally, shadows caused the spectrometer's centroid to shift over. These two thingsresulted in the spectrometer's centroid being closer to the center of the image than the rock, so thespectrometer was chosen as the target for step 1. This will always disrupt visual servoing.
Attempt 3
Raw Image Segmented Image
Step 1
Step 2
Figure 12. Images from visual servoing attempt 2
26
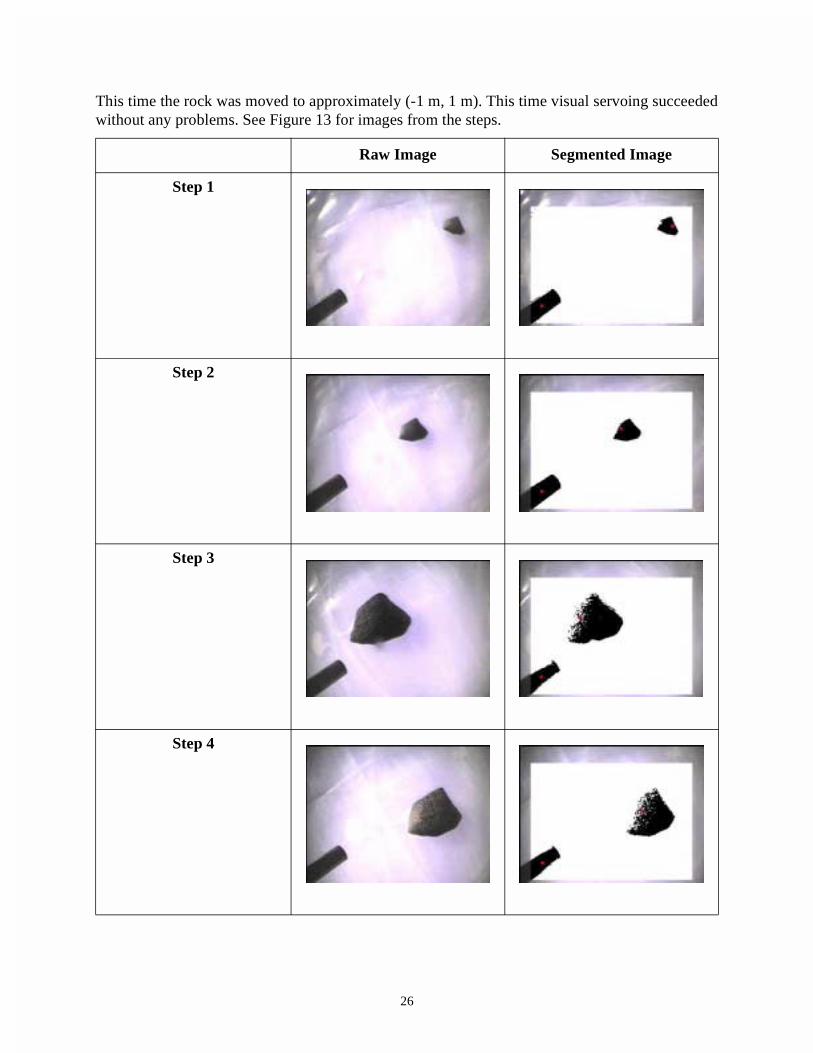
This time the rock was moved to approximately (-1 m, 1 m). This time visual servoing succeededwithout any problems. See Figure 13 for images from the steps.
Raw Image Segmented Image
Step 1
Step 2
Step 3
Step 4
27
It seems a trend that as the wrist moves down and the rock gets bigger in the image, shadowcompensation is probably performed, which causes the spectrometer to be segmented lessproperly. However, the results seem good for the spectrometer in this location.
Attempt 4
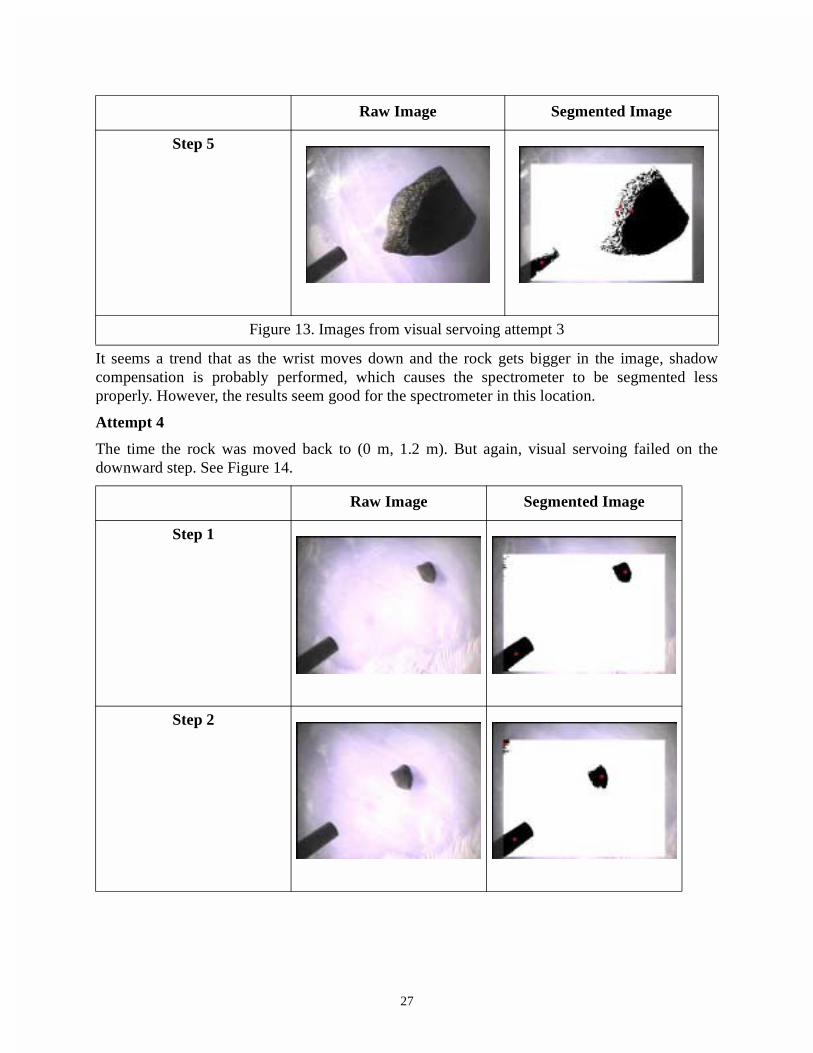
The time the rock was moved back to (0 m, 1.2 m). But again, visual servoing failed on thedownward step. See Figure 14.
Step 5
Figure 13. Images from visual servoing attempt 3
Raw Image Segmented Image
Step 1
Step 2
Raw Image Segmented Image
28
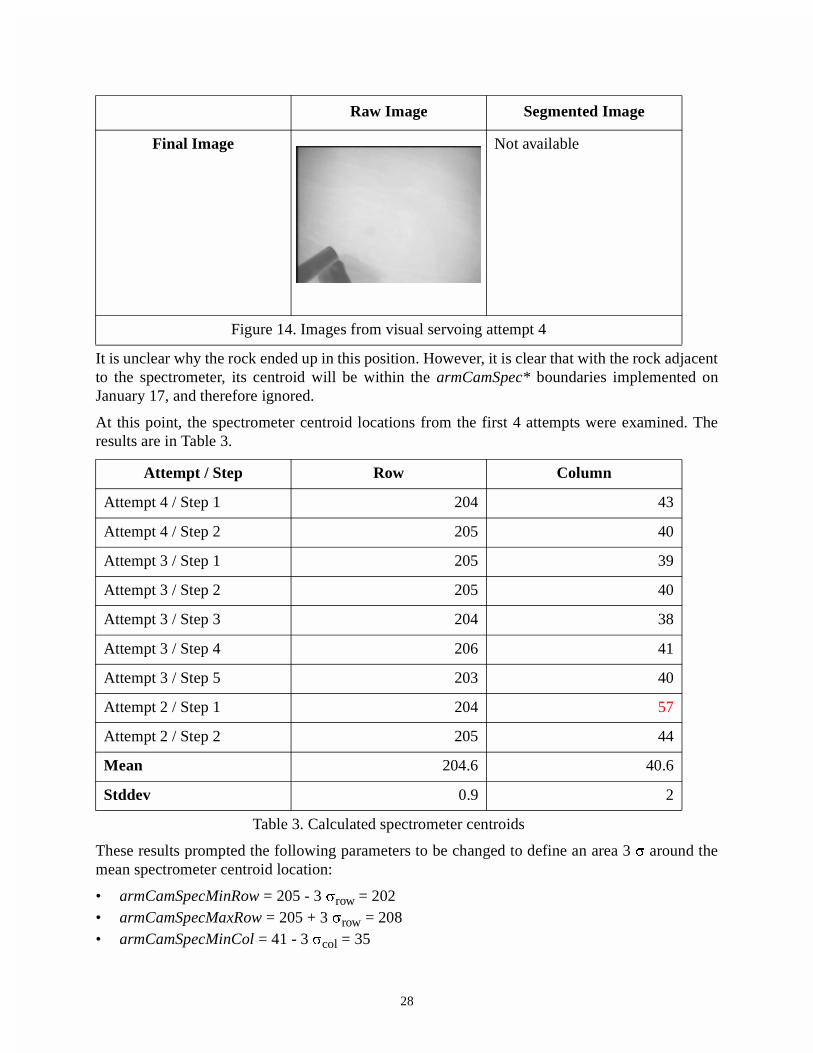
It is unclear why the rock ended up in this position. However, it is clear that with the rock adjacentto the spectrometer, its centroid will be within the armCamSpec* boundaries implemented onJanuary 17, and therefore ignored.
At this point, the spectrometer centroid locations from the first 4 attempts were examined. Theresults are in Table 3.
These results prompted the following parameters to be changed to define an area 3 V around themean spectrometer centroid location:
• armCamSpecMinRow = 205 - 3 Vrow = 202• armCamSpecMaxRow = 205 + 3 Vrow = 208• armCamSpecMinCol = 41 - 3 Vcol = 35
Final Image Not available
Figure 14. Images from visual servoing attempt 4
Attempt / Step Row Column
Attempt 4 / Step 1 204 43
Attempt 4 / Step 2 205 40
Attempt 3 / Step 1 205 39
Attempt 3 / Step 2 205 40
Attempt 3 / Step 3 204 38
Attempt 3 / Step 4 206 41
Attempt 3 / Step 5 203 40
Attempt 2 / Step 1 204 57
Attempt 2 / Step 2 205 44
Mean 204.6 40.6
Stddev 0.9 2
Table 3. Calculated spectrometer centroids
Raw Image Segmented Image
29
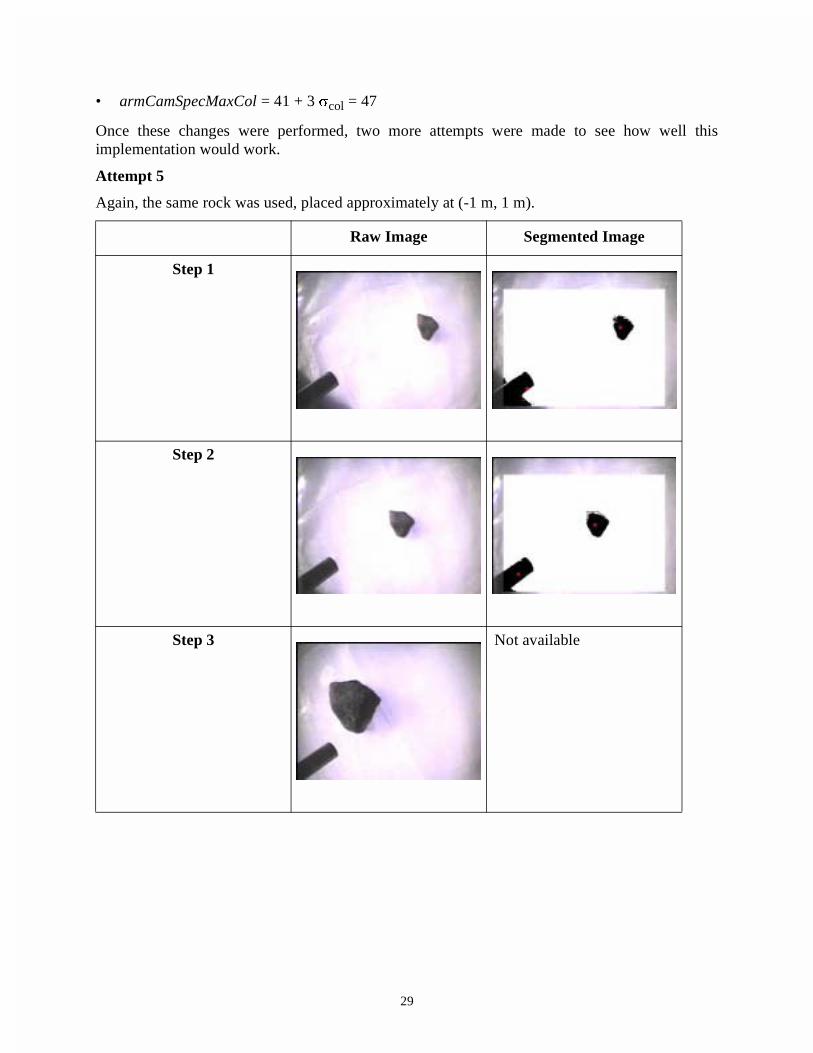
• armCamSpecMaxCol = 41 + 3 Vcol = 47
Once these changes were performed, two more attempts were made to see how well thisimplementation would work.
Attempt 5
Again, the same rock was used, placed approximately at (-1 m, 1 m).
Raw Image Segmented Image
Step 1
Step 2
Step 3 Not available
30
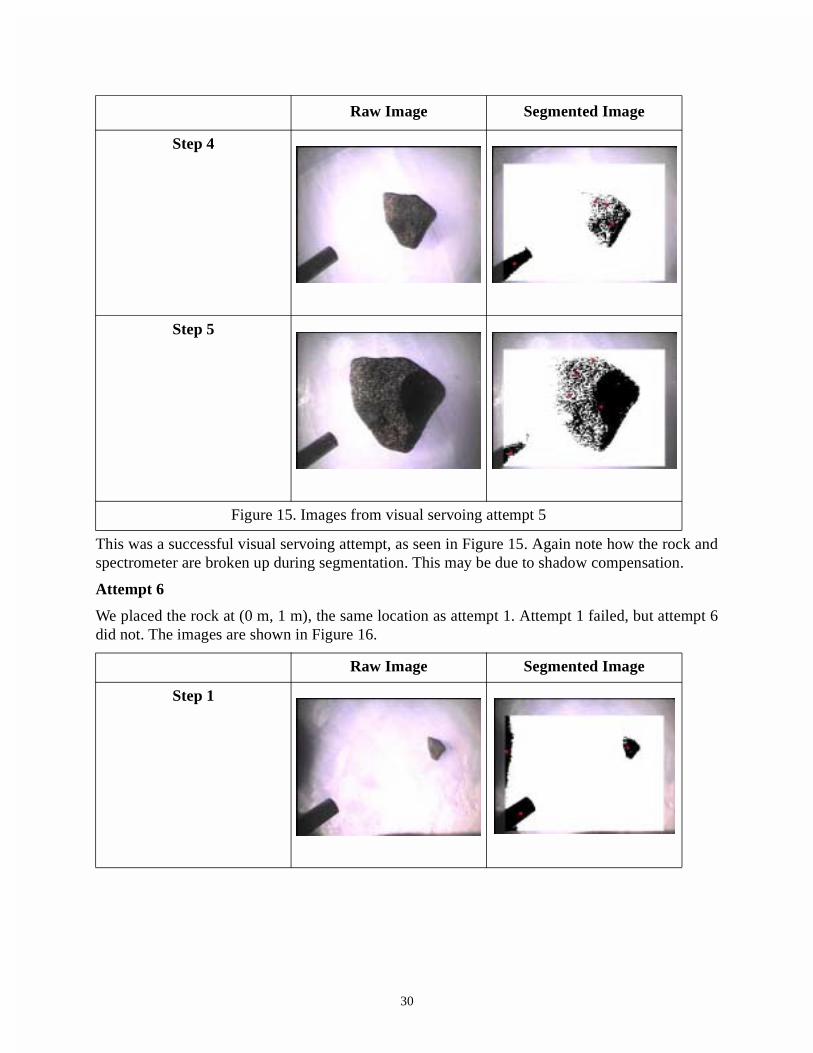
This was a successful visual servoing attempt, as seen in Figure 15. Again note how the rock andspectrometer are broken up during segmentation. This may be due to shadow compensation.
Attempt 6
We placed the rock at (0 m, 1 m), the same location as attempt 1. Attempt 1 failed, but attempt 6did not. The images are shown in Figure 16.
Step 4
Step 5
Figure 15. Images from visual servoing attempt 5
Raw Image Segmented Image
Step 1
Raw Image Segmented Image
31
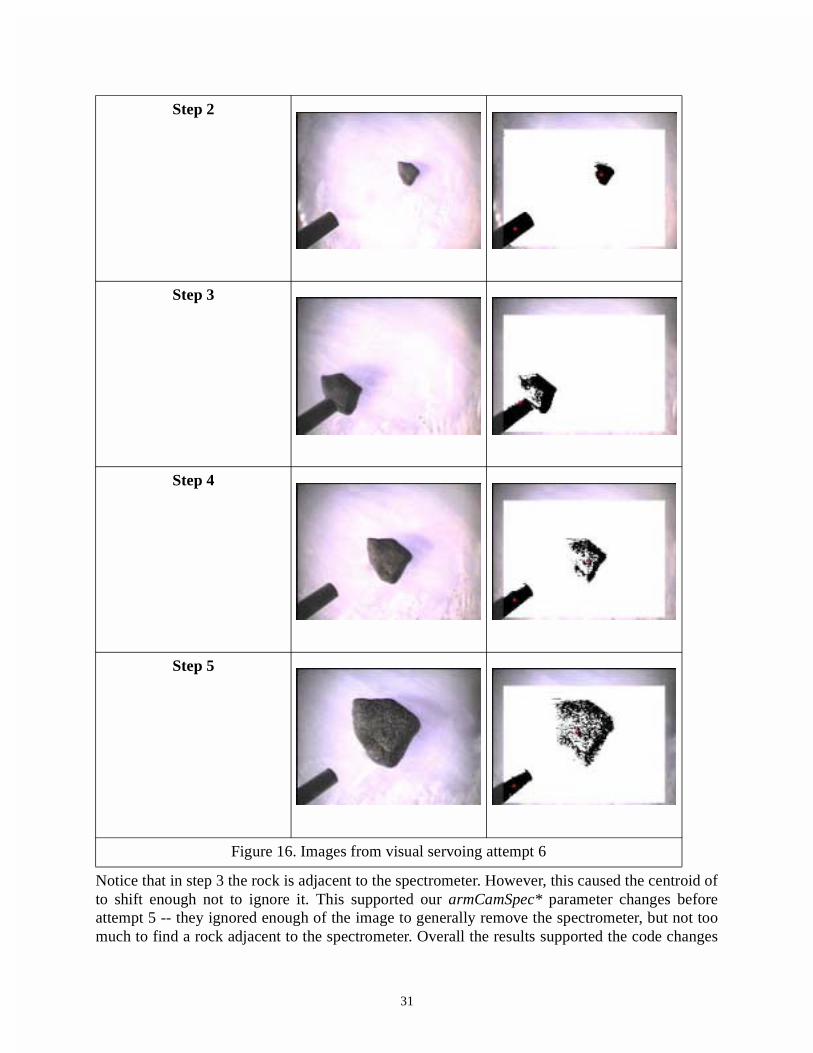
Notice that in step 3 the rock is adjacent to the spectrometer. However, this caused the centroid ofto shift enough not to ignore it. This supported our armCamSpec* parameter changes beforeattempt 5 -- they ignored enough of the image to generally remove the spectrometer, but not toomuch to find a rock adjacent to the spectrometer. Overall the results supported the code changes
Step 2
Step 3
Step 4
Step 5
Figure 16. Images from visual servoing attempt 6

32
made to eliminate the spectrometer from a list of segmented targets.
Figure 17. Top: reflectance spectrum of ID #0 (spectrometer head > 2 cm from rock), bottom: arm camera image as spectrum was being taken
33
Wrist Lowering Tests
Because the touch probe is nonfunctional, manually moving Nomad's wrist down onto the rock
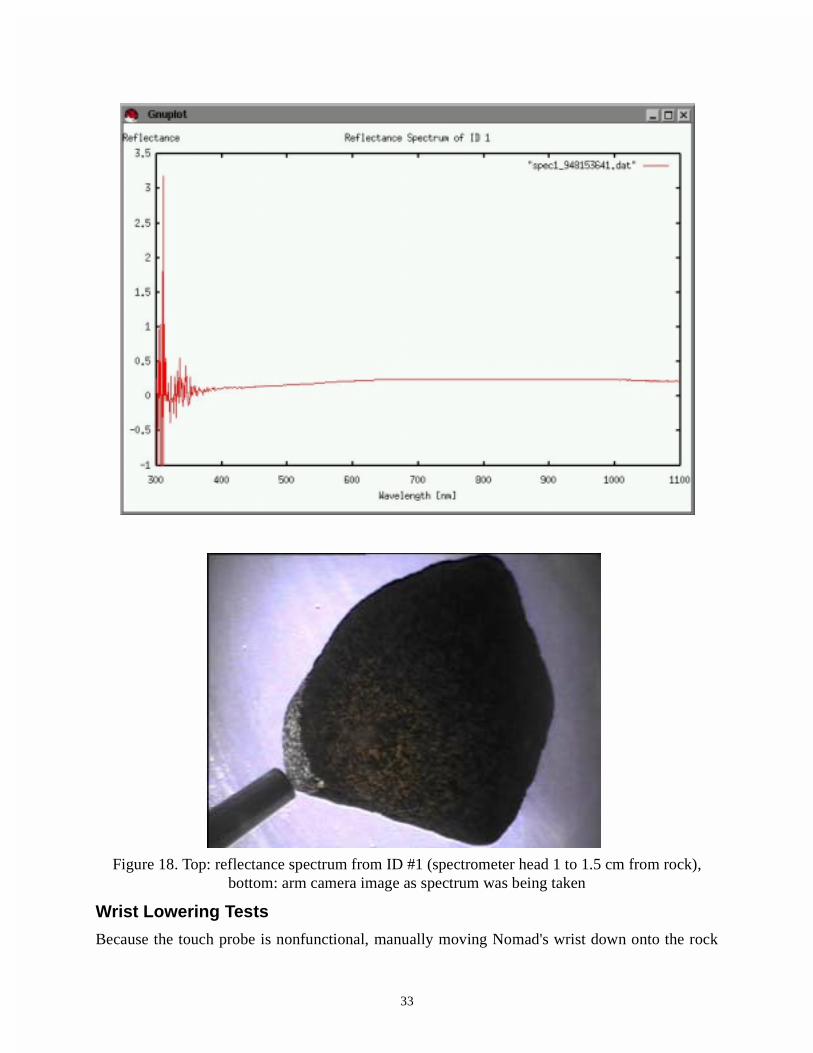
Figure 18. Top: reflectance spectrum from ID #1 (spectrometer head 1 to 1.5 cm from rock), bottom: arm camera image as spectrum was being taken
34
after its last visual servoing step is required. This involves safely lowering it from a height ofabout 15 cm. The scheme will be to use arm camera imagery to lower the wrist throughteleoperation. Someone out with the robot will be verifying that it's safe to lower each step.
Modified arm code to ask the user to jog the wrist down manually or remotely step down.
An observer went out next to the arm. An operator viewing the arm camera images from pxc_ui.The robot is running the new deploy down fully code. How this teleoperation setup works has yetto be determined.
Using the SAS, the arm was deployed to (0 m, 1 m). The rock was lost for an unknown reason. Anobserver noticed that the wrist moved down more in ArmTestBench than using the SAS.
Tried a second arm deployment. This attempt is ID 0. Observer still said it looked lower.However, spectrometer calibration worked. Visual servoing worked well, and the wrist waslowered, but when the spectrum was acquired, the sensor head was more than 2 cm from thetarget.
Tried a third arm deployment. This attempt is ID 1. Again, visual servoing worked. This time thesensor head was 1 to 1.5 cm from the rock.
Code Development
Removed some automatic report generation capabilities from the database, it was causing toomany problems and isn't important enough to deal with now.
Pattern Test
Performed a pattern search near camp. Changed targetAcqStopRow back to 240 in SAS_Config,as it was in Willy Field.
Pattern had four 20 m rows towards the left.
Target acquisition was taking around 3.2 s / image. The spectrometer calibration target wasmoved to a new height of 38.2 cm. Changed in SAS_Config.
First pattern had to be aborted because human error caused SAS software to get caught in a loop.
See [8] for more results.
Code Changes
Additionally, the following variables were added to SAS_Config, so that all segmentationparameters would be tunable:
• lineRatio• maxStddevRatio• CBlue• CGreen• targetAdjBoundary• targetLineRatio• minPixels
35
Arm Camera Segmentation Tests
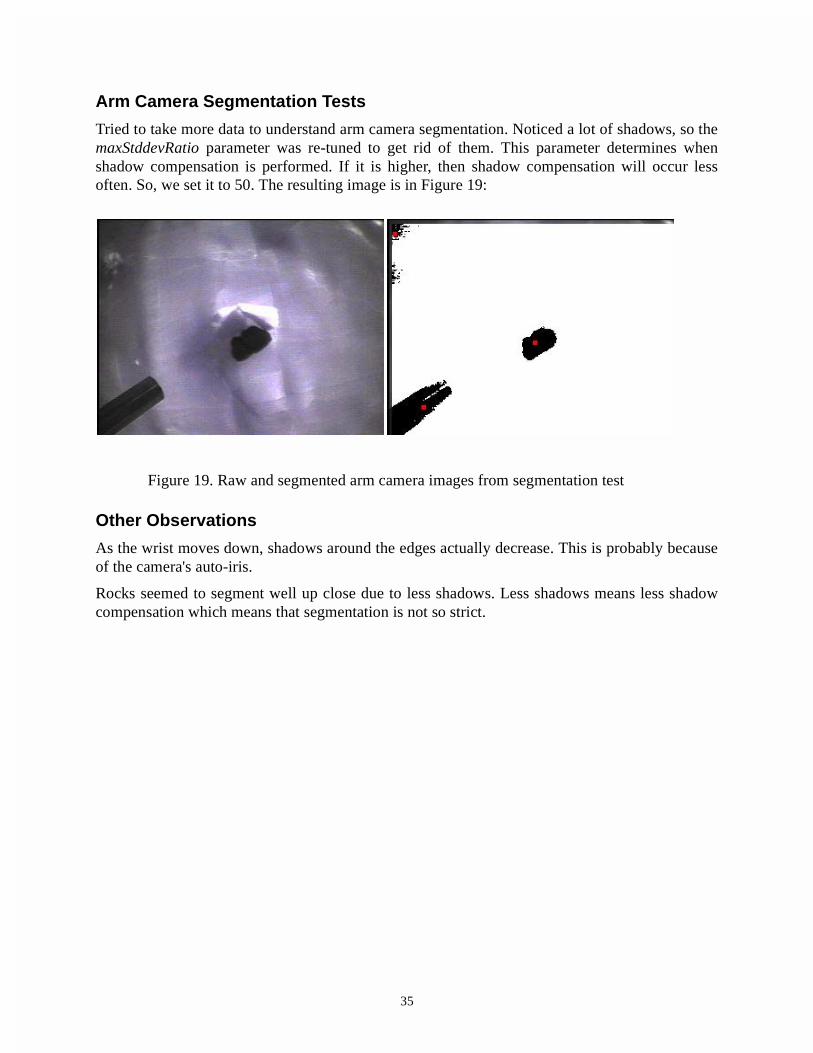
Tried to take more data to understand arm camera segmentation. Noticed a lot of shadows, so themaxStddevRatio parameter was re-tuned to get rid of them. This parameter determines whenshadow compensation is performed. If it is higher, then shadow compensation will occur lessoften. So, we set it to 50. The resulting image is in Figure 19:
Other Observations
As the wrist moves down, shadows around the edges actually decrease. This is probably becauseof the camera's auto-iris.
Rocks seemed to segment well up close due to less shadows. Less shadows means less shadowcompensation which means that segmentation is not so strict.
Figure 19. Raw and segmented arm camera images from segmentation test
36
Experimenter's Notebook - January 19, 2000
Surveyed Line Test
Changed some code to save all necessary data for this test:
• Changed arm camera code to save all initial and segmented images with time stamped names.• Changed targetAcqMain to save raw target acquisition images even if no targets are found.• Changed acqHiResDriver to save unsegmented image file names in telemetry.
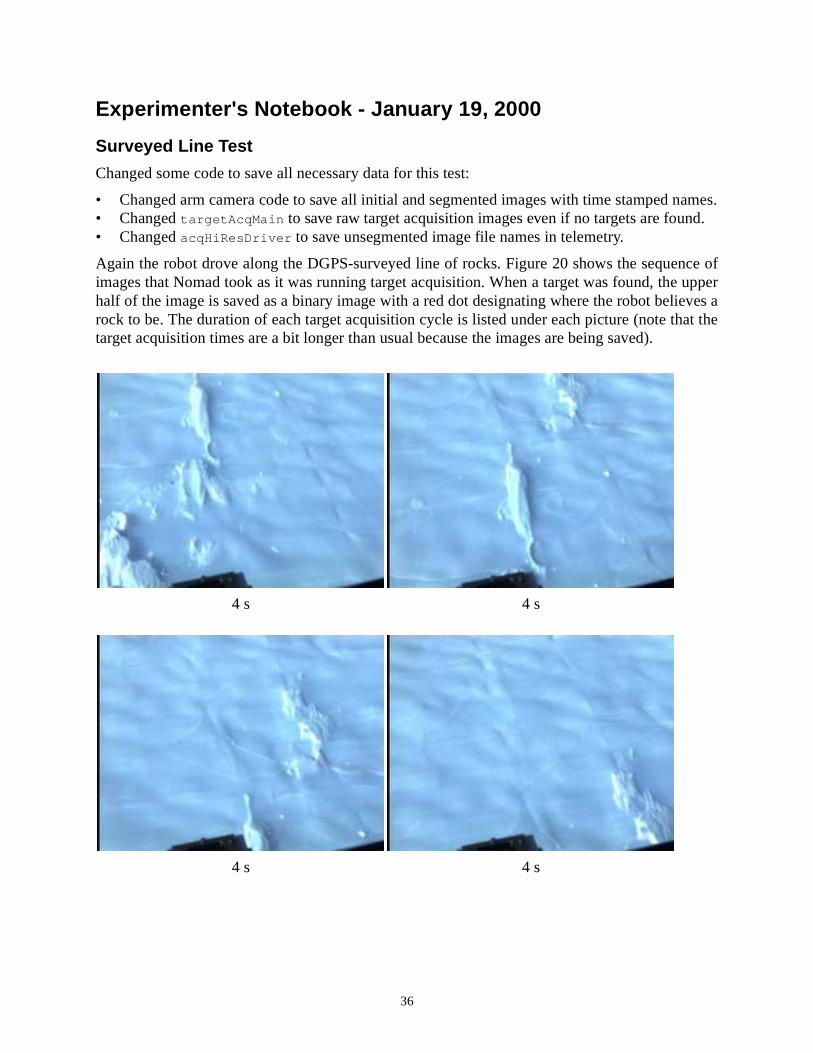
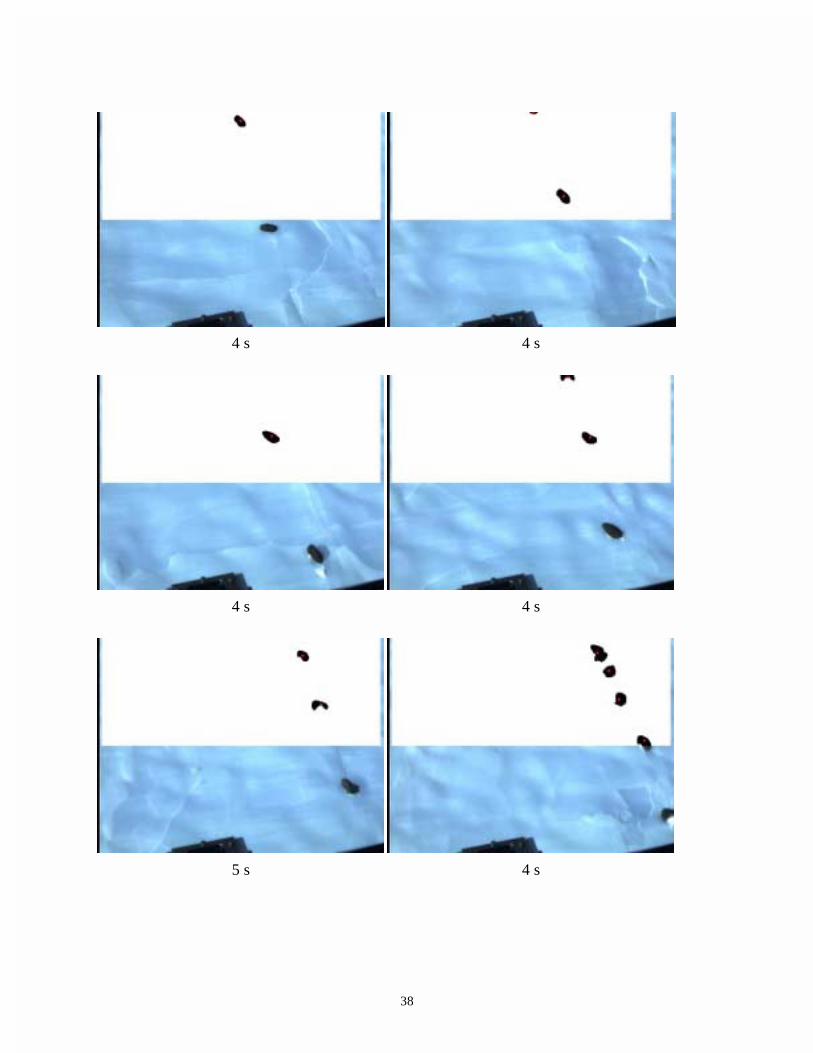
Again the robot drove along the DGPS-surveyed line of rocks. Figure 20 shows the sequence ofimages that Nomad took as it was running target acquisition. When a target was found, the upperhalf of the image is saved as a binary image with a red dot designating where the robot believes arock to be. The duration of each target acquisition cycle is listed under each picture (note that thetarget acquisition times are a bit longer than usual because the images are being saved).
4 s 4 s
4 s 4 s

37
4 s 4 s
4 s 4 s
4 s 5 s
38
4 s 4 s
4 s 4 s
5 s 4 s
39
See [9] for all targets found along with their location. In the second sheet all of the target rows andcolumns as well as camera state are listed for future reconstruction efforts.
Arm Camera Image Segmentation Test
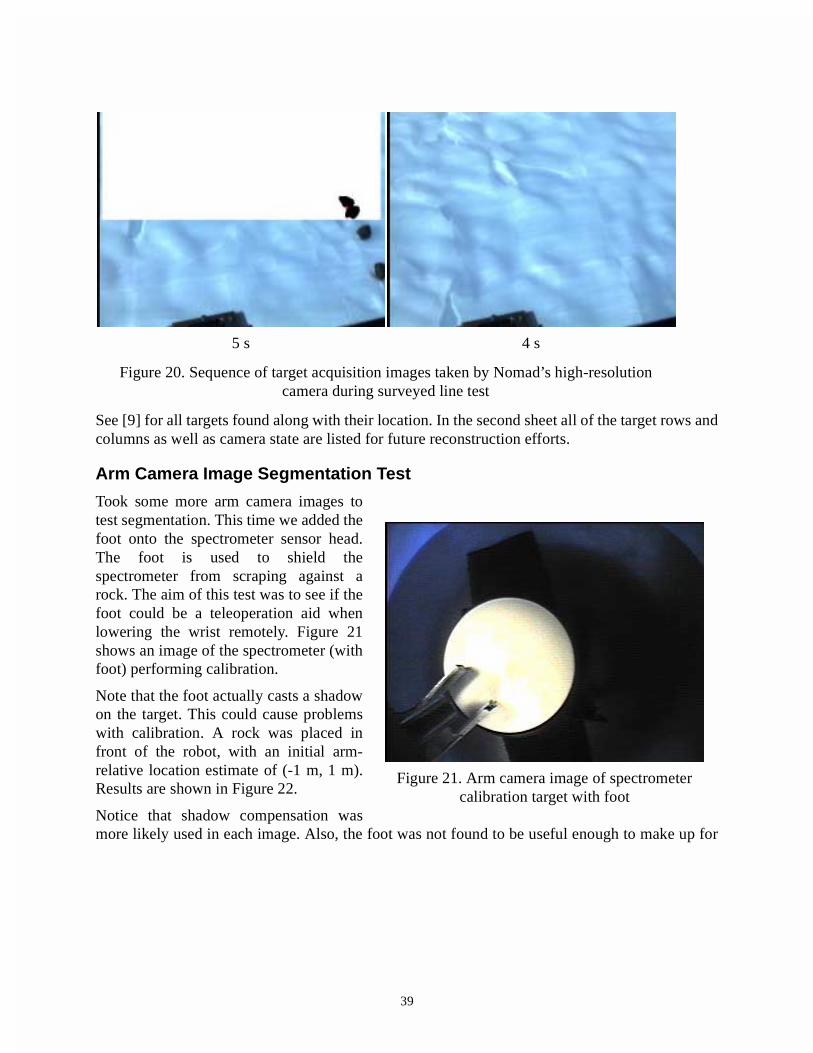
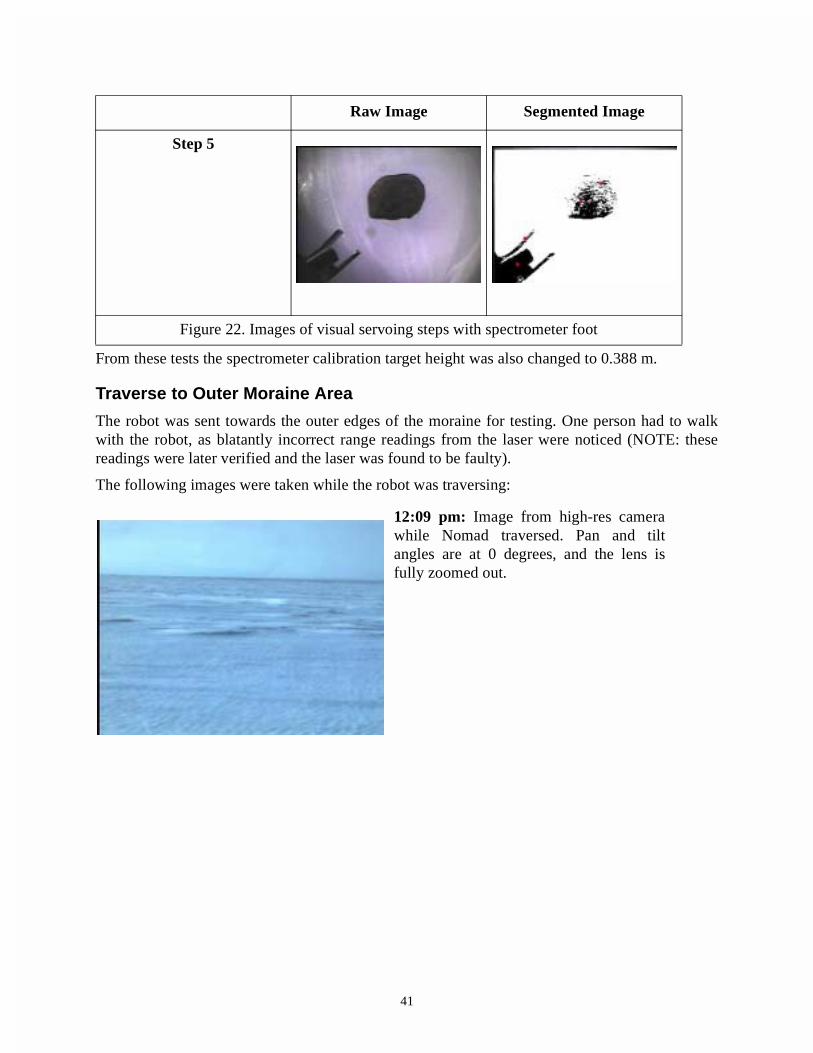
Took some more arm camera images totest segmentation. This time we added thefoot onto the spectrometer sensor head.The foot is used to shield thespectrometer from scraping against arock. The aim of this test was to see if thefoot could be a teleoperation aid whenlowering the wrist remotely. Figure 21shows an image of the spectrometer (withfoot) performing calibration.
Note that the foot actually casts a shadowon the target. This could cause problemswith calibration. A rock was placed infront of the robot, with an initial arm-relative location estimate of (-1 m, 1 m).Results are shown in Figure 22.
Notice that shadow compensation wasmore likely used in each image. Also, the foot was not found to be useful enough to make up for
5 s 4 s
Figure 20. Sequence of target acquisition images taken by Nomad’s high-resolution camera during surveyed line test
Figure 21. Arm camera image of spectrometer calibration target with foot

40
the extra image space it occupied.
Raw Image Segmented Image
Step 1
Step 2
Step 3
Step 4
41
From these tests the spectrometer calibration target height was also changed to 0.388 m.
Traverse to Outer Moraine Area
The robot was sent towards the outer edges of the moraine for testing. One person had to walkwith the robot, as blatantly incorrect range readings from the laser were noticed (NOTE: thesereadings were later verified and the laser was found to be faulty).
The following images were taken while the robot was traversing:
Step 5
Figure 22. Images of visual servoing steps with spectrometer foot
12:09 pm: Image from high-res camerawhile Nomad traversed. Pan and tiltangles are at 0 degrees, and the lens isfully zoomed out.
Raw Image Segmented Image

42
At 1 pm, the tent's generator ran out of gas, and contact was temporarily lost with the robot.
Pattern Test
This test is similar to the pattern tests performed earlier, except it is around 1 km from camp and issearching through the outer edges of a natural moraine area.
When the arm was deployed to the first target found (ID 0), the arm camera segmentation lookedquite good. Here are the centroid pixel coordinates of the spectrometer head in these image:
12:22 pm: Warped panoramic imagetaken during traverse.
12:48 pm: Screen shot of Nomad'steleoperation interface. It displayed liveimages from any of Nomad's threecameras at rates from 0.3 to 0.5 Hz, evenwhen the robot was 1.2 km away. Imagesare in grayscale to reduce bandwidth. Inthis screen shot, a high-resolution imageshows a skidoo following along sideNomad.
Figure 23. Some images taken during Nomad’s traverse into the moraine
43
These results led to change armCamSpecMinRow to 205, armCamSpecMaxRow to 215,armCamSpecMinCol to 35 and armCamSpecMaxCol to 50. These error margins are a bit larger toaccommodate some cases previously seen.
Also implemented the capability to step the wrist down by variable increments.
At this point it was noticed that the rocks encountered by the robot varied in height quite a bit.Could they just be skipped over by ignoring large targets? If they're too big, the final visualservoing step will run the wrist into the rock. Can the final step height be raised to 0.25 m? Thisfinal height was tried on ID 0 again, but it was very high and required a lot of time forteleoperation to lower it. The final step height was changed back to 0.15 m. If a big rock isencountered, a manual intervention will tell the robot to skip over it.
For ID 3, the robot found no targets when it deployed the high-res camera. There were, in fact, notargets there. Therefore, although target acquisition found something, the high-res sensordeployment didn't. Perhaps the robot could ignore the target if nothing is found in the high-resimage?
See [10] for more information.
Conclusions:
• If high-res camera deploys on a target and sees nothing, there's probably no rock, so justignore the target from then onward.
• Set a maximum number of pixels that an acquired target can have. This way, large rocks willstill be segmented, but they won't show up as target IDs in the database.
• It would be good to have an option to ignore many targets at once in the mission planner.• Decrease maxTargetsInData from 20 to about 5. Also check to see if target acquisition finds
more than this number of targets - if so, it's probably bogus, so ignore all of these targets.(Actually, the number was set to 10 rather than 5).
Code Changes• Defined a specific sensor manager status to send to the mission planner if no targets are found
in high-res image data. This status will inform the mission planner that it should ignore thecurrent target ID.
• Decreased maxTargetsInData from 20 to 10.• Added targetAcqBottomMaxPix (set to 40000), targetAcqTopMaxPix (set to 12500) and
armCamMaxPix (set to 76800) to SAS_Config. Used these to ignore big rocks in targetacquisition code.
Row Column
210 44
210 45
212 39
Table 4. Calculated centroid pixel coordinates of spectrometer head in arm camera images

44
Experimenter's Notebook - January 20, 2000Wind chill today was about -40 C.
Code Development
Took an image of two larger rocks onblue ice with the high-res camera in targetacquisition position (see Figure 24).
The top rock fits in a box of 83 x 87pixels. This is a total size of 7221 pixels.The bottom rock fits in a box of 97 x 76pixels. This is a total size of 7372 pixels.The variable targetAcqTopMaxPix wastherefore set to 7200 pixels whiletargetAcqBottomMaxPix was set to 7300pixels.
Altered arm control module to take 4spectra of each rock. It pauses beforetaking each spectrum and puts them allinto the database as separate readings of asingle ID.
Pattern Test
Performed another search test in the same location as yesterday. The robot travelled in 200 m longrows. The pattern was started at approximately 10:20 am local time.
Visual servoing failed for the fifth target found (ID 4) failed because the rock was very small andshadowed. Figure 25 shows the initial step, where it failed.
Raw image Segmented image
Figure 25. Images from visual servoing to ID #4
Figure 24. Two rocks on blue ice
45
Note that visual servoing did not stop to ask for manual intervention because the shadows weresegmented as a target. However, this shows how small a rock could be found.
After many false targets and 8 targets in one image, the pattern was paused and segmentationtested. A few images were grabbed in target acquisition test mode, and it was determined that thepattern should resume but in a new direction -- too many shadows were causing problems with thesun behind the robot. Also, the following parameters were changed:
• targetAcqStddev is now 10• targetAcqPercentage is now 0.65• targetAcqStartRow is now 5
After this was done, more false positives were found. The test was stopped, and another begun.Although the database information for this test is not available, it had very similar results, withway too many false positives. It too was stopped, and targetAcqPercentage was lowered to 0.60 totry to remedy the situation.
See [11] for all other statistics.
Traverse to the Meteorite Area
Moved the robot to another area, where a meteorite had found during a skidoo traverse.
This meteorite area is about 0.8 km from base camp.
Meteorite Demo #0
Once in the meteorite demo area, this demonstration, the first of the expedition, was held. In thesedemonstrations, there is no pausing to recompile code or change parameters in SAS_Config.There is minimal communication over VHF radios between camp and the people in the robot. Theonly acceptable communications are during wrist lowering and to verify false or missed targetsafter the robot has processed them. If the person with the robot determines that it may run over ameteorite, he/she will hit it's e-stop button, and use the joystick to drive the robot around themeteorite. The robot will be re-enabled and the pattern then resumed.
The demonstration consisted of 30 m rows running to the right. See [12] for all the statistics.
Conclusions:
• Segmentation seemed OK, there were no false targets.• Maybe the robot shouldn't show out targets if high-res fails? (this was never changed)• DGPS estimates look bad.• The robot runs over 50% of rocks because tire tracks cover 50% of search area.
Debugging DGPS Estimates
From the last few tests' results, it seems that the target acquisition DGPS estimates are off. Wechecked the laser range data, and found that the ground appeared to be shifted up about 1 degree.This could mean that sensors and/or the sensor mast have tilted down (in the negative tiltdirection). This could be causing the problems we've been seeing. So, the following variableswere added to SAS_Config: dgpsEstRelXFudge, dgpsRelYFudge and dgpsRelZFudge. Thesefudge factors are added to the robot-relative frame when calculating estimated DGPS locations.
46
Experimenter's Notebook - January 21, 2000
Debugging DGPS Estimates
After thinking more about the DGPS fudge factors, they were changed from relative x, y, zdistances to relative pan/tilt angles. So now the fudge factors used are dgpsEstRelPanFudge anddgpsEstRelTiltFudge. The pan fudge should be 0, and the tilt fudge is set to -2.0 degrees. Theseshould be used instead because the errors in the system come from the sensors slipping.
Pattern Test
The goal of this task is to test the latest changes in a natural pattern. This pattern was performednear demo 0. If the robot approaches the meteorite in this region, we will also test the ability topause the pattern, have the robot joysticked around the robot by someone in the field and the toresume the pattern.
It seemed that the database lost the file name of the last spectrum saved.
The spectrometer had to be calibrated on each arm deployment for this test because eachdeployment took 4 spectra.
See [13] for more information.
Conclusions:
• Target acquisition segmentation looked good.• Target acquisition DGPS estimates looked good.• Taking 4 spectra each time is really slow -- from now on just take 2.• Too many targets in when re-acquiring targets before deploying the arm should not result in an
error. This can occur because the arm itself could be in the image, but since re-acquisitionselects the new target with a DGPS estimate closest to the initial estimate, it should never beselected.
Meteorite Demo #1
Demonstration conducted in the same area as demo #0. It was started at approximately 15:30 localtime, with a 60 m x 40 m pattern, rows going to the right.
See [12] for all the statistics.
Conclusions:
• Arm camera segmentation shouldn't fail when too many targets are found. Most of the time,too many targets means shadows are present. If it were considered very conservatively, therobot could prompt for manual assistance in this case, but an operating assumption will be thatmost of the time the real rock will be found in all of those targets.
• A bug caused the second spectrum file name not to be placed in the database. Therefore theclassifier had problems with it. Only 1 spectrum should be taken of each rock in ademonstration.
• Perhaps armCamPixelSize should be increased from 40 to keep smaller rocks?
47
Experimenter's Notebook - January 22, 2000
Pattern Test
Started this test at about 10:00 local time. It took place around the same location as meteoritedemos #0 and #1. The sky was very clear.
Immediately after starting, 9 false positives were found. PTU position mismatch occurred, andhiResSensor had to be restarted. Next several real rock targets were acquired, only to have thecamera miss them when deployed. Finally 8 more targets were found at once, with only 1 realrock there. The pattern was stopped, and the science autonomy system was taken down as theteam evaluated what went wrong.
Two test runs were performed in which therobot is driven along a straight line withtarget acquisition running. When the robotdrove in the same direction in which thepattern had been executed, shadows werecommon (the sun was behind the robot) andoften caused segmentation to fail.
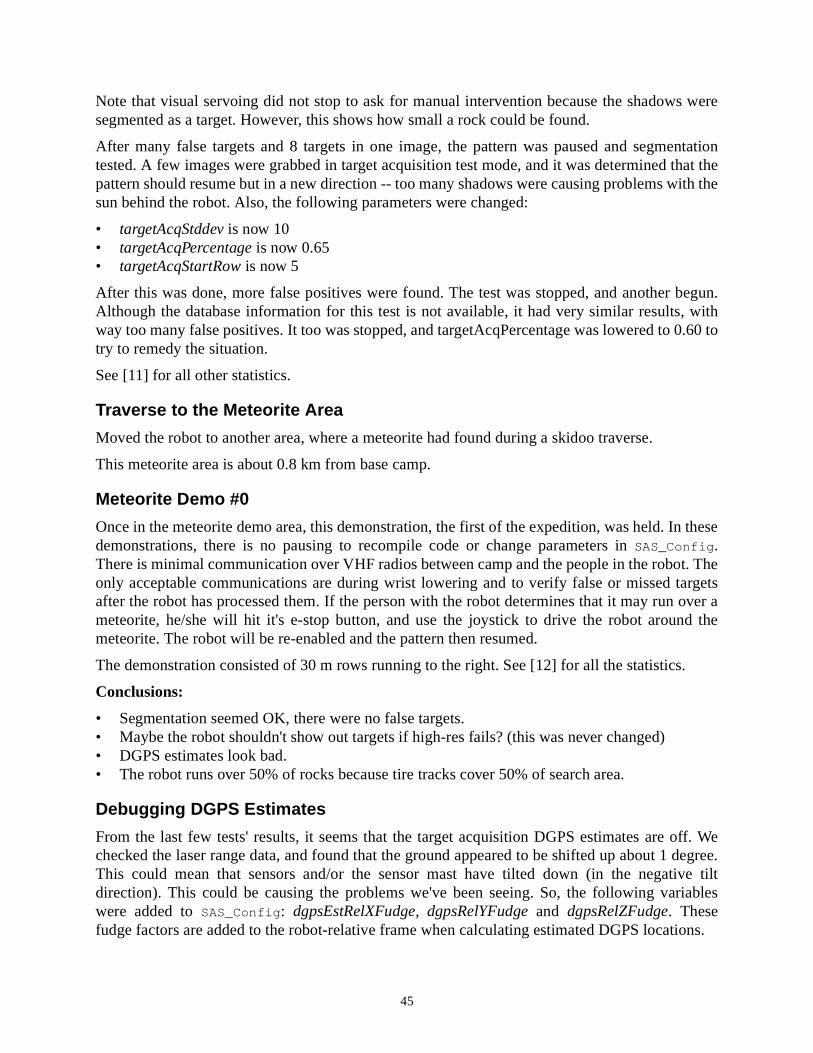
In Figure 26, the robot's shadow is cast intothe area of target acquisition. This causes theshadow compensation routines to run, whichcauses darker pixels to be ignored. In thiscase, the rock in the upper left corner of theimage was ignored. Furthermore, so manyshadows cause the auto-iris to open up,making ice look even brighter that usual.
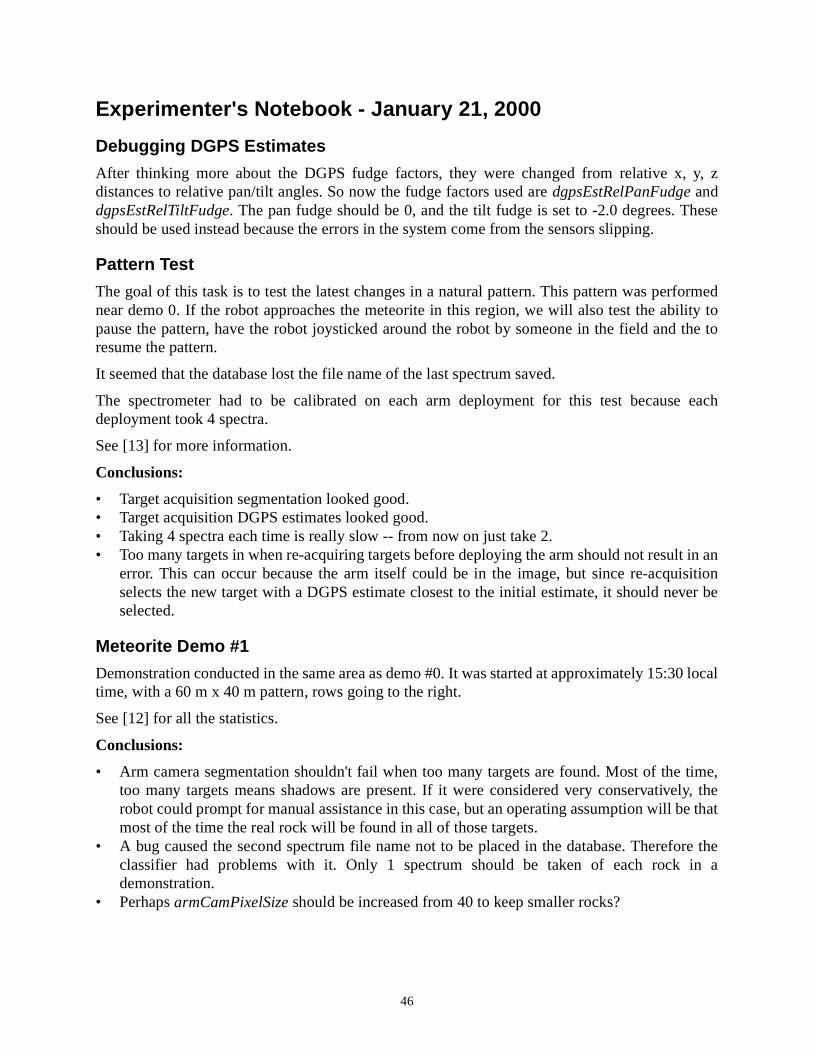
When the robot was turned so the sun wasshining on the side of the it, segmentationworked more effectively. However, even inthis case, once three targets were all assignedto one rock.
In Figure 27, notice that now the shadows arenot seen, and the ice looks a bit lessoverexposed. However, the rock in thispicture was segmented into three distincttargets.
The conclusions from this test were that thepattern should be performed in this newdirection perpendicular to the sun's rays, andthat it would be good to add code that wouldcombine multiple targets whose DGPS estimates are very close together.
After this, a new pattern was begun. Before the first spectrometer calibration, the arm was notproperly stowed, so when it moved into calibration position, it was misaligned. In another case
Figure 26. Rocks on blue ice with sun behind Nomad
Figure 27. Rock on blue ice without shadows
48
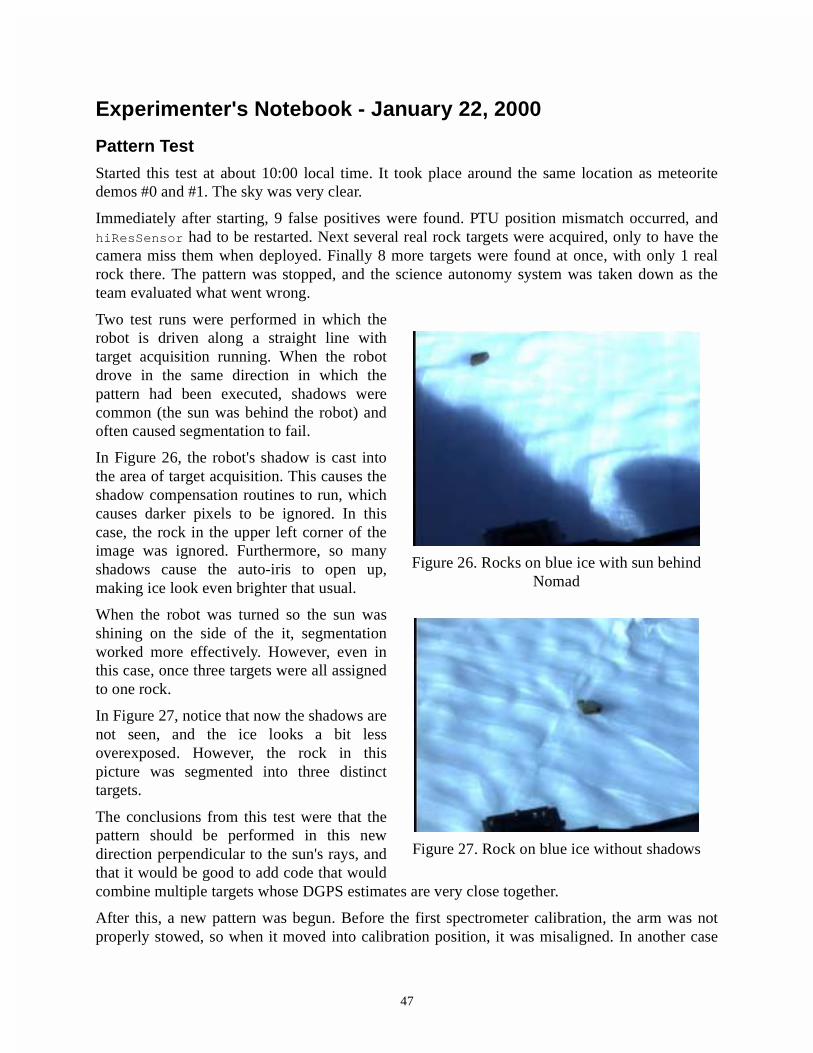
(ID 3), the high-resolution camera servoing seemed to be working well, but in the last step, thearm ended up in the image. The visual servoing steps are shown in Figure 28. Notice that in thefirst image, the rock is just barely visible at the bottom -- this is probably due to a very bad DGPSestimate.
Step Image
Step 1
The rock is barely visible at the bottom
Step 2
Now it is well aligned
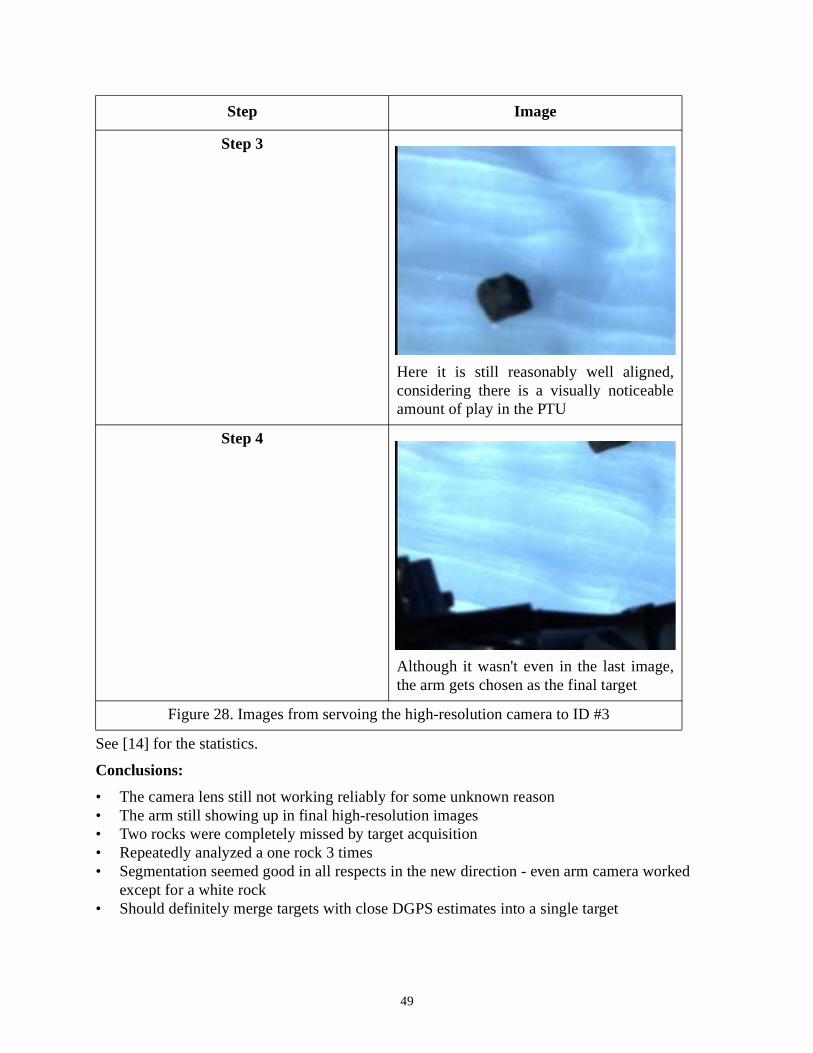
49
See [14] for the statistics.
Conclusions:
• The camera lens still not working reliably for some unknown reason• The arm still showing up in final high-resolution images• Two rocks were completely missed by target acquisition• Repeatedly analyzed a one rock 3 times• Segmentation seemed good in all respects in the new direction - even arm camera worked
except for a white rock• Should definitely merge targets with close DGPS estimates into a single target
Step 3
Here it is still reasonably well aligned,considering there is a visually noticeableamount of play in the PTU
Step 4
Although it wasn't even in the last image,the arm gets chosen as the final target
Figure 28. Images from servoing the high-resolution camera to ID #3
Step Image
50
Meteorite Demo #2
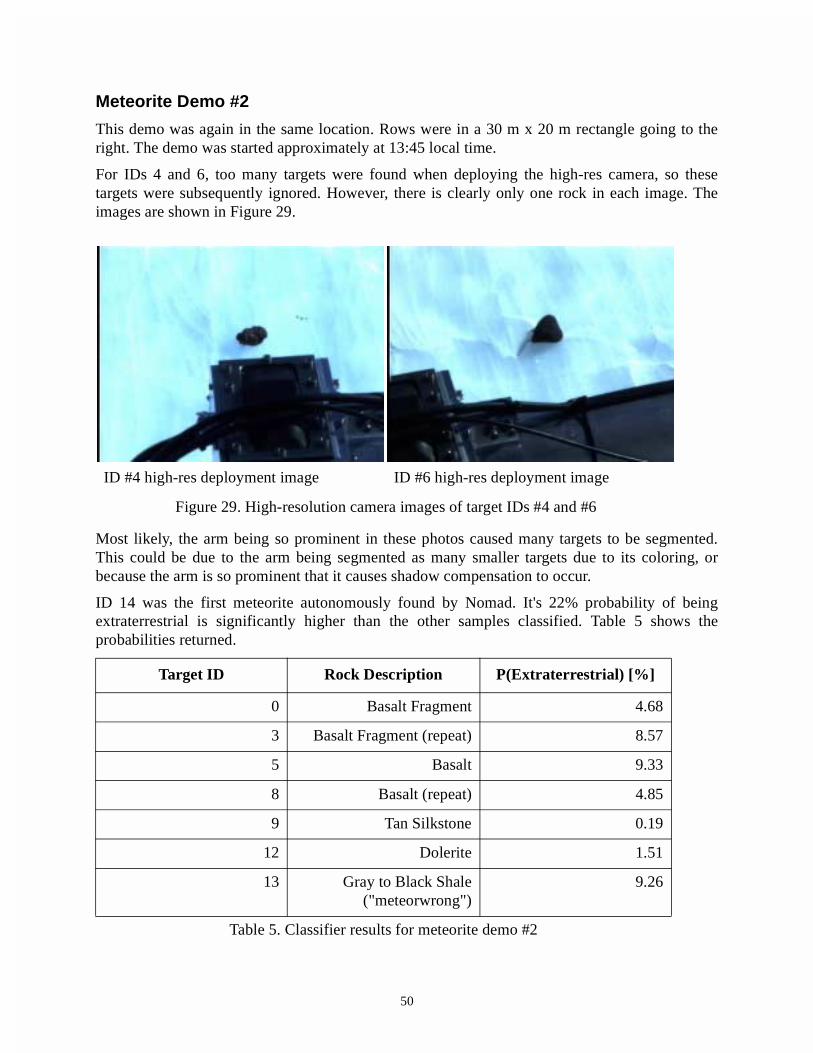
This demo was again in the same location. Rows were in a 30 m x 20 m rectangle going to theright. The demo was started approximately at 13:45 local time.
For IDs 4 and 6, too many targets were found when deploying the high-res camera, so thesetargets were subsequently ignored. However, there is clearly only one rock in each image. Theimages are shown in Figure 29.
Most likely, the arm being so prominent in these photos caused many targets to be segmented.This could be due to the arm being segmented as many smaller targets due to its coloring, orbecause the arm is so prominent that it causes shadow compensation to occur.
ID 14 was the first meteorite autonomously found by Nomad. It's 22% probability of beingextraterrestrial is significantly higher than the other samples classified. Table 5 shows theprobabilities returned.
ID #4 high-res deployment image ID #6 high-res deployment image
Figure 29. High-resolution camera images of target IDs #4 and #6
Target ID Rock Description P(Extraterrestrial) [%]
0 Basalt Fragment 4.68
3 Basalt Fragment (repeat) 8.57
5 Basalt 9.33
8 Basalt (repeat) 4.85
9 Tan Silkstone 0.19
12 Dolerite 1.51
13 Gray to Black Shale("meteorwrong")
9.26
Table 5. Classifier results for meteorite demo #2

51
The meteorite was given the field number 12067 by John Schutt. Including the meteorite itself,the mean extraterrestrial probability is 8.61%, V = 6.75%. Therefore the meteorite's probabilitywas 1.97 V from the mean.
See [12] for all the statistics.
14 Meteorite 12067 21.89
Target ID Rock Description P(Extraterrestrial) [%]
Table 5. Classifier results for meteorite demo #2
52
Experimenter's Notebook - January 23, 2000
Collecting Meteorite Spectra
The robot was left in front of meteorite 12067, and was commanded to take many spectra of it.This was not a search, simply visual servoing, storing the spectra and classification based on thesespectra.
During these tests very frequent “SCA1” stop code errors were observed. This error in the armmotion control hardware means “independent move finished”. This may not be bad, but thesoftware thought it was. The test had to be cut short and spectra taken manually afterwards.
See [15] for statistics.
Conclusions:
• SCA1 may not be bad -- added code to prompt user to a success status even after an 'illegal'stop code.
• Not sure where SCA1's are coming from, but the arm joint encoders should be tested just incase.
• Classifier classified the same meteorite with probabilities of 9.7% and then 87%P(extraterrestrial). Not sure why this is happening.
After this the robot drove back to camp.
Arm Encoder Tests
Added the ability to query encoder position in ArmTestBench. Table 6 gives the results of aninvestigation of the arm joint encoders.
Joint / Absolute Angle [deg]
Potentiometer Voltage [V]
Potentiometer Angle [deg]
Encoder Angle [deg]
Joint 1
180 6.06 179.66 -0.57
160 4.82 160.11 -20.19
140 3.68 140.26 -40.1
120 2.57 120.1 -60.23
100 1.43 100.47 -80.05
90 0.85 90.11 -90.3
Joint 2
80 0.28 80.17 -100.45
60 -0.86 60.21 -120.77
Table 6. Results of arm joint encoder tests
53
Note that the sense of joint 2 is opposite that of joint 1, therefore putting joint 2 at 80 degrees inthe real world results in the joint 2 encoder reading 180 - 80 degrees = 100 degrees.
Finally tested visual servoing was tested by going rocks to the following estimated locations tosee if we could get the SCA1 problem. See Table 7 for explanation.
No SCA1 errors were seen. Therefore, there seems to be no systematic error, the encoders justcould be flaky.
40 -1.99 39.7 -140.92
Arm Relative X Location [m[
Arm Relative Y Location [m]
Results
0 1 Success
-0.1 1.3 Success
-0.3 1.5 Failed - target out of reach
Table 7. Results of an arm servoing test
Joint / Absolute Angle [deg]
Potentiometer Voltage [V]
Potentiometer Angle [deg]
Encoder Angle [deg]
Table 6. Results of arm joint encoder tests
54
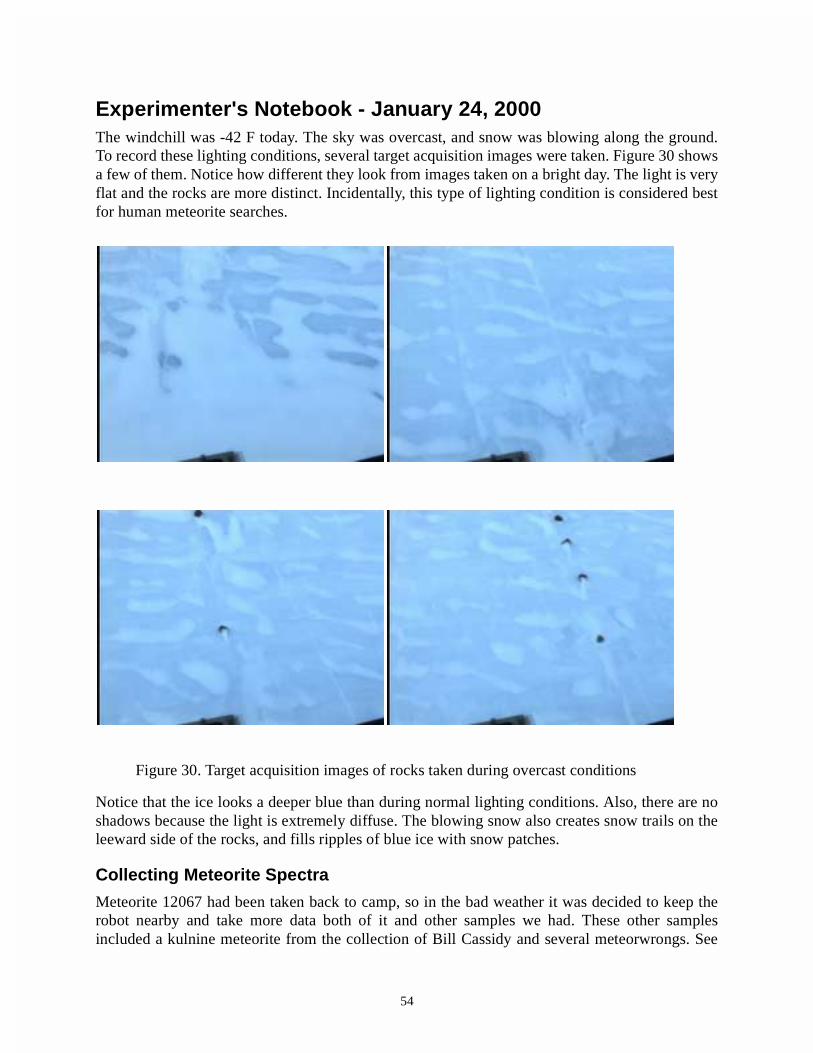
Experimenter's Notebook - January 24, 2000The windchill was -42 F today. The sky was overcast, and snow was blowing along the ground.To record these lighting conditions, several target acquisition images were taken. Figure 30 showsa few of them. Notice how different they look from images taken on a bright day. The light is veryflat and the rocks are more distinct. Incidentally, this type of lighting condition is considered bestfor human meteorite searches.
Notice that the ice looks a deeper blue than during normal lighting conditions. Also, there are noshadows because the light is extremely diffuse. The blowing snow also creates snow trails on theleeward side of the rocks, and fills ripples of blue ice with snow patches.
Collecting Meteorite Spectra
Meteorite 12067 had been taken back to camp, so in the bad weather it was decided to keep therobot nearby and take more data both of it and other samples we had. These other samplesincluded a kulnine meteorite from the collection of Bill Cassidy and several meteorwrongs. See
Figure 30. Target acquisition images of rocks taken during overcast conditions

55
[16] for more information.
Afterwards, the robot drove to the second meteorite site, which was approximately 0.7 km to thenorth northwest of the base camp. At this site, 3 meteorites had been found previously. Along withone other rock, these were the only samples in the area. Such an extremely low rock density istypical for blue ice.
56
Experimenter's Notebook - January 25, 2000
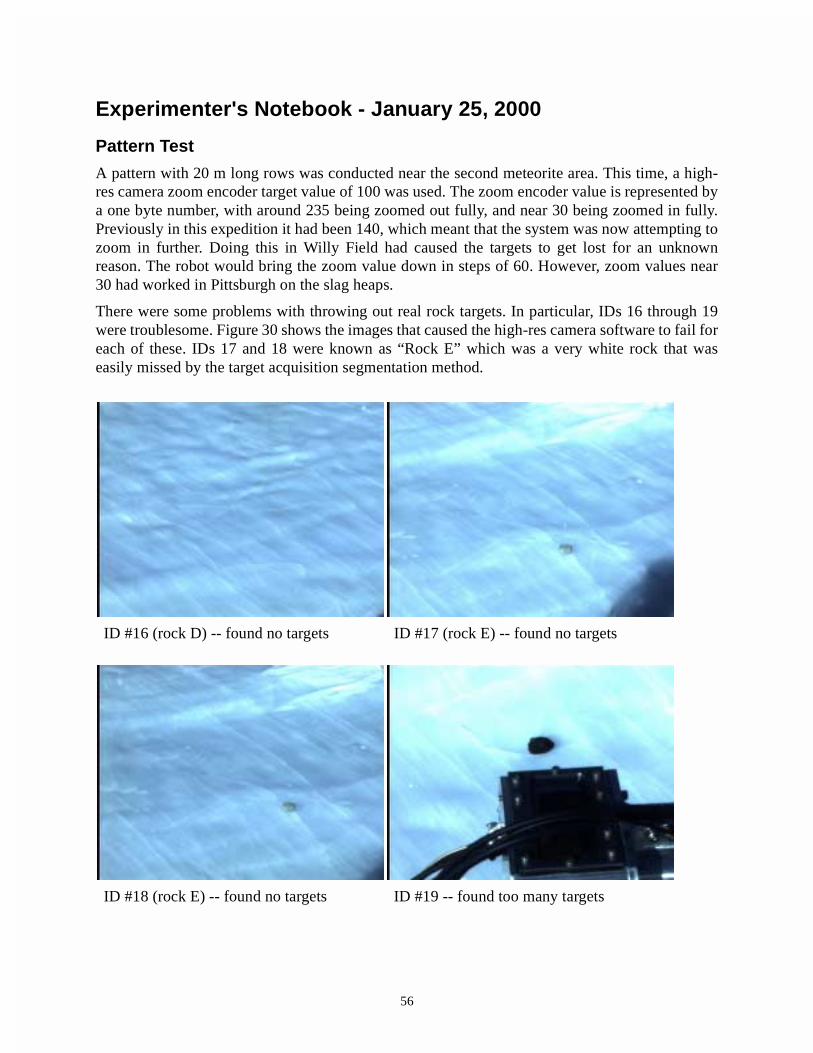
Pattern Test
A pattern with 20 m long rows was conducted near the second meteorite area. This time, a high-res camera zoom encoder target value of 100 was used. The zoom encoder value is represented bya one byte number, with around 235 being zoomed out fully, and near 30 being zoomed in fully.Previously in this expedition it had been 140, which meant that the system was now attempting tozoom in further. Doing this in Willy Field had caused the targets to get lost for an unknownreason. The robot would bring the zoom value down in steps of 60. However, zoom values near30 had worked in Pittsburgh on the slag heaps.
There were some problems with throwing out real rock targets. In particular, IDs 16 through 19were troublesome. Figure 30 shows the images that caused the high-res camera software to fail foreach of these. IDs 17 and 18 were known as “Rock E” which was a very white rock that waseasily missed by the target acquisition segmentation method.
ID #16 (rock D) -- found no targets ID #17 (rock E) -- found no targets
ID #18 (rock E) -- found no targets ID #19 -- found too many targets
57
See [17] for statistics.
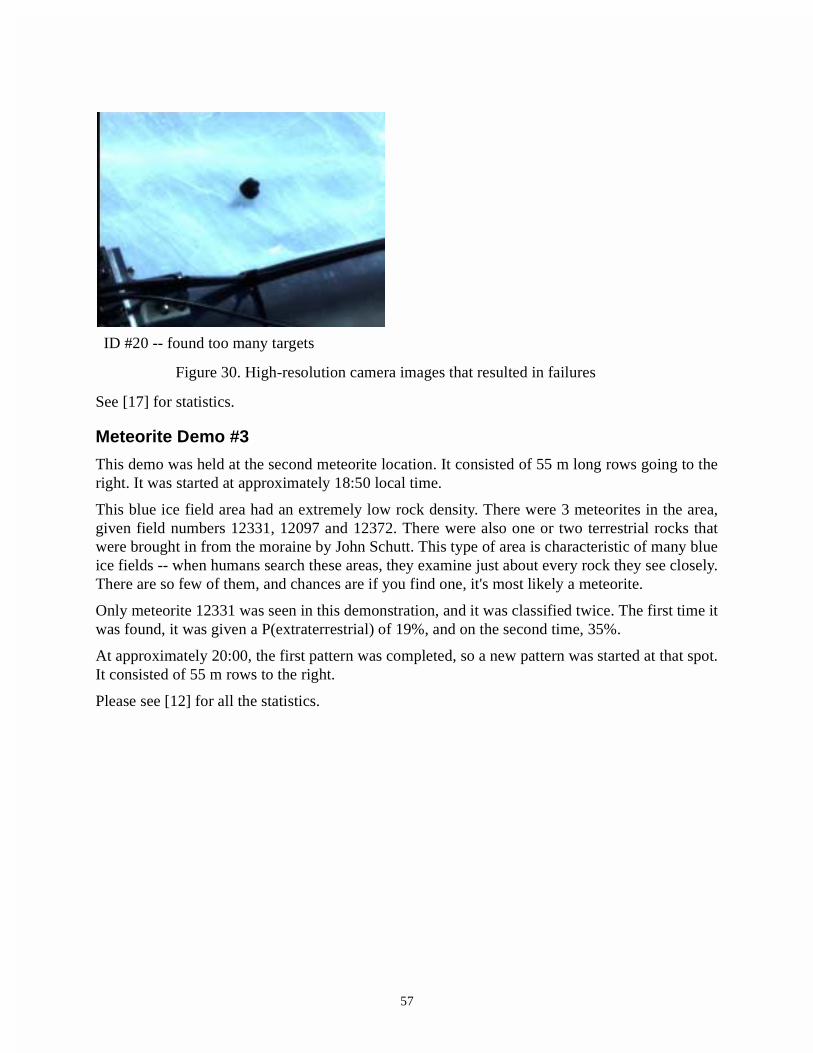
Meteorite Demo #3
This demo was held at the second meteorite location. It consisted of 55 m long rows going to theright. It was started at approximately 18:50 local time.
This blue ice field area had an extremely low rock density. There were 3 meteorites in the area,given field numbers 12331, 12097 and 12372. There were also one or two terrestrial rocks thatwere brought in from the moraine by John Schutt. This type of area is characteristic of many blueice fields -- when humans search these areas, they examine just about every rock they see closely.There are so few of them, and chances are if you find one, it's most likely a meteorite.
Only meteorite 12331 was seen in this demonstration, and it was classified twice. The first time itwas found, it was given a P(extraterrestrial) of 19%, and on the second time, 35%.
At approximately 20:00, the first pattern was completed, so a new pattern was started at that spot.It consisted of 55 m rows to the right.
Please see [12] for all the statistics.
ID #20 -- found too many targets
Figure 30. High-resolution camera images that resulted in failures

58
Experimenter's Notebook - January 26, 2000This day consisted of four demos in the second meteorite area: demos #4 - #7. The samples in thisarea were very sparse.
See [12] for the statistics on these demonstrations.
Meteorite Demo #4
This consisted of a pattern with 40 m rows going to the left. It started approximately at 11:00 localtime. The magnetic north offset was set to 2.73 radians in Nomad's real-time software. Finally, thespectrometer calibration target was a bit off, and was realigned. A new "ideal" reference spectrumwas taken in its new location.
Halfway through the demo much of the science autonomy system had to be restarted (targetacquisition, mission planner), so a new pattern was started just before target ID 6 was found. Thispattern had 20 m rows going to the left.
The first demonstration of the day was rather unsuccessful. Here were the conclusions:
• Visual servoing failed 3 times out of 3 attempts.• 2 failures came about because of an IK error. These were probably caused by an inconsistency
between the arm's physical workspace and the mission planner's workspace model. This is anunusual error though, and it is unlikely that it would have occurred twice in onedemonstration, but it did with IDs 3 and 7. This was the same rock (meteorite 12097), but itwas approached from different directions.
• The other failure, which occurred on the second attempt on ID 3, occurred because the stepsof the visual servoing process brought the rock underneath the spectrometer in the arm cameraimage. This occlusion caused the servoing software to lose the rock on the second visualservoing step. Apparently, it did not cause the centroid of the spectrometer to shift out of the"ignored" zone.
Conclusions:
• Change arm controller software to return an OUT_OF_WORKSPACE error on an IK failureso the mission planner will automatically re-maneuver and re-deploy. Currently it justredeploys without necessarily maneuvering, and if the rock is really out of reach, it will still beout of reach on the second attempt.
• Change the mission planner's arm workspace right angle from 6.05 to 6.2 radians. This willmake the mission planner's concept of the arm workspace smaller so less out of workspaceerrors should occur. However, will this smaller area make maneuvers too difficult? This hashappened on the slag heaps before.
Meteorite Demo #5
This pattern consisted of 20 m rows going to the right. It started at approximately 13:45 localtime.
The maneuver planner had problems maneuvering to within the arm's new, smaller workspace ofa target. Therefore, the only conclusion was to take the right angle back to 6.05 radians.

59
Meteorite Demo #6
This pattern consisted of 20 m rows to the left, and started at approximately 14:45 local time.Meteorite 12097 was misclassified with a P(extraterrestrial) of 1.4%, so the demo was abortedand several additional spectra were taken of it (IDs 1 to 8). See [18] for the statistics.
Meteorite Demo #7
This pattern consisted of 30 m rows going to the right, and was started at approximately 15:45local time.
Meteorite 12372 was found in this demonstration. It was given a 27% probability of being ameteorite.
After Nomad passed meteorite 12372, it studied a dolerite. This was the last sample in the area, sothe pattern was finished as a success. After this, three more spectra were taken of meteorite12372.

60
Experimenter's Notebook - January 27, 2000
Traverse
Before the day's operations, Nomad droveinto the moraine for its final demonstrations.The destination area of the moraine is over1.1 km away, almost due west of camp. Themoraine is mostly sastrugi and packed snowrather than blue ice. The rocks are muchdenser than the blue ice as well. Finally,unlike the blue ice, the rocks here are muchmore likely to be terrestrial. Figure 31 showsa panoramic image taken along the trip.
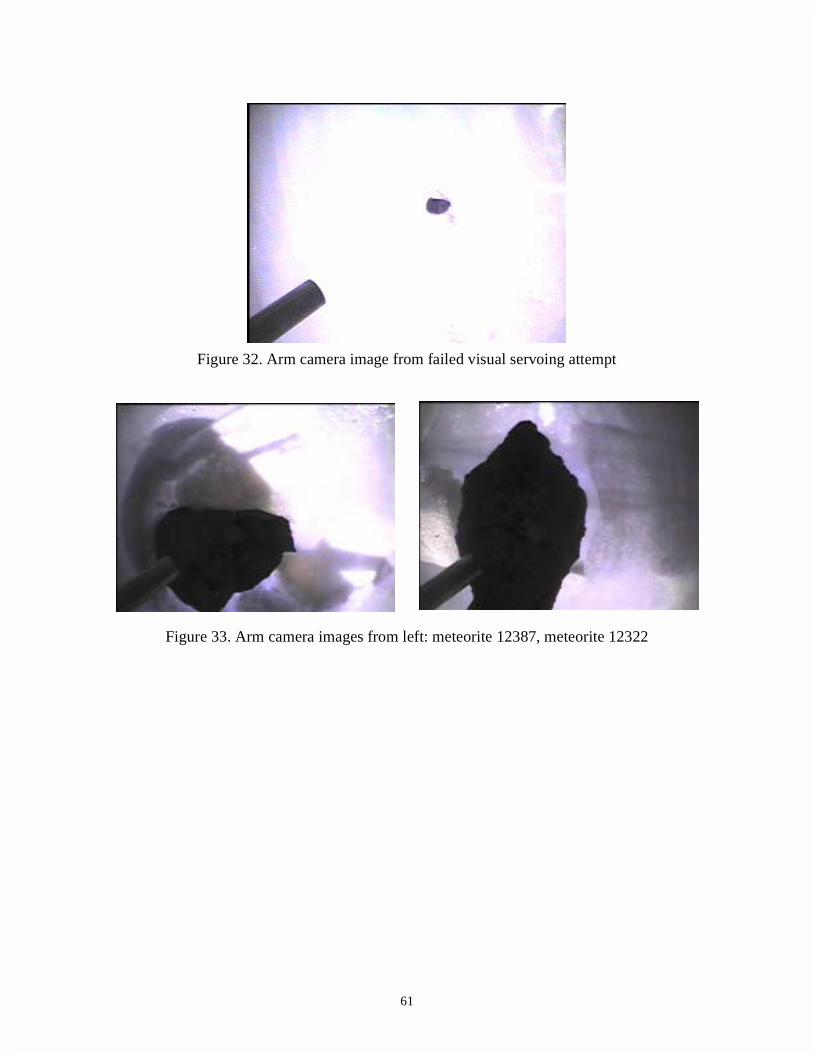
Rock and Meteorite Spectra Collec-tion
When this test began, the robot failed to servothe arm to 5 targets. After about an hour ofdebugging, the problem (a simple bug in the code) was found and corrected. Once this wascompleted, the test was restarted. 19 spectra were collected of the following four numberedsamples, shown in Table 8.
Visual servoing in general did quite well, occasionally failing only because of questionablesegmentation. There were no cases of failure after 2 attempts. Three attempts required manualintervention when no rocks were found. Figure 32 shows one case where segmentation failed, onID 3. Notice how washed out the image is.
Figure 33 shows some arm camera images of the meteorites studied in this activity.
See [19] for statistics.
Sample Field Number Description from John Schutt
12387 Ordinary chondrite meteorite
12322 Probably an achondrite
12346 Probably just a strange looking rock
12341 Probably just a strange looking rock
Table 8. Description of collected spectra sources
Figure 31. Panoramic image taken during traverse into the moraine
61
Figure 32. Arm camera image from failed visual servoing attempt
Figure 33. Arm camera images from left: meteorite 12387, meteorite 12322
62
Experimenter's Notebook - January 28, 2000It snowed overnight. The fresh snow was about 1 inch deep. The sky went from overcast topartially sunny as the day went on.
Meteorite Demo #8
The demo took place in the moraine. The pattern's rows were 200 m long and proceeded to theleft. Many rocks were partially covered with freshly fallen snow. Additionally, in the moraine thesize of rocks varies dramatically, from 1 to 50 cm. Some larger rocks that were snow coveredappeared as a few unconnected rock regions, so Nomad reasonably considered them multipletargets (see Figure 34).
While there were no meteorites found (John Schutt believed there were probably none in thearea), this was the most successful demonstration. All the robot's systems: search, servoing, etc.,worked very well and the robot studied 15 unique samples. These samples were later collected tofrom the “Moraine Rock Set” (see Appendix D). This demonstration provided a glimpse of some
terrain unlike what Nomad had previously seen. The density of rocks was much higher (around 1
/ m2), and possibly the distribution of rock types is different. Figure 35 shows the different typesof rocks seen by the high-res camera. These rocks range from light gray to black, and in size fromdozens to a few centimeters in diameter. Figure 36 shows four of the samples that were seen bythe arm camera. Note how much detail this view provides, especially with respect to rock color(notice the red basalt color of the upper right image) and texture.
See [12] or all the statistics of this demonstration.
Figure 34. Snow covered rock in the moraine, as seen by Nomad’s arm camera
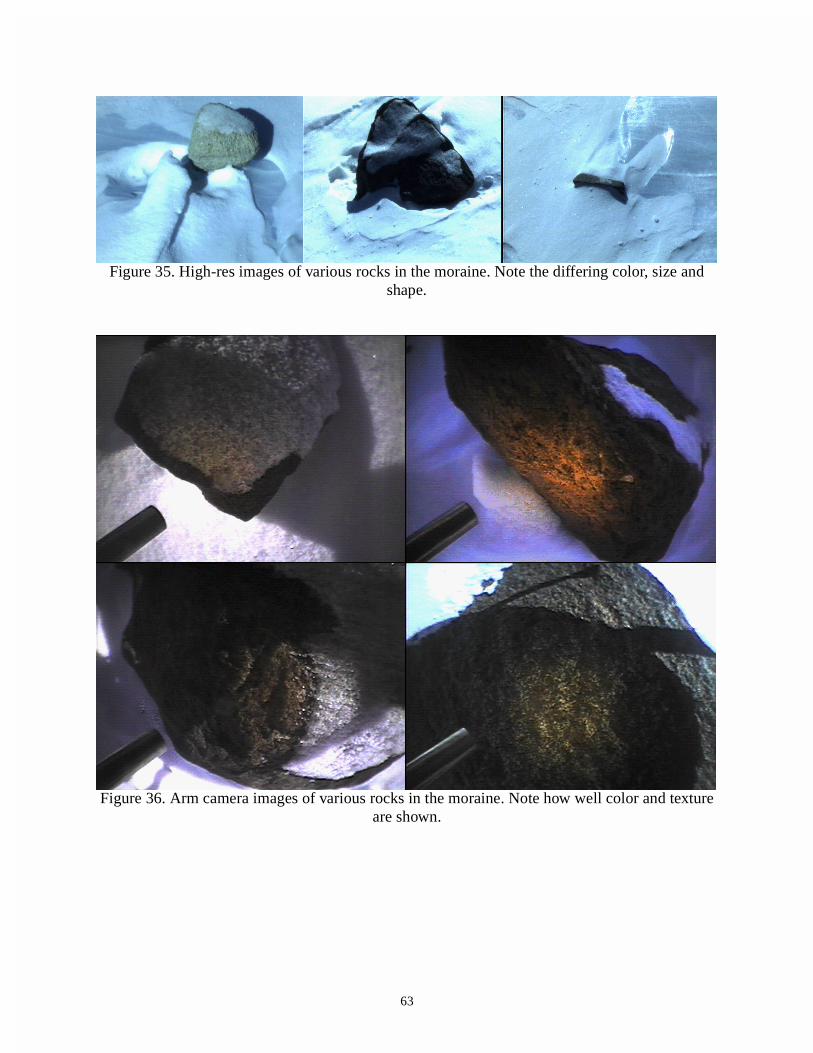
63
Figure 35. High-res images of various rocks in the moraine. Note the differing color, size and shape.
Figure 36. Arm camera images of various rocks in the moraine. Note how well color and texture are shown.
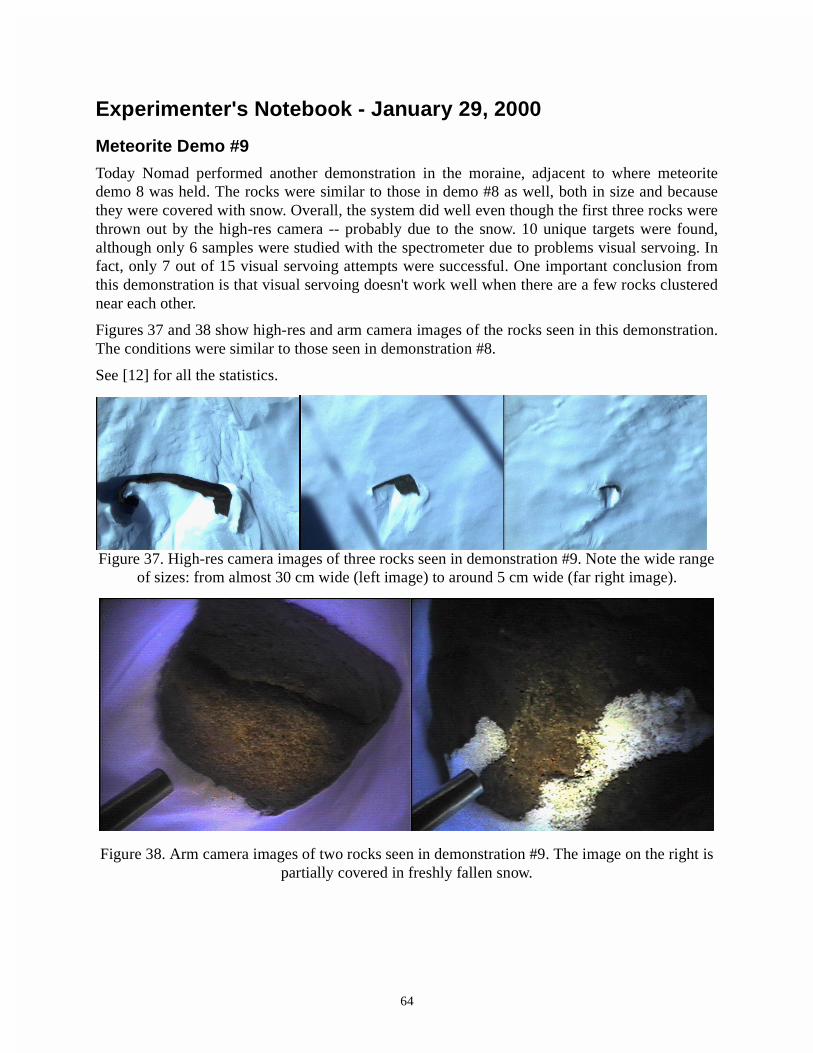
64
Experimenter's Notebook - January 29, 2000
Meteorite Demo #9
Today Nomad performed another demonstration in the moraine, adjacent to where meteoritedemo 8 was held. The rocks were similar to those in demo #8 as well, both in size and becausethey were covered with snow. Overall, the system did well even though the first three rocks werethrown out by the high-res camera -- probably due to the snow. 10 unique targets were found,although only 6 samples were studied with the spectrometer due to problems visual servoing. Infact, only 7 out of 15 visual servoing attempts were successful. One important conclusion fromthis demonstration is that visual servoing doesn't work well when there are a few rocks clusterednear each other.
Figures 37 and 38 show high-res and arm camera images of the rocks seen in this demonstration.The conditions were similar to those seen in demonstration #8.
See [12] for all the statistics.
Figure 37. High-res camera images of three rocks seen in demonstration #9. Note the wide range of sizes: from almost 30 cm wide (left image) to around 5 cm wide (far right image).
Figure 38. Arm camera images of two rocks seen in demonstration #9. The image on the right is partially covered in freshly fallen snow.

65
Experimenter's Notebook - January 30, 2000
Meteorite Demo #10
The last meteorite demonstration was attempted today. It consisted of a 400 m long row, and wasstarted at approximately 13:00 local time. It had to be aborted within 30 minutes, however,because the hard drive failure on meteorite precluded it from properly storing any sensor data.Being that this was the last day of field operations, the problem was not debugged.
After this failure the robot drove back to the camp to finish operations.
Collecting Rock Spectra
To take advantage of the rest of the day, the team brought back some moraine rocks and tookspectra of them manually with the robot's sensor wrist.
See [20] for the file names.
66
Appendix AThe list below contains links to documents referenced in this text.
[1] MATLAB diary during high-resolution calibration procedure: http://www.ri.cmu.edu/~meteorobot2000/results/01_16/calib_diary.html
[2] January 16 classification test results: http://www.ri.cmu.edu/~meteorobot2000/results/01_16/Classification_Test_Results.html
[3] Ideal white reference spectrum: http://www.ri.cmu.edu/~meteorobot2000/results/01_16/Ideal_White_Spectrum.html
[4] January 16 first pattern test results: http://www.ri.cmu.edu/~meteorobot2000/results/01_16/Pattern_Test_Results.html
[5] January 16 calibration parameters: http://www.ri.cmu.edu/~meteorobot200/results/01_16/calib_jan16.html
[6] January 16 second pattern test results: http://www.ri.cmu.edu/~meteorobot2000/results/01_16/Pattern_Test_Results_2.html
[7] January 17 surveyed line test results: http://www.ri.cmu.edu/~meteorobot2000/results/01_17/Line_Test_Results.html
[8] January 18 pattern test results: http://www.ri.cmu.edu/~meteorobot2000/results/01_18/Pattern_Test_Results.html
[9] January 19 surveyed line test results: http://www.ri.cmu.edu/~meteorobot2000/results/01_19/Line_Test_Results.html
[10] January 19 pattern test results: http://www.ri.cmu.edu/~meteorobot2000/results/01_19/Pattern_Test_Results.html
[11] January 20 pattern test results: http://www.ri.cmu.edu/~meteorobot2000/results/01_20/Pattern_Test_Results.html
[12] Expedition demonstration results: http://www.ri.cmu.edu/~meteorobot2000/results/Demo_Results.html
[13] January 21 pattern test results: http://www.ri.cmu.edu/~meteorobot2000/results/01_21/Pattern_Test_Results.html
[14] January 22 pattern test results: http://www.ri.cmu.edu/~meteorobot2000/results/01_22/Pattern_Test_Results.html
[15] January 23 pattern test results: http://www.ri.cmu.edu/~meteorobot2000/results/01_23/Pattern_Test_Results.html
[16] January 24 spectrum collection: http://www.ri.cmu.edu/~meteorobot2000/results/01_24/Spectrum_Collection.html
[17] January 25 pattern test results: http://www.ri.cmu.edu/~meteorobot2000/results/01_25/Pattern_Test_Results.html
[18] Demo #6 additional results: http://www.ri.cmu.edu/~meteorobot2000/results/01_26/

67
Demo_6_Additional_Results.html
[19] January 27 spectrum collection: http://www.ri.cmu.edu/~meteorobot2000/results/01_27/Spectrum_Collection.html
[20] January 30 spectrum collection: http://www.ri.cmu.edu/~meteorobot2000/results/01_30/Spectrum_Collection.html
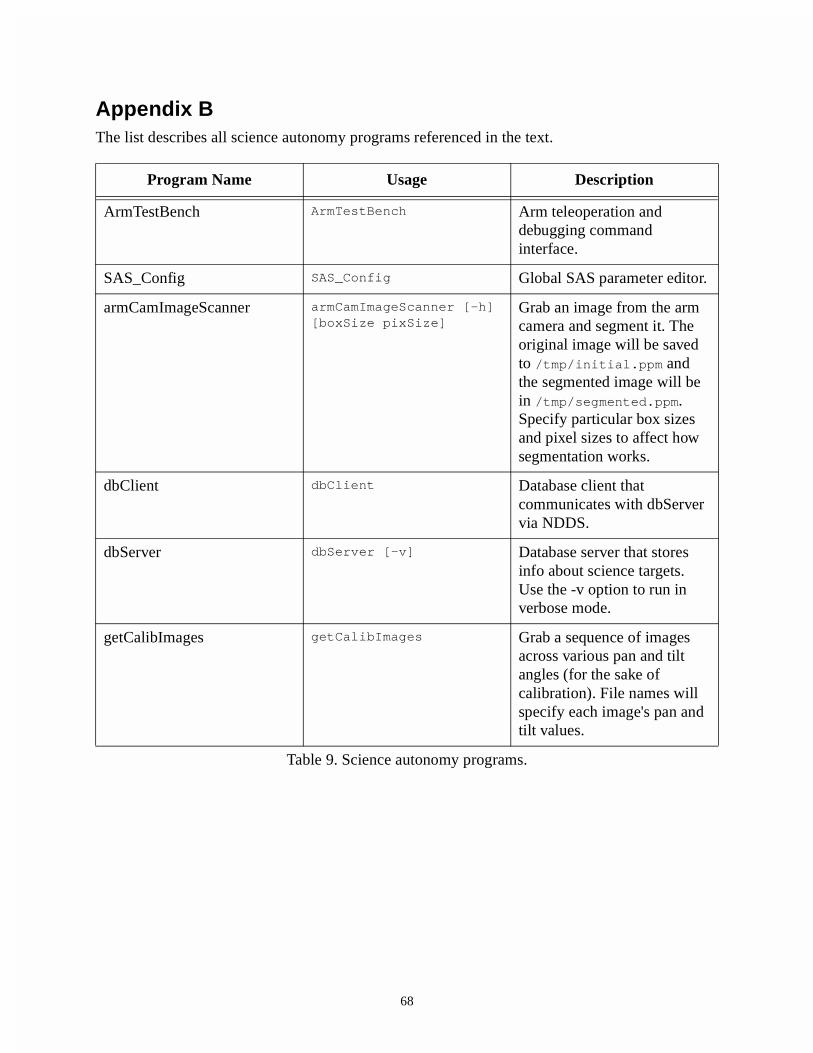
68
Appendix BThe list describes all science autonomy programs referenced in the text.
Program Name Usage Description
ArmTestBench ArmTestBench Arm teleoperation and debugging command interface.
SAS_Config SAS_Config Global SAS parameter editor.
armCamImageScanner armCamImageScanner [-h] [boxSize pixSize]
Grab an image from the arm camera and segment it. The original image will be saved to /tmp/initial.ppm and the segmented image will be in /tmp/segmented.ppm. Specify particular box sizes and pixel sizes to affect how segmentation works.
dbClient dbClient Database client that communicates with dbServer via NDDS.
dbServer dbServer [-v] Database server that stores info about science targets. Use the -v option to run in verbose mode.
getCalibImages getCalibImages Grab a sequence of images across various pan and tilt angles (for the sake of calibration). File names will specify each image's pan and tilt values.
Table 9. Science autonomy programs.

69
grabImage grabImage [-h] [source pan tilt zoomEnc focusEnc outFile]
Grab a single image a specified pan and tilt angle as well as zoom and focus encoder values. Parameters can either be entered interactively (if no arguments are specified), or via the command line as follows:• source: 1 for high-res
camera, 2 for arm camera, 3 for panoramic camera.
• pan: high-res camera pan (deg), must be specified even if source is not high-res camera.
• tilt: high-res camera tilt (deg), must be specified even if source is not high-res camera.
• zoomEnc: high-res lens zoom encoder value, must be specified even if source is not high-res camera. 255 means zoom out fully, 0 means zoom in fully.
• focusEnc: high-res lens focus encoder value, must be specified even if source is not high-res camera. The range of values is from 0 to 255.
• outFile: the file that will hold the resulting image.
hiResSensor hiResSensor driverName The high-res camera sensor driver.
Program Name Usage Description
Table 9. Science autonomy programs.

70
javaToNdds javaToNdds nddsDomain ipAddress port
A program to convert commands from a Java program to NDDS. ipAddress and port must be those of the machines running the program.
nddsToJava nddsToJava nddsDomain ipAddress port
Program to convert NDDS messages into Java objects. ipAddress and port must be those of the machines running the program.
segCalibImages segCalibImages Program that segments a range of images gathered by getCalibImages, using the red thresholding method.
segment segment in.ppm out.ppm Segments an image using the default segmentation method
sensManClient sensManClient Client to the sensor manager, displays a text interface allowing the user to send any type of message to the sensor manager, and listens to the sensManReply and sensManComplete messages.
sensManMain sensManMain The sensor manager.
spectrometer spectrometer The spectrometer Tcl/Tk teleoperation interface (not recommended for use over low-bandwidth networks!)
targetAcqMain targetAcqMain [-test] The target acquisition manager. Specify -test to save images while doing target acquisition (NOTE: this will considerably slow down target acquisition, so do not run it in test mode when doing an autonomous search!)
Program Name Usage Description
Table 9. Science autonomy programs.
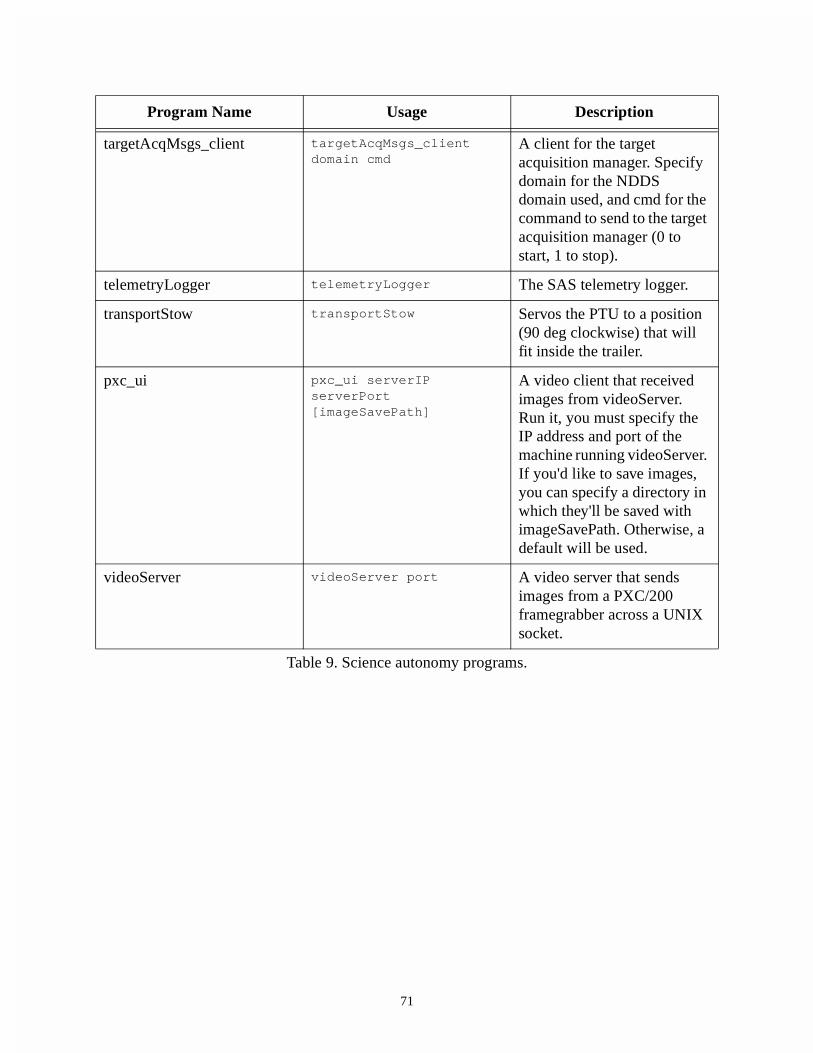
71
targetAcqMsgs_client targetAcqMsgs_client domain cmd
A client for the target acquisition manager. Specify domain for the NDDS domain used, and cmd for the command to send to the target acquisition manager (0 to start, 1 to stop).
telemetryLogger telemetryLogger The SAS telemetry logger.
transportStow transportStow Servos the PTU to a position (90 deg clockwise) that will fit inside the trailer.
pxc_ui pxc_ui serverIP serverPort [imageSavePath]
A video client that received images from videoServer. Run it, you must specify the IP address and port of the machine running videoServer. If you'd like to save images, you can specify a directory in which they'll be saved with imageSavePath. Otherwise, a default will be used.
videoServer videoServer port A video server that sends images from a PXC/200 framegrabber across a UNIX socket.
Program Name Usage Description
Table 9. Science autonomy programs.
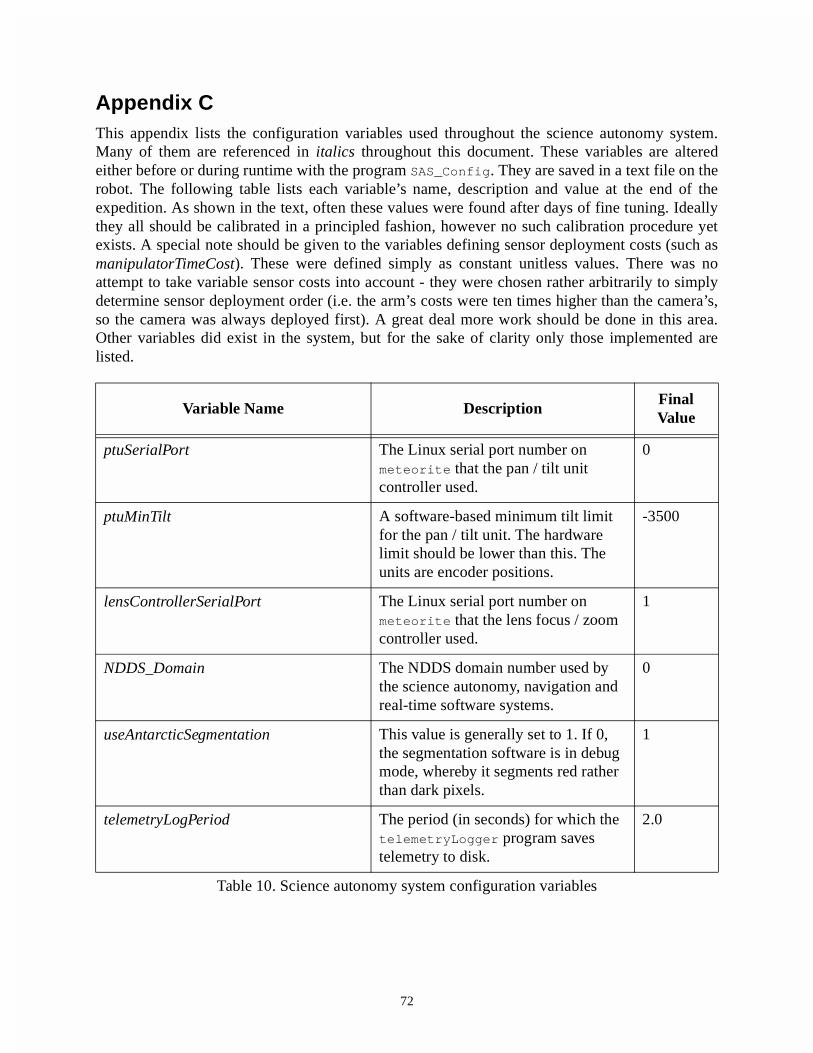
72
Appendix CThis appendix lists the configuration variables used throughout the science autonomy system.Many of them are referenced in italics throughout this document. These variables are alteredeither before or during runtime with the program SAS_Config. They are saved in a text file on therobot. The following table lists each variable’s name, description and value at the end of theexpedition. As shown in the text, often these values were found after days of fine tuning. Ideallythey all should be calibrated in a principled fashion, however no such calibration procedure yetexists. A special note should be given to the variables defining sensor deployment costs (such asmanipulatorTimeCost). These were defined simply as constant unitless values. There was noattempt to take variable sensor costs into account - they were chosen rather arbitrarily to simplydetermine sensor deployment order (i.e. the arm’s costs were ten times higher than the camera’s,so the camera was always deployed first). A great deal more work should be done in this area.Other variables did exist in the system, but for the sake of clarity only those implemented arelisted.
Variable Name DescriptionFinal Value
ptuSerialPort The Linux serial port number on meteorite that the pan / tilt unit controller used.
0
ptuMinTilt A software-based minimum tilt limit for the pan / tilt unit. The hardware limit should be lower than this. The units are encoder positions.
-3500
lensControllerSerialPort The Linux serial port number on meteorite that the lens focus / zoom controller used.
1
NDDS_Domain The NDDS domain number used by the science autonomy, navigation and real-time software systems.
0
useAntarcticSegmentation This value is generally set to 1. If 0, the segmentation software is in debug mode, whereby it segments red rather than dark pixels.
1
telemetryLogPeriod The period (in seconds) for which the telemetryLogger program saves telemetry to disk.
2.0
Table 10. Science autonomy system configuration variables

73
targetAcqCamPan The nominal high-res camera pan angle (in degrees) in target acquisition mode.
-14.5
targetAcqCamTilt The nominal high-res camera tilt angle (in degrees) in target acquisition mode.
-37.5
targetAcqStartRow The image pixel row at which the high-res target acquisition driver begins segmentation. Any pixels in row numbers less than this (i.e. higher in the image) will be ignored. This helps define the image area in which new targets are found.
5
targetAcqStopRow The image pixel row at which the high-res target acquisition driver ends segmentation. Any pixels in row numbers greater than this (i.e. lower in the image) will be ignored. This helps define the image area in which new targets are found.
240
targetAcqMinCol The image pixel column at which the high-res target acquisition driver begins segmentation. Any pixels in column numbers less than this (i.e. further left in the image) will be ignored. This is needed because the first several columns in an image are often black.
10
targetAcqMaxCol The image pixel column at which the high-res target acquisition driver ends segmentation. Any pixels in column numbers greather than this (i.e. further right in the image) will be ignored. This is needed because the last several columns in an image are often black.
630
Variable Name DescriptionFinal Value
Table 10. Science autonomy system configuration variables
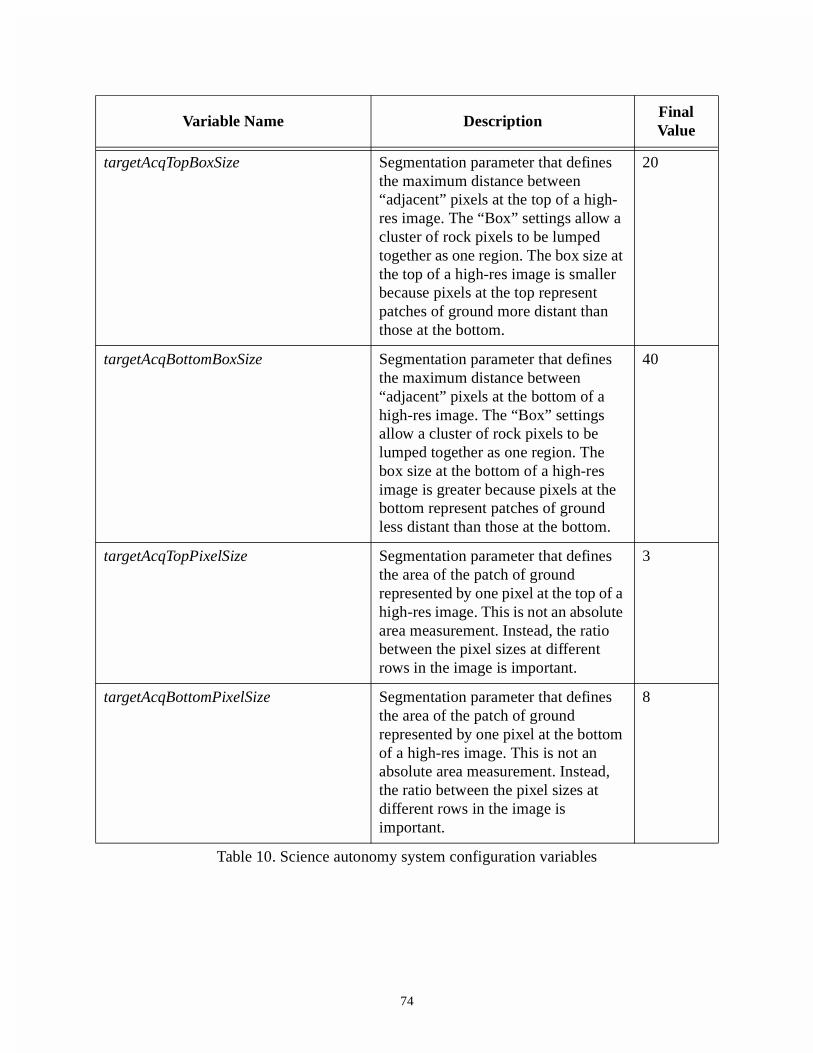
74
targetAcqTopBoxSize Segmentation parameter that defines the maximum distance between “adjacent” pixels at the top of a high-res image. The “Box” settings allow a cluster of rock pixels to be lumped together as one region. The box size at the top of a high-res image is smaller because pixels at the top represent patches of ground more distant than those at the bottom.
20
targetAcqBottomBoxSize Segmentation parameter that defines the maximum distance between “adjacent” pixels at the bottom of a high-res image. The “Box” settings allow a cluster of rock pixels to be lumped together as one region. The box size at the bottom of a high-res image is greater because pixels at the bottom represent patches of ground less distant than those at the bottom.
40
targetAcqTopPixelSize Segmentation parameter that defines the area of the patch of ground represented by one pixel at the top of a high-res image. This is not an absolute area measurement. Instead, the ratio between the pixel sizes at different rows in the image is important.
3
targetAcqBottomPixelSize Segmentation parameter that defines the area of the patch of ground represented by one pixel at the bottom of a high-res image. This is not an absolute area measurement. Instead, the ratio between the pixel sizes at different rows in the image is important.
8
Variable Name DescriptionFinal Value
Table 10. Science autonomy system configuration variables
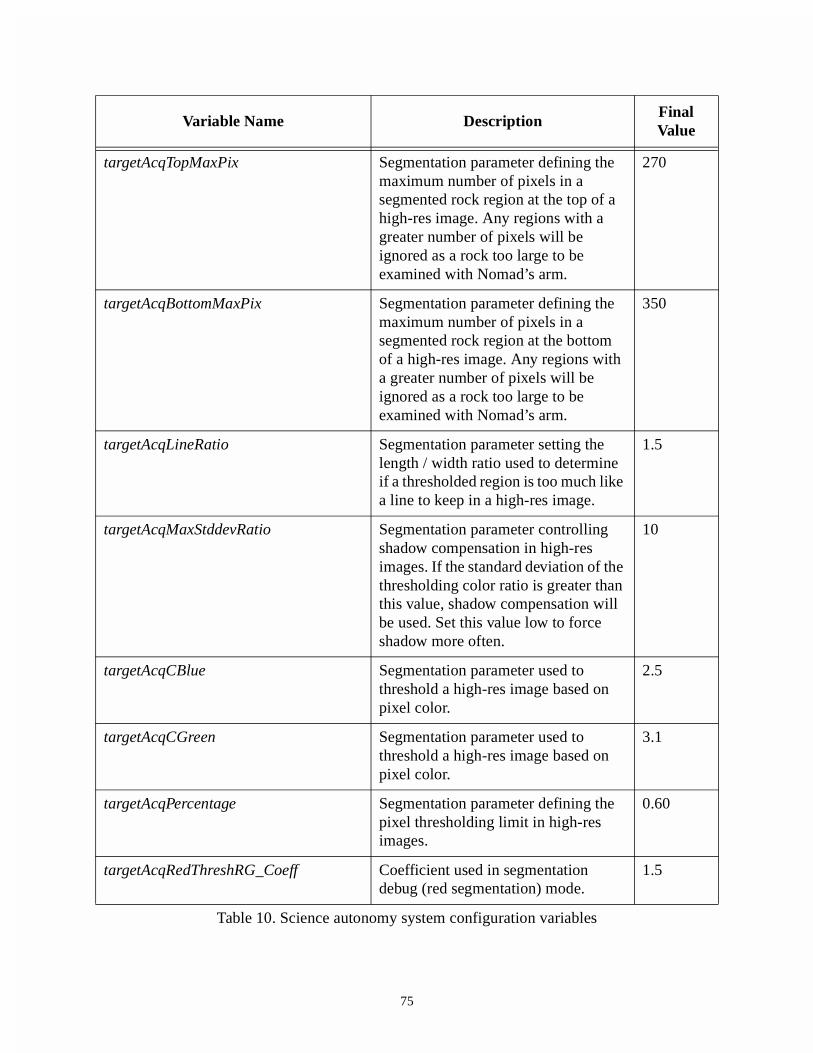
75
targetAcqTopMaxPix Segmentation parameter defining the maximum number of pixels in a segmented rock region at the top of a high-res image. Any regions with a greater number of pixels will be ignored as a rock too large to be examined with Nomad’s arm.
270
targetAcqBottomMaxPix Segmentation parameter defining the maximum number of pixels in a segmented rock region at the bottom of a high-res image. Any regions with a greater number of pixels will be ignored as a rock too large to be examined with Nomad’s arm.
350
targetAcqLineRatio Segmentation parameter setting the length / width ratio used to determine if a thresholded region is too much like a line to keep in a high-res image.
1.5
targetAcqMaxStddevRatio Segmentation parameter controlling shadow compensation in high-res images. If the standard deviation of the thresholding color ratio is greater than this value, shadow compensation will be used. Set this value low to force shadow more often.
10
targetAcqCBlue Segmentation parameter used to threshold a high-res image based on pixel color.
2.5
targetAcqCGreen Segmentation parameter used to threshold a high-res image based on pixel color.
3.1
targetAcqPercentage Segmentation parameter defining the pixel thresholding limit in high-res images.
0.60
targetAcqRedThreshRG_Coeff Coefficient used in segmentation debug (red segmentation) mode.
1.5
Variable Name DescriptionFinal Value
Table 10. Science autonomy system configuration variables

76
targetAcqRedThreshRB_Coeff Coefficient used in segmentation debug (red segmentation) mode.
1.5
armCamBoxSize Segmentation parameter that defines the maximum distance between “adjacent” pixels at the bottom of a high-res image. The “box” settings allow a cluster of rock pixels to be lumped together as one region.
3
armCamPixelSize Segmentation parameter that defines the area of the patch of ground represented by one pixel in an arm camera image.
40
armCamMaxPix Segmentation parameter defining the maximum number of pixels in a segmented rock region in an arm camera image. Any regions with a greater number of pixels will be ignored as a rock too large to be examined with Nomad’s arm.
76800
armCamLineRatio Segmentation parameter setting the length / width ratio used to determine if a thresholded region is too much like a line to keep in an arm camera image.
1.5
armCamMaxStddevRatio Segmentation parameter controlling shadow compensation in arm camera images. If the standard deviation of the thresholding color ratio is greater than this value, shadow compensation will be used. Set this value low to force shadow more often.
35
armCamCBlue Segmentation parameter used to threshold arm camera images based on pixel color.
2.5
armCamCGreen Segmentation parameter used to threshold arm camera images based on pixel color.
3.1
Variable Name DescriptionFinal Value
Table 10. Science autonomy system configuration variables

77
armCamPercentage Segmentation parameter defining the pixel thresholding limit in arm camera images.
0.75
armCamMinRow The image pixel row at which arm camere image segmentation begins. Any pixels in row numbers less than this (i.e. higher in the image) will be ignored. This is needed because the first few rows of an arm camera image are often black.
5
armCamMaxRow The image pixel row at which arm camere image segmentation ends. Any pixels in row numbers greater than this (i.e. lower in the image) will be ignored. This is needed because the last few rows of an arm camera image are often black.
240
armCamMinCol The image pixel column at which arm camere image segmentation begins. Any pixels in column numbers less than this (i.e. further left in the image) will be ignored. This is needed because the first few columns of an arm camera image are often black.
20
armCamMaxCol The image pixel column at which arm camere image segmentation ends. Any pixels in column numbers greater than this (i.e. further right in the image) will be ignored. This is needed because the last few columns of an arm camera image are often black.
300
armCamSpecMinRow The minimum image pixel row in which a segmented region representing the spectrometer in an arm camera image can lie and be ignored as a target.
195
Variable Name DescriptionFinal Value
Table 10. Science autonomy system configuration variables

78
armCamSpecMaxRow The maximum image pixel row in which a segmented region representing the spectrometer in an arm camera image can lie and be ignored as a target.
225
armCamSpecMinCol The minimum image pixel column in which a segmented region representing the spectrometer in an arm camera image can lie and be ignored as a target.
15
armCamSpecMaxCol The maximum image pixel column in which a segmented region representing the spectrometer in an arm camera image can lie and be ignored as a target.
70
specCalibTargetHeight The defined height of the spectrometer calibration target. This height, given in meters, is defined in a frame where the wheels of the robot are on a ground plane at 0 m.
0.388
hiResFullZoomAutofocusSearchRange When the high-res camera software operates the lens controller to focus the image automatically, it initially steps through the entire range of focus values. These values are given in a one-byte potentiometer value, where 255 is fully zoomed out and 0 is fully zoomed in. This variable defines the step value of this initial search.
20
hiResTargetZoomVal The maximum zoom value of the high-res camera lens when deploying to a target. The value is given in a one-byte potentiometer value, where 255 is fully zoomed out and 0 is fully zoomed in.
140
Variable Name DescriptionFinal Value
Table 10. Science autonomy system configuration variables

79
hiResZoomStep The high-res camera is zoomed into a target in a series of steps to avoid losing the target. This variable defines the step value, given in a one-byte potentiometer value, where 255 is fully zoomed out and 0 is fully zoomed in.
40
manipulatorTimeCost The constant, unitless time cost for deploying Nomad’s manipulator arm.
10.0
manipulatorEnergyCost The constant, unitless energy cost for deploying Nomad’s manipulator arm.
10.0
manipulatorWorkspaceMinDistance The minimum radial distance defining the workspace of Nomad’s manipulator arm, given in meters. The distance is defined from Nomad’s DGPS sensor.
2.1
manipulatorWorkspaceMaxDistance The maximum radial distance defining the workspace of Nomad’s manipulator arm, given in meters. The distance is defined from Nomad’s DGPS sensor.
3.3
manipulatorWorkspaceLeftAngle The left angle defining the workspace of Nomad’s manipulator arm, given in radians. The angle is defined from Nomad’s DGPS sensor with 0 rad pointing straight out the front of the robot. This angle is defined in the CCW direction.
0.52
manipulatorWorkspaceRightAngle The right angle defining the workspace of Nomad’s manipulator arm, given in radians. The angle is defined from Nomad’s DGPS sensor with 0 rad pointing straight out the front of the robot. This angle is defined in the CW direction.
6.05
hiResTimeCost The constant, unitless time cost for deploying the high-res camera.
1.0
Variable Name DescriptionFinal Value
Table 10. Science autonomy system configuration variables

80
hiResEnergyCost The constant, unitless energy cost for deploying the high-res camera.
1.0
hiResWorkspaceMinDistance The minimum radial distance defining the workspace of the high-res camera, given in meters. The distance is defined from Nomad’s DGPS sensor.
3.75
hiResWorkspaceMaxDistance The maximum radial distance defining the workspace of the high-res camera, given in meters. The distance is defined from Nomad’s DGPS sensor.
7
hiResWorkspaceLeftAngle The left angle defining the workspace of the high-res camera, given in radians. The angle is defined from Nomad’s DGPS sensor with 0 rad pointing straight out the front of the robot. This angle is defined in the CCW direction.
0.7854
hiResWorkspaceRightAngle The right angle defining the workspace of high-res camera, given in radians. The angle is defined from Nomad’s DGPS sensor with 0 rad pointing straight out the front of the robot. This angle is defined in the CW direction.
5.4978
dgpsEstPan_Fudge The pan angle fudge factor (in degrees) used to correct the estimated DGPS position of rock targets. This angle is added to the measured high-res camera pan angle.
0.0
dgpsEstTilt_Fudge The tilt angle fudge factor (in degrees) used to correct the estimated DGPS position of rock targets. This angle is added to the measured high-res camera tilt angle.
-2.0
Variable Name DescriptionFinal Value
Table 10. Science autonomy system configuration variables

81
Appendix D
Many different rocks and meteorites were examined by Nomad each day of the expedition. Someof these are listed in the text as “Rock A”, “Liam’s rock #1” or “Meteorite 12332”. This appendixdescribes these samples in detail.
For a good online library of rock types, see the Big Signal rock library at www.bigsignal.net.
Rock Set A
These rocks were acquired from the outer edges of Elephant Moraine January 15, 2000 by LiamPedersen. The rocks were initially identified by John Schutt.
Rock Set B
This sample set was used for the meteorite search demonstrations between January 21 andJanuary 23, south of camp, in the vicinity of Nomad’s first meteorite find. The rocks were
Field Identification
Description
1 Dolerite
2 Quartz sandstone
3 Red basalt (hydrothermally altered)
4 Fine grained sandstone (small pieces of coal?)
5 Basalt
6 Travertine (black calcite)
7 Quartzite?
8 Breccia / highly latered basalt, with quartz or calcite intrusions
9 Dolerite
10 Dolerite
11 Quartz sandstone
12 Dolerite
Table 11. Rock set A listing

82
collected and initially identified by John Schutt.
Rock Set C
This rock and meteorite test set was used on the blue ice west of camp -- the location of meteoritesearch demonstrations #3 - #7 (January 25 and 26). The samples were initially identified by JohnSchutt.
Rock Set D
These rocks and meteorites were found and initially identified by John Schutt at the periphery ofthe Elephant Moraine, northeast of camp. These samples were examined by Nomad on January 27
Field Identification
Description
1 Black shale (often considered a meteorwrong)
2 Dolerite
3 Tan siltstone
4 Basalt fragment
5 Dolerite
6 ?
Table 12. Rock set B listing
Field Identification
Description
A Dolerite
B Dolerite
C Red basalt (hydrothermally altered)
D Dolerite
E Quartz sandstone
F Subglacial travertine (black calcite, often considered a meteorwrong)
59650 Kulnine (meteorite provided by William Cassidy)
Table 13. Rock set C listing
83
and later collected and sent to Johnson Space Center by John Schutt.
Samples C and D are strange black rocks, similar to black sandstones in appearance but slightlyfused. John Schutt cannot say with certainty that they are not meteorites. Furthermore, they aredistinctly different and smaller from all other rocks in the area, which are mostly sandstones, redbasalts and dolerites. They were located in an area with very few terrestrial rocks and known tocontain meteorites.
Moraine Rock Set
These rocks were in the path of Nomad’s meteorite search demonstrations on January 28 and 29(demonstrations #8 and #9). These demonstrations were performed in Elephant Moraine proper,mostly on sastrugi. The samples were identified by John Schutt and Liam Pedersen.
Field Identification
ANSMET Field Number
Description
A 12387 Ordinary chondrite meteorite
B 12322 Unusual achondrite
C 12346 Unusual black rock, considered a meteowrong
D 12341 Unusual black rock, considered a meteorwrong
Table 14. Rock set D listing
Rock Identification
Description
M0 Red basalt
M1 Dolerite
M2 Dolerite
M3 Sandstone
M4 Dolerite (red iron stain)
M5 Dolerite (slight red iron stain)
M6 Dolerite / basalt
M7 Dolerite (red iron stain)
M8 Dolerite (slight red iron stain)
M9 Dolerite (slight red iron stain)
M10 ?
Table 15. Moraine rock set listing

84
M11 Dolerite
M12 Dolerite
M13 Dolerite
M14 Basalt (black)
M15 Dolerite (red iron stain)
M16 Dolerite (very red iron staining)
M17 Dolerite (very red iron staining)
M18 Dolerite
M19 Basalt
M20 Dolerite
M21 Basalt
M22 Medium-grained sandstone
M23 Dolerite (very red iron staining) with quartz band (possibly flow basalt)
M24 Dolerite
M25 Sandstone (fine, white grained)
M26 Chert or thermally metamorphosed lake sediment, shale
M27 Basalt
M28 Basalt, with large vesicles so it probably solidified near the surface
M29 Basalt
M30 Quartzite metasediment, derived from clast within conglomerate
M31 Large-grained dolerite (red iron stain)
Rock Identification
Description
Table 15. Moraine rock set listing

85
Meteorwrong Set
This set includes various meteorwrongs collected by John Schutt and Liam Pedersen.
Rock Identification
Description
MW1 Brown shale with desert varnish
MW2 Black shale
Table 16. Meteorwrong set listing