experiments assess sensors used in search for subsurface oil
TRANSCRIPT

2 | Keynotes
A series of experiments were performed over a two-week period in late May-early June 2011 to assess the performance of the sensors used to search for subsurface oil during the 2010 Deep-water Horizon oil spill. Michelle Wood, Director of AOML’s Ocean Chemistry Division, led the effort at the Bedford Institute of Oceanography’s Center for Offshore Oil and Gas Environmental Research in Nova Scotia, Canada. Major funding was provided by NOAA, the Alliance for Coastal Technology, and Canada’s Department of Fisheries and Oceans.
Finding oil beneath the surface of the ocean isn’t easy, as those responding to the Deepwater Horizon (DWH) spill learned in the summerof2010.Whenoilfloats to thesurface, it can be seen by aircraft and observers on ships; when it’s entrained as small droplets into subsurface clouds and plumes, visual observation becomes impos-sible. The oil travels at different depths depending on the water conditions, compo si-tion of the oil, the size of the droplets, and other factors.
During the DWH oil spill, application of the dispersant COREXIT 9500, combined with the effects of large volumes of methane erupting with the oil under high pressure, appears to have supported the development of subsurfaceoilplumesthatwerefirstsuspectedbased on vertical profiles of fluorescenceobtained from CDOM fluorometers andoxygen profiles. The figure below from theAOML-led research cruise aboard the NOAA Ship Nancy Foster in June-July 2010 shows the now iconic CDOM peak/oxygen mini-mum associated with the underwater plumes.
CDOM, or “Colored Dissolved Organic Matter,” has been of interest to satellite oceanographers for several decades, particu-
larlybecauseitcausesdifficultyinapplyingstandard algorithms for chlorophyll to ocean color data collected in coastal waters. There are many sources of CDOM, including proteins and material called “gelbstoff” derived from decomposing organic matter often associated with black water rivers and other nearshore sources.
Hydrocarbons are also “colored organic matter” and, thus, oceanographers familiar with CDOM sensors immediately began using them to search for subsurface oil. As hydrocarbons are a major source of energy, it
was also expected that hydrocarbon- degrading bacteria, particularly those that might specialize on some of the more degradable components of the oil (e.g., butane, toluene, etc.) or on the methane in the plume, might use these energy sources and draw down the oxygen concentration.
These hypotheses seem to be supported bythemanyprofilesthatshowedsimulta-neouspeaksinCDOMfluorescenceandminima in oxygen. On the Nancy Foster cruise, researchers found that hydrocarbon concentrations at the depth of these features were elevated relative to back-ground levels after water samples were analyzed by the gas chromatography-mass spectrometry method.
There are, however, major differences between CDOM, as studied by satellite oceanographers and ocean color experts,
and oil. This is particularly true with respect tofluorescence,whichistheemissionoflightbyamoleculeorfluorophoreafteritabsorbslightatashorterwavelength.Allfluorophoreshave characteristic wavelengths for maxi-mum absorption of light and a characteristic wavelength at which they emit light.
The ability of a CDOM sensor to detect oil partly depends on how well the sensor matches the excitation and emission wave-lengths of the oil. Since oil is a complex mixture of organic molecules, it has a complex, three-dimensional excitation and emission spectrum. In general, crude oils have a broad excitation peak in the ultraviolet spectrum and two emission peaks, one in the
Graph from the June-July 2010 research cruise of the NOAA Ship Nancy Foster depicting CDOM (olive green line) and oxygen (blue line). The CDOM peak and oxygen minimum near 1200 m suggested the presence of subsurface oil.
A) Seawater containing MC-252 source oil from the 2010 Gulf of Mexico Deepwater Horizon spill and dispersant is poured into the wave tank at the Center for Offshore Oil and Gas Environmental Research in Nova Scotia, Canada. B) Initial oil front. C) Oil distributes throughout the wave tank. D) A wave generator helps to transport and mix the oil in the tank.
Experiments Assess Sensors Used in Search for Subsurface Oil
BA
C D
Brian Robinson was part of the staff from COOGER that operated the wave tank; here the tank is being cleaned between experiments.
Keynotes | 3
Dr. Larry Mayer (second from the left), Chairman of the National Research Council’s committee evaluating the effects of the Deepwater Horizon oil spill and Director of the University of New Hampshire’s Center for Coastal and Ocean Mapping, visits with Jim Farr (NOAA), Paul Kepkay (COOGER), and Michelle Wood (AOML) during the experiments.
visible spectrum around 450 nm and a much larger and broader peak in the ultraviolet.
Typical CDOM sensors have light sources that excite at slightly longer wavelengths than peak absorption by hydrocarbons and detect emission in the visible. Additionally, there are many fluorometer designs with different light sources, and a few that detect emissions for organic matter in the ultraviolet. As the hunt for subsurface oil continued throughout the summer of 2010, different instruments were used on different ships with differing effectiveness.
An ad hoc Fluorometry Working Group formed during AOML’s DWH Symposium in July 2010 called for experimental studies to understand the dynamic range, sensitivity, andresponseofdifferentfluorometerstotheoil-dispersant mixtures. As a result, from May 28-June 10, 2011, an experiment was conducted that included the principal fluorometersusedtodetectsubsurfaceoilinthe Gulf of Mexico during the DWH spill and some “next generation” sensors as well.
The experiment was conducted at the Bedford Institute of Oceanography’s Center for Offshore Oil and Gas Environmental Research (COOGER) in Dartmouth, Nova Scotia. Major funding for the effort was provided by the Integrated Ocean Observing System through the Alliance for Coastal Technology and NOAA, and from COOGER and Canada’s Department of Fisheries and Oceans.
COOGER operates a wave tank designed to work with oil and dispersants and has extensive laboratory facilities for analyzing the chemical and physical properties of oil and oil-dispersant mixtures. Additionally, COOGER scientists played an important role on the Joint Analysis Group (JAG) during the DWH spill and spent many days on ships in the Gulf. COOGER Director Ken Lee is on the National Research Council committee evaluating the impact of the spill on the Gulf of Mexico.
AOML’s Michelle Wood was the lead principal investigator for the project; the primary science team was comprised of Paul
Kepkay and Ken Lee from COOGER, Paula Coble from the University of South Florida, Robyn Conmy from the Environmental Protection Agency and JAG, Scott Miles from Louisiana State University’s Response and Chemical Assessment Team, and Jim Farr fromNOAA’sOffice ofResponse andRestoration and JAG member. Overall, more than 25 researchers participated in the effort, including 12 COOGER staff needed to operate the wave tank and clean it between each experiment and OCD scientist Chris Kelble.
A total of 15 experiments were conducted during the 12-day workshop, including eight core experiments that involved deploying sensors in the tank with oil added with and without dispersant, and using artificiallyweathered and unweathered oil. Additional experiments addressed questions about the limits of detection (maximum and minimum) ofthedifferentsensorsandaboutthefluores-cence of the dispersant alone. A large-volume sampler provided by Jim Payne (Payne Environmental Consultants), who used this instrument extensively in sampling for NOAA during the oil spill, allowed for analysis of the chemical and fluorescenceproperties of dissolved and particulate/ emulsifiedfractionsofthewater.
Preparing for the experiment highlighted the improbability of the whole event. In addition to issues relating to successful import of all the equipment into Canada was the initial acquisition of adequate amounts of MC-252 DWH source oil. Although there wasalargeamountofsourceoilflowingintothe Gulf of Mexico last year, obtaining theoilnow,aftertheevent,isdifficult because the supply is highly con-trolled. However, with assistance from NOAA leadership, the team had
oil in time for artificial weathering and forpreliminary experiments that facilitated planning the work with the sensors.
Another potential problem for the research was the weather. The wave tank is located outside and is filled with water from the Bedford Basin; rain affects its salinity and runoff into the basin affects the background CDOM fluorescence. Additionally, all thesensors relayed data to laptop computers which had to be deployed outside near the tank. However, despite a wet and rainy May, the team experienced a number of brilliantly beautiful days but usually worked under overcast skies; work was cancelled due to rain on only one morning. As the week progressed, open workspace became covered with a canopy, and sun covers were placed over the area of the tank to shade the sensors andpreventinterferencefromlightreflectingoff the bottom of the tank.
Most of the experiments generated good data from all the sensors. Preliminary results indicate that all the sensors tested were responsive to changes in oil concentration and that they were likely responding to different components of the oil. Analysis of the EEMS (excitation-emission matrices) and sensor data, along with the analytical chemistry and droplet size distribution data collected during each experiment, is needed to fully evaluate the implications for future oil spill monitoring. It is clear that the experi-ments will yield considerable insight of value for the development of the next generation of oil sensors and interpretation of field datafrom the DWH oil spill.
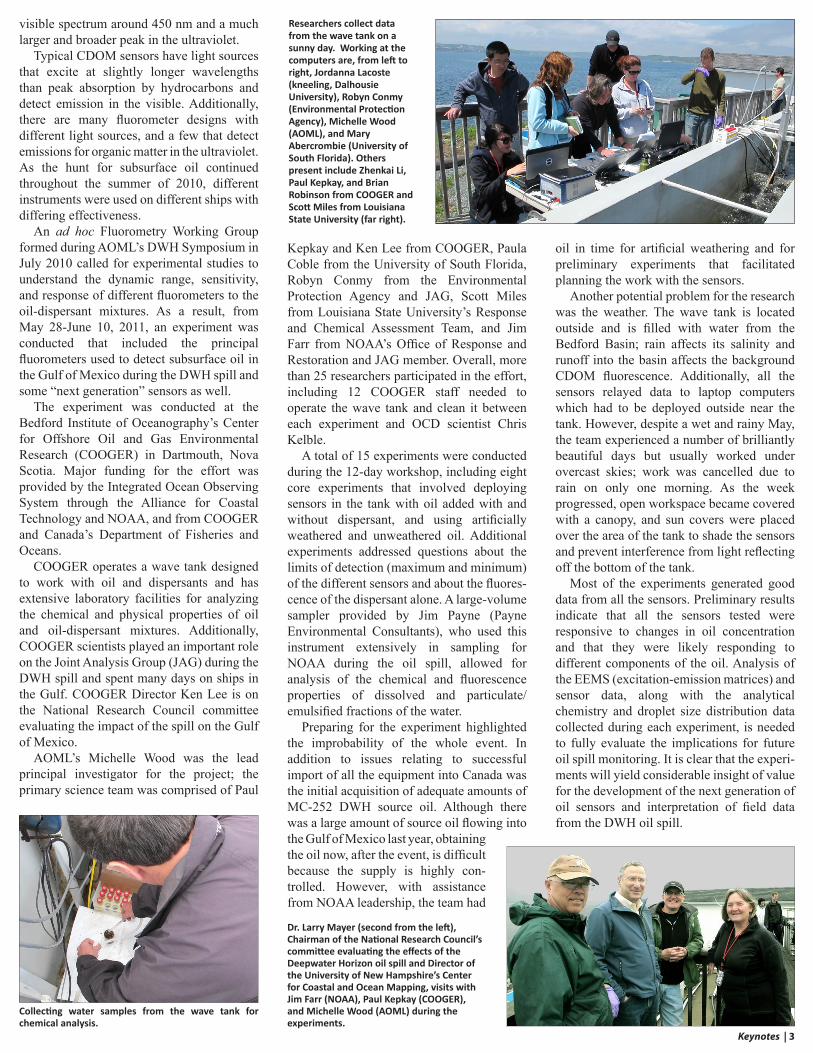
Researchers collect data from the wave tank on a sunny day. Working at the com puters are, from left to right, Jordanna Lacoste (kneeling, Dalhousie University), Robyn Conmy (Environ mental Protection Agency), Michelle Wood (AOML), and Mary Abercrombie (University of South Florida). Others present include Zhenkai Li, Paul Kepkay, and Brian Robinson from COOGER and Scott Miles from Louisiana State University (far right).
Collecting water samples from the wave tank for chemical analysis.