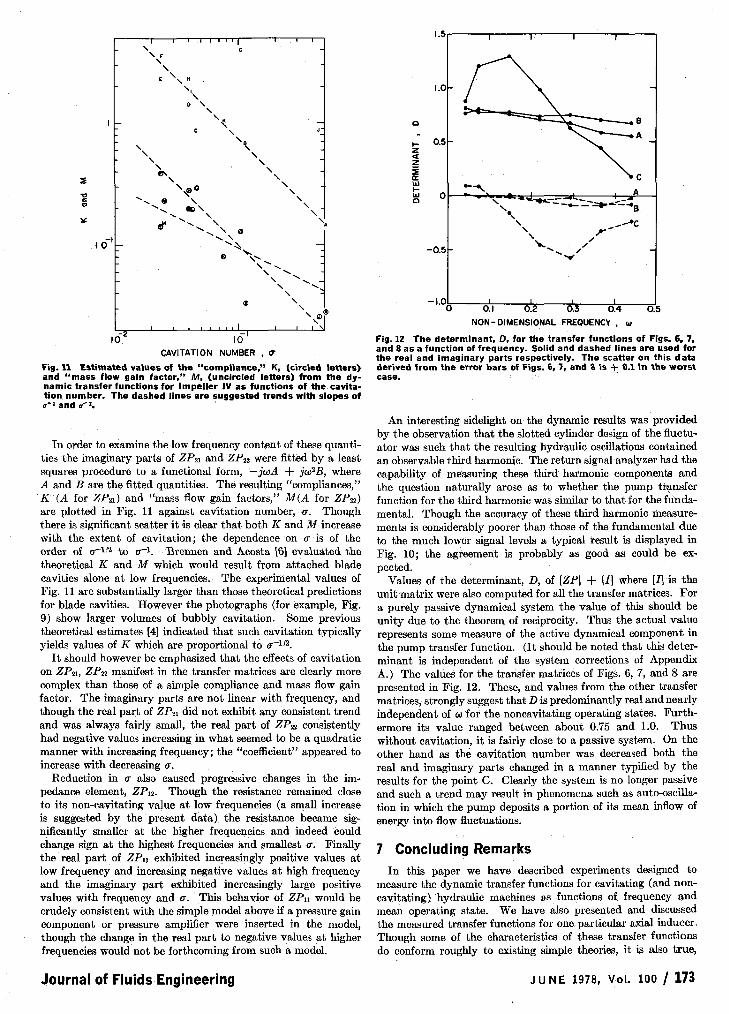
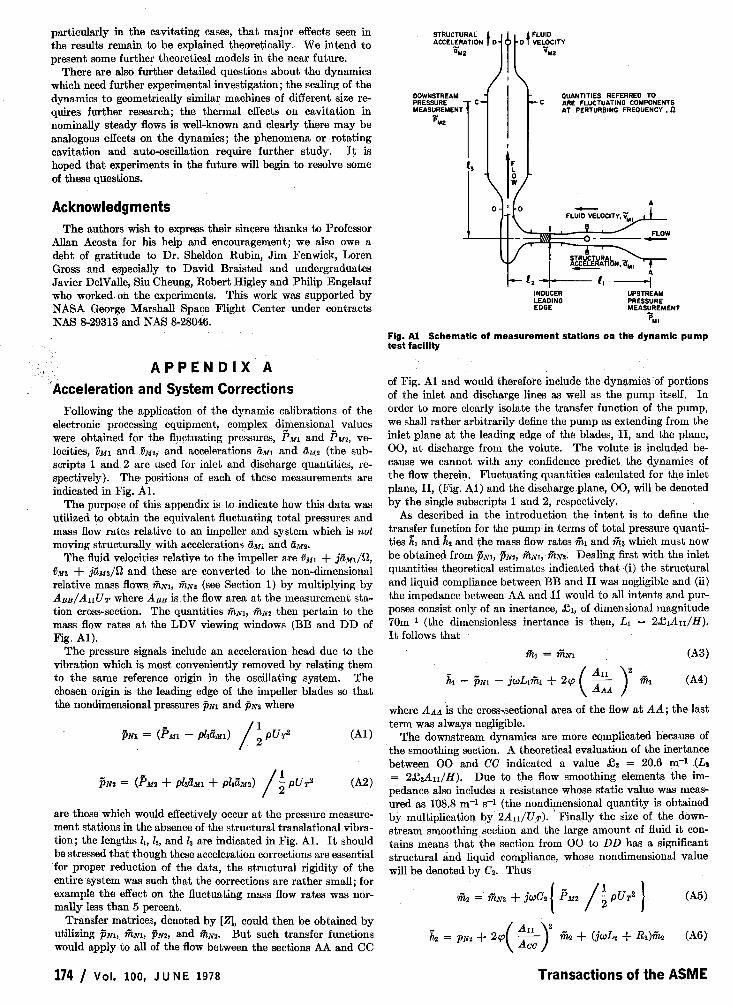
experiments on the dynamic behavior of cavitating pumps
TRANSCRIPT
C. BRENNEN California Institute of Technology
Pasadena, Calif.
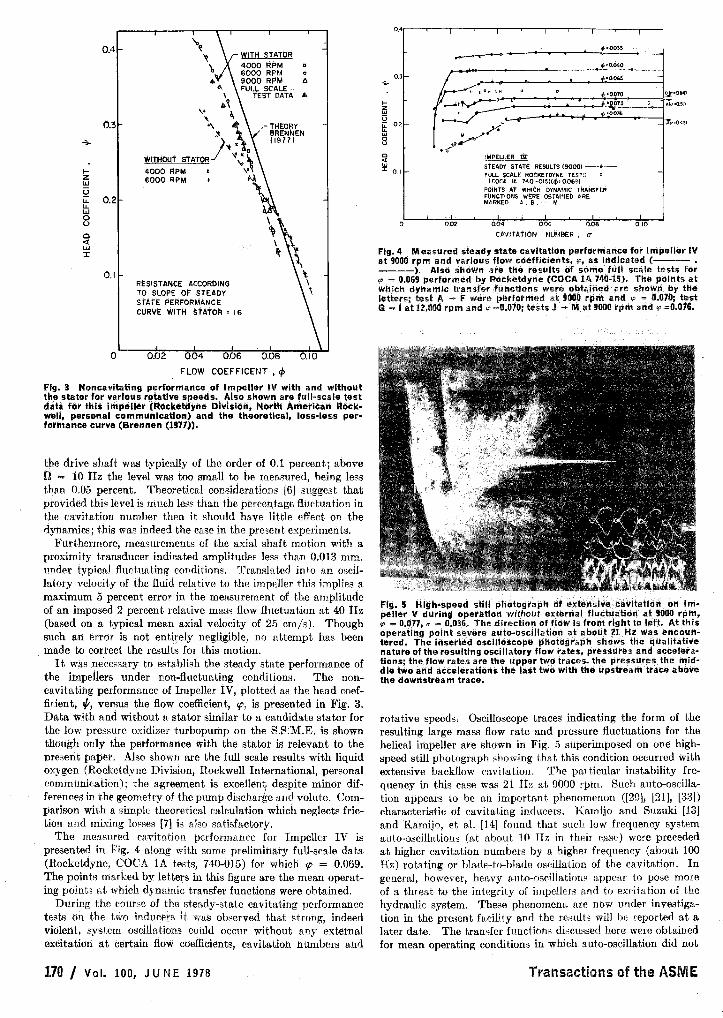
Experiments on the Dynamic Behavior of Cavitating Pumps This paper describes experiments performed to measure the dynamic transfer matrices for cavitating (and noncavitating) pumps. Th.ese transfer matrices describe the rela- tionship between snzall linear oscillatory perturbations in the pressures and mass jlow rates at inlet and discharge jronz the hydraulic machine. The matrices were deduced jrom direct measurements of these fluctuating quantities for diferent modes of excita- lion of the m.achine. Results for a cavitating inducer are presented as functions of frequency and mean operating state. Though some of the trends in the data are con- sistent with existing theoretical models of inducer dynamics, others are not, indicating a need for further theoretical investigation of the dynamic characteristics of such Jlows. The results exhibit increasinglg complex dynamics with increasing cavitation; it ap- pears that the hydraulic machine deviates from an essentially passive response without cavitation to a n increasingly adive response as the cavitation rwmber i s reduced.
1 Introduction The ubiquity of pumps and turbines and the rapidly expanding
need to analyze the transient behavior and stability of the hy- draulic systems of which they are a part has rreated renewed demands for knowledge of the dynamic periorrnanre of hydraulic machines (see, for example [3], [6], [8]).2 Typically such need has arisen either because of unexpected system instabilities (e.g. [29], [25]) or because of demands for more accurate analytical tools for the prediction of known instabilities (e.g. 1241, [31] , 1281) or transients (1181, [17], [ l l ] ) . This paper is confined to dynamic phenomena of relatively low frequency which are hydrodynamic rather than purely acoustical; such frequencies are typically of the order of tens of IIertz or less. In many hydraulic systems the instabilities causing greatest danger lo the integrity of the sys- tem lie within this description.
Within this frequency range, a major stumbling block to further understanding of the dynamics of hydraulic .jystcms is the lack of knowledge of thc relations between the unsteady pressures and mass flow rates a t inlet to a hydraulir machine and the same quantities a t discharge. The present experiments were intended to determine these relations for several axial inducers. The investigations concentrate on the relations for small amplitude, linear perturbations of the mean flow. Clearly one must understand this simpler case before proceeding to
- =Now at Chevron Oil Field Research, La Habra, Calif.
'Numbers in brackets designate References at end of paper.
Contributed by the Fluids Engineering Division for publication in the JOURNAL OF FLUIDS ENGINEERING. ManuscripL received by the Fluids En- gineering Division, May 31, 1977.
large amplitude oscillations which are likely to involve significant nonlinearities for most hydraulic machines. Furthermore, fluctuations in the shaft speed of the machine are neglected; the present experiments were t,ypical of many turbomachines in the sense that the large inertia of the prime-rnover, g a r box, and impeller inhibits any significant shaft speed fluctuation.
Consider a single fluctuation frequency, 9. The small linear perturbations in total pressure_ a t inlet a$ discharge will be denoted by the real parts of hl*ejnl and hz*elQt, re5pcctively; the mass flow rates will be detoted by the real parts of fil*elQ1 and &*ern'. The quantities h,*, fi,* are complex in order to denote the relative phases of the various fluctuations. It is convenient lo nondimensionalixe t,hees quantit,ies by defining
Thus the desired relations between the fluctuating total pressure and mass flow rates at inlet and discharge can be described by a transfer matrix [ZP] defined as
m e transfer matrix, [ZP], will be a function not only of fre- quency, 9, but also of the mean operating state of t,he machine. Thc former is represented by a nondimensional frequency,
= ~ N / U T . The latter is conveniently defined by either the flow coefficient, cp, or the head coefficient, $J. In the event of cavitation an additional parameter namely the cavitation num- ber, a, is needed to describe the mean operating state.
A brief pheno~nenological and historical discussion of he transfer matrix [ZPI may be valuable aL this point. In the
Transactions of the ASME
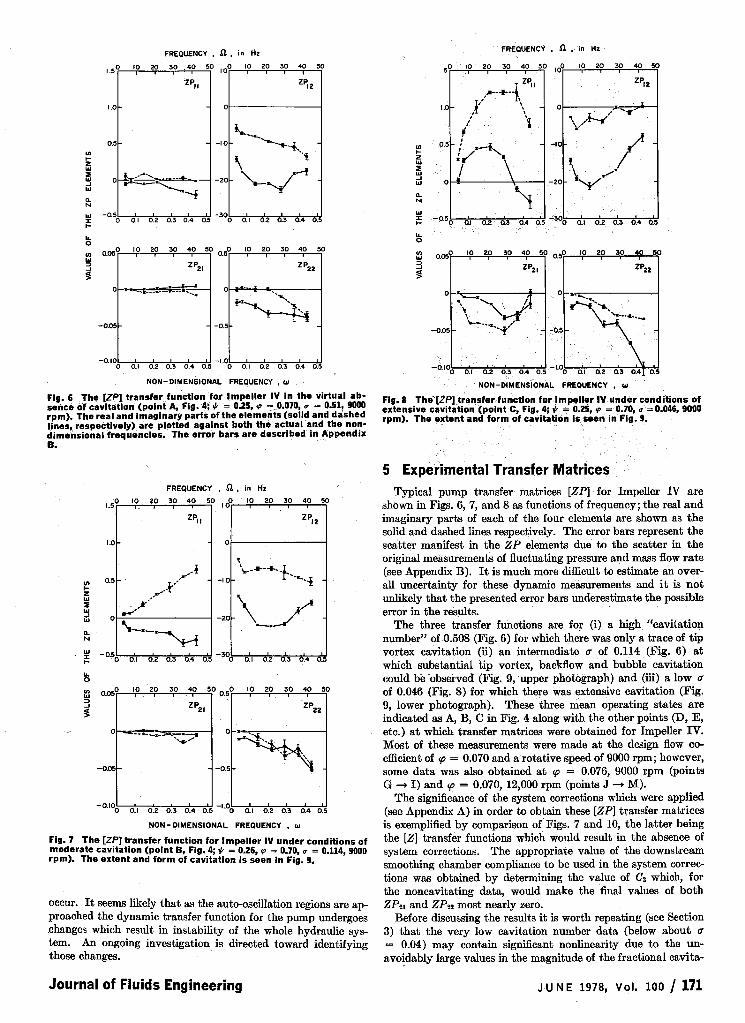
absence of cavitation and neglecting the compressibility of the liquid and containing structure it follows from continuity of mass that both ZPzl and ZPB should be zero. Furthermore the total pressure rise across the pump should be independent of the ab- solute level of the total pressure. Consequently ZPll should be zero and only the impedance term, ZPlz, remains unknown. Notice that under these circumstances the determinant, Dl of [ZP] + [I] where [I] is the unit matrix becomes unity. This implies that the dynamic response of the hydraulic machine is essentially "passive" under the conditions described above. On the other hand, in the presence of cavitation all four elements of the transfer matrix become unknown and the determinant, Dl may no longer be unity, implying "active" dynamic behavior for the device.
Until quite recently those faced with the need to construct dynamic transfer matrices have had little experimental or theoretical knowledge to guide them. For very low frequencies (or gradual transients) it was possible to argue that the hy- draulic machine would simply traverse its steady-state perform- ance curves (see for example [16], [30], [27]). This requires that ZPzl and ZPzz be effectively zero and results in purely real values for both ZPll and ZPlz; the former is clearly related to the slope of the head rise versus inlet pressure characteristic at the mean operating point; the latter is related to the slope of the head rise versus flow rate characteristic at the mean operating point and is conveniently described by a resistance R such that ZPIZ = - R.
Such simple transfer functions are limited to very low fre- quency (though their actual range of validity could not be determined without dynamic experiments). Consequently at- tempts have been made to generate transfer functions for higher frequencies by incorporating first-order, quasistatic terms which are linear in frequency (see for example, [25], (271, [9], [28]). These somewhat arbitrary modifications usually consist of
(i) The addition of an inertial component to the impedance so that ZPU = - (R + jwL) where L is the inertance. This is intended to account for the pressure difference across the hy- draulic machine generated by the acceleration of the mass of fluid within it.
(ii) The addition of a compliance, C, such that ZPzl = - jwC. Though liquid and structural compressibility within the ma- chine could contribute to such a term, it has primarily been used to empirically account for the presence of cavitation.
The real problem is that there is very little reliable and com- plete experimental data which could be used to justify these models, or, at the very least to determine their range of validity in terms of the frequency a t which the results &verge from quasi-steady models. As far as we can determine, the present paper represents the first timc that complete four terminal testing has been performed on a hydraulic machine, in the sense
that both the inlet and discharge fluctuating pressures and mass flow rates have been measured. There have however, been pre- vious dynamic measurements on hydraulic machines which though incomplete in the sense that both inlet and discharge mass flow rates were not measured directly do provide some useful insight. Anderson, Blade, and Stevens [3] performed such measurements on a centrifugal pump in the absence of cavita- tion. Though their data has substantial scatter, particularly at higher frequencies of fluctuation (up to 50 Hz) there is evidence that a t lower frequencies the resistance, R, increases and the inertance, L, decreases with frequency. Clearly one could expect that the resistance would change with frequency due to the com- plicated behavior of the fluctuating boundary layers, separated flows and trailing vortex sheets.
As mentioned earlier, the situation becomes more diicult when the pump or turbine cavitates. There is no fundamental reason to expect that the effects of the cavitation would be con- fined to the compliance, C, introduced in the empirical models. Considerable effort has been made to evaluate the cavitating pump dynamics of liquid rocket engine turbopumps because of the important role played by the dynamics of these pumps in the POGO instability of liquid propelled rockets ([20], [25], [31], [19]). In the absence of direct measurements the mass flow rates in these field tests were inferred from pressure measurements using assumed dynamic models of the systems attached to the pump. Because of their lack of sensitivity such methods have not proved particularly definitive, especially with regard to ZP21 and ZPzz.
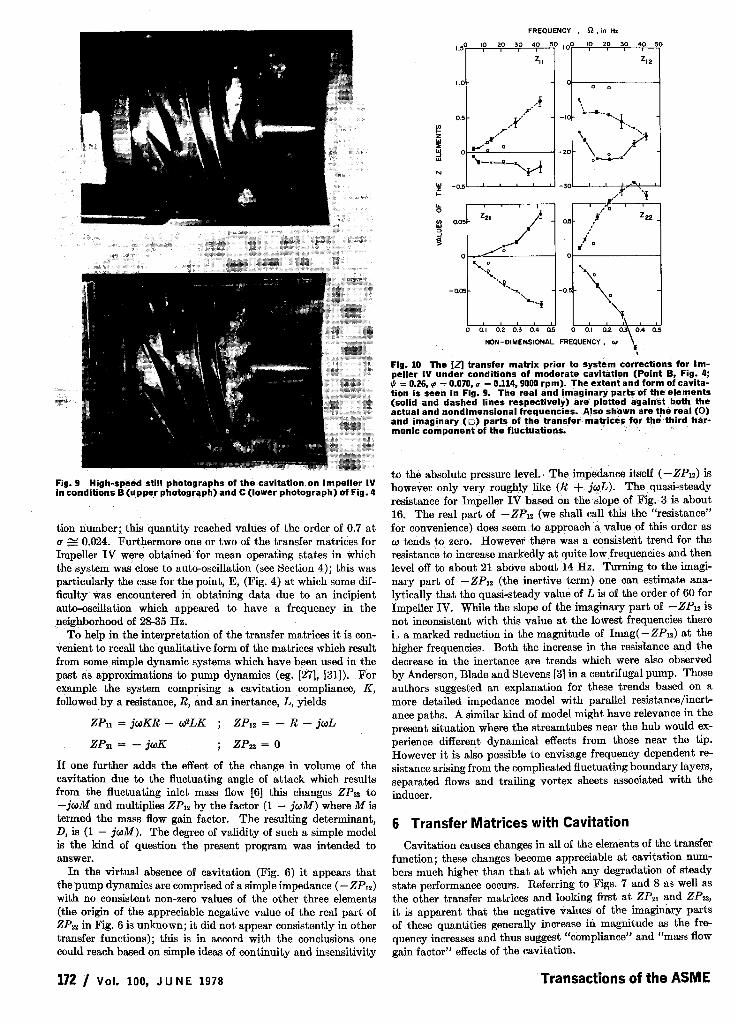
There have also been a number of theoretical efforts to evaluate the elements of cavitating inducer transfer functions. Most of these ([29], [15], [5], [6]) have been based on analyses of un- steady cavitating cascade flows in which the cavitation is in the form of fully developed blade cavities. In particular, i t has been pointed out ([6]) that even in a quasi-static analysis blade cavity volumes will fluctuate with the fluctuating angle of attack as well as the fluctuating inlet pressure. This leads to a non zero value of ZPzs of the form -jQM where M has been termed the mass flow gain factor. However, cavitation patterns in actual inducers are often much more complex involving bubble cavita- tion and tip vortex and backflow cavitation in addition to at- tached blade cavities. Tfie dynamics of these other forms of cavitation have only received very limited analytical attention thus far (141, [lo]).
2 The Dynamic Pump Test Facility The facility fabricated for the purpose of measuring the
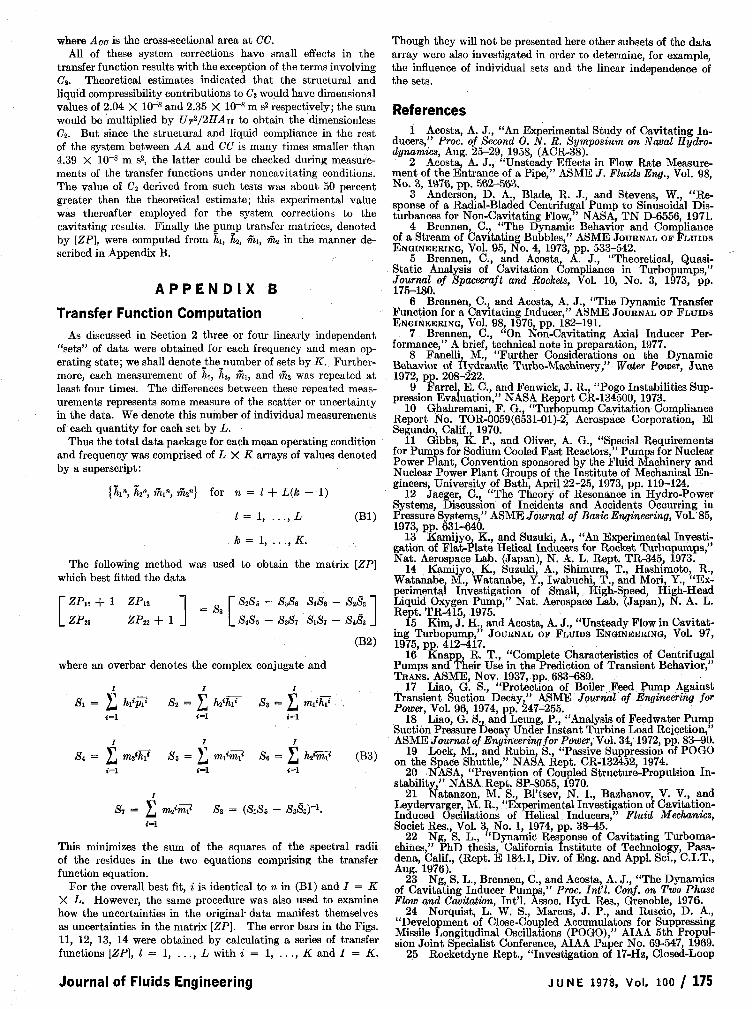
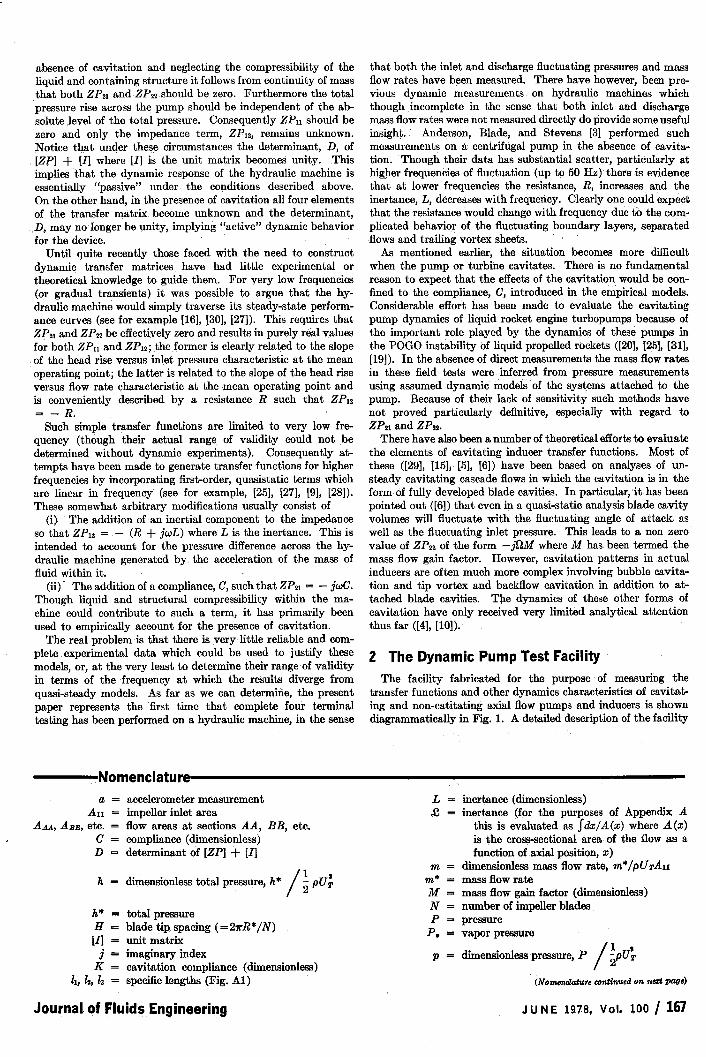
transfer functions and other dynamics characteristics of cavitat- ing and non-catitating axial flow pumps and inducers is shown diagrammatically in Fig. 1. A detailed description of the facility
a = accelerometer measurement AII = impeller inlet area
AAA, ABB, etc. = flow areas a t sections AA, BB, etc. C = compliance (dimensionless) D = determinant of [ZP] + [Il h = dimensionless total pressure, h* 5 pUT
/ l
h* = total pressure H = blade tip spacing ( = 2?rR*/N) [a = unit matrix j = imaginary index
K = cavitation compliance (dimensionless) 11, la, 13 = specific lengths (Fig. Al)
inertance (dimensionless) inertance (for the purposes of Appendix A
this is evaluated as J"~x/A(x) where A(%) is the cross-sectional area of the flow as a function of axial position, x)
dimensionless mass flow rate, m*/pU~An mass flow rate mass flow gain factor (dimensionless) number of impeller blades pressure vapor pressure
dimensionleas pressure, P y U r / l '
(Nomnc2ahrrc continued o n W t pogd
Journal of Fluids Engineering J U N E 1978, Vol. 100 / 167
PRESSURE UEASURUENT STATION AA
E L A u A L U Fig. 1 Schematic plan view of the dynamic pump test facility
is given by Ng ([22]) and only the essential components are out- lined here.
The mean flow generated by the pump proceeds clockwise around the circuit of Fig. 1. The mean flow rate was auto- matically controlled by means of a feedback system from a turbine flow meter to the hydraulically operated throttle valve (the typical response time of this system was of the order of 5 seconds so that it did not interfere with imposed fluctuations).
The basic intent of the experiments was to impose small linear fluctuations on this mean flow over a range of frequencies (up to 42 Hz) and to measure the pressure and mass flow rate fluctua- tions at inlet to and discharge from the pump. Preliminary feasibility studies indicated that the total inertance of the facility had to be minimized in order to achieve moderate levels of pressure fluctuation in conjunction with levels of mass flow rate fluctuation sufficiently large to be measured with reasonable accuracy. This accounts for the compactness of the facility.
Rudimentary examination of the form of the transfer func- tion, [ZPl_(eguation (2)) established that a single set of measure- ments of h ~ , h,, &, and & is insufficient to determine the matrix elementu; a t least two different "sets" of measurements a t the same frequency and mean operating state are required. This neccessitates the capability of exciting the system in a number
of modes (at least two) to obtain a number of linearly independent "sets" of data. In the present experiment this was accomplished using two fluctuators (see Fig. 1). By varying the relative am- plitudes of these fluctuators and the phage between them, any number of Iinearly independent "sets" of data could be obtained for the same frequency and mean operating state. Typically we obtained three or four "sets" of data; then a least squares fitting procedure (see Appendix B) was used to solve for the transfer function, [ZP].
The fluctuators basically acted like variable, oscillatory re- sistances a t their respective positions in the circuit. Within them the flow bifurcates; one stream provides the mean com- ponent of the total flow, the other is directed through concentric slotted cylinders one of which rotates in order to generate the oscillatory component of the flow. The rotors within the two fluctuators are linked by a common shaft and are rotated a t a constant speed by a phase-lock drive motor. This motor is, in turn, driven by a signal of prescribed frequency generated in a Bafco return signal analyzer. Feedback from the drive motor ensured that the excitation of the hydraulic system was phase- locked to this reference signal. This worked well up to 45 Ha. above which phase could not be maintained.
The large air bag shown in Fig. 1 essentially decouples the activities of the two fluctuators. It was also used to control the overall pressure level within the hydraulic system.
3 Fluctuating Signal Level and Measurement The most difficult aspect of the experiment is the measurement
of fluctuating mass flow rate. Within the range of excitation fre- quencies the measurements of fluctuating pressure were relatively simple and were made using Statham transducers a t the points indicated in Figs. 1 and Al. On the other hand, the fluctuating mass flow rates were derived from measurements of the fluctuat- ing velocities made with two laser doppler velocimeters (LDVs). Special sections fitted with lucite windows, one upstream and the other downstream of the pump (Fig. 1) permitted measure- ment of the instantaneous velocities in the centers of those sec- tions. Three major design and measurement considerations were involved in the use of these LDVs:
(i) The amplitude of the imposed mass flow fluctuations had to be sufficiently large so that they could be measured with ac- curacy but small enough to lie within a regime of linear perturba- tion. Several tests were carried out to investigate the linearity of the system at various levels of excitation ([22]). The simplest of these involved tests with only one fluctuatar activated; as the fluctuation amplitude was increased the response of the sys- tem was observed to be linear up to and beyond amplitudes of mass flow rate fluctuation of the order of about 2 percent of the mean mass flow rate. Other tests, including the "third-harmonic test" discussed in Section 6, resulted in this level of fluctuation
-Nomenclature (continued) R = resistance (dimensionless)
R* = impeller tip radius t = time
UA = mean axial fluid velocity at impeller inlet UT = impeller tip speed
v = axial fluid velocity [ZI = overall dynamic transfer matrix
[ZP] = pump transfer matrix p = liquid density
c = cavitation number = (A - P v ) / $J;
cp = flow coefficient, UA/UT
# = head coefficient, (h* - L ~ * ) / ~ U ;
f2 = fluctuation frequency w = reduced frequency, QH/UT
Subscripts
i = designating inlet (i = 1) or discharge ( i = 2) quantities
Mi = measured fluctuating quantities Ni = fluctuating quantities corrected for accelera-
tion effects Superscript
- = overbar denotes mean, time-averaged quanti-
ty - = tilda denotes complex, fluctuating quantity n = designates an individual experimental meas-
urement
168 / VOI. loo, J u N E 1978 Transactions of the ASME

being used in all of the transfer function measurements. The corresponding amplitude of pressure oscillation was of the order of 2.5 X 10⁴ N/m2 compared with the typical total pressure rise across the impeller of 7 X 10⁵ N/m2. However, i t should be pointed out that this comparison of the pressure amplitude could lead to a somewhat false sense of security when dealing with cavitating flows in which the local absolute pressure in the cavitating region becomes very much smaller than the head rise. Inevitably the percentage fluctuation in the cavitation number becomes larger and larger as the mean cavitation number is re- duced (see Section 6).
(ii) The point velocity measurements made by the LDVs had to be accurate manifestations of the instantaneous mass flow rates and the level of turbulence in the measurement sec- tions (picked up as noise by the LDVs) had to be sufficiently small to achieve acceptable fluctuating signal to 'noise levels. Toward these ends the flow prior to each LDV measuring see- tion is smoothed by means of screens and honeycombs followed by carefully designed nozzles of 9:l contraction ratio (see Fig. I). The need to do this downstream of the pump because of the high- ly turbulent pump discharge exacted a price: the downstream smoothing section had its own dynamic characteristics which had to be determined and subtracted from the measured transfer function in order to extract the transfer function of the pump alone (see Appendix A). As a result of these devices the tur- bulence level measured by the LDVs was reduced to about 0.5 percent so that the LDV fluctuating signal to broad band noise level was typically of the order of 4:l. Furthermore, total head pitot-tube traverse measurements indicated a flat mean velocity profile with a boundary layer thickness of about 5 per- cent of the internal diameter of the measuring section. The oscillatory velocity profile measured by the LDVs was flat with negligible phase change up to the maximum radius which could be examined with the present viewing windows (that is to about half the distance to the walls). Acosta [ l ] has shown that under these conditions the oscillatory boundary layer yields a negligible effect on the oscillatory mass flow calculation.
(iii) Potential errors in the fluctuation measurements due to vibration of the components of the system were minimized by the heavy, rugged construction of the pump housing, volute and adjacent hydraulic components and by mounting the entire system on a very rigid support structure [22]. Originally the lasers and photomultipliers of the LDVs were mounted on a sturdy framework which was also rigidly attached to this mountr ing structure for the purpose of accurate measurement of the fluctuating velocities relative to the impeller. However, a number of preliminary tests established that more repeatable velocity measurements could be made by isolating the LDV framework from the main support structure so that the LDVs measured fluctuating velocity in laboratory coordinates. Then the re- quired fluctuating velocities relative to the impeller were ob- tained by applying corrections derived from the outputs of two Statham accelerometers attached to the lucite window sections (see Appendii A). Normally these corrections were very small and did not exceed 5 percent of the fluctuating velocity in the worst case.
Other precautions and preliminary tests are described in Ng [22]. For example all the high points in the circuit were fitted with bleed valves for the collection and removal of air bubbles and the structural compliance of the hydraulic components be- tween the measuring stations was minimized by the thick-walled steel construction of these components.
The six basic fluctuating signal measurements (two LDV, two pressure transducers and two accelerometer outputs) plus the basic reference signal exciting the system were simultaneously recorded in real time during the experiments. Subsequently each of the six measurements were cross-correlated with the reference signal using a Bafco return signal analyzer in order to obtain the in-phase and quadrature components of each signal a t the
basic excitation frequency. No particular significance was at- tached to the phase relative to the reference signal; the purpose was to establish the phase between each of the six measurements.
As far as possible all of the electronic processing equipment used for each of the six measurements was calibrated dynamically ([22]) and these calibrations were then applied to the in-phase and quadrature components of the measurements. The i n ~ e r - mediate results were six complex quantities CMI, inat, Fnal, PM~,
and l i ~ 2 representing the basic fluctuation measurements. Corrections for the accelerations and for the ancillary system dynamics were then applied as discussed in Appendix A. Trans- fer functions for the pump for each fluctuation frequency and mean operating state were then calculated as described in Ap- pendix B.
Impellers and Their Steady State Performance Experiments were performed with a number of 7.58 cm diam-
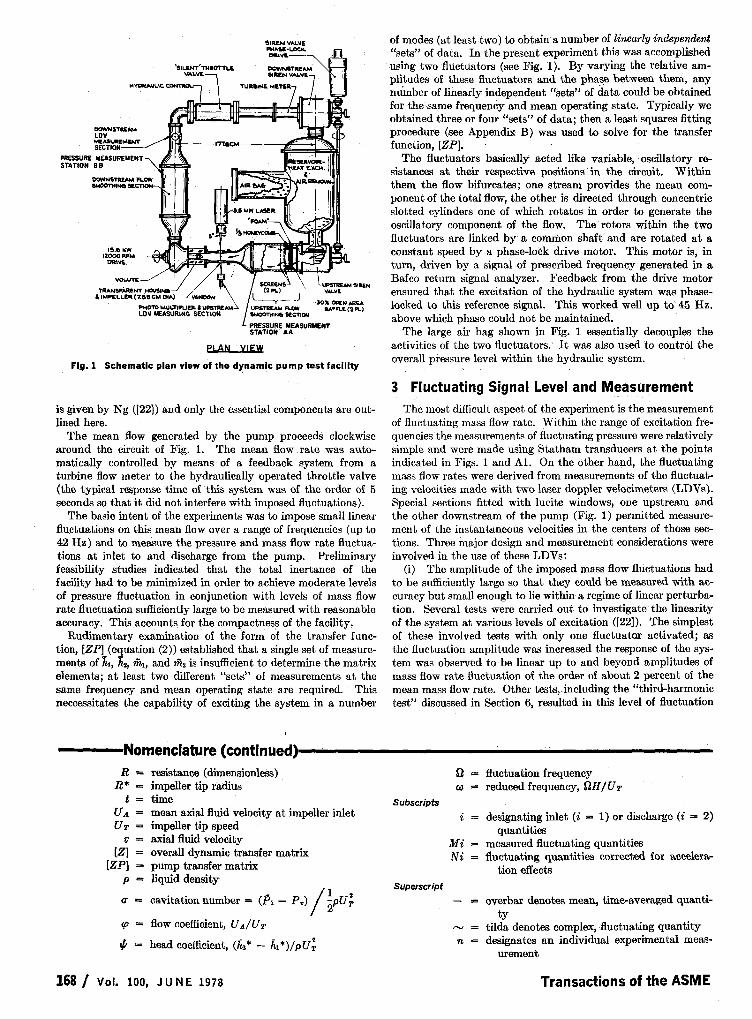
eter axial flow impellers enclosed in a lucite housing to allow still and movie photography of the cavitation. Dynamic transfer functions were obtained for a simple 9' helical impeller and for an accurate scale model for the low pressure oxidizer turbopump in the Space Shuttle Main Engine (Impeller IV, Fig. 2). The former was made of stainless steel, the latter of aluminum which, incidentally, implied true scaling of the nondimensional static blade deflection under the applied hydrodynamic loads. With both impellers there were significant changes in the transfer function as the mean operating state, and in particular the cavita- tion number, was varied. Since these changes were similar in both impellers we shall for brevity confine our presentation to the results for the S.S.M.E. Impeller IV. It should however be noted that similar results for the helical inducer suggest that the transfer functions are at least qualitatively independent of the geometry of the inducer.
The impellers were driven a t up to 12,000 rpm by a 15 kw motor. Considerable effort was expended to minimize the fluctuations in both the rotational speed and the axial motion of the im~ellers relative to the housing structure. These fluctua- tions were also monitored in order to insure that such extraneous motions did not impact the dynamic results. At low frequencies of excitation (0 = 5 Hz) the rotational speed fluctuation meas- ured using a proximity transducer and a 60 tooth steel wheel on
1 2.@43 T.E.
Fig. 2 Sketches of the two 7.58 cm diameter impellers tested. Im- peller V on the left is a simple go helical inducer. Impeller I V on the right is 1/4 scale model of the low pressure oxidizer pump in the Space Shuttle Main Engine. (Simple ellipsoidal nose cones were added but are not shown.)
Journal of Fluids Engineering J U N E 1978, Vol. 100 / 169