expert group on rice 28 june 2018
TRANSCRIPT

EXPERT GROUP
on rice
28 June 2018
DG Agriculture and Rural Development
European Commission
Jeroen Smits
Rice Market Officer

Contents: 1. INTRA TRADE 2. International and EU prices 3. EU Rice Imports 4. EU Rice Exports 5. TRQs
2

INTRA TRADE
3

Intra trade of rice (in milled eq. excl broken) into ITALY (source: EUROSTAT)
4

Intra trade of rice (in milled eq. excl broken) into SPAIN (source: EUROSTAT)
5

Intra trade of rice (in milled eq. excl broken) into PORTUGAL (source: EUROSTAT)
6

Intra trade of rice (in milled eq. excl broken) into FRANCE (source: EUROSTAT)
7

Intra trade of rice (in milled eq. excl broken) from ITALY (source: EUROSTAT)
8

International and EU prices
9

2017/18 Rice World Market (Source: AMIS Market Monitor June 2018)
10

International Rice Prices
11

EU Rice Market Prices (milled)
12

EU Rice Imports: - Total rice imports - EBA rice imports - Imports of rice in packages < 20 kg - Basmati
13
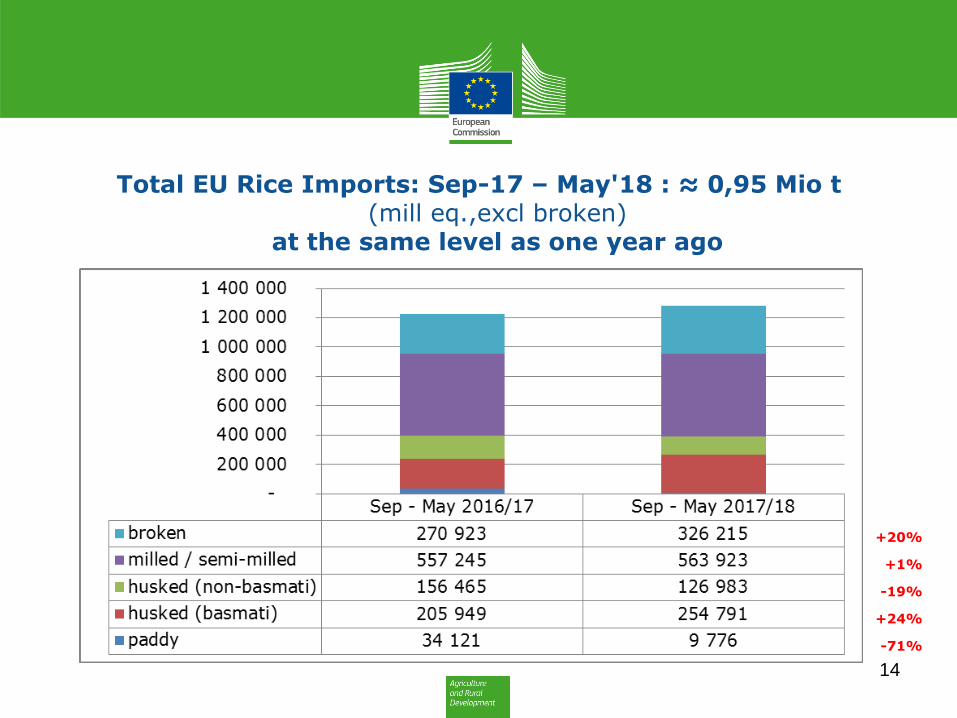
Total EU Rice Imports: Sep-17 – May'18 : ≈ 0,95 Mio t (mill eq.,excl broken)
at the same level as one year ago
+20%
+1%
-19%
+24%
-71%
14

Total EU Rice Imports Sep – May 2017/18: = Sep – May 2016/17
15

EU Rice imports per origin (Sep'17 – May'18, milled basis, broken rice excluded)
Total imports = 955 473 tonnes
16

EU Rice imports per destination (Sep 2017 – May 2018, milled basis, broken rice excluded)
Total imports = 955 473 tonnes
17

EBA rice imports: UP + 1% in 2017/18 Sep'17-May'18: 273 499 tonnes (mill eq, excl. broken)
+16%
+2%
-36%
18

EBA Rice Imports Sep – May 2017/18: + 1 % vs Sep – May 2016/17
19

EBA Imports – Destination Sep –'17 – May'18: 273 498 tonnes milled eq. excl. broken
20
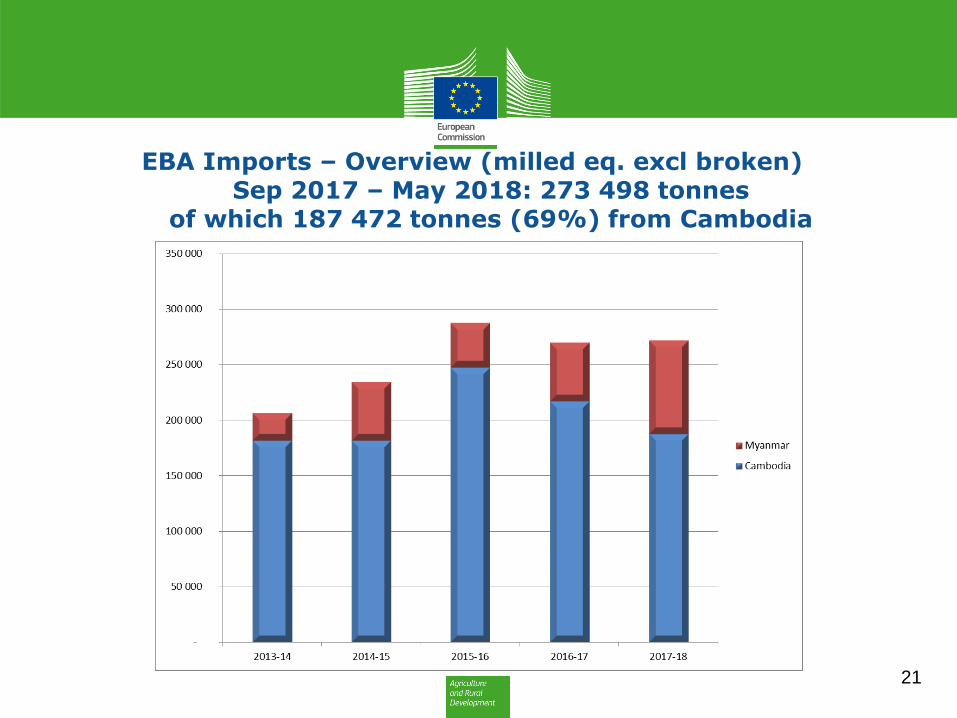
EBA Imports – Overview (milled eq. excl broken) Sep 2017 – May 2018: 273 498 tonnes
of which 187 472 tonnes (69%) from Cambodia
21

EBA rice imports Sep'17 – May'18 (all types, milled eq.)
Cambodia vs Myanmar
22

Total Husked & Milled rice imports (CN 1006 20 & 30)
(September 2017 – May 2018)
23

Cambodia packed rice imports the first 9 months of MY Imports of small packages < 5 kg and 5-20 kg respectively
(in tonnes milled eq.)
24

EU Rice Imports – Small packages (< 20kg) September 2017 – May 2018: +8% vs 2016/17
25

Sep 2017 – May 2018: 234 805 t
EU Rice Small Packages Imports - Origin
26

September 2017 – May 2018: 234 805 t
EU Rice Small Packages Imports - Destination
27

Husked Basmati Imports – Origin Sep 2017 – May 2018 : 254 958 tonnes (milled eq.)
28

Husked Basmati Imports – Origin MY 2017/18 : 254 958 tonnes (milled eq.)
of which 59% from India and 41% from Pakistan
29

Husked Basmati Imports – Destination Sep 2017 - May 2018 : 254 958 tonnes (milled eq.)
30

EU Rice Exports
31

Total EU rice exports: Up +19% in 2017/18 Sep '17 – May '18: 244 859 t (milled eq, excl. broken)
+8%
+20%
+23%
+5%
32

Total Rice Exports Sep - May 2017/18: + 19 % vs Sep - May 2016/17
33

EU Rice Exports – Origin September 2017 – May 2018 : 244 859 T milled eq.
34

EU Rice Exports – Destination Sep'17 – May'18: 244 859 t (milled eq, excl. broken)
35

TRQ's
36

TRQ's of milled/semi-milled rice Article 1(1)(a) – final % take-up for 2017
37

TRQ's of husked rice Article 1(1)(b) – final % take-up for 2017
38

TRQ's of broken rice Article 1(1)(c) – final % take-up for 2017
39

TRQ's of milled/semi-milled rice Article 1(1)(d) – final % take-up for 2017
40

TRQ's of broken rice Article 1(1)(e) – final % take-up for 2017
41
