expert panel report: bainbridge township … 3e...expert panel report: bainbridge township...
TRANSCRIPT

Expert Panel Report: Bainbridge Township Subsurface Gas Invasion 3. Additional Data – Wellhead LELs
3 - 109
Wellhead LEL Data This subsection describes the additional lower explosive limit (LEL) measurements made in the headspace or vents of water wells in the investigation area subsequent to publication of the 2008 DMRM report and the PowerPoint presentation made by Dr. Eckstein in May 2009. These additional data were not available to either party for use in their reports. Wellhead LEL data are the last measurements taken along fugitive gas migration pathways from the English #1 well to local water wells. As a result, the occurrence and concentration of wellhead LEL values are dependent on what occurred during the preceding segments in the migration (see preceding sections in Chapter 3). LEL measurements alone do not identify specific subsurface conditions, determine gas migration pathways, or predict future subsurface conditions. LEL data must be integrated with other site-specific lines of evidence including geologic conditions, the laws governing fluid flow, and the construction details of wells and pumping histories of specific wells to formulate a realistic conceptualization of gas migration. Ignoring these other equally important lines of evidence is equivalent to asking a medical doctor to diagnose an illness solely by taking a measurement of body temperature. Without knowledge of other important facts (blood pressure, blood chemistry, diet, kidney function, lung function, etc.), the doctor’s diagnosis is pure speculation. Measurement of Wellhead LELs Natural gas is a mixture of methane, ethane, propane, and butane. Methane normally represents 70 to 98 percent of the mixture (Hyne, 2001). All four components are combustible (think gasoline, barbeque gas tanks, cigarette lighters). If a source of ignition exists, methane is explosive at concentrations ranging from 5 to 15 percent (by volume). For example, in a basement containing 95 percent atmospheric gases (think air) and 5 percent methane, combustion could occur if the methane contacts the pilot flame of a hot water. Safety officials developed the concept of a lower explosive limit to emphasize the danger of explosion by exaggerating the scale used to measure levels of natural gas. On the standardized scale used by fire departments and safety officials across the country, the lower limit of explosivity, 5 percent natural gas by volume, is re-defined as 100 percent of the LEL. The equations used to define the percent of the LEL are Wellhead LEL measurements first were taken in on December 16, 2007. These measurements continue today. Figure 3-97 shows a typical LEL measurement in a basement well using a SENSIT® GOLD meter (Figure 3-98). The meters used to make these measurements must be periodically re-calibrated to ensure reliability. Since the first LEL measurements were taken in the impacted area on December 15, 2007, five different meters have been used by seven different field inspectors. The accuracy and precision
and
20
20
Percent LEL volume percent methane x
percent LELVolume percent methane
=
=

Expert Panel Report: Bainbridge Township Subsurface Gas Invasion 3. Additional Data – Wellhead LELs
3 - 110
of LEL measurements is uncertain because of the differing field conditions at each well and because of instrument and operator variability (DMRM, 2009). As a result, analysis and interpretation of LEL data should not be based on an individual measurement but on the trends of measurements over time.
Figure 3-97. Wellhead LEL measurement Figure 3-98. High precision gas detector. in the McGee well (7859 Scotland Dr). Following the explosion at the Payne home on December 15, 2007, field inspectors measured LEL values in wells and in homes at 78 locations. During 2009, a contractor hired by OVE measured LELs at 71 residences on a routine basis. Measurements of LELs were made weekly at 35 residences, bi-weekly at 10 residences, monthly at 13 residences, and bimonthly at 13 residences (DMRM, 2009). All of these records are on file at ODNR-DMRM. The 2008 DMRM report addressing the subsurface gas invasions in Bainbridge Township did not include an equivalent section assessing and interpreting LEL trends as done by E&A in its PowerPoint presentation in 2009. One of the first requests made by the expert panel was for DMRM to prepare and submit its own assessment and interpretations of the wellhead LEL data. This report (DMRM, 2009) was submitted to the expert panel in December 2009. According to these data, 56 wells (72 percent of the total) never had a LEL measurement above one percent. Consequently, LEL patterns could not be discerned in them. Appendix F contains graphs of LEL measurements taken at 30 residential wells. The locations of these wells are shown in Figure 3-99, which also shows structure contours of the top of the Berea Sandstone.

Expert Panel Report: Bainbridge Township Subsurface Gas Invasion 3. Additional Data – Wellhead LELs
3 - 111
Figure 3-99. Locations of water wells with LEL graphs and well characteristics in Appendix F. Analysis of Wellhead LEL Patterns The expert panel used the DMRM (2009) LEL report to provide background information, to study what variables may influence individual wellhead LEL measurements, and to examine data trends and patterns on its large-format (11 x 17 inch) graphs. The expert panel reviewed the DMRM (2009) report and presents its own interpretations of the wellhead LEL information. The focus of our wellhead LEL interpretations is on the migration of the fugitive gas from the Berea Sandstone into local wells completed in the Berea Sandstone, Cuyahoga Shale, and Sharon Sandstone. From this perspective, wellhead LEL measurements represent the final detection point for fugitive gas molecules along their many migration paths from the overpressurized surface-production casing annulus in the English #1 well, vertically upward through the Ohio and Bedford shales, upward in the Berea Sandstone where they are re-distributed laterally, and finally upward into the Cuyahoga Shale and Sharon Sandstone where they can be detected in a well. As described on pages 3-49 to 3-105, the migration of natural gas is controlled by its buoyancy and by the direction and magnitude of groundwater flow, according to well-established laws of physics. The areal distribution of fugitive gas rising vertically adjacent to an overpressurized gas well changes substantially if the gas rises into a permeable layer, as described by Harrison (1983, 1985) and shown in Figure 3-64. In the Bainbridge investigation area, the redistribution of gas is seen in the sequence of diagrams showing the spatial and temporal changes the locations fugitive gas in the Berea Sandstone (Figures 3-81 to 3-88). These changes are reflected in the trends and patterns of gas concentrations measured as LEL values in local water
Expert Panel Report: Bainbridge Township Subsurface Gas Invasion 3. Additional Data – Wellhead LELs
3 - 112
0
10
20
30
40
50
60
70
80
90
100
12/1
9/20
07
1/19
/200
8
2/19
/200
8
3/19
/200
8
4/19
/200
8
5/19
/200
8
6/19
/200
8
7/19
/200
8
8/19
/200
8
9/19
/200
8
10/1
9/20
08
11/1
9/20
08
12/1
9/20
08
1/19
/200
9
2/19
/200
9
3/19
/200
9
4/19
/200
9
5/19
/200
9
6/19
/200
9
7/19
/200
9
8/19
/200
9
9/19
/200
9
10/1
9/20
09
11/1
9/20
09
12/1
9/20
09
1/19
/201
0
Date
Wel
lhea
d LE
L (p
erce
nt o
f 5%
met
hane
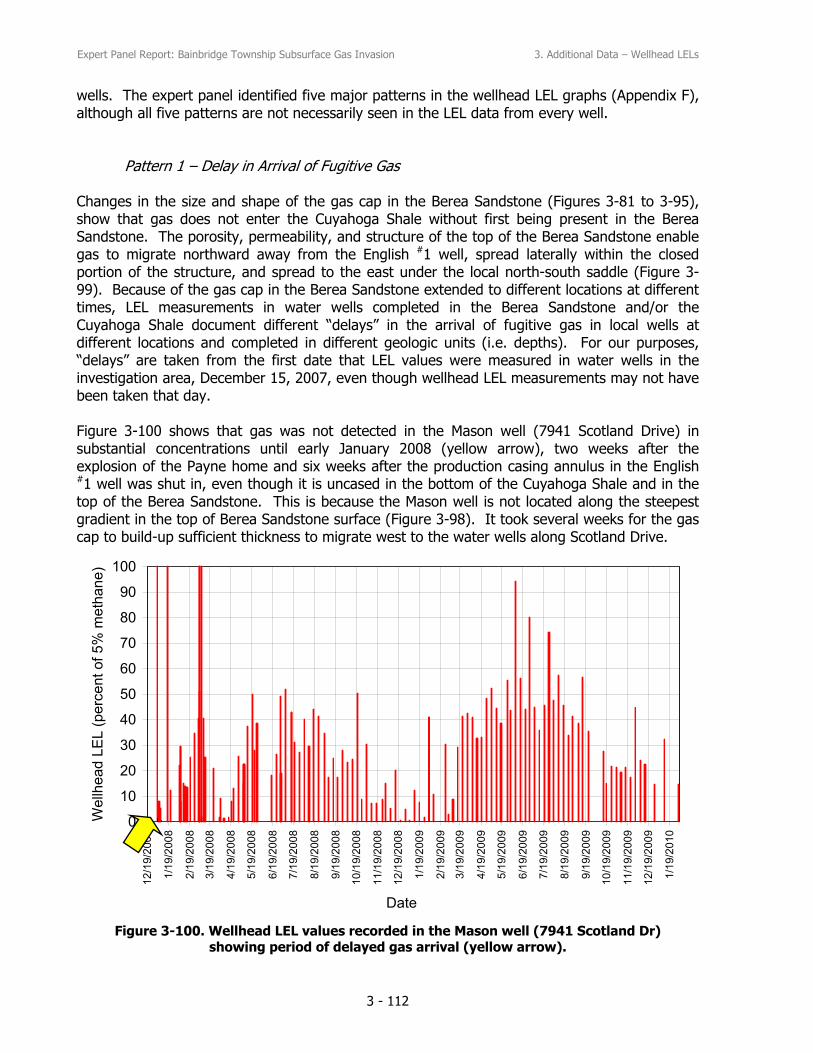
)wells. The expert panel identified five major patterns in the wellhead LEL graphs (Appendix F), although all five patterns are not necessarily seen in the LEL data from every well. Pattern 1 – Delay in Arrival of Fugitive Gas Changes in the size and shape of the gas cap in the Berea Sandstone (Figures 3-81 to 3-95), show that gas does not enter the Cuyahoga Shale without first being present in the Berea Sandstone. The porosity, permeability, and structure of the top of the Berea Sandstone enable gas to migrate northward away from the English #1 well, spread laterally within the closed portion of the structure, and spread to the east under the local north-south saddle (Figure 3-99). Because of the gas cap in the Berea Sandstone extended to different locations at different times, LEL measurements in water wells completed in the Berea Sandstone and/or the Cuyahoga Shale document different “delays” in the arrival of fugitive gas in local wells at different locations and completed in different geologic units (i.e. depths). For our purposes, “delays” are taken from the first date that LEL values were measured in water wells in the investigation area, December 15, 2007, even though wellhead LEL measurements may not have been taken that day. Figure 3-100 shows that gas was not detected in the Mason well (7941 Scotland Drive) in substantial concentrations until early January 2008 (yellow arrow), two weeks after the explosion of the Payne home and six weeks after the production casing annulus in the English #1 well was shut in, even though it is uncased in the bottom of the Cuyahoga Shale and in the top of the Berea Sandstone. This is because the Mason well is not located along the steepest gradient in the top of Berea Sandstone surface (Figure 3-98). It took several weeks for the gas cap to build-up sufficient thickness to migrate west to the water wells along Scotland Drive.
Figure 3-100. Wellhead LEL values recorded in the Mason well (7941 Scotland Dr) showing period of delayed gas arrival (yellow arrow).

Expert Panel Report: Bainbridge Township Subsurface Gas Invasion 3. Additional Data – Wellhead LELs
3 - 113
Many wells demonstrate this delayed gas arrival. In Appendix F, compare the wellhead LEL graphs of the McGee, Ohara, Komocki, Kukoleck, and Bastifell wells along Scotland Drive with the graphs of the Jordan and Calo wells, which are along the steepest gradient on the top of Berea Sandstone surface, with the graphs of the Prochazka, de Gaetano, and Johnson wells along Kingswood Drive. There is a marked difference in the arrival of fugitive gas in these three groups of wells, which are all open (uncased) in the upper part of the Berea Sandstone and, with the exception of the Komocki well, in the lower part of the Cuyahoga Shale. Table 3-6 lists wells open in the lower part of the Cuyahoga Shale and the upper part of the Berea Sandstone, address and property owner, distance to the English #1 well, and the delay (in days) in detection (arrival) of LEL values > 1 percent. Table 3-5 also lists similar statistics for wells open in the upper part of the Cuyahoga Shale and the lower part of the Sharon Sandstone. The locations of all these wells are shown on Figure 3-99.
Table 3-5. Delay in Detection (Arrival) of Wellhead LELs in Wells
Address of Cuyahoga / Berea Well
Cuyahoga / Berea Well Owner
Abbreviationon Fig. 3-98
Distance (feet) English Well
Delay (days)
17990 English Dr Jordan Jo 958 4 17959 Kingswood Dr Calo Ca 627 4 17971 Kingswood Dr de Gaetano de 974 19 7859 Scotland Dr McGee Mc 2386 17 7897 Scotland Dr Buddenhagen Bu 1853 21 7950 Scotland Dr Komocki Ko 1609 23 7969 Scotland Dr Kukoleck Ku 1253 9 7981 Scotland Dr Bastifell Ba 1037 21 17927 Kingswood Dr Prochazka Pr 1664 25 7846 Scotland Dr Ohara Oh 2400 25 7941 Scotland Dr Mason Ma 1494 19 17926 Kingswood Dr Johnson Jh 1686 33
Address of Sharon / Cuyahoga
Well Sharon / Cuyahoga
Well Owner Abbreviationon Fig. 3-99
Distance (feet) English Well
Delay (days)
17995 English Dr Czernicki Cz 595 0 17838 English Dr Donaldson Do 932 5 17939 English Dr Gaub Ga 1270 11 7927 Scotland Dr Selby Se 1624 57 17970 Kingswood Dr Wozniak Wo 892 61 17937 Kingswood Dr Petheridge Pe 1544 79 7868 Scotland Dr Mesmer Me 2255 117 17959 English Dr Cooper Co 1118 144 17955 English Dr Weber We 1110 150 17925 English Dr Maguire Ma 1400 243
For wells open in the lower part of the Cuyahoga Shale and in the upper part of the Berea Sandstone (yellow diamonds), Figure 101 shows a positive relationship exists between the delay in detection of wellhead LELs and the distance of the well from the English #1 well (R2=0.34). This positive relationship is expected, if and only if, the gas cap migrated along the top of the

Expert Panel Report: Bainbridge Township Subsurface Gas Invasion 3. Additional Data – Wellhead LELs
3 - 114
0
100
200
300
400
500
0 500 1000 1500 2000 2500 3000
Radial Distance from English #1 Gas Well (feet)
Wel
lhea
d LE
L D
elay
Tin
e (d
ays) Cuyahoga / Berea wells
Sharon / Cuyahoga wells
Berea Sandstone, then occurred as upward leakage along vertical joints in the Cuyahoga Shale,
as specifically shown in the sequence of Stage 1 diagrams (Figures 3-81A through 3-88A).
Figure 3-101. Relationship between delay of wellhead LELs and distance from the English #1 well for Cuyahoga / Berea wells.
Figure 3-101 shows no relationship exists between the delay in the arrival of wellhead LELs and the distance of the well from the English #1 well (R2=0.04) for wells open to the upper part of the Cuyahoga Shale and the lower part of the Sharon Sandstone (red circles). The lack of a relationship is expected because gas migration up in the Cuyahoga Shale is controlled by the buoyancy of the gas and the presence or absence of vertical joints and bedding planes to migrate within. As a result, the rate of gas migration in the Cuyahoga Shale, where these wells are open, is far more sporadic than the rate of gas migration to wells open to the Berea Sandstone wells (Table 3-6, Figure 3-101), where gas migration is controlled by buoyancy, the configuration of the top of Berea Sandstone surface, and groundwater flow influences. Pattern 2 – Dissipation by Intentional Overpumping During Stage 2, fluid pressures in the Berea Sandstone rapidly dissipated due to intentional overpumping of selected residential wells. This action not only caused the bottom of the gas cap to rise between late December 2007 and July 2008 (Table 3-5, Figure 3-59), it also caused wellhead LELs to decrease substantially in the areas where overpumping occurred. Appendix G lists the addresses of residents that used temporary tanks during this period and, therefore, could overpump their wells. Table 1-1 identifies 16 specific wells that were periodically overpumped during this seven month period. Figure 3-85B shows the locations of these wells. The open (uncased) intervals in these wells differ. Some of these wells are open to the Cuyahoga Shale / Berea Sandstone, whereas others are open to the Cuyahoga Shale / Sharon Sandstone, and still others are open only to the Sharon Sandstone (Appendix F). Overpumping is particularly effective at removing fugitive gas from aquifers like the Berea and Sharon sandstones that have sufficiently large values of intergranular porosity and permeability to transmit gas occupying pores to nearby wells. Cones of depression in permeable rocks like

Expert Panel Report: Bainbridge Township Subsurface Gas Invasion 3. Additional Data – Wellhead LELs
3 - 115
sandstone are wide (large radius of influence) and shallow (little water level drawdown in the pumped well), as shown on Figure 3-102B. As a result, the wells open in the Berea and Sharon sandstones that were used to purge fugitive gas created overlapping cones of depression that lowered water levels over a broad area. A good example of this is along Scotland Drive where many of the wells are completed in the Berea Sandstone and the properties are smaller (wells are closer together) than along English Drive. Overpumping is less successful in wells open in the Cuyahoga Shale because gas migration is solely along intermittent vertical joints and bedding planes. In addition, in poorly permeable rocks like the Cuyahoga Shale, cones of depression are deep (large water level drawdown in the pumped well) and do not spread far laterally (Figure 3-102A). As a result, cones of depression in wells open in shales that are used to purge fugitive gas do not overlap and do not lower water levels over broad areas. The sustainability of shale wells also is limited because of the rapid drawdown of the water level in the pumped well, which commonly results in the pump stopping when the water level drops below the intake of the pump. Hence, shale wells tend to go on off, on off, on off. They cannot be used to purge water over longer periods of time.
Figure 3-102. Differences in the size and shape of cones of depression created by a well pumping in (A) poorly permeable material, and (B) highly permeable material
(Driscoll, 1986). A typical well open to the Berea or Sharon sandstone can produce 8 to 10 gallons per minute (gpm) continuously. After a month of pumping at this rate, a great deal of water and fugitive gas can be removed from an aquifer. For example, let’s assume, as indicated in the field notes presented in Table 1-1, that the Jordan well pumps continuously for 24 hours at 10 gpm. That amounts in the removal of 14,400 gallons of water from the Berea Sandstone, or nearly the equivalent of filling three 5,000 gallon storage tanks every day. If the Jordan well was pumped at the rate for seven days, it would remove more than 100,000 gallons of water and the fugitive gas associated with its removal. In a month, the Jordan well would remove more than 400,000 gallons of water from the Berea Sandstone.

Expert Panel Report: Bainbridge Township Subsurface Gas Invasion 3. Additional Data – Wellhead LELs
3 - 116
0
10
20
30
40
50
60
70
80
90
100
12/1
9/20
07
1/19
/200
8
2/19
/200
8
3/19
/200
8
4/19
/200
8
5/19
/200
8
6/19
/200
8
7/19
/200
8
8/19
/200
8
9/19
/200
8
10/1
9/20
08
11/1
9/20
08
12/1
9/20
08
1/19
/200
9
2/19
/200
9
3/19
/200
9
4/19
/200
9
5/19
/200
9
6/19
/200
9
7/19
/200
9
8/19
/200
9
9/19
/200
9
10/1
9/20
09
11/1
9/20
09
12/1
9/20
09
1/19
/201
0
Date
Wel
lhea
d LE
L (p
erce
nt o
f 5%
met
hane
)Table 1-1 shows that several wells were used in late December 2007 through July 2008 to intentionally purge fugitive gas from the flow system, although most were not used 24 hours a day, seven days a week. Table 3-6 shows the volumes of groundwater that likely were removed from the Berea Sandstone and the lower part of the Cuyahoga Shale using 10 of the wells that intentionally were used to purge water and gas (Ohara, McGee, Komocki, Mason, Sanborn, Kukoleck, Bastifell, Jordan, Calo, de Gaetano, and Johnson), as listed in Table 1-1 and Figures 3-85B and 3-86B. These calculations assume that wells operated eight hours a day.
Table 3-6. Estimated Volumes (gallons) of Water Removed by Intentional Overpumping
Number of
Wells
1 day pumping 8 hrs/day
1 week pumping 8 hrs/day
1 month pumping 8 hrs/day
6 months pumping 8 hrs/day
1
4,800 34,000 146,000 878,000
5
24,000 168,000 732,000 4,392,000
10
48,000 336,000 1,464,000 8,784,000
The effectiveness in removing fugitive gas during the seven-month period of intentionally overpumping selected wells is clearly seen in many of the wellhead LEL graphs in Appendix F. The reduction of wellhead LEL values in the Czernicki (17995 English Dr) well during Stage 2 (blue arrow) is typical of this pattern (Figure 3-103, Appendix F). The overlapping cones of depression created by overpumping and lowering of water levels in the Sharon Sandstone and Berea Sandstone are shown on Figures 3-85A and 3-86A, which show changes in the size and shape of the gas cap and changes in the elevation of the bottom of the gas cap during Stage 2.
Figure 3-103. Wellhead LEL values recorded in the Czernicki well (17995 English Dr) showing dissipation of wellhead LELs during period of intentional overpumping.
OVERPUMPING

Expert Panel Report: Bainbridge Township Subsurface Gas Invasion 3. Additional Data – Wellhead LELs
3 - 117
1/1/70 1/1/71 1/1/72 1/1/73 1/1/74 1/1/75 1/1/76 1/1/77 1/1/78 1/1/79 1/1/80Date
28
24
20
16
12
8
Dep
th to
Wat
er (f
eet)
It is regrettable that the period of intentional overpumping stopped. The wellhead LEL data demonstrate that it was a successful way of removing fugitive gas from the subsurface. It is puzzling, to the expert panel, why it was stopped. Its cessation has greatly prolonged the gas invasion problem. Overpumping a central well surrounded by other wells injecting gas, usually carbon dioxide or steam, is a well-known, successful, tertiary recovery technique in the petroleum industry.
Pattern 3 – Seasonal Variations in Fluid Pressures The most common pattern seen in the wellhead LEL graphs is produced by seasonal variations in the depth to the water table in the Sharon Sandstone and in the potentiometric surface of the Berea Sandstone. Seasonal changes in water levels are related to the annual hydrologic cycle of precipitation, infiltration, runoff, evaporation, and transpiration. In Ohio, water levels are highest in April-May and lowest in October-November (Sminchak, 1997). Analysis of hydrographs from 1982 to 1995 in 19 wells within the network of monitoring wells maintained across the state by ODNR shows that the average annual change in water levels in unconfined aquifers, like the Sharon Sandstone, was 6.2 feet, whereas the average annual change in confined aquifers, like the Berea Sandstone, was 4.5 feet (Sminchak, 1997). Figure 3-104 shows water-level changes from 1970 through 1979 in state monitoring well Ge-3A, which is located in Bainbridge Township near the Armory on state route 422. Ge-3A is uncased in the Sharon Sandstone. As can be seen, the zenith and nadir for each year correspond to the March-April and October-November periods, respectively. The hydrograph also shows a prolonged period of drought beginning in 1977, when many wells in Geauga County were deepened or replaced.
Figure 3-104. Hydrograph of state monitoring well Ge-3A in Bainbridge Township showing seasonal fluctuations in water levels.
Changes occur to subsurface fluid pressures as water levels rise and fall seasonally in response to the annual hydrologic cycle. These changes, in turn, cause changes in wellhead LEL values. Figures 3-105 and 3-106 show wellhead LEL data from the Kukoleck well (7969 Scotland Dr)

Expert Panel Report: Bainbridge Township Subsurface Gas Invasion 3. Additional Data – Wellhead LELs
3 - 118
0
10
20
30
40
50
60
70
80
90
100
12/1
9/20
07
1/19
/200
8
2/19
/200
8
3/19
/200
8
4/19
/200
8
5/19
/200
8
6/19
/200
8
7/19
/200
8
8/19
/200
8
9/19
/200
8
10/1
9/20
08
11/1
9/20
08
12/1
9/20
08
1/19
/200
9
2/19
/200
9
3/19
/200
9
4/19
/200
9
5/19
/200
9
6/19
/200
9
7/19
/200
9
8/19
/200
9
9/19
/200
9
10/1
9/20
09
11/1
9/20
09
12/1
9/20
09
1/19
/201
0
Date
Wel
lhea
d LE
L (p
erce
nt o
f 5%
met
hane
)
0
10
20
30
40
50
60
70
80
90
100
12/1
9/20
07
1/19
/200
8
2/19
/200
8
3/19
/200
8
4/19
/200
8
5/19
/200
8
6/19
/200
8
7/19
/200
8
8/19
/200
8
9/19
/200
8
10/1
9/20
08
11/1
9/20
08
12/1
9/20
08
1/19
/200
9
2/19
/200
9
3/19
/200
9
4/19
/200
9
5/19
/200
9
6/19
/200
9
7/19
/200
9
8/19
/200
9
9/19
/200
9
10/1
9/20
09
11/1
9/20
09
12/1
9/20
09
1/19
/201
0
Date
Wel
lhea
d LE
L (p
erce
nt o
f 5%
met
hane
)
and the Calo well (17959 Kingswood Dr), respectively, between December 2007 and January 2010. The graphs display this common, seasonal fluctuation in wellhead LELs. Values are lowest in May-June and highest in June-July. This pattern is seen in all of the wellhead LEL graphs in Appendix F, except those with wellhead LEL values too small to discern variations. Wellhead LEL measurements taken in the investigation area during February, March, and April 2010 are increasing relative to values measured in the winter and repeating this pattern.
Figure 3-105. Wellhead LELs recorded in the Kukoleck well (7969 Scotland Dr)
showing seasonal variations in measured values.
Figure 3-106. Wellhead LELs recorded in the Calo well (17959 Kingswood Dr)
showing seasonal variations in measured values.
High High
Low Low

Expert Panel Report: Bainbridge Township Subsurface Gas Invasion 3. Additional Data – Wellhead LELs
3 - 119
The left side of Figure 3-107 shows the location of the water table, capillary fringe, and vadose zone. The right side shows a typical pressure profile within these zones. By definition, pore pressure at the water table is zero, or equal to atmospheric pressure. Pores above the water table have pressures less than zero, whereas pores below the water table have pressures greater than zero and related to the hydrostatic pressure of water (+_0.433 psi/foot) below the water table. The pore at positions 1, 2, and 3 on the lower right side of Figure 3-107 shows what happens to its pressure during seasonal water-levels fluctuations in the annual hydrologic cycle and why the wellhead LEL data display a seasonal pattern.
Figure 3-107. Subsurface pressures in the soil, vadose, capillary fringe, and groundwater zones (modified from Dingman, 2002).
Annual water-level fluctuations can be looked at as a wave (Figure 3-104) with a peak, a trough, and two times when the wave passes through a mid-point. This is portrayed on the lower left side of Figure 3-107. The two times a year when water levels pass through the mid-point of the wave are around August, as water levels decline from May to November, and again around February, as water levels rise from November to May (Sminchak, 1995). On the right side of Figure 3-106, the pore space is at the mid-point of the wave at Position 1, where the pore pressure equals zero. As water levels decline to Position 2, the pore pressure declines (P < 0) because the pore space is now in the capillary fringe or vadose zone and pore fluids are

Expert Panel Report: Bainbridge Township Subsurface Gas Invasion 3. Additional Data – Wellhead LELs
3 - 120
under tensional forces. During this period of time, fugitive gas preferentially remains in the pore under the lower pressure and slowly migrates upward under its buoyancy toward even lower pressures. Thus, when the water table declines, fugitive gas gets seasonally stranded because it experiences lower pressures (without physically moving up or down). As a result, wellhead LELs decline in late summer and early autumn as water levels decline (Figure 3-104) and fugitive gas becomes seasonally stranded above the lowered water table and cannot migrate to residential wells via groundwater flow (even if wells are pumping) because the water table is seasonally beneath the pore space. As winter and early spring pass, water levels rise (Figure 3-104), the pressure in the pore passes through Position 1 and moves to Position 3. The pore, which has not physically moved, is now well below the water table where pore pressures are greater than zero (P > 0), as shown on Figure 3-107. Now that the pore space is below the water table, the fugitive gas is no longer stranded and is able to move via groundwater flow toward pumping wells. As a result of this seasonal cycle, wellhead LELs rise in late spring and early summer, as previously stranded fugitive gas is flushed toward residential wells by rising water levels. Thus, the seasonal pattern of wellhead LEL values rising in the winter and early spring, then falling in the summer and autumn, is directly related to seasonally changes in fluid pressures in pore spaces. These fluctuations are seen routinely at the same times of the year in late 2007, 2008, 2009. The wellhead LEL values measured in 2010 are repeating the same seasonal cycle (Appendix F). Most residential wells in the investigation area are open to the Cuyahoga Shale and the Berea Sandstone or to the Sharon Sandstone and the Cuyahoga Shale. Water levels in wells open in two or more geologic units are called “comingled” because the water level is a combination of the pressure head in each geologic unit. As shown on Attachments 5 and 6, the water levels in these comingled wells rise to a position somewhere in the Cuyahoga Shale and the seasonal fluctuations in water levels occur within the thickness of Cuyahoga Shale. On a much shorter time scale than the seasonal fluctuations described above, when these residential wells are pumped, the water level in the well declines and forms a cone of depression surrounding the well. As the cone of depression spreads outward with continuing pumping, pores drain water and fugitive gas gets stranded under its own buoyancy until the water level rises again when the well shuts off. Pattern 4 – Cutoff of Fugitive Gas East of Saddle Wells in the area east of the saddle in the top of the Berea Sandstone surface (Figure 3-99) on Kingswood Drive have a unique pattern of wellhead LELs. The pattern is directly related to the presence of the (low) saddle. Wells to the east of the saddle only receive fugitive gas after the gas fills the main closed structure as it rises toward the high point of the top of Berea Sandstone surface. The gas must spill under the saddle to reach the de Gaetano (17971 Kingswood Dr), Prochazka (17927 Kingswood Dr), and Johnson (17926 Kingswood Dr) wells. As a result, the arrival of the fugitive gas in these wells is delayed (Figures 3-84B and 3-85B) and the gas forms a smaller, separate gas cap on the east side of the saddle. Replenishment of gas to this eastern gas cap is dependent on the thickness of the main gas cap on the west side of the saddle. As the thickness of the main gas cap increases, more gas spills under the saddle into the east gas cap. As the thickness of the main gas cap diminishes, the amount of fugitive gas able to spill under the saddle decreases (Figures 3-86B). Eventually, the main gas cap becomes so thin that no gas spills under the saddle and the separate gas cap on

Expert Panel Report: Bainbridge Township Subsurface Gas Invasion 3. Additional Data – Wellhead LELs
3 - 121
0
10
20
30
40
50
60
70
80
90
100
12/1
9/20
07
1/19
/200
8
2/19
/200
8
3/19
/200
8
4/19
/200
8
5/19
/200
8
6/19
/200
8
7/19
/200
8
8/19
/200
8
9/19
/200
8
10/1
9/20
08
11/1
9/20
08
12/1
9/20
08
1/19
/200
9
2/19
/200
9
3/19
/200
9
4/19
/200
9
5/19
/200
9
6/19
/200
9
7/19
/200
9
8/19
/200
9
9/19
/200
9
10/1
9/20
09
11/1
9/20
09
12/1
9/20
09
1/19
/201
0
Date
Wel
lhea
d LE
L (p
erce
nt o
f 5%
met
hane
)
the east side of the saddle becomes completely isolated (Figure 3-87B). This is seen in the wellhead LEL graphs for the de Gaetano, Prochazka, and Johnson wells, which are all open in the Berea Sandstone (Appendix F). Figure 3-108 shows this pattern in the de Gaetano well (17971 Kingswood Dr). Gas is delayed in its arrival in the de Gaetano well until it spills under the saddle, causing the delay in its detection (yellow arrow), and then the wellhead LEL values quickly decrease in concentration (green arrow) due to the two cement squeeze jobs eliminating additional fugitive gas, overpumping of selected residential wells, and isolation of the now separate gas cap to the east of the saddle. As a result, none of the wells on the east side of the saddle (de Gaetano, Johnson, Prochazka, and Vincenti) manifest the patterns and trends seen in wells on the west side of the saddle (Appendix F).
Figure 3-108. Wellhead LELs recorded in the de Gaetano well (17971 Kingswood Dr) showing delay in gas arrival and rapid decline in LEL values.
Pattern 5 – Sharon Sandstone Wells Near Old Payne Well This wellhead LEL pattern pertains to the migration of fugitive gas before the explosion at the Payne house (17975 English Dr). The evidence for it is largely inferred from the sequence of events leading up to the explosion, as documented in Table 1-1, and by wellhead LEL measurements taken in shallow wells that are open in the Sharon Sandstone at properties adjacent to the Payne house. Remember that the old (abandoned) Payne well was not found until December 1, 2009, and that its 35-foot long casing did not extend completely through the Sharon Sandstone (page 3-77, Figure 3-54). As a result, 5 to 6 feet of permeable Sharon Sandstone was uncased in the borehole, which extended completely through the Cuyahoga Shale and 20 feet into the top of the Berea Sandstone.
Separation of east gas cap from main gas cap

Expert Panel Report: Bainbridge Township Subsurface Gas Invasion 3. Additional Data – Wellhead LELs
3 - 122
0
10
20
30
40
50
60
70
80
90
100
12/1
9/20
07
1/19
/200
8
2/19
/200
8
3/19
/200
8
4/19
/200
8
5/19
/200
8
6/19
/200
8
7/19
/200
8
8/19
/200
8
9/19
/200
8
10/1
9/20
08
11/1
9/20
08
12/1
9/20
08
1/19
/200
9
2/19
/200
9
3/19
/200
9
4/19
/200
9
5/19
/200
9
6/19
/200
9
7/19
/200
9
8/19
/200
9
9/19
/200
9
10/1
9/20
09
11/1
9/20
09
12/1
9/20
09
1/19
/201
0
Date
Wel
lhea
d LE
L (p
erce
nt o
f 5%
met
hane
)For the explosion in the Payne house to occur, fugitive gas had to enter the basement. The most likely way for gas to enter was through the small tunnel conveying the water pipe connecting the basement to the wellhead of the old well in the buried well pit, as shown in Figure 3-29. The fugitive gas would have entered the wellbore from the Berea Sandstone and risen up the wellbore under pressure. Because the well pit was buried under a slab of concrete (Figure 3-29), a great deal of pressure could have built up in it causing the gas to flow through the tunnel (Figure 3-19) into the basement of the house. Ignition of the gas was likely from the pilot-light in the hot water heater. The pressure that built up in the wellbore and in the well pit also could have enabled fugitive gas to migrate laterally in the Sharon Sandstone, as described by Harrison (1983, 1985) when gas rises upward into a permeable unit (Figure 3-64). As a result, the Sharon Sandstone also could have locally redistributed the fugitive gas beginning as early as late November. In the highly permeable Sharon Sandstone, this gas could travel to adjacent properties and enter shallow wells on those properties. The Gaub well (17939 English Dr), Donaldson well (17838 English Dr), and the Weber well (17955 English Dr) are all between 41 to 43 feet deep, based on the cement plugging reports submitted to the state in early 2010 (Appendix J). At these depths and locations, these wells all would have obtained water from the Sharon Sandstone. Figure 3-109 shows the pattern of wellhead LEL values in the Gaub well. The pattern is typified by the very high LEL values immediately after and likely well before, the explosion at the Payne house and the seemingly mysterious rapid decrease in LEL values within a week after the explosion that continues to the present day.
Figure 3-109. Wellhead LEL pattern in Gaub well (17939 English Dr). The rapid decrease in the LEL values is explained by the overpumping of selected wells around the Payne property that are open to the Berea Sandstone, just like the old Payne well, or are open to the Sharon Sandstone. Based on the field notes listed in Table 1-1, this includes the

Expert Panel Report: Bainbridge Township Subsurface Gas Invasion 3. Additional Data – Wellhead LELs
3 - 123
Jordan and Calo wells that are open in the Cuyahoga Shale and Berea Sandstone, and Donaldson, Cooper, Gaub, and Weber wells that are open in the Sharon Sandstone. As a result of the overpumping in the Berea Sandstone by the Jordan and Calo wells, the source of fugitive gas feeding the old Payne well was greatly diminished and as a result of the overpumping in the Sharon Sandstone by the Donaldson, Cooper, Gaub, and Weber wells, the limited amount of fugitive gas in the Sharon Sandstone was purged from the aquifer. The residual fugitive gas remaining in the Sharon Sandstone under these properties causes the very low wellhead LEL values measured in 2008, 2009, and 2010. Even though the amount of hard data constraining this line of logic is marginal, the logical progression in the arguments is watertight because it meshes with the interpretations based on hard data and with the physical laws controlling the movement of gas in groundwater. Summary of Analysis of Wellhead LEL Patterns The area over which fugitive gas can dissipate to the atmosphere is very large. For example, the area of land within a 1-mile radius of the English #1 well covers 88,000,000 square feet, which is a little more than 2,000 acres. Assuming that the footprint of a typical house in the investigated area is 2,000 square feet and that 200 houses occur within the investigation area, the total area occupied by homes (think basements) is 400,000 square feet or about 9 acres. These estimates indicate that about 0.5 percent (one half of one percent) of the land surface is covered by homes and 99.5 percent of the land surface is open to the slow dissipation of the fugitive gas without environmental or public-health concerns. Five patterns were recognized in the wellhead LEL graphs. Each pattern is related to the fluid mechanics and manner in which the fugitive gas moved through the geologic media, either by its buoyancy along discontinuous fractures and bedding planes in the Cuyahoga Shale or by groundwater flow and buoyancy in the intergranular porosity in the Berea and Sharon sandstones. The patterns are also related to the structure on the top of the Berea Sandstone, intentional overpumping of selected water wells, seasonal variations in water levels, and well construction details. No wellhead LEL trends were measured that could not be explained by the processes defining the five wellhead LEL patterns described in this report. Background Cases of Natural Gas in Wells in the Investigation Area It is not uncommon for wells in Geauga County to produce natural gas (Jagucki and Darner, 2001). The occurrence of natural gas in public water-supply wells is monitored by Ohio EPA. A local example of monitoring and reporting by Ohio EPA occurred in 2004 and again in 2007 at the Bainbridge Police Station well at 8353 Bainbridge Road. Figure 3-110 is a copy of the December 17, 2007 Site Visit Report filed by Ohio EPA. Appendix H contains the three-page letter and inspector’s field notes sent to the Bainbridge Township Trustees concerning the presence of natural gas in the public water-supply well at the police station. Although the origin of the black sediment (a.k.a., “black goo”) found in several residential wells in the investigation area is one of the subjects in the next section of this report, it is worthwhile it point out here that the 2007 Ohio EPA Site Visit Report on the police station well (Figure 3-110) also describes the presence of black sediment in the water from this well two years before the English #1 well incident.

Expert Panel Report: Bainbridge Township Subsurface Gas Invasion 3. Additional Data – Wellhead LELs
3 - 124
These documents demonstrate the occurrence of natural gas in the investigation area three years before overpressurization of the surface-production casing annulus in the English #1 well. In addition to this information, Mrs. Cloninger told DMRM personnel on two separate occasions that her well (7780 Bainbridge Rd) has had natural gas in it since she brought the property in the 1990’s (personal communication, Tom Tomastik, DMRM).
Figure 3-110. December 17, 2007, Site Visit Report regarding natural gas in Bainbridge
Township Police Station well (8353 Bainbridge Rd).