expert panel report on drainage design and flood ... expert panel on drainage design and flood...
TRANSCRIPT
Report on Key Conclusions and
Recommendations of the Expert Panel on
Drainage Design and Flood Protection
Measures
January 2012
This report documents the key findings and recommendations of the Expert Panel on Drainage
Design and Flood Protection Measures.
The text in this report may be reproduced free of charge, provided it is reproduced accurately, not
used in any misleading context, and the source of the information is acknowledged.


Executive Summary
Page i
Executive Summary
The Expert Panel on Drainage Design and Flood Protection Measures was appointed
by the Ministry of the Environment and Water Resources on 30 June 2011 to review all flood
protection and risk management measures that will be implemented in Singapore over the
next decade. Over the span of 6 months, the Panel reviewed the Public Utility Board’s (PUB)
drainage planning assumptions and parameters; identified innovative and cost-effective
solutions; and proposed improvements to ensure public resilience to floods. This Executive
Summary presents the key conclusions and recommendations of the Expert Panel Report.
(I) Singapore’s achievements in flood management and prevention
2 The Panel noted that much good work has been done by PUB in managing the
drainage and flood situation in Singapore over the past 30 – 40 years, despite the rapid
urbanization. In terms of storm drainage, Singapore compares well with other metropolitan
areas.
(II) Rainfall intensities have increased over the past few decades, and are likely to
increase in the future
3 In Singapore, heavy rainfall events impose varying constraints on its drainage
systems. Extreme discharges can result from events ranging from high intensity storms
lasting less than an hour to prolonged rainstorm events with moderate rainfall intensities.
4 Based on the rainfall intensity records over the past 30 years, there is strong
evidence of a trend towards higher rainfall intensities and frequency of intense rains. These
uptrends are consistent with the Inter-governmental Panel on Climate Change 4th
Assessment Report (IPCC AR4) and could add further strain on Singapore’s existing drainage
infrastructure. This evidence challenges past assumptions and, as such, there is the need for
PUB to conduct further studies and review its drainage design considerations to account for
these observed changes in rainfall trends.
5 However, the Panel recognises that the occurrence of 3 extreme events in the
Orchard Road area in an 18 month period is primarily part of the random nature of rainfall
patterns.
(III) Impact of Urbanisation
6 Urbanisation has undoubtedly led to an increase in storm water runoff in Singapore.
There is therefore a strong argument for introducing measures to mitigate the effects of
such urbanisation.
7 However, the effects are often complex and require further modelling and analysis,
supported by higher resolution data. The additional analysis should include an assessment
of whether run-off coefficients traditionally used in Singapore are appropriate given the

Executive Summary
Page ii
high intensity of rainfall, compared with the countries where the run-off coefficients were
derived.
(IV) The Stamford Canal does not have the capacity to drain away the surface runoff
generated by the storms on 16 June 2010 and 5 June 2011
8 The Panel concluded that the floods at the Orchard Road area on 16 June 2010 and 5
June 2011 were mainly due to higher rainfall intensities leading to a volume of surface
runoff that overwhelmed the conveyance capacity of the Stamford Canal. The Panel noted
that the Stamford Canal had been designed to the standard in place at that time rather than
standards more typical of today.
9 From the 5 June 2011 event, it was also noted that the raising of Orchard Road has
reduced the flood risk for a large part of the Orchard Road area, although more detailed
studies are needed to determine whether the road raising has moved the flood risk from
one location to another.
10 The Panel does not believe that the whole-scale upsizing of the Stamford Canal is the
best long term solution to addressing flood risk in the Orchard Road area. A better approach
would be to reduce and delay runoff from the upstream catchment, complemented with a
diversion of any excess flow to an adjacent catchment.
(V) The Marina Barrage did not contribute to the recent floods at Orchard Road
11 The Panel noted that the Marina Barrage was designed primarily as a flood
alleviation scheme – to remove the influence of high tides on the low-lying areas of
Singapore, as well as release excess storm water from the catchment. From the evidence
provided, the Marina Barrage has not contributed to the flooding in Orchard Road in 2010
and 2011, as its influence does not go that far upstream.
(VI) Singapore now needs to move towards a more integrated risk-based approach
based on dynamic modelling and comprehensive monitoring
12 PUB should develop appropriate standards for future assessment and design that
reflect both the likelihood and consequence of flooding.
13 Modelling tools are essential in simulating flows and water levels in drainage
systems. With recent advances in instrumentation, information technology and modelling
capabilities, PUB should move comprehensively towards a dynamic modelling approach in
order to fully understand drainage system performance and the effect of future
interventions.
14 This will require more flow monitoring and other data collection to verify that
models truly replicate actual system performance. This would include the comprehensive
collection of digital elevation data.

Executive Summary
Page iii
(VII) A wider range of interventions is required to help Singapore secure a more
adequate drainage system for the future
15 As part of the drainage planning process, PUB should consider a wider range of
drainage solutions, or interventions. By implementing a range of appropriate measures that
covers every spectrum of the drainage system from its source (e.g. local storage tanks and
ponds, green roofs, rain gardens, porous pavements, etc), pathways (e.g. drain capacity
improvements, diversion canals, regional detention, etc) and receptors (e.g. urban flood
plains, raised platform levels, flood barriers, etc), flood risk within the drainage catchment
can be more significantly reduced and effectively managed.
16 The Panel recognises that any drainage system, whatever the standards, has a finite
capacity. From time to time, intense rainfall will overwhelm the system, and there will be
residual risks that need to be managed. This applies not just to Singapore. Drainage planning
should be backed up by flood risk mapping so that any residual flood risk from extreme
events can be effectively managed.
(VIII) Improved engagement of stakeholders and the general public
17 There is an opportunity to further enhance public resilience towards floods through
active engagement. PUB should develop and implement a strategic public outreach
programme to educate and involve the general public proactively in its drainage and flood
management approaches, so as to enhance public awareness and preparedness towards
floods.
18 PUB should enhance its flood warning systems so as to provide the public with better
information and allow them to make informed decisions should a flood occur in their
vicinity.
(IX) Flexible and adaptable systems to manage future uncertainty
19 Singapore needs to plan for the consequences of future megatrends, e.g. climate
change, extreme storms, extended droughts, water scarcity, land scarcity, energy costs,
resource scarcity and food production. Drainage systems will therefore need to cope with
future uncertainty. Solutions that avoid high energy costs, deliver multiple benefits and can
be phased in over a period of time are likely to be more successful.
20 This will involve regularly reviewing design parameters, enhancing rainfall and
drainage performance modelling and monitoring capabilities, identifying new systems-level
interventions, as well as regularly checking on the adequacy and performance, as part of
drainage system master planning.

Executive Summary
Page iv

Executive Summary
Page v

Executive Summary
Page vi
Table of Contents
Page v
Table of Contents
Executive Summary .................................................................................................................................. i
Table of Contents .................................................................................................................................... v
List of Abbreviations ............................................................................................................................ viii
SECTION 1: Background .......................................................................................................................... 1
1.1 Historical Context of Floods in Singapore ............................................................................... 1
1.2 Appointment of the Expert Panel ........................................................................................... 1
SECTION 2: Flood Events of 2010 and 2011 ........................................................................................... 3
2.1 Summary of the 2010/ 2011 Flood Events along Orchard Road ............................................ 3
2.2 Evidence Reviewed by the Panel ............................................................................................ 4
2.3 Analysis of the Specific Rainfall Events ................................................................................... 5
2.4 Capacity of Stamford Canal Drainage System ......................................................................... 8
2.5 Assessment of the Marina Barrage Operations and Influence ............................................. 10
2.6 Effectiveness of Road-Raising and other Flood Prevention Measures ................................. 12
2.7 Effects of Urbanisation.......................................................................................................... 13
2.8 Effects of Debris during 16 June 2010 Flood ........................................................................ 14
2.9 Presence of Services in Stamford Canal ................................................................................ 14
2.10 Flooding in the Bukit Timah Catchment on 16 June 2010 .................................................... 15
2.11 Conclusions ........................................................................................................................... 16
SECTION 3: Rainfall Analysis ................................................................................................................ 18
3.1 Singapore’s Rainfall Data Collection ..................................................................................... 18
3.2 Historical Trends ................................................................................................................... 18
3.3 Rainfall Variation ................................................................................................................... 21

Table of Contents
Page vi
3.4 Analysis of Annual Maximum 60-min Rainfall Intensities for 5-year and 10-year Return
Periods .............................................................................................................................................. 26
3.5 Temporal Variations .............................................................................................................. 28
3.6 Updated Intensity-Duration-Frequency (IDF) Curves ........................................................... 32
3.7 Conclusions from Rainfall Analysis ........................................................................................ 32
3.8 Further Studies on Rainfall .................................................................................................... 34
3.9 Recommendations ................................................................................................................ 35
Section 4: Drainage Design and Modelling .......................................................................................... 37
4.1 Evaluation of Current Drainage Design Approach ................................................................ 37
4.2 Evaluation of Drainage Design Standards ............................................................................. 41
4.4 Development of the Modelling Approach ............................................................................ 45
4.5 Recommendations ................................................................................................................ 48
Section 5: Flood Risk Management and Solutions .............................................................................. 50
5.1 Managing Flood Risk ............................................................................................................. 50
5.2 Measures to Address Flood Risk ........................................................................................... 52
5.3 Source Control Measures ...................................................................................................... 52
5.4 Pathway Measures: Drainage Systems ................................................................................. 56
5.5 Pathway Measures: Surface Flood Paths .............................................................................. 58
5.6 Receptor Measures ............................................................................................................... 60
5.7 Protection of Coastal Areas against tidal floods ................................................................... 62
5.8 Adapting to Future Uncertainty ............................................................................................ 63
5.9 Conclusions ........................................................................................................................... 64
5.10 Recommendations ................................................................................................................ 64
SECTION 6: Enhance Public Resilience towards Floods ....................................................................... 67
6.1 PUB’s Public Communications Efforts and Challenges in Flood Management ..................... 67

Table of Contents
Page vii
6.2 Public Education and Publicity Efforts on Floods .................................................................. 68
6.3 Observations from PUB’s Past Public Education and Engagement Initiatives ...................... 70
6.4 Public Engagement on Drainage Projects ............................................................................. 71
6.5 Proactive Flood Management and Preparation .................................................................... 74
6.6 Warning Systems and Public Response ................................................................................ 75
6.7 Recommendations ................................................................................................................ 77
Acknowledgements ............................................................................................................................... 79
Appendix 1 ............................................................................................................................................ 80
Appendix 2 ............................................................................................................................................ 89

List of Abbreviations
Page viii
List of Abbreviations
ABC Waters Programme
AR4
ASEAN
AWS
BCA
COP
CCRS
C-Factor
DEM
DIC
FEWS
GCM
GEV
GIA
GP distribution
HDB
IADRC
IDF curve
IPCC
JTC
LIDAR
LTA
MEWR
MOU
mRL
MRT
MSS
NEA
NE Monsoon
NParks
NUS
OMS
ORBA
PRECIS
PUB
QP
RWS
SDWA
SLA
SW Monsoon
URA
Active, Beautiful and Clean Waters Programme
(IPCC’s) 4th Assessment Report
Association of Southeast Asian Nations
Automatic Weather Stations
Building and Construction Authority
Code of Practice
Centre for Climate Research Singapore
runoff Coefficient Factor
Digitized Elevation Map
Drop Inlet Chamber
Flood Early Warning System
General Circulation Model
Generalized Extreme Value
General Insurance Association
Generalized Pareto Distribution
Housing and Development Board
Inter-Agency Drainage Review Committee
Intensity-Duration-Frequency curve
Inter-governmental Panel on Climate Change
Jurong Town Corporation
Light Detection and Radar
Land Transport Authority
Ministry for the Environment and Water Resources
Memorandum of Understanding
metres Reduced Level
Mass Rapid Transit
Meteorological Services Singapore
National Environment Agency
North East Monsoon
National Parks Board
National University of Singapore
Operations Management System
Orchard Road Business Association
Providing Regional Climates for Impacts Studies
Public Utilities Board
Qualified Professional
(Hong Kong’s) Rainstorm Warning System
Singapore-Delft Water Alliance
Singapore Land Authority
South West Monsoon
Urban Redevelopment Authority

Section 1: Background
Page 1
SECTION 1: Background
1.1 Historical Context of Floods in Singapore
1.1.1 In Singapore’s early days, floods were common and widespread. Many of the floods
occurred in the city centre which was on relatively low-lying land with several areas being just above
the high tide level. Over the past 30 years, considerable effort has gone into reducing flood risk at
these flood prone areas (see Figure 1-1) through numerous flood alleviation and prevention projects.
Figure 1-1: Reduction in flood prone areas despite increasing urbanisation.
1.1.2 On 16 June 2010 and 5 June 2011, floods occurred in the Orchard Road area. After a long
period without flooding in this urban area, it was not immediately obvious why this had happened
and a detailed investigation was proposed to better understand the causes of the flooding and
advise on potential solutions. As part of this process, an international Expert Panel was formed. This
report summarises the findings of the Panel.
1.2 Appointment of the Expert Panel
Terms of Reference
1.2.1 The Expert Panel on Drainage Design and Flood Protection Measures was appointed
by the Ministry of the Environment and Water Resources (MEWR) on 30 June 2011. The
Panel consists of local and overseas experts from various disciplines spanning civil and
hydraulic engineering, climate change, hydrology and flood management, and was tasked to
review all flood protection/ risk management measures that will be implemented in
Singapore over the next decade. Specifically, the Panel’s main focus is on: (1) review of the
Public Utility Board’s (PUB) drainage planning assumptions and parameters, (2)
identification of innovative and cost-effective solutions; and (3) improvements to ensure
public resilience to floods.

Section 1: Background
Page 2
Review Process
1.2.2 The Panel met in Singapore on three occasions: 8 to 9 July 2011, 26 to 30 September
2011 and 9 to 10 Jan 2012. During the first two meetings, the Panel was briefed on PUB’s
approaches to drainage and flood management and essential information pertaining to
rainfall intensities and patterns in Singapore. The Panel conducted in-depth discussions on
the analysis of Singapore’s rainfall patterns, PUB’s drainage planning and design processes,
operations of Marina Barrage, flood investigation findings for the 2010 and 2011 storm
events, flood protection measures, as well as PUB’s and the Meteorological Services
Singapore’s (MSS) modelling and predictive capabilities. The Panel also visited various PUB
installations and sites such as the Marina Barrage, the Bishan Park-Kallang River ABC Waters
Project and did a tour of the Stamford Canal and Bukit Timah Catchments. Ahead of the
meetings, the Panel were provided with detailed reports and papers on key issues so as to
facilitate their understanding of the current drainage and flood situations in Singapore. The
final meeting in Jan 2012 was spent on finalising the report and summarising the key
findings and recommendations ahead of the Media Briefing.
1.2.3 Aside from the formal meetings, the Panel also conducted independent discussions
via email correspondence, particularly in the preparation of the Expert Panel Report. The
findings herein are based on the various issues discussed and the key recommendations that
were deliberated by the Panel during the formal meetings and email correspondence.
1.2.4 During the first two meetings, the Panel was updated on the current state of affairs
pertaining to Singapore’s weather systems, the drainage infrastructure, its planning and
design considerations and the flood protection measures that had been put in place.
Highlights of this background information are provided at Appendix 1.

Section 2: Flood Events of 2010 and 2011
Page 3
SECTION 2: Flood Events of 2010 and 2011
2.1 Summary of the 2010/ 2011 Flood Events along Orchard Road
16 June 2010 Flood Event
2.1.1 On 16th June 2010, some 100mm of heavy and intense rainfall fell over the Stamford
Canal Catchment from 9.00am to 11.00am in two consecutive bursts and overwhelmed the
capacity of Stamford Canal, the major storm water drain serving the catchment. This
resulted in floods along Orchard Road, up to a depth of 300mm from Cuscaden Road to
Cairnhill Road, and caused disruption to traffic and some damage to properties. The
premises that were affected by flood waters entering their basements were mainly the
older developments, namely, Lucky Plaza, Liat Towers, Delfi Orchard, Tong Building and the
Supreme Hotel. Twenty one vehicles in the basements of Tong Building and Delfi Orchard,
and 100 shops in the basement level of Lucky Plaza and Liat Towers were flooded. In
addition some 20 cars and 7 buses stalled along Orchard Road due to the flood. Overall,
floodwaters were mostly contained on the road, as the platform levels of most buildings in
Orchard Road and the crest levels at entrances to MRT stations in the area were sufficiently
high to prevent floodwater from entering the premises. Floodwaters also subsided within an
hour. Aside from the Orchard Road areas, parts of the Bukit Timah catchment and the
Eastern catchment also experienced localised flooding on that day.
2.1.2 PUB’s initial investigations suggested that the flood resulted from the two intense
consecutive bursts of rain within an hour. In addition, debris which was washed down by
rainwater during the first flush and partially trapped in the culvert across Orchard Road in
front of Delfi Orchard may have aggravated the situation. This culvert is the bifurcation
point that diverts water from the upper Stamford Canal Catchment into two sections of
Stamford Canal which runs along both sides of Orchard Road. The heavy build-up of debris
partially trapped in the culvert might have caused the rainwater to be diverted mostly into
one section of the canal and thus overflow onto Orchard Road.
5 June 2011 Flood Event
2.1.3 On 5 June 2011, some 124mm of rainfall fell over the central parts of Singapore
resulting in floods. At the Tanglin Road / Napier Road junction at the edge of the Orchard
Road district, storm water from the adjacent Stamford Canal overflowed onto the road to a
flood depth of about 100mm. Storm water also flowed into the premises of Tanglin Mall and
flooded its basement level. Further down the road, storm water also flowed into the
basement car park of St Regis Residences. Other areas such as the Cuscaden and Claymore
areas were also inundated with floodwaters between 100-300mm, stalling cars and making
the roads impassable to traffic. Again, floodwaters subsided within an hour. The nearest rain
gauge located at Botanic Gardens recorded a rainfall intensity of 65mm over 30min.
2.1.4 PUB’s initial investigations suggested that the flood resulted from intense rainfall
that exceeded the canal capacity in the upper section of Stamford Canal at the Tanglin

Section 2: Flood Events of 2010 and 2011
Page 4
Road/ Napier Road junction, causing an overflow of floodwaters at the junction and into the
adjacent mall basement. Storm water from the connecting tributaries also overflowed and
caused the floods in the nearby Cuscaden Road.
Cost of Flood Damage
2.1.5 Flood damages from the 16 June flood event and other flood incidents during the
June – July period amounted to some $23 million from 868 insurance claims from business
interruptions, property damage and motor vehicle claims (Note: Insurance claims for flood-
related damages for 2011 have yet to be released by General Insurance Association(GIA)).
There were also intangible losses to Singapore’s reputation as pictures of Orchard Road
flooding incidents appeared on international newspapers and websites. PUB’s reputation as
the custodian of Singapore’s drainage infrastructure was also affected. With the June 2011
floods, PUB’s credible response over the 2010 floods and the good work that has been
achieved over the past year has been displaced by public frustration and anger, with lower
tolerance towards additional flooding incidents.
Public Perception of Flood Causes
2.1.6 With parts of Singapore having flooded in successive years, the public and media
have expressed doubt on the robustness of PUB’s flood management approach. Alongside
growing scepticism on the effectiveness of flood protection measures (such as the
commissioning of Marina Barrage and the raising of Orchard Road), there is much
speculation on the causes of the floods (such as increased urbanisation and choked drains).
In particular, members of the public noted that floods appeared to have occurred more
frequently following the commissioning of Marina Barrage, and, as such, queried its efficacy
in eliminating floods and whether it had increased the flood risk to the more inland areas
instead. Members of the Orchard Road Business Association (ORBA) have also expressed
concern that the road-raising carried out in the aftermath of the 2010 floods have only
transferred the flooding problem to the upstream portion of Orchard Road affected during
the 5 June 11 flooding, i.e. the Tanglin areas.
2.2 Evidence Reviewed by the Panel
2.2.1 To seek a better understanding of the 2010 and 2011 flood events, the Panel
reviewed the following evidence, including results from additional studies requested by the
Panel:
a. Flood investigation reports on the 16 June 2010 and 5 June 2011 floods;
b. PUB’s drainage design approach and processes;
c. Marina Barrage design and operational approach;
d. Urbanisation in the Stamford Catchment over the years;
e. Rainfall data and radar rainfall images for the two flood incidents;
f. Simulations of hydraulic profiles and canal flows for the two flood incidents;
g. Simulations of water levels for areas under the Marina Barrage’s zone of
influence and Orchard Road;
h. Simulations of water levels in Orchard Road pre- and post-road raising; and
Section 2: Flood Events of 2010 and 2011
Page 5
i. Situation in Bukit Timah Catchment, and the alleviation measures in progress.
Based on the evidence provided, the Panel made specific observations and conclusions,
which are further elaborated in the following sub-sections.
2.3 Analysis of the Specific Rainfall Events
Rainfall during 16 June 2010
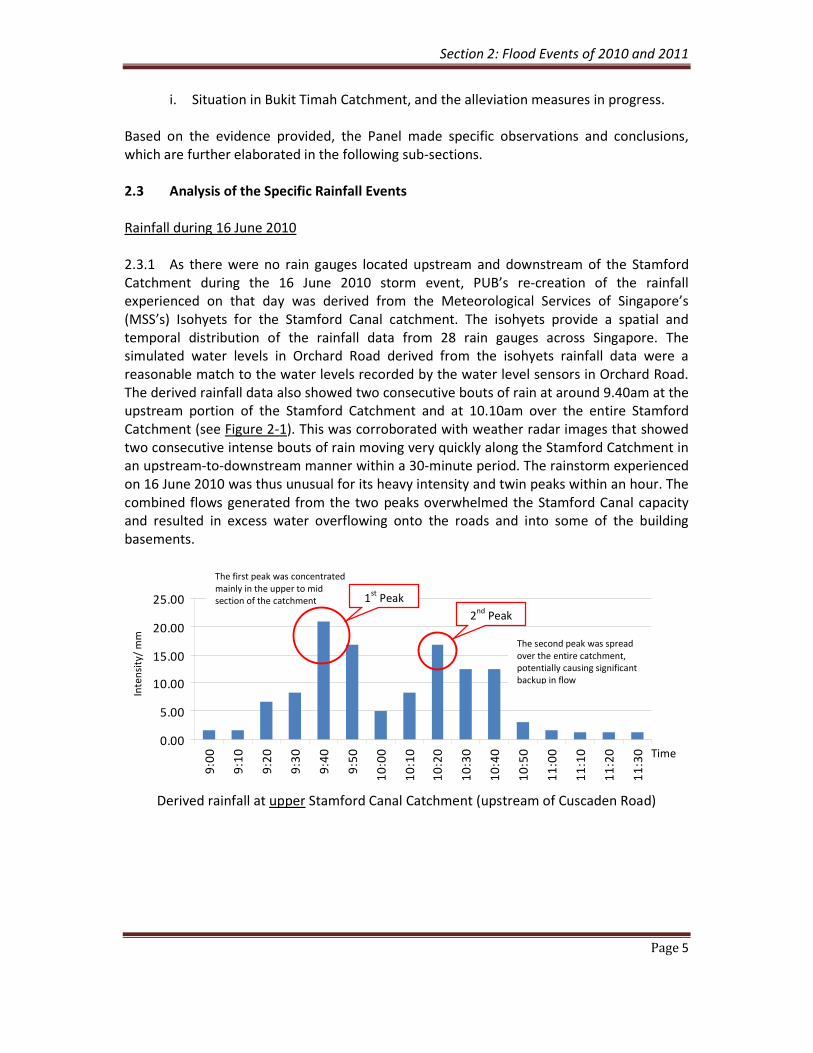
2.3.1 As there were no rain gauges located upstream and downstream of the Stamford
Catchment during the 16 June 2010 storm event, PUB’s re-creation of the rainfall
experienced on that day was derived from the Meteorological Services of Singapore’s
(MSS’s) Isohyets for the Stamford Canal catchment. The isohyets provide a spatial and
temporal distribution of the rainfall data from 28 rain gauges across Singapore. The
simulated water levels in Orchard Road derived from the isohyets rainfall data were a
reasonable match to the water levels recorded by the water level sensors in Orchard Road.
The derived rainfall data also showed two consecutive bouts of rain at around 9.40am at the
upstream portion of the Stamford Catchment and at 10.10am over the entire Stamford
Catchment (see Figure 2-1). This was corroborated with weather radar images that showed
two consecutive intense bouts of rain moving very quickly along the Stamford Catchment in
an upstream-to-downstream manner within a 30-minute period. The rainstorm experienced
on 16 June 2010 was thus unusual for its heavy intensity and twin peaks within an hour. The
combined flows generated from the two peaks overwhelmed the Stamford Canal capacity
and resulted in excess water overflowing onto the roads and into some of the building
basements.
Derived rainfall at upper Stamford Canal Catchment (upstream of Cuscaden Road)
0.00
5.00
10.00
15.00
20.00
25.00
9:0
0
9:1
0
9:2
0
9:3
0
9:4
0
9:5
0
10
:00
10
:10
10
:20
10
:30
10
:40
10
:50
11
:00
11
:10
11
:20
11
:30
2nd
Peak
The first peak was concentrated
mainly in the upper to mid
section of the catchment 1st
Peak
The second peak was spread
over the entire catchment,
potentially causing significant
backup in flow
Inte
nsi
ty/
mm
Time
Section 2: Flood Events of 2010 and 2011
Page 6
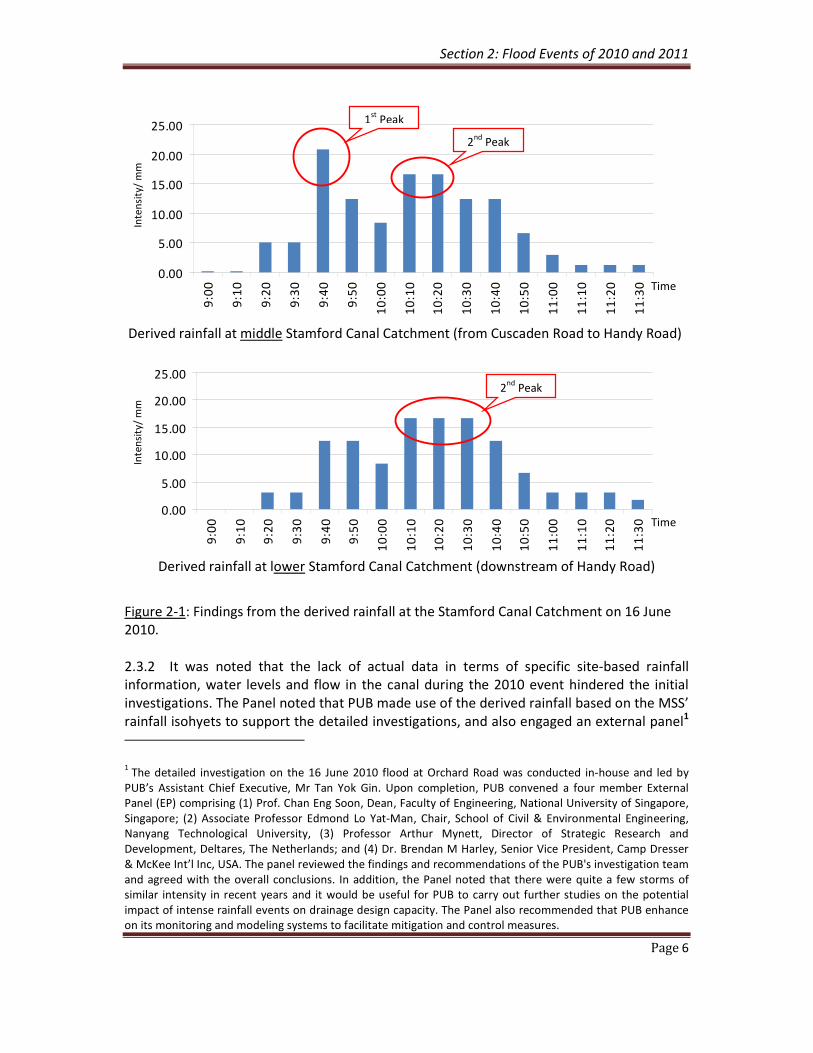
Derived rainfall at middle Stamford Canal Catchment (from Cuscaden Road to Handy Road)
Derived rainfall at lower Stamford Canal Catchment (downstream of Handy Road)
Figure 2-1: Findings from the derived rainfall at the Stamford Canal Catchment on 16 June
2010.
2.3.2 It was noted that the lack of actual data in terms of specific site-based rainfall
information, water levels and flow in the canal during the 2010 event hindered the initial
investigations. The Panel noted that PUB made use of the derived rainfall based on the MSS’
rainfall isohyets to support the detailed investigations, and also engaged an external panel1
1 The detailed investigation on the 16 June 2010 flood at Orchard Road was conducted in-house and led by
PUB’s Assistant Chief Executive, Mr Tan Yok Gin. Upon completion, PUB convened a four member External
Panel (EP) comprising (1) Prof. Chan Eng Soon, Dean, Faculty of Engineering, National University of Singapore,
Singapore; (2) Associate Professor Edmond Lo Yat-Man, Chair, School of Civil & Environmental Engineering,
Nanyang Technological University, (3) Professor Arthur Mynett, Director of Strategic Research and
Development, Deltares, The Netherlands; and (4) Dr. Brendan M Harley, Senior Vice President, Camp Dresser
& McKee Int’l Inc, USA. The panel reviewed the findings and recommendations of the PUB's investigation team
and agreed with the overall conclusions. In addition, the Panel noted that there were quite a few storms of
similar intensity in recent years and it would be useful for PUB to carry out further studies on the potential
impact of intense rainfall events on drainage design capacity. The Panel also recommended that PUB enhance
on its monitoring and modeling systems to facilitate mitigation and control measures.
0.00
5.00
10.00
15.00
20.00
25.00
9:0
0
9:1
0
9:2
0
9:3
0
9:4
0
9:5
0
10
:00
10
:10
10
:20
10
:30
10
:40
10
:50
11
:00
11
:10
11
:20
11
:30
0.00
5.00
10.00
15.00
20.00
25.00
9:0
0
9:1
0
9:2
0
9:3
0
9:4
0
9:5
0
10
:00
10
:10
10
:20
10
:30
10
:40
10
:50
11
:00
11
:10
11
:20
11
:30
2nd
Peak
2nd
Peak
1st
Peak
Inte
nsi
ty/
mm
Time
Inte
nsi
ty/
mm
Time

Section 2: Flood Events of 2010 and 2011
Page 7
to provide independent assessment of the flood investigations findings. PUB’s response and
actions taken on the ground to help affected building owners as well as to identify specific
measures to lower the flood risk for the area, such as installation of flood barriers for the
buildings deemed to be at-risk, was timely and appropriate. The Panel also noted that PUB
had subsequently convened the Inter-Agency Drainage Review Committee (IADRC)
comprising key public development agencies to review drainage design standards and
capacities of major drains and canals. The IADRC’s recommendations, which included raising
the drainage design standards in PUB’s Code of Practice for Surface Water Drainage to allow
for higher level of flood protection (e.g. higher design storms, raising the minimum platform
and reclamation levels, etc), and the necessary improvement to the capacity of 22 major
drainage systems, are sound approaches moving forward.
Conclusion 2A: PUB’s detailed investigation findings for the 16 June 2010 flood were
sound and well documented, with independent review by an external panel. The
measures taken to address the specific site issues (e.g. installation of flood barriers,
enhanced flood alerts systems) were practical and the IADRC review of the drainage
design standards and requirements under the Code of Practice for Surface Water Drainage
was timely.
Rainfall during 5 June 2011
2.3.3 Following the June 2010 flooding incidents, PUB, in consultation with the MSS,
installed 3 rain gauges within the Stamford Catchment. In addition, more water level
sensors and flow meters had also been placed along the canal. As such, when the 5 June
2011 storm event occurred, PUB was able to conduct a more comprehensive assessment of
the events as it unfolded. The rainfall that occurred on this occasion fell mainly on the upper
Stamford Canal Catchment. The nearest rain gauge was located at the Botanic Gardens and
recorded a rainfall of 65mm over 30 minutes, which is more intense than that experienced
on 16 June 2010. Rainfall radar data also showed the rainstorm hitting its peak over the
central portions of Singapore at approximately 10.30am. The post event water profile
simulations using the Botanic Gardens’ rain gauge data as well as the other rain gauges in
the catchment were a reasonable match to the measured water levels at the 6 water
sensors along Stamford Canal leading to Marina Reservoir (see Figure 2-2). The storm event
experienced on 5 June 2011 was found to be highly intense, at 65mm of rainfall recorded
over half an hour, and resulted in localised flooding in the Tanglin / Napier Road area.
Section 2: Flood Events of 2010 and 2011
Page 8
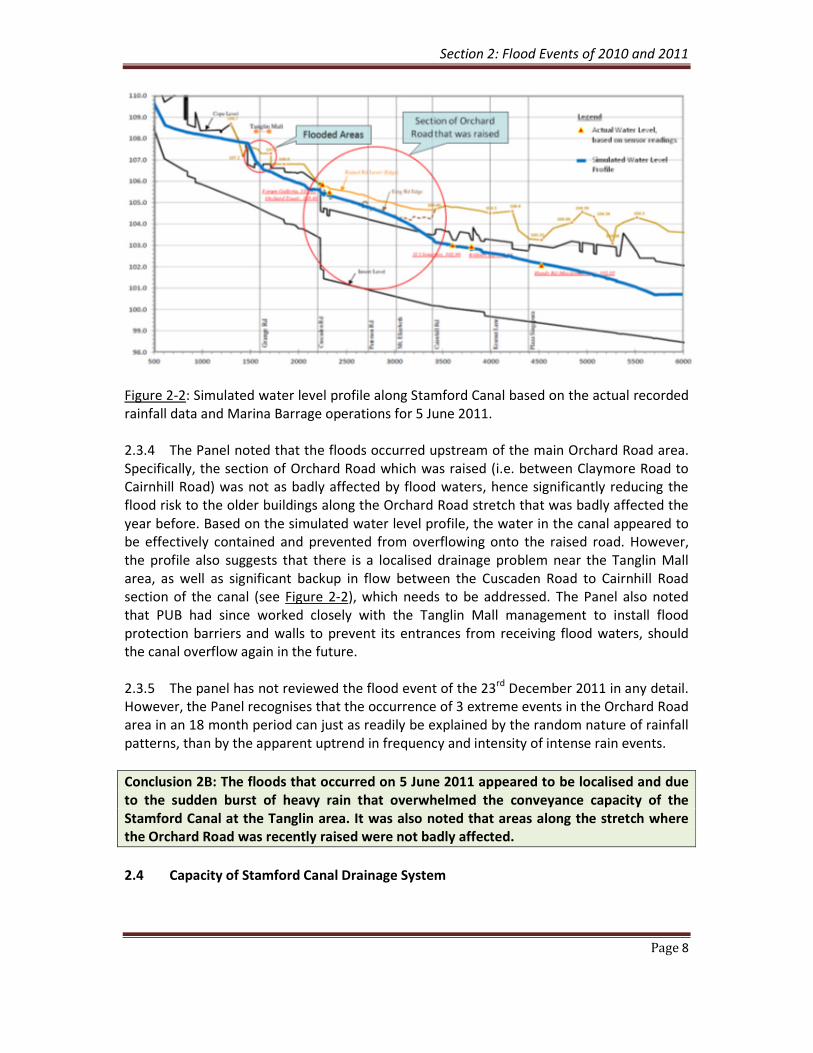
Figure 2-2: Simulated water level profile along Stamford Canal based on the actual recorded
rainfall data and Marina Barrage operations for 5 June 2011.
2.3.4 The Panel noted that the floods occurred upstream of the main Orchard Road area.
Specifically, the section of Orchard Road which was raised (i.e. between Claymore Road to
Cairnhill Road) was not as badly affected by flood waters, hence significantly reducing the
flood risk to the older buildings along the Orchard Road stretch that was badly affected the
year before. Based on the simulated water level profile, the water in the canal appeared to
be effectively contained and prevented from overflowing onto the raised road. However,
the profile also suggests that there is a localised drainage problem near the Tanglin Mall
area, as well as significant backup in flow between the Cuscaden Road to Cairnhill Road
section of the canal (see Figure 2-2), which needs to be addressed. The Panel also noted
that PUB had since worked closely with the Tanglin Mall management to install flood
protection barriers and walls to prevent its entrances from receiving flood waters, should
the canal overflow again in the future.
2.3.5 The panel has not reviewed the flood event of the 23rd December 2011 in any detail.
However, the Panel recognises that the occurrence of 3 extreme events in the Orchard Road
area in an 18 month period can just as readily be explained by the random nature of rainfall
patterns, than by the apparent uptrend in frequency and intensity of intense rain events.
Conclusion 2B: The floods that occurred on 5 June 2011 appeared to be localised and due
to the sudden burst of heavy rain that overwhelmed the conveyance capacity of the
Stamford Canal at the Tanglin area. It was also noted that areas along the stretch where
the Orchard Road was recently raised were not badly affected.
2.4 Capacity of Stamford Canal Drainage System
Section 2: Flood Events of 2010 and 2011
Page 9
2.4.1 The main drainage system within the Stamford Canal Catchment that serves the
Orchard Road area comprises two covered drains flanking both sides of Orchard Road. The
entire Stamford Canal (from Cuscaden Road to the Marina) was improved in phases,
commencing in 1971 and substantially completed in 1984. The original Stamford Canal (pre-
1971) lies on the southern side of Orchard (i.e. fronting the Orchard Parade Hotel and
leading all the way to the Mandarin Hotel). This canal is, presently, predominantly a slab-
over trapezoidal drain with an average width of about 6m and depth of about 2m. The slab
atop of the drain forms the heavily utilised Orchard Road pedestrian mall.
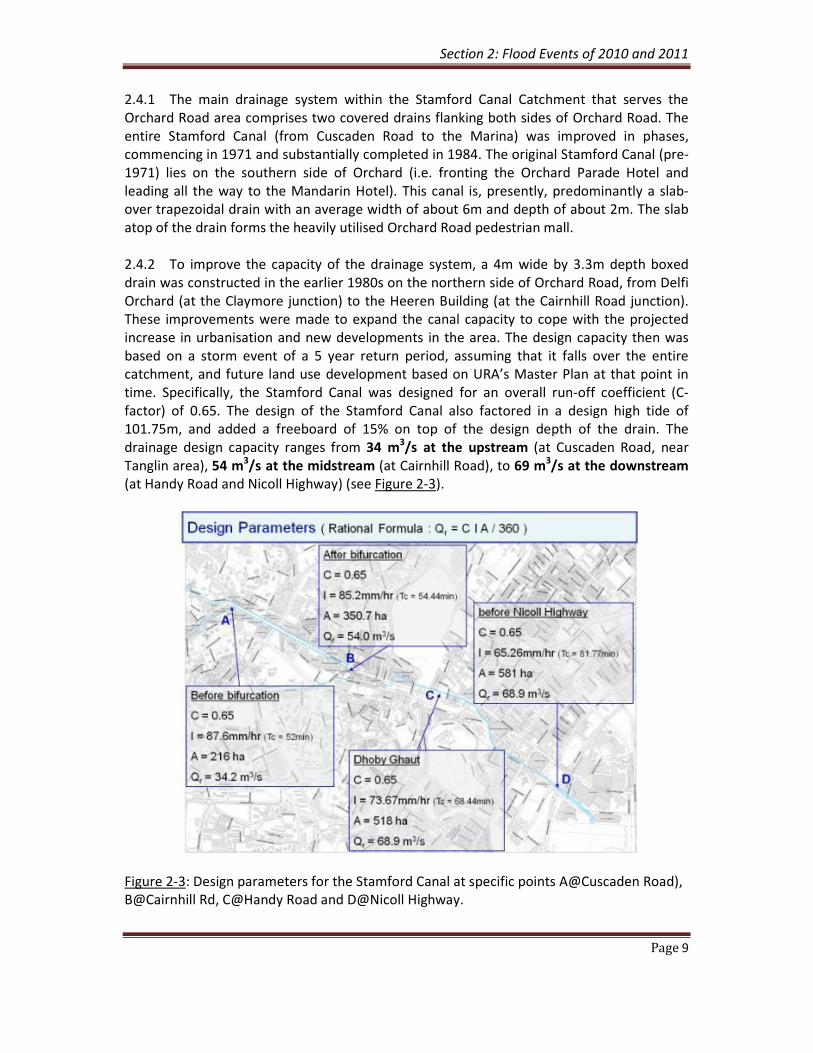
2.4.2 To improve the capacity of the drainage system, a 4m wide by 3.3m depth boxed
drain was constructed in the earlier 1980s on the northern side of Orchard Road, from Delfi
Orchard (at the Claymore junction) to the Heeren Building (at the Cairnhill Road junction).
These improvements were made to expand the canal capacity to cope with the projected
increase in urbanisation and new developments in the area. The design capacity then was
based on a storm event of a 5 year return period, assuming that it falls over the entire
catchment, and future land use development based on URA’s Master Plan at that point in
time. Specifically, the Stamford Canal was designed for an overall run-off coefficient (C-
factor) of 0.65. The design of the Stamford Canal also factored in a design high tide of
101.75m, and added a freeboard of 15% on top of the design depth of the drain. The
drainage design capacity ranges from 34 m3/s at the upstream (at Cuscaden Road, near
Tanglin area), 54 m3/s at the midstream (at Cairnhill Road), to 69 m
3/s at the downstream
(at Handy Road and Nicoll Highway) (see Figure 2-3).
Figure 2-3: Design parameters for the Stamford Canal at specific points A@Cuscaden Road),
B@Cairnhill Rd, C@Handy Road and D@Nicoll Highway.

Section 2: Flood Events of 2010 and 2011
Page 10
2.4.3 During the storm event on 16 June 2010, the two consecutive bursts of rain moved
very quickly along the Stamford Catchment in a downstream direction within a 30 minute
period. Analysis of the rain event showed that the runoff from the first burst of rainfall from
the upstream met with the run-off from the second burst of rainfall over the entire
catchment. This caused a rapid surge in the water level in the middle section of Stamford
Canal, calculated as carrying 59.7 m3/s of water during the second burst of rainfall. The
design capacity of this middle section is 54 m3/s and is insufficient to cope with the surge
in storm water flows. Based on the derived intensity, the rainfall is equivalent to a storm
event with return period of between 5 to 10 years, i.e. above the Stamford Canal’s design
storm of 5 years return period.
2.4.4 Similarly, on 5 June 2011, the sudden burst of heavy rainfall which occurred in the
upper Stamford Canal Catchment resulted in peak flows which exceeded the design flow
capacity of the canal at the upstream section (near Cuscaden Rd, Tanglin area)2 of the
canal. The rainfall intensity (at 65mm within 30min) was equivalent to a storm event with a
return period of between 5 to 10 years. The exceedance in the design conditions, the high
rainfall in the upstream catchment and localised channel constriction near the Tanglin Mall
area (see Figure 2-2) resulted in the storm waters to overflow the canal and flood the
nearby vicinities.
Conclusion 2C: The capacity of the Stamford Canal was not able to cope with the peak
flows of both the 16 June 2010 and the 5 June 2011 rainfall.
2.5 Assessment of the Marina Barrage Operations and Influence
2.5.1 The Panel noted that the Marina Barrage’s primary function is to control and
manage flood risk for the low lying areas in the Marina Catchment. Specifically, the barrage
will isolate the Kallang, Geylang, Singapore Rivers, Bukit Timah / Rochor and Stamford canals
from the influence of the tide. The Marina Barrage also removes the influence of high tides
on the other connecting outlet drains and drainage systems to these major systems, such as
the Bukit Timah Phase 2 Diversion scheme which carries excess storm water from the Bukit
Timah Canal to Kallang River. Instead, the drainage systems within the Marina Catchment
will now be influenced by the operational levels of the Marina Reservoir and Barrage
processes.
2.5.2 The barrage has 9 crest gates and 7 drainage pumps to manage flood risks in the
Marina catchment (which includes the Stamford Canal catchment). During heavy rains, and
when the tide is low enough, the 9 crest gates at the Marina Barrage will be sequentially
opened to release excess storm water into the sea. Each of the crest gates is capable of
2 Based on the flow simulation using the actual recorded rainfall from the Botanic Gardens rain gauge, the flow
at this section of the canal was calculated to be carrying about 45.7m3/s, which exceeds the design capacity of
34m3/s for this section.

Section 2: Flood Events of 2010 and 2011
Page 11
discharging water of up to 200m3/s, depending on the hydraulic head difference between
the Marina Reservoir and the sea. When it is not possible to open the gates during high tide,
the 7 drainage pumps at the Marina Barrage will be sequentially activated, to pump the
excess storm water into the sea. Each pump is capable of discharging water at a rate of up
to 40m3/s.
Actual Operations of Marina Barrage on 16 June 2010 and 5 June 2011
2.5.3 During the 16 June 2010 rain event, the barrage operated in accordance with
standard operating procedures. Upon receipt of heavy rain warning at 8.30am, the barrage’s
crest gates were steadily opened, with 6 gates fully opened at 11.30am. The two bursts of
rainfall in the Stamford Canal Catchment were most intense between 9.40am to 10.40am.
Due to the rising tide, these gates were closed at 12.30pm and the barrage’s 6 pumps were
fully operational by 1300hrs. Based on the barrage’s actual operational data, the highest
water level reached on 16 June 2010 was 100.57 mRL (below the design high tide of 101.75
mRL).
2.5.4 On 5 June 2011, the crest gates were steadily opened from 8.15am upon the receipt
of heavy rain warning, with 5 gates operational at 9.10am. The heavy rainfall at the upper
Stamford Canal Catchment occurred at 10.30am. The crest gates were closed fully by
11.40am (due to rising tide), and 5 barrage pumps were operational by 12.15am. The
maximum water reached in the barrage was about 100.54 mRL (below the design high tide
of 101.75 mRL).
Conclusion 2D: The Panel noted that, for both the 16 June 2010 and 5 June 2011 flood
events, the Marina Barrage was operated in accordance with its standard operating
procedure and performed adequately based on its design considerations.
Extent of the Marina Barrage’s Influence on water levels in Stamford Canal
2.5.5 For both flood incidents, there was the public perception that the Marina Barrage
impeded the flow of water in the Marina Channel to the sea, causing a back up of storm
water flows and resulting in the floods at Orchard Road. The Panel noted that PUB had run
water level profile simulations in the major drainage systems within the Marina Catchment
(including the Stamford Canal) using the MIKE 11 software for two scenarios: (1) with the
Marina Reservoir at the actual operational levels on 5 June 2011, and (2) assuming that the
Marina Reservoir levels is fixed at 99.0 mRL (i.e. lower than actual operating levels and close
to the historical lowest tide level). The simulations had allowed the Panel to understand the
extent of the Marina Barrage’s influence on the water levels in the Stamford Canal.
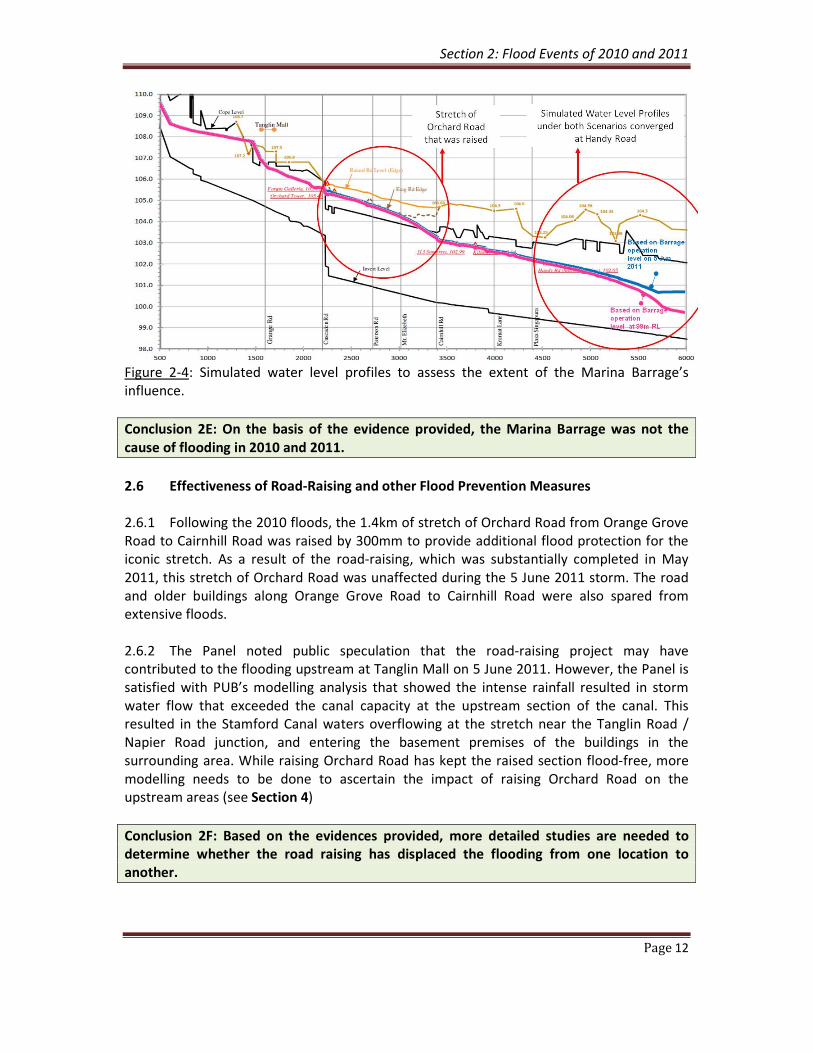
2.5.6 For both scenarios, the simulations showed that the water level profiles converged
at Handy Road, suggesting that Marina Reservoir water levels and barrage operations had
no effect upstream (see Figure 2-4). It further suggested that the Tanglin Mall area is still
expected to flood with the same rainfall on 5 June 11, with or without the barrage.
Section 2: Flood Events of 2010 and 2011
Page 12
Figure 2-4: Simulated water level profiles to assess the extent of the Marina Barrage’s
influence.
Conclusion 2E: On the basis of the evidence provided, the Marina Barrage was not the
cause of flooding in 2010 and 2011.
2.6 Effectiveness of Road-Raising and other Flood Prevention Measures
2.6.1 Following the 2010 floods, the 1.4km of stretch of Orchard Road from Orange Grove
Road to Cairnhill Road was raised by 300mm to provide additional flood protection for the
iconic stretch. As a result of the road-raising, which was substantially completed in May
2011, this stretch of Orchard Road was unaffected during the 5 June 2011 storm. The road
and older buildings along Orange Grove Road to Cairnhill Road were also spared from
extensive floods.
2.6.2 The Panel noted public speculation that the road-raising project may have
contributed to the flooding upstream at Tanglin Mall on 5 June 2011. However, the Panel is
satisfied with PUB’s modelling analysis that showed the intense rainfall resulted in storm
water flow that exceeded the canal capacity at the upstream section of the canal. This
resulted in the Stamford Canal waters overflowing at the stretch near the Tanglin Road /
Napier Road junction, and entering the basement premises of the buildings in the
surrounding area. While raising Orchard Road has kept the raised section flood-free, more
modelling needs to be done to ascertain the impact of raising Orchard Road on the
upstream areas (see Section 4)
Conclusion 2F: Based on the evidences provided, more detailed studies are needed to
determine whether the road raising has displaced the flooding from one location to
another.

Section 2: Flood Events of 2010 and 2011
Page 13
2.7 Effects of Urbanisation
2.7.1 Urbanisation has undoubtedly led to an increase in storm water runoff in Singapore.
There is therefore a strong argument for introducing measures to mitigate the effects of
such urbanisation.
2.7.2 The design of drains involves sizing their capacity to accommodate the expected
peak flow of rainfall over a catchment. One of the parameters used in determining the drain
capacity is the runoff coefficient, commonly referred to as the C-Factor.3 As covered earlier,
the Stamford Canal was designed on a surface run-off coefficient of 0.65, based on the
projected land use Master Plan developed by the Urban Development Authority. As
development intensified, PUB continued to validate the design C-Factor against
development trends via the Building Plan Submissions that were checked by PUB as part of
the Building Plan and Development Control Process.
2.7.3 The Panel noted that, as at June 2010, the weighted C-Factor for the Stamford
Catchment continues to be within the design value of 0.65, at 0.62. The Panel was in general
agreement that the increased urbanisation in the Stamford Canal Catchment might have
been a contributing factor to the 2010 and 2011 floods, in addition to the higher rainfall
intensities compared to design levels. However, additional modelling and analysis is
required to fully appreciate the effects of urbanization on the generation of surface run-off,
and its impact on the drainage system. PUB had projected that the expected intensification
in land use within the catchment will see the C-Factor reaching 0.71 when URA’s Master
Plan 2008 is fully realised. The Panel noted that PUB is already looking into options to
improve the drainage capacity of the Stamford Canal based on the enhanced drainage
standards of meeting a 25 year return period as proposed by the IADRC, and taking into
consideration the projected changes in the extent of urbanisation. In addition, PUB may
wish to explore ways to compensate for the effects of urbanization and manage the amount
of surface run-off generated (see Section 5).
2.7.4 The Panel also noted that, other than generating higher and faster surface run-off,
increased urbanization may also bring about other impacts such as increased heat
production, changes in rainfall patterns and other climate change impacts. However, these
specific impacts are still not well understood and there is a need for further studies.
Conclusion 2G: The increased urbanization in the Stamford Canal Catchment might have
been a contributing factor to the floods but further modelling and analysis is required to
determine the extent of this effect. The Panel also noted that PUB is already looking into
measures to improve the canal capacity based on changes in the drainage standards and
the projected changes in the extent of urbanization for the Stamford Canal Catchment.
3 The surface runoff coefficient stipulates the proportion of surface runoff expected to be generated from
fallen rainfall within the catchment, based on the ratio of impervious surfaces (e.g. roads, paved areas) to the
entire area in the catchment.

Section 2: Flood Events of 2010 and 2011
Page 14
2.7.5 It is noted that PUB has already engaged a consultant to study the feasibility of
constructing a storm water detention pond and pumped drainage system as well as a
Diversion Canal to the Singapore River in order for Stamford Canal to meet the new
standards. Other options such as mandatory detention tanks to control the amount of
runoff generated at each new development are being explored. The Panel agreed that these
options are positive steps forward in providing the Orchard Road area with additional
safeguards against floods.
2.8 Effects of Debris during 16 June 2010 Flood
2.8.1 Initial investigations into the 16 June 2010 flood indicated that debris washed down
and partially trapped in the culvert across Orchard Road in front of Delfi Orchard was
partially responsible for the flooding. This culvert bifurcates the Stamford Canal into two
sections at Delfi Orchard/ Orchard Parade Hotel and rejoins at Orchard Road/ Cairnhill Road
junction, near The Heeren Building. The bifurcation was necessary due to land constraints
which limited the expansion of the older lower section. The culvert is designed such that
storm water flow usually flows along the main upper section with spillover during heavy rain
channeled to the lower section. During the storm event of 16 June 2010, the heavy build-up
of debris that was partially trapped in the culvert may have caused the rainwater to be
diverted into lower section of the canal and overflow into Orchard Road.
2.8.2 Subsequent investigations by PUB revealed that the heavy rainfall from the twin
bursts of rain generated a combined storm water flow that exceeded the design capacity of
the canal. This caused the water level in the canal to rise rapidly and overflow onto Orchard
Road. The debris carried off by the runoff from the first burst into the culvert was only an
aggravating condition, but was unlikely to be the main cause of the floods. The Panel has
reviewed PUB’s findings and, subject to any new evidences arising which might suggest that
debris to be the key factor behind the 16 June 2010 floods, accepted PUB’s findings.
Conclusion 2H: Debris and litter washed down by the storm waters in the Stamford Canal
might have been a contributing factor to the floods, but was unlikely to be the lead factor
for the floods.
2.9 Presence of Services in Stamford Canal
2.9.1 The Panel noted that within the Stamford Canal, there exist numerous services such
as potable water and sewer pipelines that cross various sections of the canal. These services
were left in place when the Stamford Canal was reconstructed in the 1980s, and the
capacity designed to include their presence. In addition, the Stamford Canal had been
designed with a freeboard of 15%, and this was deemed to be a practical buffer to allow for
contingencies. The Panel also noted that in 2004, in view of limited land and congested
underground space within the Stamford Canal Catchment for pipe-laying, a decision was
made to lay NEWater pipelines within the Stamford Canal. The assumption then was that
these pipelines will not take up more than the buffer space provided by the 15% freeboard,
and hence, will not affect the design flow capacity in the canal. As such, between Mar 2005

Section 2: Flood Events of 2010 and 2011
Page 15
to Jul 2007, NEWater pipelines of diameter ranging from 160mm to 660m were
subsequently laid in the Stamford Canal from Orange Grove Road to Raffles Boulevard.
2.9.2 Based on the evidence shared by PUB, the presence of these services accounted for
not more than 8% of the canal flow capacity. Subject to further evidence, the Panel agreed
that the presence of these services might have been a contributing factor in increasing the
flood risk for the area due to the reduction in the freeboard/ buffer capacity of the canal.
The extent of their effect will have to be further modelled and analysed. Notwithstanding
this, the Panel opined that PUB should seriously consider removing some of these services
so as to provide greater buffer in the canal flow capacity.
Conclusion 2I: The presence of the services in the Stamford Canal might have been a
contributing factor to the floods but further modelling and analysis are required to
determine the extent of their effect.
2.10 Flooding in the Bukit Timah Catchment on 16 June 2010
2.10.1 Apart from Orchard Road, the Bukit Timah area also experienced localised flash
floods on 16 June 2010. Specifically, localised floods occurred along sections of Dunearn
Road (near Hillcrest Road), Newton Circus, Fourth Avenue and the junction of Coronation
Road West and Jalan Haji Alias. The depth of the floods ranged from 50mm to 300mm for a
period of 15 to 30 minutes.
2.10.2 PUB had since embarked on works to upgrade the Bukit Timah First Diversion Canal,
which diverts storm water along the upstream sections of the Bukit Timah Canal to Sungei
Ulu Pandan. The upgrading is also necessary to cope with increased urbanisation in the Bukit
Timah Catchment, which has seen significant changes over the years. The first phase of the
drainage improvement works sought to widen and deepen the First Diversion Canal section
between Jalan Kampong Chantek and Maple Avenue culvert. The works are scheduled to be
completed in December 2012 and will provide flood alleviation from Wilby Road to Maple
Avenue. The second phase of the drainage improvement works will involve improving the
capacity from the Maple Avenue culvert to Sungei Ulu Pandan will be completed by mid-
2014. More importantly, the Panel noted that these improvement works will address the
bottlenecks in the drainage system, i.e. the drainage constriction points at the Military Hill,
Malayan Railway and Garlick Ave tunnels.
2.10.3 Additionally, the stretch of Balmoral Road (near the junction with Bukit Timah Road)
affected during the floods, is a localised depression and will be raised by early 2012. The
drainage improvement works at the Dunearn & Hillcrest Road junction will be completed by
early 2013. The Panel had reviewed the drainage improvement projects and are satisfied
that the works will alleviate flooding in the Bukit Timah Area.
Conclusion 2J: Measures being undertaken to address the Bukit Timah floods appear to be
sound.
Section 2: Flood Events of 2010 and 2011
Page 16
2.11 Conclusions
2.11.1 Based on the evidences and reports provided by the PUB, the Panel made the
following key conclusions on the flood events of 16 June 2010 and 5 June 2011:
(A) PUB’s detailed investigation findings for the 16 June 2010 flood were sound and well
documented, with independent review by an external panel. The measures taken to
address the specific site issues (e.g. installation of flood barriers, enhanced flood
alerts systems) were practical and the IADRC review of the drainage design
standards and requirements under the Code of Practice for Surface Water Drainage
was timely;
(B) The floods that occurred on 5 June 2011 appeared to be localised and due to the
sudden burst of heavy rain that overwhelmed the conveyance capacity of the
Stamford Canal at the Tanglin area. It was also noted that areas along the stretch
where the Orchard Road was recently raised were not badly affected;
(C) The capacity of the Stamford Canal was not able to cope with the peak flows of both
the 16 June 2010 and the 5 June 2011 rainfall;
(D) The Panel noted that, for both the 16 June 2010 and 5 June 2011 flood events, the
Marina Barrage was operated in accordance with its standard operating procedure
and performed adequately based on its design considerations;
(E) Marina Barrage was not the cause of the flooding in 2010 and 2011;
(F) More detailed studies are needed to assess whether the road raising has displaced
the flooding from one location to another;
(G) The increased urbanization in the Stamford Canal Catchment might have been a
contributing factor to the floods but further modelling and analysis is required to
determine the extent of their effect. The Panel also noted that PUB is already looking
into measures to improve the canal capacity based on changes in the drainage
standards and the projected changes in the extent of urbanization for the Stamford
Canal Catchment;
(H) Debris and litter washed down by the storm waters in the Stamford Canal might
have been a contributing factor to the floods, but was unlikely to be the lead factor
for the floods;
(I) The presence of the services in the Stamford Canal might have been a contributing
factor to the floods but further modelling and analysis is required to determine the
extent of their effect; and
(J) Measures being undertaken to address the Bukit Timah floods appear to be sound.

Section 2: Flood Events of 2010 and 2011
Page 17
2.11.2 On balance, the Panel agreed that the capacity of the Stamford Canal was not able to
handle the storm water flows generated by both the 2010 and 2011 rainfall events. It was
also noted that some parts of the Stamford Canal catchment appear to be more vulnerable
than others. These areas will have to be more rigorously assessed through a flood risk
mapping exercise and, in lieu of having adequate drainage capacity to serve the areas, will
have to be managed through a more efficient and accurate flood early warning systems. At
the same time, the Panel also agreed that there should be more proactive public
communication and engagement on issues related to drainage and flood management so as
to allow them better understanding of PUB’s drainage and flood management strategies
and approaches. Some of the specific recommendations to the above concerns are
addressed in the subsequent Sections 3 to 6 of this report.

Section 3: Rainfall Analysis
Page 18
SECTION 3: Rainfall Analysis
The Panel requested for MSS to give a detailed briefing on Singapore’s rainfall
monitoring capabilities as well as provide a comprehensive account of past rainfall data and
observed trends. The Panel subsequently deliberated on the data, and the key highlights
and observations, as well as proposed recommendations to enhance the analysis, are
provided in the following paragraphs.
3.1 Singapore’s Rainfall Data Collection
3.1.1 The MSS has been collecting and compiling rainfall records of Singapore since 1869.
Prior to the 1970s, the network of rainfall stations was relatively sparse and the rainfall
records were limited to only daily and monthly rainfall totals. Since the 1970s, the network
was gradually expanded with the addition of new rainfall stations and more detailed rainfall
records such as hourly rainfall total and maximum 60-min rainfall total4 were also compiled.
Over the last few years, a dense island-wide network of real-time Automatic Weather
Stations (AWS) was installed to replace many of the traditional autographic rain gauges5.
Currently, MSS maintains a network of 62 AWS, with the installation of an additional 31
AWS to be completed by 2013.
3.2 Historical Trends
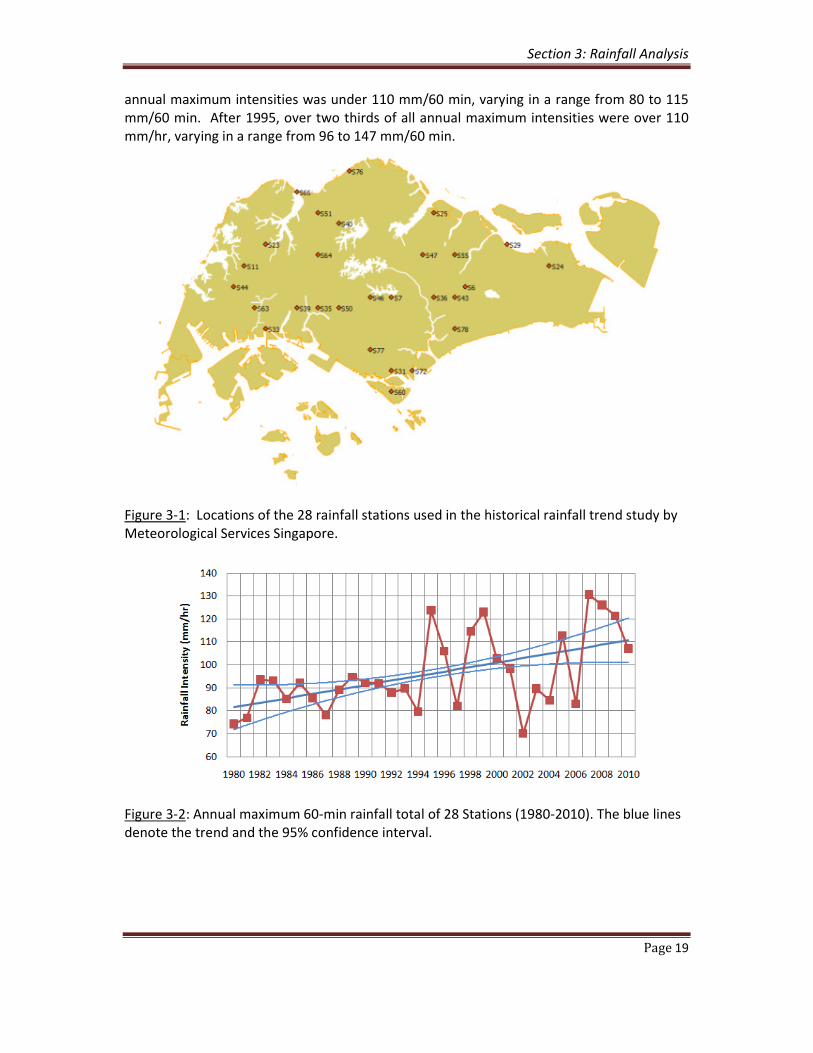
3.2.1 MSS has conducted a trend analysis of the past 30 years of historical rainfall based
on the annual maximum 60-minute rainfall at 28 stations across Singapore. Figure 3-1
shows the location of the 28 stations used in the analysis, while Figure 3-2 shows the
increasing trend in the annual maximum rainfall intensity (mm/60min), based on rain gauge
data. These rain gauge stations were chosen as they meet the criteria of having sufficiently
long period of continuous hourly rainfall records that was required for the study. Figure 3-3
shows a scatter-plot of the annual maximum 60-minute precipitation at each of the
available rain gauge station, and Figure 3-4 shows the number of stations used in each year
of the analysis.
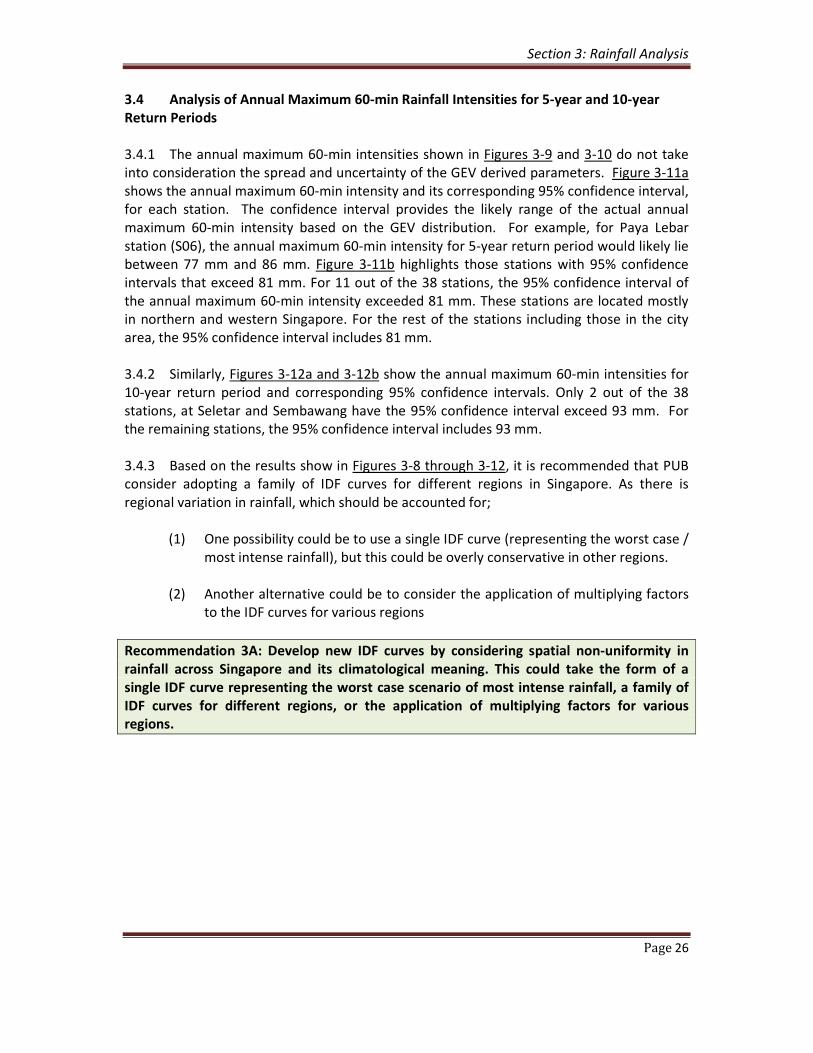
3.2.2 Based on the analysis, the Panel noted that there is strong evidence of a trend
towards higher rainfall intensities, and increasing frequency of high intensity rain events.
Figure 3-2 shows strong year-to-year variability in the maximum rainfall intensity, which are
typical at most tropical locations. The analysis also shows that the amplitude of that
variability increased considerably over the last 30 years. Before 1995, all but one of the
4 The hourly rainfall total refers to the measurement of rainfall received at the end of each hour of the day.
The 60-min monthly maximum rainfall total refers to the highest rainfall amount over a continuous period of
60 minutes during any time of the month. Besides the 60-min rainfall total, MSS keeps records of 15-min, 30-
min, 45-min, 120-min, 180-min, 360-min, 720-min and 1440-min rainfall totals for each month.
5 An autographic rain gauge is a rain gauge with a chart recorder that can continuously record the amount of
rainfall.
Section 3: Rainfall Analysis
Page 19
annual maximum intensities was under 110 mm/60 min, varying in a range from 80 to 115
mm/60 min. After 1995, over two thirds of all annual maximum intensities were over 110
mm/hr, varying in a range from 96 to 147 mm/60 min.
Figure 3-1: Locations of the 28 rainfall stations used in the historical rainfall trend study by
Meteorological Services Singapore.
Figure 3-2: Annual maximum 60-min rainfall total of 28 Stations (1980-2010). The blue lines
denote the trend and the 95% confidence interval.

Figure 3-3: Scatterplot of
Figure 3-4: Number of stations
Section 3: Rainfall Analysis
: Scatterplot of annual maximum 60-min rainfall total (1980 - 2010)
tations used in scatterplot of annual maximum rainfall
Rainfall Analysis
Page 20
2010).
ainfall.

Section 3: Rainfall Analysis
Page 21
3.3 Rainfall Variation
Spatial Trends in the Annual Hourly Rainfall
3.3.1 The trend analysis for multiple stations described above was repeated for each of
the 28 rainfall stations to examine the trend at individual stations. Figure 3-5 shows the
trend of the annual hourly rainfall total at each of the 28 stations. There are 7 stations in
the southwest and northeast of Singapore which show statistically significant uptrend in the
hourly rainfall total, ranging from 5 mm (Paya Lebar) to 9 mm (Tengah) per decade. The rest
of the stations show no statistically significant trends.
3.3.2 Figures 3-6 and 3-7 show the trend of the annual number of days with hourly rainfall
total exceeding 70 mm. Out of the 28 rainfall stations, statistically significant uptrends are
observed at 5 rainfall stations, with an average rate of about 1 additional day above 70 mm
per 25 years. The rest of the stations show no statistically significant trends.
3.3.3 To provide a wider perspective of the past heavy rainfall trend, MSS conducted a
separate study to examine the trend of the daily rainfall total. The study used the daily
rainfall totals from the same 28 stations. In terms of the daily rainfall totals and frequency
of days with daily rainfall totals exceeding 40 mm and 70 mm, statistically significant
uptrend were observed in about the same areas as for the hourly rainfall total. The
observed trends in the daily rainfall totals reaffirm the observed changes in the trend for the
hourly rainfall totals.
Figure 3-5: Map showing the past trends of annual hourly rainfall total at individual stations.
Uptrend and downtrend are depicted by up-arrow and down-arrow respectively. Only the
red arrow represents a statistically significant trend. The numerical value next to each arrow
indicates the rate of change for the period 1980-2010. A statistically significant uptrend is
observed mainly at stations in the southwest and northeast of Singapore.

Section 3: Rainfall Analysis
Page 22
Figure 3-6: Plot of annual frequency of occurrence of hourly rainfall total exceeding 70 mm
showed a statistically significant uptrend with an average rate of 1.8 days per decade. The
trend is indicated by the blue line and the 95% confidence interval.
Figure 3-7: Map showing the past trends of annual number of days with hourly rainfall totals
exceeding 70 mm at individual stations. The direction of the arrow depicts increasing or
decreasing frequency of occurrence. The numerical value next to each arrow indicates the
rate of change of the annual number of days with hourly rainfall total greater than 70 mm
for the period 1980-2010.

Section 3: Rainfall Analysis
Page 23
Spatial Distribution of Annual Maximum 60-min Extreme Rainfall Intensities for 5-year and
10-year Return Periods
3.3.4 MSS conducted a study of the maximum 60-min rainfall total to derive the annual
maximum 60-min rainfall intensity for 5-year and 10-year return periods at each station.
Figure 3-8 shows the location of the 38 rainfall stations used in the study. The stations were
chosen on the basis that the rainfall records span a period of more than 25 years between
1981 and 2010, in order to ensure adequate data to compute the rainfall intensity for return
periods of 5 years and 10 years. The rainfall stations are well spread out across the island
except in the southeastern part, and include one in the offshore island of Pulau Tekong.
Figure 3-8: Locations of the 38 rainfall stations used in the study.
3.3.5 The annual maximum rainfall intensities for different return periods were computed
using the R-based “extRemes” toolkit. A monthly or yearly time series of rainfall data can be
used to fit the Generalized Extreme Value (GEV) distribution. The study showed that the
use of the annual time series did not result in good fits of the GEV distribution due to the
small number of data points. On the other hand, the monthly time series, which has
significantly more data points, produced better fits of the GEV distribution. The diagnostic
charts showing the improved goodness-of-fit from the use of the monthly maximum rainfall
data are shown in Appendix 2.
3.3.6 The annual maximum 60-min intensities for return periods of 5 years and 10 years
were therefore derived based on the GEV analysis using the monthly time series of 60-min
rainfall totals. Figures 3-9 and 3-10 show the spatial distribution of the annual maximum 60-
min intensities for return periods of 5 years and 10 years respectively. For both return
periods, the annual maximum 60-min intensities are not uniform across the island.

Section 3: Rainfall Analysis
Page 24
Figure 3-9: Station values (upper) and isolines (lower) of annual maximum 60-min rainfall
intensities for 5-year return period. The blue shades represent the areas with values that
exceed PUB’s annual maximum 60-min rainfall intensity of 81 mm.
3.3.7 PUB’s current policy is to adopt a single IDF curve which is applicable to any location
in Singapore. For the 5-year and 10-year return periods, the annual maximum 60-minute
rainfall intensities derived from the IDF curve are 81 mm and 93 mm respectively. The map
displaying the isolines of the annual maximum 60-min intensity for 5-year return period in
Figure 3-9 shows that the rainfall intensity is higher than 81 mm over most parts of the
island. The highest annual intensity of 94 mm is recorded at Sembawang in northern
Singapore. Over parts of southern and north-eastern Singapore, the annual maximum 60-
min intensity is close to 81 mm.

Section 3: Rainfall Analysis
Page 25
Figure 3-10: Station values (upper) and isolines (lower) of annual maximum 60-min
intensities for 10-year return period. The blue shades represent the areas with values that
exceed PUB’s annual maximum 60-min intensity of 93 mm and the brown shades represent
areas that are less than 93 mm.
3.3.8 The annual maximum 60-min intensity for 10-year return period has a similar spatial
distribution as shown in Figure 3-10. The highest annual intensity of around 103 mm is
recorded in northern Singapore. The western and eastern parts of the island also have
values that are markedly higher than 93 mm. Over parts of southern and north-eastern
Singapore, the annual maximum 60-min intensity is less than 93 mm.
Section 3: Rainfall Analysis
Page 26
3.4 Analysis of Annual Maximum 60-min Rainfall Intensities for 5-year and 10-year
Return Periods
3.4.1 The annual maximum 60-min intensities shown in Figures 3-9 and 3-10 do not take
into consideration the spread and uncertainty of the GEV derived parameters. Figure 3-11a
shows the annual maximum 60-min intensity and its corresponding 95% confidence interval,
for each station. The confidence interval provides the likely range of the actual annual
maximum 60-min intensity based on the GEV distribution. For example, for Paya Lebar
station (S06), the annual maximum 60-min intensity for 5-year return period would likely lie
between 77 mm and 86 mm. Figure 3-11b highlights those stations with 95% confidence
intervals that exceed 81 mm. For 11 out of the 38 stations, the 95% confidence interval of
the annual maximum 60-min intensity exceeded 81 mm. These stations are located mostly
in northern and western Singapore. For the rest of the stations including those in the city
area, the 95% confidence interval includes 81 mm.
3.4.2 Similarly, Figures 3-12a and 3-12b show the annual maximum 60-min intensities for
10-year return period and corresponding 95% confidence intervals. Only 2 out of the 38
stations, at Seletar and Sembawang have the 95% confidence interval exceed 93 mm. For
the remaining stations, the 95% confidence interval includes 93 mm.
3.4.3 Based on the results show in Figures 3-8 through 3-12, it is recommended that PUB
consider adopting a family of IDF curves for different regions in Singapore. As there is
regional variation in rainfall, which should be accounted for;
(1) One possibility could be to use a single IDF curve (representing the worst case /
most intense rainfall), but this could be overly conservative in other regions.
(2) Another alternative could be to consider the application of multiplying factors
to the IDF curves for various regions
Recommendation 3A: Develop new IDF curves by considering spatial non-uniformity in
rainfall across Singapore and its climatological meaning. This could take the form of a
single IDF curve representing the worst case scenario of most intense rainfall, a family of
IDF curves for different regions, or the application of multiplying factors for various
regions.

Section 3: Rainfall Analysis
Page 27
Figure 3-11a: Plot of 95% confidence interval of annual maximum 60-min intensity with 5-
year return period for each rainfall station, derived from 60-min rainfall totals (monthly).
Figure 3-11b: Map showing the 11 stations identified in figure 3-11a with 95% confidence
interval exceeding 81 mm.

Section 3: Rainfall Analysis
Page 28
Figure 3-12a: Plot of 95% confidence interval of annual maximum 60-min intensity for 10-
year return period at each rainfall station, derived from 60-min rainfall totals (monthly).
Figure 3-12b: Map showing the 2 stations identified in figure 3-12a with 95% confidence
interval exceeding 93 mm.
3.5 Temporal Variations
3.5.1 In addition to the fairly strong evidence of increasingly intense rainstorms, with
spatial variability favouring more intense events over NE and SW parts of Singapore,

Section 3: Rainfall Analysis
Page 29
planning for flood control must also consider the temporal variations of rainfall patterns in
Singapore. Figures 3-13 through 3-16 show rainfall patterns at 8 stations for 4 recent events
associated with varying degrees of flooding in Singapore, on June 16, June 25, and July 17,
2010, and June 5, 2011. It is clear from these charts that rainfall patterns are highly variable
in time and space, reflecting the track of storm cells as they move across the area. In some
cases the intensity distribution is skewed to the left, i.e. they have higher intensities early in
the event. In others, the distribution is skewed to the right, i.e. peaks occur later in the
event.
3.5.2 Analysis of rainfall data suggests that there are spatial and temporal variabilities in
rainfall patterns, e.g. greater propensity for rainfall to peak or be “skewed” during the early
stages of a storm, or the existence of “double-peak” storms. In particular, the rainfall for 5
June 2011 is a highly localised rainfall which fell in the upstream of the Stamford Catchment
(rainfall data from rain gauge at Botanical Gardens).
3.5.3 It is recommended that MSS conduct an analysis of the percentage of total rainfall
depth that occurs as a fraction of total rainfall duration, for a significant number of storms
and locations, to confirm the anecdotal observation that there is a tendency for storms to
have higher rainfall intensities earlier in the storm events. This would inform any decision
on possible changes to standard design storm shapes. This developmental work could be
built upon the work done by Chang KK (1969) and Tan & Sia (1997) based on the framework
of Huff (1967)6.
Recommendation 3B: PUB and MSS should conduct an analysis of the percentage of total
rainfall depth that occurs as a fraction of total rainfall duration throughout the storm
events, to confirm anecdotal observations that many storms peak early in the event.
Moving forward, PUB may consider developing short duration design storm unit
hyetographs that can be used with 5-, 10-, 25-, 50- and 100-year return interval storm
depths, reflecting the temporal variability (skewness) in the rainfall patterns.
6 Huff FA (1967) “Time distribution of rainfall in heavy storms”, Water Resources Research, vol 3(4), pp 1007-
1019.
Chang K K (1969) “Temporal pattern of design storms for Singapore” Journal of Institution of Engineers
Singapore, 1969, pp 9 – 13
Tan S K and Sia S Y (1997) “Synthetic Generation of Tropical Rainfall Time Series Using An Event-Based
Method” ASCE Journal of Hydrologic Engineering, vol 2 No 2 pp 83-89.

Figure 3-13: Rainfall hyetographs
stations on June 16, 2010.
Figure 3-14: Rainfall hyetographs
stations on June 25, 2010.
Section 3: Rainfall Analysis
yetographs showing temporal variation of rainfall patterns at
yetographs showing temporal variation of rainfall patterns at
Rainfall Analysis
Page 30
atterns at different
atterns at different

Section 3: Rainfall Analysis
Page 31
Figure 3-15: Rainfall hyetographs showing temporal variation of rainfall patterns at different
stations on July 17, 2010.
Figure 3-16: Rainfall hyetographs showing temporal variation of rainfall patterns at different
stations on June 5, 2011.
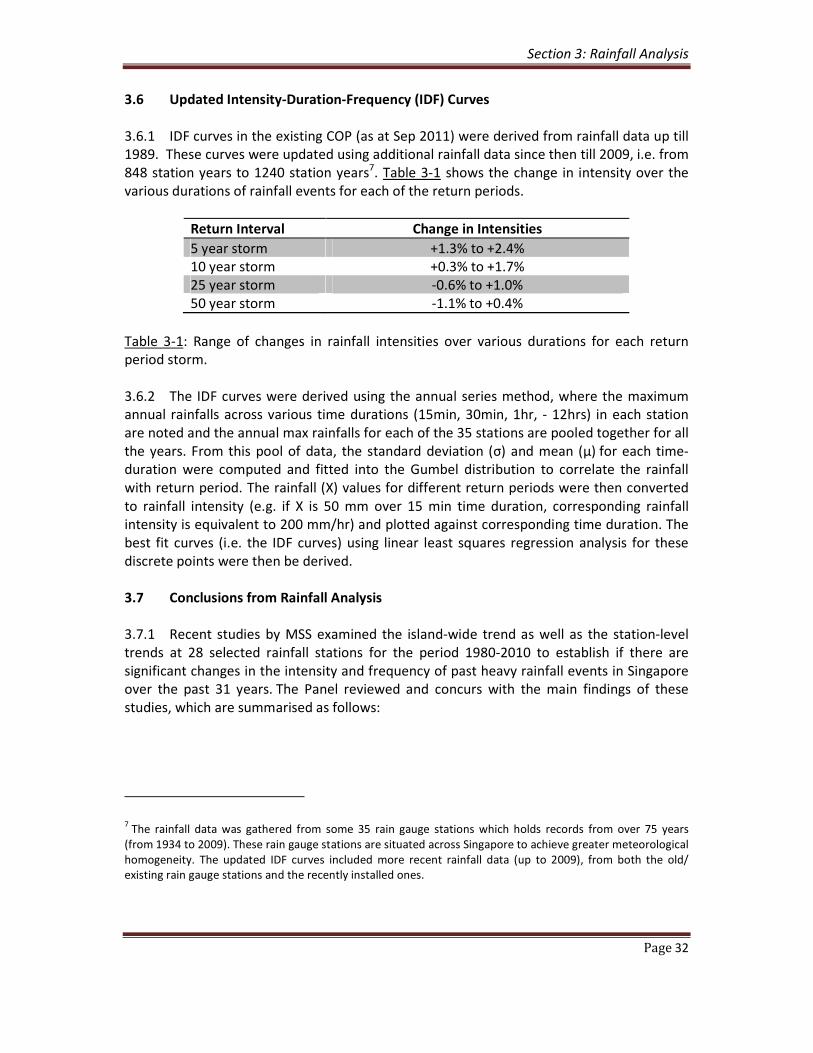
Section 3: Rainfall Analysis
Page 32
3.6 Updated Intensity-Duration-Frequency (IDF) Curves
3.6.1 IDF curves in the existing COP (as at Sep 2011) were derived from rainfall data up till
1989. These curves were updated using additional rainfall data since then till 2009, i.e. from
848 station years to 1240 station years7. Table 3-1 shows the change in intensity over the
various durations of rainfall events for each of the return periods.
Return period Change in Intensity over Various Durations
Return Interval Change in Intensities
5 year storm +1.3% to +2.4%
10 year storm +0.3% to +1.7%
25 year storm -0.6% to +1.0%
50 year storm -1.1% to +0.4%
Table 3-1: Range of changes in rainfall intensities over various durations for each return
period storm.
3.6.2 The IDF curves were derived using the annual series method, where the maximum
annual rainfalls across various time durations (15min, 30min, 1hr, - 12hrs) in each station
are noted and the annual max rainfalls for each of the 35 stations are pooled together for all
the years. From this pool of data, the standard deviation (σ) and mean (µ) for each time-
duration were computed and fitted into the Gumbel distribution to correlate the rainfall
with return period. The rainfall (X) values for different return periods were then converted
to rainfall intensity (e.g. if X is 50 mm over 15 min time duration, corresponding rainfall
intensity is equivalent to 200 mm/hr) and plotted against corresponding time duration. The
best fit curves (i.e. the IDF curves) using linear least squares regression analysis for these
discrete points were then be derived.
3.7 Conclusions from Rainfall Analysis
3.7.1 Recent studies by MSS examined the island-wide trend as well as the station-level
trends at 28 selected rainfall stations for the period 1980-2010 to establish if there are
significant changes in the intensity and frequency of past heavy rainfall events in Singapore
over the past 31 years. The Panel reviewed and concurs with the main findings of these
studies, which are summarised as follows:
7 The rainfall data was gathered from some 35 rain gauge stations which holds records from over 75 years
(from 1934 to 2009). These rain gauge stations are situated across Singapore to achieve greater meteorological
homogeneity. The updated IDF curves included more recent rainfall data (up to 2009), from both the old/
existing rain gauge stations and the recently installed ones.

Section 3: Rainfall Analysis
Page 33
Intensity
• A statistically significant uptrend in the annual maximum hourly rainfall total is
observed for Singapore as a whole. The average rate of increase is about 10 mm per
decade, rising from 80 mm in 1980 to 110 mm in 2010.
• For the individual stations, the trend is not uniform across the island. Statistically
significant uptrends are observed in the west and northeast of Singapore. In Jurong,
the highest hourly rainfall total recorded in the decade 1981-1990 is 63 mm, and
rising by 41% to 89 mm, the highest hourly rainfall recorded in the decade 2001-
2010. The corresponding values recorded at Pasir Ris are 71 mm and 112 mm.
• For the other parts of Singapore, no significant up or down trends are observed at
the individual stations. In the Marina area, for example, there is a marginal decrease
in the highest recorded hourly rainfall from 92 mm (1981-1990) to 87 mm (2001-
2010).
Frequency
• Statistically significant uptrends in the annual number of days with hourly rainfall
totals exceeding 40 mm and 70 mm are observed for Singapore as a whole. The
average rate of increase is about 5 days per decade for the 40 mm threshold and 1.8
days per decade for the 70 mm threshold.
• About one third of the stations exhibited statistically significant uptrends in the
annual number of days with hourly rainfall total exceeding 40 mm. The average rate
of increase for the single stations is about 1 day per decade. In Jurong, the highest
annual frequency rose from 9 days in the decade 1981-1990 to 11 days in the decade
2001-2010. The corresponding annual frequencies recorded in the Marina area is 6
days and 9 days.
• About one fifth of the stations exhibited statistically significant uptrends in the
annual number of days with hourly rainfall total exceeding 70 mm. The average rate
of increase is about 1 day per 25 years.
3.7.2 As there exists large year-to-year variability of the rainfall in Singapore, a long rainfall
observation record is needed to establish reliable trends. In general, trends based on 5
years or less rainfall data are mostly unreliable. Even the 31-year period of the rainfall
records used in this study is relatively short and falls short of the recommended 50 years or
so which is the minimum data record to adequately study climate change or urbanisation
effects. Nonetheless, the observed trends in the rainfall intensity and frequency identified in
this study provide a reasonably good indication that the heavy rainfall trends have changed
in Singapore over the past three decades and should be factored in drainage planning.

Section 3: Rainfall Analysis
Page 34
Spatial Variation
3.7.3 Based on the records of 60-min rainfall total (monthly) for the period 1980-2010
from 38 island-wide rainfall stations, the main findings of this study are summarised as
follows:
(a) The annual maximum 60-min intensities for 5-year and 10-year return periods show
a marked spatial variation across the island. The intensities are highest in northern
Singapore and lowest in parts of southern and northeastern Singapore;
(b) In comparison with the annual maximum 60-min intensity derived from PUB’s IDF
curve (81 mm for 5-year return period and 93 mm for 10-year return period):
• The annual maximum 60-min intensity for 5-year return period is higher than 81
mm in most parts of the island. The values range from 80 mm at Kent Ridge in
the south to 94 mm at Sembawang in the north of Singapore;
• The annual maximum 60-min intensity for 10-year return period is higher than 93
mm in most parts of the island. The values range from 86 mm at Punggol in the
northeast to 103 mm at Sembawang in the north of Singapore; and
• In the city area, the annual maximum 60-min intensity for 5-year and 10-year
return periods recorded at Triple One Building is 84 mm and 92 mm respectively,
which are both close to PUB’s values.
(c) For 11 out of 38 stations, the actual annual maximum 60-min intensity for the 5-year
return period has exceeded 81 mm. The actual annual maximum 60-min intensity
for the 10-year return period has exceeded 93 mm for 2 of the 38 stations. For those
areas that exceed the PUB’s intensity, the results suggest that peak rainfall
intensities may already exceed the current design parameters.
3.7.4 These data and the reanalysis of the IDF curves suggest that the existing IDF
curves (specifically 5 year and 10 year storms) are on the low side. Climatological
consideration needs to clarify the meaning of the geographical pattern and its temporal
changes derived from the observed rain gauge data and IDF analysis. There may be
justification for creating a single IDF curve for different regions, or the application of
multiplying factors for various regions.
3.8 Further Studies on Rainfall
3.8.1 Based on the rainfall intensity records over the past 30 years, there is strong
evidence of a trend towards higher rainfall intensities and frequency of intense rains. These
uptrends are consistent with the Inter-governmental Panel on Climate Change 4th
Assessment Report (IPCC AR4) and could add further strain on Singapore’s existing drainage
infrastructure. Based on these observations PUB and MSS may wish to consider further
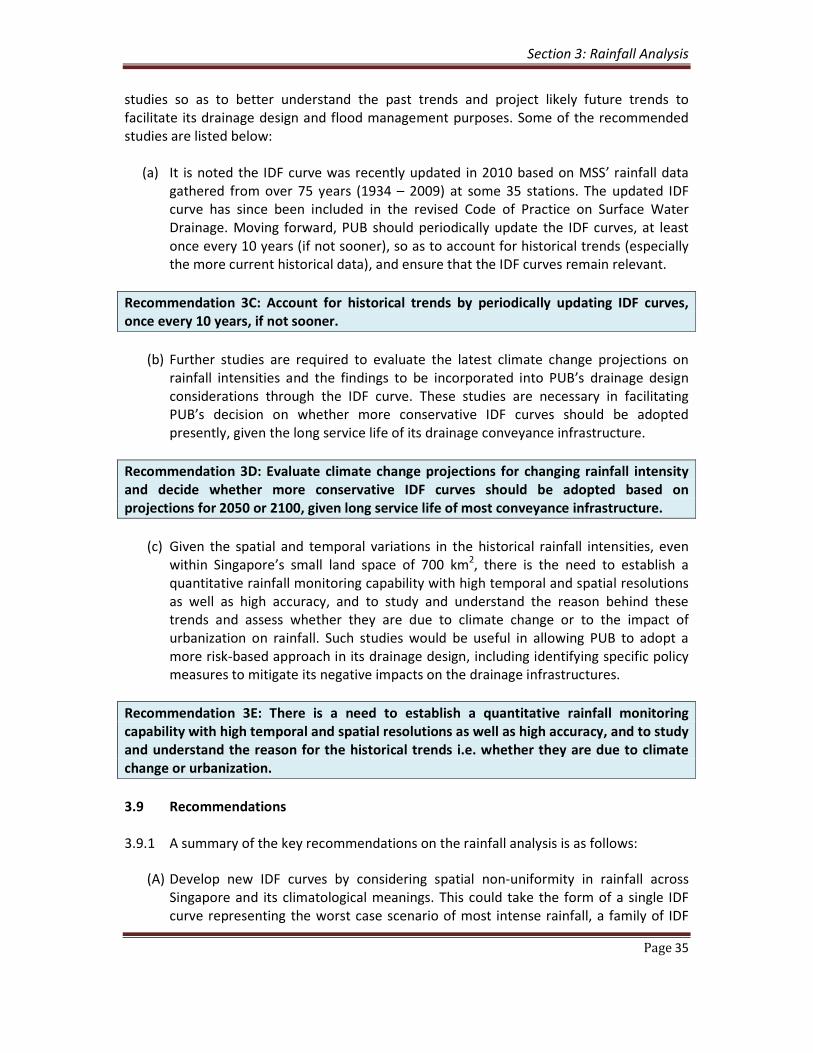
Section 3: Rainfall Analysis
Page 35
studies so as to better understand the past trends and project likely future trends to
facilitate its drainage design and flood management purposes. Some of the recommended
studies are listed below:
(a) It is noted the IDF curve was recently updated in 2010 based on MSS’ rainfall data
gathered from over 75 years (1934 – 2009) at some 35 stations. The updated IDF
curve has since been included in the revised Code of Practice on Surface Water
Drainage. Moving forward, PUB should periodically update the IDF curves, at least
once every 10 years (if not sooner), so as to account for historical trends (especially
the more current historical data), and ensure that the IDF curves remain relevant.
Recommendation 3C: Account for historical trends by periodically updating IDF curves,
once every 10 years, if not sooner.
(b) Further studies are required to evaluate the latest climate change projections on
rainfall intensities and the findings to be incorporated into PUB’s drainage design
considerations through the IDF curve. These studies are necessary in facilitating
PUB’s decision on whether more conservative IDF curves should be adopted
presently, given the long service life of its drainage conveyance infrastructure.
Recommendation 3D: Evaluate climate change projections for changing rainfall intensity
and decide whether more conservative IDF curves should be adopted based on
projections for 2050 or 2100, given long service life of most conveyance infrastructure.
(c) Given the spatial and temporal variations in the historical rainfall intensities, even
within Singapore’s small land space of 700 km2, there is the need to establish a
quantitative rainfall monitoring capability with high temporal and spatial resolutions
as well as high accuracy, and to study and understand the reason behind these
trends and assess whether they are due to climate change or to the impact of
urbanization on rainfall. Such studies would be useful in allowing PUB to adopt a
more risk-based approach in its drainage design, including identifying specific policy
measures to mitigate its negative impacts on the drainage infrastructures.
Recommendation 3E: There is a need to establish a quantitative rainfall monitoring
capability with high temporal and spatial resolutions as well as high accuracy, and to study
and understand the reason for the historical trends i.e. whether they are due to climate
change or urbanization.
3.9 Recommendations
3.9.1 A summary of the key recommendations on the rainfall analysis is as follows:
(A) Develop new IDF curves by considering spatial non-uniformity in rainfall across
Singapore and its climatological meanings. This could take the form of a single IDF
curve representing the worst case scenario of most intense rainfall, a family of IDF

Section 3: Rainfall Analysis
Page 36
curves for different regions, or the application of multiplying factors for various
regions;
(B) PUB and MSS should conduct an analysis of the percentage of total rainfall depth
that occurs as a fraction of total rainfall duration throughout the storm events, to
confirm anecdotal observations that many storms peak early in the event. Moving
forward, PUB may consider developing short duration design storm unit hyetographs
that can be used with 5-, 10-, 25-, 50- and 100-year return interval storm depths,
reflecting the temporal variability (skewness) in the rainfall patterns;
(C) Account for historical trends by periodically updating IDF curves, once every 10
years, if not sooner;
(D) Evaluate climate change projections for changing rainfall intensity and decide
whether more conservative IDF curves should be adopted based on projections for
2050 or 2100, given long service life of most conveyance infrastructure; and
(E) There is a need to establish a quantitative rainfall monitoring capability with high
temporal and spatial resolutions as well as high accuracy, and to study and
understand reason for the historical trends i.e. whether they are due to climate
change or urbanization.

Section 4: Drainage Design and Modelling
Page 37
Section 4: Drainage Design and Modelling
4.1 Evaluation of Current Drainage Design Approach
Code of Practice on Surface Water Drainage
4.1.1 The design of drainage systems in Singapore is subject to rules laid down in the Code
of Practice (COP) on Surface Water Drainage, which specifies the minimum engineering
requirements for surface water drainage for all developments. Requirements are in place to
ensure that all aspects of surface water drainage are effectively taken care of in the
Qualified Persons’ (QP) planning, design and implementation of the development proposals.
Examples of such requirements include the drainage design parameters such as the design
storm, run-off coefficient, etc, and the specification of minimum platform and reclamation
levels, as well as crest protection for buildings with basements. The Panel is of the view that
the requirements for minimum platform levels for all buildings and crest protection for
basement facilities are commendable practices in flood management and prevention.
Rational Method
4.1.2 Design of urban drainage systems in Singapore is traditionally based largely on the
Rational Method, which determines the peak runoff (Qpeak) generated from a catchment
during rain. The Rational Formula gives the peak design flow, in cubic metres per second, as:
Qpeak = �
��� C I A, where the design parameters are:
• C – Runoff coefficient, which relates to the proportion of rainfall that is translated
into runoff (ratio);
• I – Rainfall intensity for a specific duration (mm/hr); and
• A – Size of the catchment (ha).
In setting the design runoff coefficient, PUB adopts the weighted runoff coefficient of the
entire catchment, taking into account future land developments based URA’s Land Use
Master Plan, so as to allow for a more conservative runoff coefficient. The runoff
coefficients specified in the COP for the rational method are as shown in Table 4.1.
Table 4.1: Values of runoff coefficients stipulated in the Code of Practice on Surface Water
Drainage
Development Category C –value
Roads, highways, airport runways, paved up areas 1.00
Urban areas fully and closely built up 0.90
Residential/industrial areas densely built up 0.80
Residential/industrial areas not densely built up 0.65
Rural areas with fish ponds and vegetable gardens 0.45

Section 4: Drainage Design and Modelling
Page 38
4.1.3 The Panel noted that the URA’s Land Use Master Plan is regularly updated and, as
such, over the years, the projected run-off coefficient for a specific catchment is also likely
to change over time. For example, it was shared that the Stamford Canal was designed for
the ultimate run-off coefficient of 0.65 back in the 1980s. As at 2010, the actual weighted
run-off coefficient was found to be 0.62. However, based on URA’s Master Plan 2008, this is
expected to go up to 0.718.
4.1.4 It is recognised that the Rational Method is only suitable for site-level design of
drainage in smaller catchments (in the order of up to 100ha). For larger catchments, there is
a tendency for the Rational Method to underestimate the peak runoff, thus resulting in
undersized drains. Aggregating the C-values over a large catchment comprising of different
development profiles may also not accurately reflect the localised runoff profile of the
smaller sub-catchment. In addition, the coefficient values (as shown in Table 4.1) are often
based on research conducted in countries with moderate rainfall conditions. For countries
like Singapore with high intense rainfall, the fraction of rainfall that infiltrates into the
ground is less compared with other countries with less intense rainfall. For this reason it can
be assumed that surface runoff fractions in Singapore are higher than in the countries with
moderate rainfall conditions.
4.1.5 It is also noted that there have not been any comprehensive studies done in
Singapore to validate/assess the validity of the run-off coefficient value as stated in Table
4.1. While the Panel noted that PUB has done a validity check of these values against typical
actual developments that had been recently completed, these were based on a small
sample which may not be representative for all catchments. To this end, PUB may wish to
further refine the runoff coefficients and validate them based on actual land-use
characteristics and measured flows. This would include the comprehensive digital mapping
of impervious and pervious surfaces.
Recommendation 4A: The use of the Rational Method for drainage design should only be
retained for use in smaller catchments.
Recommendation 4B: Further research on runoff coefficients that should be applied under
Singapore’s storm conditions should also be undertaken.
Use of Modelling Tools
4.1.6 For larger catchments, the effects of storm water retention/ detention storage play
an important role. The Rational Method does not allow for a comprehensive analysis of the
impact of such designed storage in reducing peak flows. Such analysis requires a dynamic
simulation approach based on the use of hydrodynamic equations (e.g. the Saint Venant
8 Conclusions were based on PUB’s Report “Assessment on changes in the Run-off Coefficients in the Stamford
Canal Catchment,” which was shared with the Panel prior to the 2nd
Panel Meeting on 26th
to 30th
September
2011.

Section 4: Drainage Design and Modelling
Page 39
equations 9 ). A further limitation of the Rational Method is that the benefits from
introducing a wider range of intervention measures, such as Sustainable Urban Drainage
Systems [green roofs, localised detention storage, and other Active, Beautiful and Clean
(ABC) Waters design features] cannot be comprehensively analyzed.
4.1.7 The Panel noted that PUB had recognised the limitations of the Rational Method,
and, as such, had been using hydrodynamic computer modelling for the design of larger
drainage systems since the 1980s, using the MIKE11 software. However, as the estimation
of runoff from catchments was still based upon the use of the Rational Method, the
principal shortcomings of the Rational Method still apply, despite the fact that the
estimation of runoff was applied to smaller sub-catchments of the overall catchments.
Furthermore, due to the lack of actual on-site discharge measurements, the hydrodynamic
modelling has not been comprehensively validated by field measurements nor calibrated
adequately.
4.1.8 In recognition of the uncertainties from the drainage design process, Singapore
applies a free board of 15% of the channel depth in addition to the embankment level of
drainage channels based upon the design criteria. This practice is commonly applied and
deemed a practical approach to take into account the following effects:
• Uncertainties resulting from the computation of flood levels, i.e. uncertainties in
basic data used for the design and uncertainties resulting from the model
schematization and accuracy of simulations;
• Super-elevations caused by flow in bends;
• Wave run-up, where applicable;
• Sedimentation in channels;
• Bank erosion; and
• Ground settlement, which should be interpreted as the sum of embankment
compaction and underground soil subsidence.
4.1.9 The standard of 15% is, in practice, comparable with a 50 cm buffer applied in many
countries, derived as the sum of a 30 cm freeboard, complemented with a margin for some
other uncertainties. However, Singapore’s practice of a 15% freeboard is more appropriate
as it relates the freeboard to the depth of the drainage channel instead of making it a fixed
value regardless of the channel depth.
4.1.10 In practice there is no fixed relationship between the capacity of individual drainage
components (including any freeboard allowances), and the level of flood protection
achieved by the drainage system overall. This depends on local circumstances, and can only
be reliably determined using dynamic simulation models. PUB should, therefore, expand its
dynamic modelling approach in order to fully understand the performance of the drainage
9 Refers to 1-dimensional shallow water equations, which are a set of hyperbolic partial differential equations
that describe the flow below a pressure surface in a fluid (usually, but not necessarily, a free surface).

Section 4: Drainage Design and Modelling
Page 40
system, and to ensure the effectiveness of proposed interventions (see Section 5). A typical
dynamic modelling approach would comprise the following:
• Replication of historical rainfall events and associated flooding to ensure that the
modelling approach correctly represents observed system performance
(demonstration of fitness for purpose). For example the modelling must be able to
accurately reproduce the observed flood events in 2010 and 2011.
• Simulation of a range of storm situations using hypothetical rainfall events to test
the overall performance of the drainage system and determine the capacity of
individual drainage components. The rainfall events should be based on an
appropriate set of IDF curves. While the same IDF curves may be applied for entire
Singapore, based on historical records over the past 30 years, a multiplication factor
for different zones may be added to the IDF curves to account for historical spatial /
temporal variability in rainfall. Moreover, the IDF curve selected for the design
conditions may include the expected trend over the design period.
• Evaluation of the effectiveness of proposed interventions that are designed to
address deficiencies in drainage performance to achieve the desired performance
level. The evaluation should consider other factors that may affect drainage system
performance such as skewness and multiple peak storms, accumulation of debris
and sediment, and malfunctioning of hydraulic structures.
• Assessment and mapping of residual flood risk during extreme events.
4.1.11 It would also be useful to use dynamic modelling for smaller components of the
drainage systems, to improve the certainty of some of the assumptions and parameters. For
example, the distance between drop inlet chambers (DICs) could be re-examined based on
modelling results – for steep roads, storm water may just flow over some of the DICs during
extreme intense rains instead of flowing into the DICs. Through the dynamic simulation
modelling, the designs of the DICs and their spacing may be improved to address this
concern.
Recommendation 4C: For drainage modeling, PUB should move comprehensively to a
dynamic modeling approach in order to fully understand the drainage system
performance.
Interventions
4.1.12 PUB has traditionally focused on drainage conveyance solutions – either through
diversions, or deepening and widening of drains. Nonetheless, where appropriate, PUB has
also implemented other interventions such as compensatory storages (e.g. storm water
detention pond in Opera Estate) and road raising. However, so far, there is a lack of
systematic evaluation of these interventions (e.g. impact of road raising on surface flows)
using models.

Section 4: Drainage Design and Modelling
Page 41
4.1.13 Traditional design methods based on the Rational Method cannot properly evaluate
the potential of the full range of possible interventions. A full dynamic model of the
sewerage system is required to do this. Without this there will be an understandable
tendency to focus on solutions that involve increasing conveyance capacity or the diversion
of flow from one part of the system to another.
4.1.14 Going forward, it is recommended therefore that a full range of potential drainage
interventions, as set out more fully in Section 5, be systematically tested and evaluated
using integrated hydrological and hydraulic models, in order to arrive at an appropriate set
of drainage measures. It would also be useful to model the impacts of the interventions
during extreme events when the capacity of the drainage system is exceeded. For example,
apart from analysing the impact of road raising during typical storms, analysis could also be
done to determine if the roads can be used to actively channel flood waters away from
vulnerable areas when the drainage system is overwhelmed.
Recommendation 4D: A full range of potential interventions should be evaluated
systematically using dynamic modeling, and the impacts of the various interventions
during exceedance conditions should also be determined.
4.2 Evaluation of Drainage Design Standards
4.2.1 Current design standards for the drains in Singapore, even after the revisions
following the floods in 2010, are relatively low compared with other countries. The current
levels of protection for Singapore, which was recently implemented in the end of 2011, are
as shown in Table 4.2. For comparison, the standards for Hong Kong, UK and US are listed in
Table 4.3, 4.4 and 4.5 respectively.

Section 4: Drainage Design and Modelling
Page 42
Table 4.2: Design return period for drainage capacity applied in Singapore (based on
catchment size).
Area Served by Drainage System Design Return Period10
(years),
revised in Dec 2011
Catchment of 100 ha or less 10
Catchment of 100 to 1000 ha 25
Catchment with critical installations (e.g. airports, MRT
tunnels, etc.)
50
Catchments of more than 1000 ha or iconic catchments 50 – 100
Table 4.3: Design return periods based on flood levels applied in Hong Kong (including tidal
influence with suitable allowances for freeboard and sedimentation).
Land Use or Drainage Function Design Return Period (years)
Intensively used agricultural land 2-5 years
Village drainage including internal drainage
system under a polder scheme
10 years
Main rural catchment drainage channels 50 years
Urban drainage trunk systems 200 years
Urban drainage branch systems 50 years
Table 4.4: Design return periods for flood protection applied in UK.
Land Use or Drainage Function Design Return Period (years)
Urban drainage branch systems 30 years
Urban drainage trunk systems 30 years
Main river 100 years
National critical infrastructure 200 years
Table 4.5: Design return periods for drain capacity typically applied in US11.
Land Use or Drainage Function Design Return Period (years)
Residential areas, local drainage (up to 300 ha) 10-25 years
Commercial / industrial areas, regional systems
(300 – 1500 ha)
25 years
Important infrastructure, major drainage systems
(1500 – 2500 ha)
50 years
Critical infrastructure, major rivers (e.g. power plants,
major highways, water plants) (more than 2500ha)
100 years
10 Prior to the revisions to the Code of Practice in Dec 2011, all outlet drains and secondary drainage facilities
had a design return period of 5 years. The design return period for major rivers was 50-100 years, while
important installations/developments had a design return period of 50 years. 11
These standards vary across the US by local jurisdiction, generally as a function of rainfall intensity and risk
tolerance.

Section 4: Drainage Design and Modelling
Page 43
4.2.2 In many other countries, the allowable frequency of flooding is 1 in 100 years. Only
in the Netherlands are standards considerably higher, ranging from 1 in 1250 years for areas
adjacent to the main rivers, to 1 in 10,000 years for the economically more valuable areas
along the coast. Given the relatively low drainage design standards that have been adopted
in Singapore, it is recommended that PUB review the design storm return periods to ensure
their relevance and applicability12
.
Recommendation 4E: PUB should review its design storm return periods to ensure
relevance and applicability.
4.2.3 Drainage design standards are based upon schematized assumptions, such as
simplification of the spatial distribution of rainfall, symmetric temporal distribution of
rainfall during a storm event, availability of conveyance capacity, etc. There are many
reasons why there are deviations from ideal conditions used as the basis of design
standards, such as the disadvantageous effect of spatial rainfall distributions (e.g. June 2011
Orchard Road flood event), the effect of debris carried by the flows, and malfunctioning of
hydraulic structures. For these reasons, it is recommended that the performance criteria
used for design recognises the difference between the “ideal” circumstances assumed in
design, and the deviation from these that may occur in practice. Thus it may be prudent to
include some margin to allow for these factors within any proposed design standard.
4.3 Towards a Risk Based Approach in Flood Management
4.3.1 It is observed that while the design standards applied in Singapore are loosely
dependent on the impact of floods (with more stringent standards for larger catchments, in
recognition that flood damages would likely be higher in these catchments), the standards
do not explicitly take into account the damage that flooding may cause in terms of
economic loss as a function of flood depth, duration of flooding, flow velocities, damage to
assets flooded and other damages to the economy, such as interruption of traffic.
4.3.2 Given the above, there is scope for Singapore to formalise a risk-based approach in
its drainage design solutions and flood management, as it makes sense to relate the flood
protection level of various zones of Singapore to the damage that can occur when such
zones gets flooded. While PUB has incorporated some elements of a risk-based drainage
design and flood management approach, what PUB currently lacks is a systematic approach
to tackling flooding that reflects good practice elsewhere in the world. Many global cities
now address flooding using risk management methods. These have the advantage of
delivering more equitable and affordable solutions to flooding and can be a more cost
effective way of prioritising capital investment. They recognise the importance of both the
likelihood and consequences of floods, and the benefits of using a wider range of measures
12 Notwithstanding the comparison, the Panel noted that the drainage systems for each city may be designed
for different criteria based on local climate, ground (e.g. small island city-state vs cities with a large hinterland/
mountainous areas) and infrastructural considerations (e.g. underground piped drainage versus open canals
and boxed culverts).

Section 4: Drainage Design and Modelling
Page 44
to reduce flood risk. They avoid the potential of solving a flooding problem in one location
and creating flooding elsewhere.
Recommendation 4F: PUB to adopt a risk based approach to future flood management
and apply this approach across Singapore as a whole, and in a consistent manner.
4.3.3 Risk is defined as a combination of probability (likelihood) and consequence, thus:
Flood Risk = Probability of Flooding x Consequence of Flooding
4.3.4 Probability of flooding is usually defined by the probability of rainfall, the
assumption being that rainfall frequency is the same as flood frequency. Experience shows
that this is a reasonable assumption for urban areas. Rainfall probability is defined as the
annual probability of a particular rainfall amount being exceeded and is sometimes defined
by frequency, expressed as the “return period”, that is the period (in years) over which a
particular rainfall amount can be expected to be equalled or exceeded once on average (see
Sections 2 and 3).
4.3.5 Consequence is defined as the impact of flooding. This may be the direct cost of
flooding, such as damage to property or loss of business. This is known as tangible losses.
There can also be intangible losses, such as impact on reputation, or effects on health.
Sometimes intangible losses can be greater than tangible losses. As it can be time
consuming to calculate losses accurately, surrogates are often used to quantify
consequence. For example, the number of properties affected or the area flooded, though
these are less robust ways of defining consequence.
4.3.6 Figure 4-1 shows a typical risk matrix. This shows that high risk can occur either from
frequent floods that have relatively limited consequences (as the case of the 2010 and 2011
flood events in Singapore), or from rare floods that have great consequences (such as the
2005 flooding in New Orleans). A risk management approach to flooding helps to address
both ends of this spectrum. Risk may also be assessed on different scales. For example, a
single assessment of the risks of flooding could be determined across Singapore as a whole,
or it could be determined individually for a small local area.
Figure 4-1: Typical risk matrix of probability versus consequences.
Note that high risk may be caused by frequent low impact events or rare high impact events
High High High
High High
High
High
High
High
Med
Med
Med
Med
Med
Low
Low
Low
Low
Low
Low
Low
Low
Low
Med
Med
High
High
Low
Consequence Low
Probability

Section 4: Drainage Design and Modelling
Page 45
4.3.7 Whatever the capacity of a drainage system, there will come a time when an
extreme storm event will generate flows that exceed system capacity. Thus, consideration
must also be given to the management of flows during exceedance conditions. As such,
simulations should be accompanied by the production of flood maps to judge the extent of
flooding occurring under these extreme conditions. The flood maps would allow the residual
flood risk to be quantified, surface flood flows to be actively managed to reduce flood
impact, and the public informed of areas where the flooding may (albeit, rarely) occur. This
places an additional requirement of drainage system modelling. To determine the impact of
flooding, an assessment of the areal extent of flooding, together with associated depths and
velocities, is needed to quantify the impact. This requires the latest modelling tools and
considerable more topographical and system data than would be usual with more
traditional design approaches. The time to collect and assemble this data, together with the
additional cost, will need to be built into the planning of future drainage works.
Recommendation 4G: A risk-based framework towards flood management should be
formalized through dynamic modeling, including the assessment of the effects of extreme
events.
4.4 Development of the Modelling Approach
4.4.1 So far, PUB uses hydrodynamic simulation models to check details of the drainage
design, based upon discharges generated with the Rational Method. For instance, PUB uses
software (known as MIKE 1113) at the drainage design phase to improve on the preliminary
drainage design (obtained through the Rational Method) by modelling the adequacy of the
drain design against the design storm and/or actual known rainfall scenarios for the
catchment served by the drainage system. However, rather than basing drainage design on
discharges generated with the Rational Method, state-of-the-art simulation modelling these
days is based upon the use of more physically based rainfall-runoff simulations and more
detailed hydrodynamic modelling.
4.4.2 For the representation of the rainfall-runoff processes in the urban environment, it is
proposed that more physically based process modelling be introduced. Most important is
the representation of infiltration and surface runoff. Although it has to be realised that the
urban landscape is extremely non-uniform, with quick local variations in soil conditions,
terrain slope, blocking elements, such as fences etc., this approach has the advantage that
the runoff generated takes into account the effect of rainstorm intensity and the total rain
depth over a selected period. This allows for a more realistic description of the impact of
extreme rain storms, despite any residual shortcomings of the method and the complexity
of estimating model parameter values. These more physically based process descriptions
have been introduced in Singapore as part of the development of the operational
13 Specifically, the MIKE11 software is used to derive the expected water level profile in the drainage system by
computing the expected surface runoff quantities, based on various rainfall scenarios and conditions, against
the drainage design. The model is also used to do the preliminary scheming for new drainage network.

Section 4: Drainage Design and Modelling
Page 46
management of the Marina and Punggol-Serangoon reservoirs. Within the framework of the
Singapore Delft Water Alliance (SDWA), research is currently being conducted at the
National University of Singapore (NUS) in order to arrive at a better understanding of
rainfall-runoff processes in Singapore. This will greatly help the transition towards a more
robust approach to drainage system modelling.
Recommendation 4H: PUB should use a dynamic modelling approach to developing and
evaluating potential interventions for larger drainage areas. This would reflect current
practice elsewhere in the world. Through this approach, more robust solutions to existing
and future flooding problems can be developed.
4.4.3 In Singapore, hydrodynamic modelling is largely limited to 1-dimensional (1D)
schematizations or the description of flow just along drainage canals. Integrated 1D2D
modelling is only just being introduced to PUB. State-of-the-art modelling in many other
countries employs a combination of 1D and 2D schematizations, where the flow is allowed
to leave the channel bed and continue overland. This method has the advantage that the
flow is not limited to following paths predefined by the modeller as it allows the flow to
follow all possible paths opened up by the description of terrain levels. Terrain levels can
now be determined in significant detail using LIDAR technology, offering terrain level
accuracies of the order of 5 to 10 cm.
Recommendation 4I: Dynamic models should include integrated rainfall-runoff, 1D-
hydrodynamic and 2D-hydrodynamic model simulations so that the interactions between
below ground components and above ground flood conveyance can be properly
replicated.
4.4.4 An additional advantage of a 1D-2D model is the ease with which flood maps can be
generated, providing details of flood extent, flood depth, and duration of flooding of each
asset, and flow velocity fields. Unfortunately, LIDAR data is hard to find in Singapore. The
full advantage of integrated 1D2D modelling will require the contracting of LIDAR surveying
services.
Recommendation 4J: To support recommendation 4I, PUB should obtain reliable digital
elevation models based upon LIDAR surveying for all urban catchments in Singapore
4.4.5 PUB is currently using two modelling systems for hydrodynamic modelling: MIKE 11
from the Danish Hydraulic Institute (now DHI Water and Environment) in Denmark
(mentioned in Section 4.3.1) and SOBEK from Deltares, the Netherlands. Both modelling
systems have the ability to describe rainfall-runoff on the basis of infiltration and surface
runoff description. These systems also allow for the integrated 1D/ 2D hydrodynamic
modelling. In principle, there are several other modelling systems around the world that
offer similar functions.
4.4.6 The Panel noted that there is a lack of calibration of the hydrological and
hydrodynamic modelling used in Singapore. As such, efforts to calibrate the models used for

Section 4: Drainage Design and Modelling
Page 47
drainage simulations should be increased and be based also on field measured channel
discharges, and not just on water levels alone, in order to demonstrate that they are “fit-for-
purpose” (Figures 4-2 and 4-3). This would require a substantially increased effort in
monitoring channel discharges, including those at representative smaller channels, for the
calibration of the hydrological (rainfall-runoff) models. The same data will support
operational management of the reservoirs via the Operations Management System (OMS)
and enhance flood forecasting in Singapore.
Figure 4-2: Flow and depth monitor used for collecting data for model calibration and
verification. (Courtesy of MWH)
4.4.7 In summary, PUB should use integrated hydrological and hydraulic models in order
to undertake the following tasks:
• Generate flood maps (both current and future scenarios) to satisfy minimum
criteria;
• Determine the impact of new developments;
• Determine the effectiveness of possible interventions;
• Determine the risks associated with uncertainties in system performance,
extreme events, failures of components of the drainage system, etc.
Recommendation 4K: The efforts to calibrate models used for drainage simulations should
be increased and be based on field measured channel discharges, in order to demonstrate
that they are “fit-for-purpose”.
4.4.8 Monitoring of system performance has benefits beyond the calibration and
verification of drainage models. It can help to understand more fundamental aspects of the
hydraulic and hydrological processes. For example, it can help to provide more reliable run-
off coefficients, identify parts of the system with silt or debris that affects conveyance
performance, and improve estimates of surface roughness in conduits. Monitoring systems

Section 4: Drainage Design and Modelling
Page 48
also provide real time data for use in forecasting and active flood risk management (see
Section 6).
Recommendation 4L: PUB should maximize the benefit of data collected by monitoring
systems to better understand system performance and support real-time interventions for
active flood risk management.
Figure 4-3: Comparison between measured (coloured block) and modelled (yellow line)
performance used in validating a drainage system model. (Courtesy of MWH)
4.5 Recommendations
4.5.1 A summary of the key recommendations on PUB’s drainage design and modelling
approaches is as follows:
(A) The use the Rational Method for drainage design should only be retained for use in
smaller catchments;
(B) Further research on runoff coefficients that should be applied under Singapore’s
storm conditions should also be undertaken;
(C) For drainage modelling, PUB should move comprehensively to a dynamic modelling
approach in order to fully understand the drainage system performance;

Section 4: Drainage Design and Modelling
Page 49
(D) A full range of potential interventions should be evaluated systematically using
dynamic modeling, and the impacts of the various interventions during exceedance
conditions should also be determined;
(E) PUB should review its design storm return periods to ensure relevance and
applicability;
(F) PUB to adopt a risk based approach to future flood management and apply this
approach across Singapore as a whole, and in a consistent manner;
(G) A risk-based framework towards flood management should be formalized through
dynamic modeling, including the assessment of the effects of extreme events.
(H) PUB should use a dynamic modelling approach to developing and evaluating
potential interventions for larger drainage areas. This would reflect current practice
elsewhere in the world. Through this approach, more robust solutions to existing and
future flooding problems can be developed.
(I) Dynamic models should include integrated rainfall-runoff, 1D-hydrodynamic and 2D-
hydrodynamic model simulations so that the interactions between below ground
components and above ground flood conveyance can be properly replicated
(J) To support recommendation 4I, PUB should obtain reliable digital elevation models
based upon LIDAR surveying for all urban catchments in Singapore
(K) The efforts to calibrate models used for drainage simulations should be increased
and be based on field measured channel discharges, in order to demonstrate that
they are “fit-for-purpose”.
(L) PUB should maximize the benefit of data collected by monitoring systems to better
understand system performance and support real-time interventions for active flood
risk management.
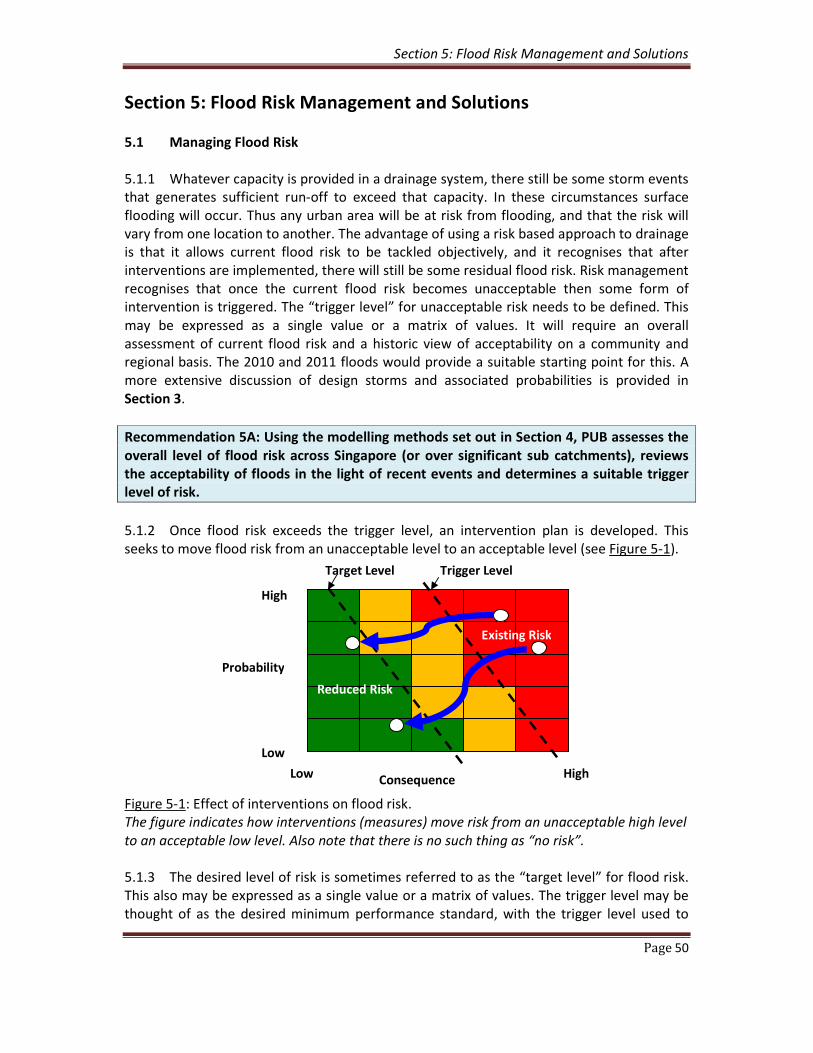
Section 5: Flood Risk Management and Solutions
Page 50
Section 5: Flood Risk Management and Solutions
5.1 Managing Flood Risk
5.1.1 Whatever capacity is provided in a drainage system, there still be some storm events
that generates sufficient run-off to exceed that capacity. In these circumstances surface
flooding will occur. Thus any urban area will be at risk from flooding, and that the risk will
vary from one location to another. The advantage of using a risk based approach to drainage
is that it allows current flood risk to be tackled objectively, and it recognises that after
interventions are implemented, there will still be some residual flood risk. Risk management
recognises that once the current flood risk becomes unacceptable then some form of
intervention is triggered. The “trigger level” for unacceptable risk needs to be defined. This
may be expressed as a single value or a matrix of values. It will require an overall
assessment of current flood risk and a historic view of acceptability on a community and
regional basis. The 2010 and 2011 floods would provide a suitable starting point for this. A
more extensive discussion of design storms and associated probabilities is provided in
Section 3.
Recommendation 5A: Using the modelling methods set out in Section 4, PUB assesses the
overall level of flood risk across Singapore (or over significant sub catchments), reviews
the acceptability of floods in the light of recent events and determines a suitable trigger
level of risk.
5.1.2 Once flood risk exceeds the trigger level, an intervention plan is developed. This
seeks to move flood risk from an unacceptable level to an acceptable level (see Figure 5-1).
Figure 5-1: Effect of interventions on flood risk.
The figure indicates how interventions (measures) move risk from an unacceptable high level
to an acceptable low level. Also note that there is no such thing as “no risk”.
5.1.3 The desired level of risk is sometimes referred to as the “target level” for flood risk.
This also may be expressed as a single value or a matrix of values. The trigger level may be
thought of as the desired minimum performance standard, with the trigger level used to
High
High
Low
Consequence Low
Probability
Trigger Level Target Level
Existing Risk
Reduced Risk
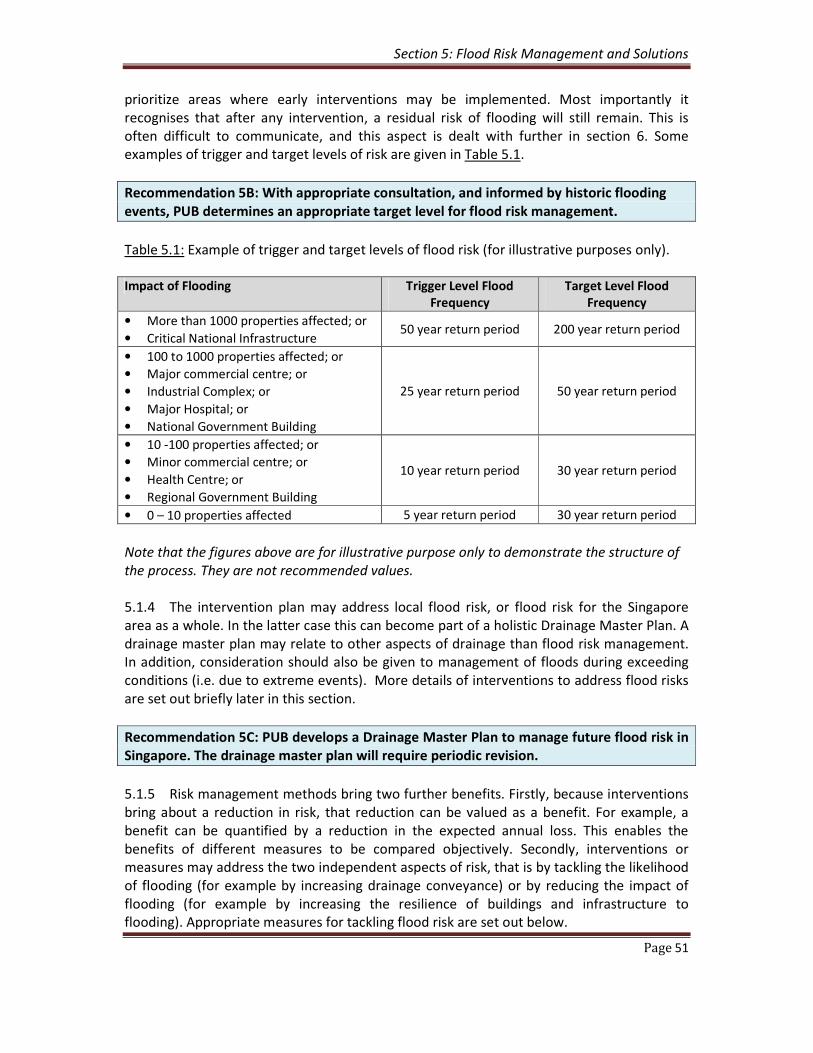
Section 5: Flood Risk Management and Solutions
Page 51
prioritize areas where early interventions may be implemented. Most importantly it
recognises that after any intervention, a residual risk of flooding will still remain. This is
often difficult to communicate, and this aspect is dealt with further in section 6. Some
examples of trigger and target levels of risk are given in Table 5.1.
Recommendation 5B: With appropriate consultation, and informed by historic flooding
events, PUB determines an appropriate target level for flood risk management.
Table 5.1: Example of trigger and target levels of flood risk (for illustrative purposes only).
Impact of Flooding Trigger Level Flood
Frequency
Target Level Flood
Frequency
• More than 1000 properties affected; or
• Critical National Infrastructure 50 year return period 200 year return period
• 100 to 1000 properties affected; or
• Major commercial centre; or
• Industrial Complex; or
• Major Hospital; or
• National Government Building
25 year return period 50 year return period
• 10 -100 properties affected; or
• Minor commercial centre; or
• Health Centre; or
• Regional Government Building
10 year return period 30 year return period
• 0 – 10 properties affected 5 year return period 30 year return period
Note that the figures above are for illustrative purpose only to demonstrate the structure of
the process. They are not recommended values.
5.1.4 The intervention plan may address local flood risk, or flood risk for the Singapore
area as a whole. In the latter case this can become part of a holistic Drainage Master Plan. A
drainage master plan may relate to other aspects of drainage than flood risk management.
In addition, consideration should also be given to management of floods during exceeding
conditions (i.e. due to extreme events). More details of interventions to address flood risks
are set out briefly later in this section.
Recommendation 5C: PUB develops a Drainage Master Plan to manage future flood risk in
Singapore. The drainage master plan will require periodic revision.
5.1.5 Risk management methods bring two further benefits. Firstly, because interventions
bring about a reduction in risk, that reduction can be valued as a benefit. For example, a
benefit can be quantified by a reduction in the expected annual loss. This enables the
benefits of different measures to be compared objectively. Secondly, interventions or
measures may address the two independent aspects of risk, that is by tackling the likelihood
of flooding (for example by increasing drainage conveyance) or by reducing the impact of
flooding (for example by increasing the resilience of buildings and infrastructure to
flooding). Appropriate measures for tackling flood risk are set out below.

Section 5: Flood Risk Management and Solutions
Page 52
5.2 Measures to Address Flood Risk
5.2.1 In common with many cities in the developed world, Singapore is drained by a
system of channels, pipes and canals that convey storm water to the sea and reservoirs.
Wastewater is collected and conveyed to treatment works in a separate piped wastewater
collection system. Historically the storm drainage system has been designed to convey flow
from a particular rainfall amount (intensity and duration), as set out in Section 4. Inevitably
there will come a time where rainfall is so intense that it exceeds the capacity of the
drainage system, and flooding occurs. As explained in Section 2, this is what happened
during the floods of 2010 and 2011. Traditionally this flooding has been managed by
providing additional conveyance capacity (by enlarging major channel sections, for example
along the Bukit Timah Canal) and/or by transferring flows from an overloaded part of the
system to another part of the system that can safely accept the additional flow (again as
seen with the First and Second Diversion Canals branching off from the Bukit Timah canal to
the Sungei Ulu Pandan and Kallang River respectively).
5.2.2 These measures aim to address the likelihood of flooding. They are sometimes
known as pathway measures since they control the pathway over which the storm water
travels. The capacity of the pathway is increased so that storm water is contained within the
drainage conduits and flooding is prevented. But pathway improvements are not the only
measures that can also be used. Storm water can also be controlled at source (where the
rain falls onto the ground) and at the receptors. Receptors are the parts of the urban fabric
that are impacted when flooding occurs. A holistic “source/pathway/receptor” approach to
managing flood risk delivers a wider range of potentially more cost effective measures.
Experience shows that implementing a range of measures is usually better than
concentrating on one approach only. Source measures deal mostly with the likelihood of
flooding. Pathway measures can influence both the likelihood and consequences of
flooding, whereas receptor measures deal mainly with flood consequences.
5.3 Source Control Measures
5.3.1 Source control measures seek to compensate for the effects of urbanisation by
mimicking natural drainage processes. When areas are paved, ground infiltration is
interrupted, surface storage is removed and the speed of runoff is increased. This leads to a
significant increase in both the quantity of run-off and the peak of the hydrograph during
storm events. However these effects can be mitigated. Infiltration can be reinstated by
using pervious surfacing and permeable pavements. Examples of pervious surfacing in US
and Europe have shown that high intensity rainfall can be infiltrated successfully into the
ground provided the natural ground infiltration is sufficient. In the USA, green roads are
implemented to reduce surface runoff (Figure 5.2). Alternatively run-off from impervious
surfaces can be diverted onto ponds to collect storm run-off from new developments
(Figure 5-3) or into natural ground. In Portland, Oregon, USA, a successful programme of
roof rainwater disconnection was delivered by incentivising property owners through a
reduction in water charges. In Delft, in the Netherlands, a storage basin was constructed
underneath a park, to collect storm run-off from adjacent properties, and the storm water
was used for recharging an aquifer (Figure 5-4). Storage of rainfall on the roof of buildings
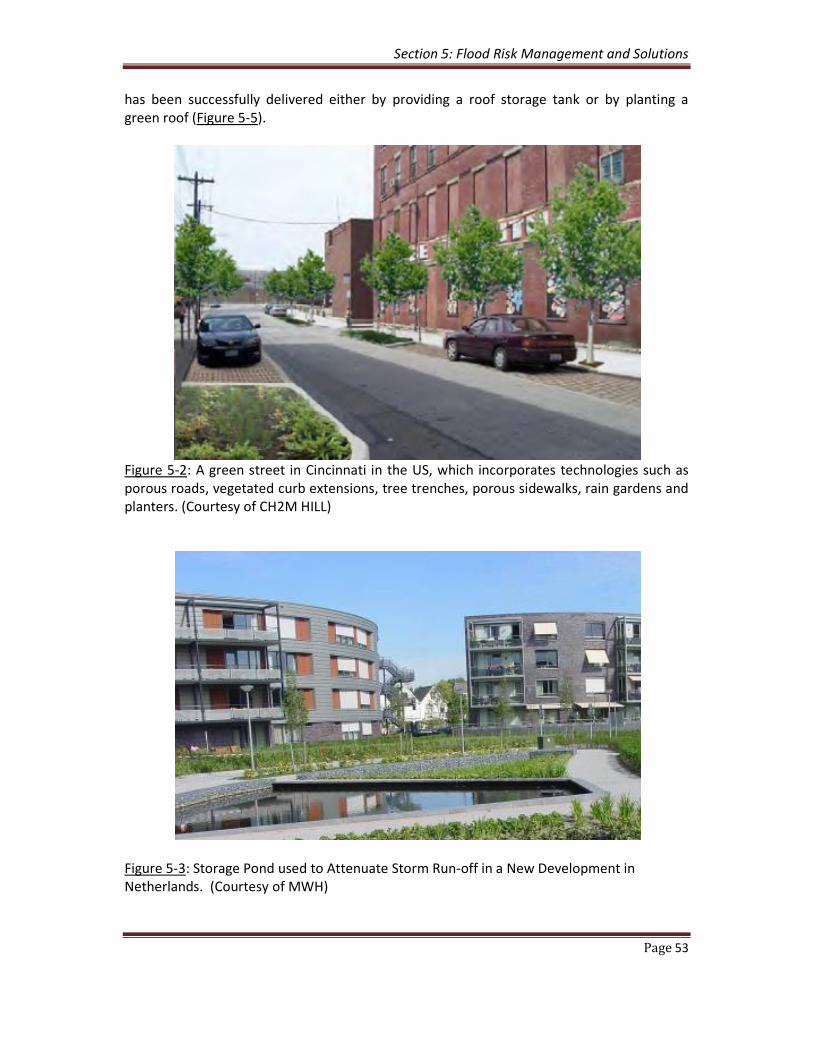
Section 5: Flood Risk Management and Solutions
Page 53
has been successfully delivered either by providing a roof storage tank or by planting a
green roof (Figure 5-5).
Figure 5-2: A green street in Cincinnati in the US, which incorporates technologies such as
porous roads, vegetated curb extensions, tree trenches, porous sidewalks, rain gardens and
planters. (Courtesy of CH2M HILL)
Figure 5-3: Storage Pond used to Attenuate Storm Run-off in a New Development in
Netherlands. (Courtesy of MWH)

Section 5: Flood Risk Management and Solutions
Page 54
Figure 5-4: Retrofit Infiltration Basin in Delft, the Netherlands.
The basin is designed to intercept run-off from the roofs of local buildings. The water is
stored in the tank and then drained slowly through a borehole to recharge a groundwater
aquifer. (Courtesy of MWH)
Figure 5-5: Green Roof Retrofitted to Existing Municipal Building in Malmo, Sweden.
The vegetation consists of heathers planted in a fibrous earth. It is designed to be both
lightweight and water absorbent.
5.3.2 Storm water run-off from road and other ground surfaces can be successfully stored
by creating rain gardens. These can vary in size from small road side gardens to deal with
highway run-off, to larger areas associated with car parks and large building plots. Figure 5-6
shows an example of a rain garden in Singapore.

Section 5: Flood Risk Management and Solutions
Page 55
Figure 5-6: A rain garden in Balam Private Estate, Singapore
5.3.3 Experience elsewhere in the world shows that source control on its own is unlikely to
deliver sufficient reduction in flood risk, but when used with other measures it makes an
important and cost-effective contribution. At the very least it can mitigate the effects of
paving over natural surfaces. However, Singapore suffers from higher rainfall intensities
than some other developed countries, and has a different social and economic structure. In
addition, land area for development is limited, so that source control measures that use
significant land areas are less likely to be useful. Thus, measures that may be successful
elsewhere may not be translatable into the Singapore context.
5.3.4 Notwithstanding the above, the panel recognises that the impact of continued
urbanisation and future impacts of climate change will eventually put a strain on the existing
drainage system. In some cities, there is wide-scale retrofitting of source control to manage
storm water runoff. While PUB already takes into account future land developments when
designing drains, land use plans could change. There are currently no requirements to
mitigate the adverse effects of further urbanisation. Furthermore, while the adoption of
ABC Waters concept is useful in managing surface runoff, its benefits may be limited due to
lack of land for large scale implementation. It is therefore recommended that guidelines to
regulate new and redevelopment projects be developed, for example, to make provisions
for compulsory compensatory storage so as to mitigate adverse effects of further
urbanization. Given that flash floods typically occur due to the intensities of rainfall for
short periods, the provisions for compulsory compensatory storage or other forms of runoff
delays would also help even out the impact of rainfall intensities.

Section 5: Flood Risk Management and Solutions
Page 56
Recommendations 5D: Guidelines to regulate new and redevelopment projects should be
developed to make provisions for source control measures (such as compulsory
compensatory storage) so that run off is limited down to at least that from the “green
field” site. Also, the appropriateness of different source control measures for application
in a Singapore setting should be reviewed and tested, and pilot/demonstration projects
progressed in order to give guidance to developers and designers. PUB should further
evaluate the potential of retrofitting source control measures through a GIS evaluation of
drainage areas and simulation in drainage network models as part of its drainage master
planning.
5.3.5 Source control can also deliver a range of other benefits. Most source control
measures will retain and treat pollutants from surface run-off, thus improving the quality of
water discharged into waterways. This could be important in Singapore as storm water is an
important water resource. By adding to the storage created in source control (for example,
in roof storage tanks) a local supply of water could be made available for secondary use, say
for toilet flushing or vehicle washing. Every litre of storm water stored and used in this way
will be one litre less that has to be drained downstream, collected, treated and then
pumped back upstream for use, with all the associated energy, carbon and resource costs
that entails.
5.3.6 By creating more vegetation, public amenities and bio-diversity in the immediate
area is often improved. The presence of more surface water in urban areas can also help
manage the urban heat island effect. This could become particularly important with global
warming.
Recommendation 5E: In delivering source control measures PUB seeks to maximise the
multiple benefits that source control can deliver.
5.4 Pathway Measures: Drainage Systems
5.4.1 Pathway measures are applied to the existing drainage system and consist of the
following categories:
• Increasing conveyance capacity
• Flow transfer, from one part of the system to another
• Strategic storage
5.4.2 Increasing conveyance capacity is a measure that is well practiced in Singapore. By
careful forward planning of drainage systems, PUB has wisely set aside land in the form of
drainage reserves for future capacity enhancement and has protected this land from
development. Thus key sections of the drainage network can be increased in capacity
without the disruption that could be expected in other cities. Nevertheless, increasing
system capacity is still an expensive measure because upsizing of conduit dimensions would
be difficult, costly and disruptive due to the unavailability of land in which to build. It may
Section 5: Flood Risk Management and Solutions
Page 57
also transfer excess flow downstream where capacity has yet to be expanded, thus creating
further flooding problems.
5.4.3 PUB has relied on the Rational Method to determine future capacity requirements
(see Section 4). Modern drainage practice elsewhere would normally use a drainage
simulation model to determine and evaluate appropriate system upgrading works. This was
discussed further in Section 4 and recommendations are made there as to how PUB should
adapt to using drainage simulation models for flood risk management. With such tools PUB
will be better able to:
• Identify sections of the drainage system where capacity is limited. It is unusual for
whole sections of drainage to lack capacity. What is more normal is to find “pinch
points” caused by local obstructions. An example of this would be the culverted road
crossings on the Bukit Timah canal. Addressing the capacity issues of local pinch
points is likely to be more cost-effective than extensive upsizing. Potential measures
to reduce surface friction and removing any obstructions to improve hydraulic
capacity can be investigated. For example, it would not be appropriate to upsize the
whole length of the Stamford Canal to address the flood risk in the Orchard Road
area, though some upsizing may be justified to remove local hydraulic restrictions.
• Better identify the potential for flow transfer. This is because simulation models will
show which parts of the drainage system are overloaded and which may have spare
capacity. This situation may change during storm events due to the spatial variability
of rainfall. It is most important to understand this effect. Understanding existing
system behaviour has been shown to be of primary importance in managing the
current flood risk in Central London.
• Identify and quantify the potential for strategic storage. PUB has already identified
this as an important potential measure. Providing significant additional storage
volume in Singapore will be difficult due to the scarcity and cost of suitable land, but
has been successfully achieved in the Opera Estate area (through the use of
underground storage pond in conjunction with a dual use sports field). Modelling will
help to ensure the correct location and proper sizing of any proposed storage tanks.
• Understand the potential for real time control. In large urban drainage systems it is
unusual for every conduit to reach capacity at the same point in time. This is
particularly true in catchments with spatially varying rainfall (as in Singapore). Thus it
is sometimes possible to balance flows between an over-loaded part of the system
and an under-loaded part, thus achieving a higher level of flood protection than
otherwise would be possible. This is known as real time control. A prerequisite of
real time control systems is the availability of a robust calibrated drainage simulation
model and system wide flow and rainfall measurement. Radar rainfall predictions are
an added advantage as they allow system performance to be predicted with longer
lead times (although the particular features of the local Singapore climate make
radar rainfall predictions less certain than in other parts of the world).
It is not possible to say at this stage whether or not real time control offers a robust

Section 5: Flood Risk Management and Solutions
Page 58
opportunity for Singapore. This can only be determined once dynamic drainage
system modelling has been progressed. Nevertheless it may have some potential and
its evaluation should be part of future drainage strategy.
Recommendation 5F: PUB should use drainage system simulation to evaluate the
reduction in flood risk delivered by future measures, including, but not limited to, increase
of conveyance capacity, removal of local conveyance bottlenecks, flow transfer to
neighbouring catchments, the construction of additional storage volume and other ways
to delay runoff. When proposing storage solutions, the location and sizing of tanks should
be defined precisely by testing in the drainage network model. Drainage pathway
solutions should be considered along with other measures. PUB should also use drainage
system simulation to evaluate the potential for real time control.
5.4.4 The capacity of drainage systems can be severely restricted by the accumulation of
sediments. PUB has in place a regular maintenance regime for its major drainage conduits.
Nevertheless, it may still be possible that the accumulation of debris, particularly at poorly
designed trash screens, may inhibit conveyance. As mentioned in Section 2, there is some
indication that debris and sediment accumulation in local drains may have been an
aggravating factor during the flooding in 2011.
Recommendation 5G: PUB should review evidence from the 2010 and 2011 floods, and its
maintenance procedures, to determine what changes (if any) may be necessary to ensure
that the capacity of its drainage system is fully available to convey storm water during an
intense rainstorm event, and that the capacity is not inhibited by the accumulation of
sediment or debris that may be washed into the drainage system during that event.
Recommendation 5H: A simulation model of the existing drainage system should be used
to determine the conveyance capacity of existing conduits and identify pinch points which
if removed would significantly improve drainage capacity without adversely affecting the
system performance downstream.
5.5 Pathway Measures: Surface Flood Paths
5.5.1 Whatever the capacity of a drainage system, there will become a time when, due to
the severity of the storm event, the capacity of the drainage system is exceeded. It is a
characteristic of piped and culverted drainage systems that the transition from below
ground conveyance to surface flooding is sudden. Thus when surface flooding occurs it
tends to be unmanaged. This can lead to indiscriminate flooding and unnecessary loss.
Surface flood water will flow downhill and accumulate in low spots. The assessment of the
2002 Glasgow flood accurately documented the progression of flood water through an
urban area, and much has been learnt from this. There has been little effective progress
globally on managing this effect however. This is largely because surface flooding only
occurs rarely, in well drained urban areas. Yet its effects can be substantial, as
demonstrated in the 2007 floods in England and Wales, and the 2010 and 2011 floods in
Singapore.
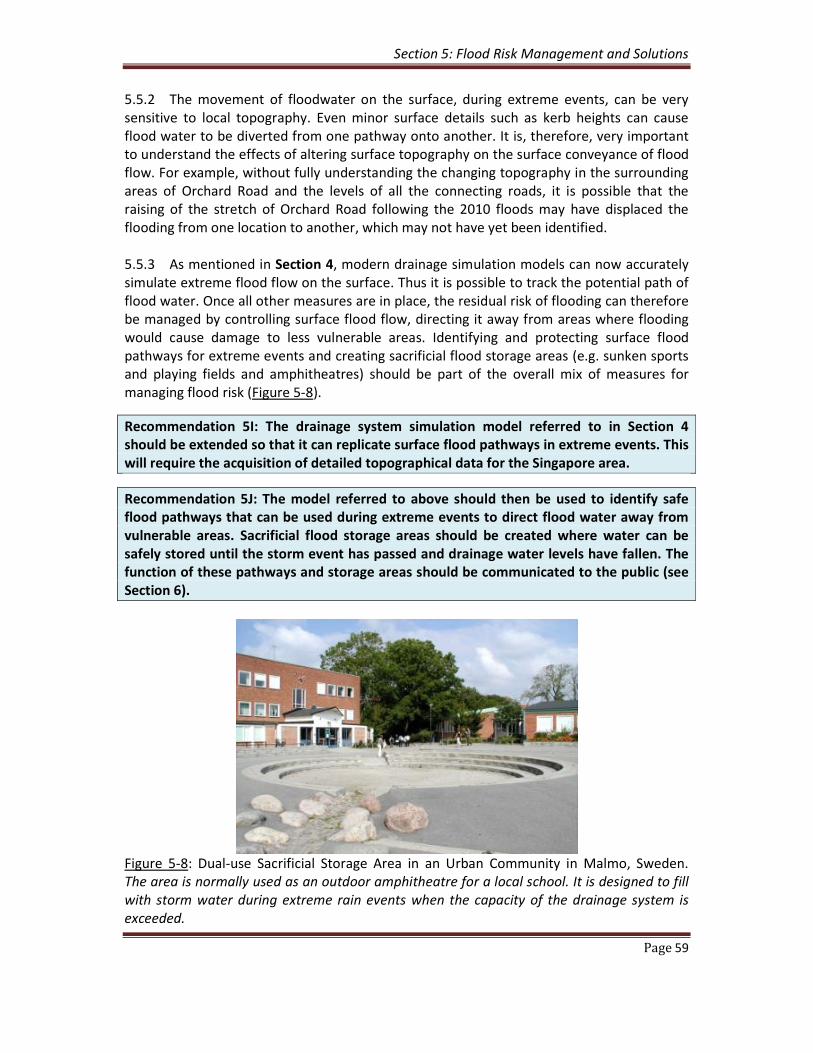
Section 5: Flood Risk Management and Solutions
Page 59
5.5.2 The movement of floodwater on the surface, during extreme events, can be very
sensitive to local topography. Even minor surface details such as kerb heights can cause
flood water to be diverted from one pathway onto another. It is, therefore, very important
to understand the effects of altering surface topography on the surface conveyance of flood
flow. For example, without fully understanding the changing topography in the surrounding
areas of Orchard Road and the levels of all the connecting roads, it is possible that the
raising of the stretch of Orchard Road following the 2010 floods may have displaced the
flooding from one location to another, which may not have yet been identified.
5.5.3 As mentioned in Section 4, modern drainage simulation models can now accurately
simulate extreme flood flow on the surface. Thus it is possible to track the potential path of
flood water. Once all other measures are in place, the residual risk of flooding can therefore
be managed by controlling surface flood flow, directing it away from areas where flooding
would cause damage to less vulnerable areas. Identifying and protecting surface flood
pathways for extreme events and creating sacrificial flood storage areas (e.g. sunken sports
and playing fields and amphitheatres) should be part of the overall mix of measures for
managing flood risk (Figure 5-8).
Recommendation 5I: The drainage system simulation model referred to in Section 4
should be extended so that it can replicate surface flood pathways in extreme events. This
will require the acquisition of detailed topographical data for the Singapore area.
Recommendation 5J: The model referred to above should then be used to identify safe
flood pathways that can be used during extreme events to direct flood water away from
vulnerable areas. Sacrificial flood storage areas should be created where water can be
safely stored until the storm event has passed and drainage water levels have fallen. The
function of these pathways and storage areas should be communicated to the public (see
Section 6).
Figure 5-8: Dual-use Sacrificial Storage Area in an Urban Community in Malmo, Sweden.
The area is normally used as an outdoor amphitheatre for a local school. It is designed to fill
with storm water during extreme rain events when the capacity of the drainage system is
exceeded.

Section 5: Flood Risk Management and Solutions
Page 60
5.6 Receptor Measures
5.6.1 A strong element of flood risk management in Singapore has been to protect
developments from flooding by raising ground levels. Thus, controlling minimum
reclamation levels and minimum platform and crest levels for new development are
important parts of the measures used in Singapore, and the Panel noted the requirements
have recently been updated (Table 5.2).
5.6.2 Evidence from the 2011 floods demonstrates the effectiveness of Singapore’s policy
on minimum development levels. There are no records of flooding of new shopping malls
along Orchard Road, where threshold levels are raised above the level of the surrounding
ground. The effectiveness of designing a minimum access level to the Singapore metro is
illustrated by the fact that the MRT service continued uninterrupted during the 2010 and
2011 floods.
Table 5.2: Example of Singapore’s minimum platform levels for general development.
Current Proposed Rationale
The minimum platform level
shall not be lower than:
• 750mm above the highest
tide level in the vicinity;
− 102.5mRL for Southern
coast;
− 102.8mRL for NE coast;
− 103.1mRL for NW
coast;
• The adjacent ground level;
• 300 mm above the highest
recorded flood level;
• Any other level as may be
specified by the PUB;
whichever is highest
The minimum platform level
shall not be lower than:
• 103.5mRL for
developments along the
southern coast;
• 104.0mRL for
developments along the
northern coast;
• 300mm above the adjacent
road/ ground level;
• 600mm above the highest
recorded flood level;
• Any other level as may be
specified by the PUB;
whichever is highest
• To provide additional
safeguards against sea
level rise due to climate
change (currently, these
platform levels are approx
0.5m below the
reclamation levels. The
same difference between
the proposed MPL and MRL
is maintained)
• To provide additional
safeguards against flooding
due to incidental chokages,
subsidence of the roads,
etc;
• To provide additional
safeguards against floods.
5.6.3 Following the 2011 floods, various local flood barriers have been fitted to premises
along Orchard Road (Figure 5.9). Such measures can be effective at managing flood risk.
They do require, however, effective cooperation of local property owners and good flood
forecast information. These aspects are discussed further in Section 6. Overall there is
evidence of good practice in using receptor measures in Singapore.
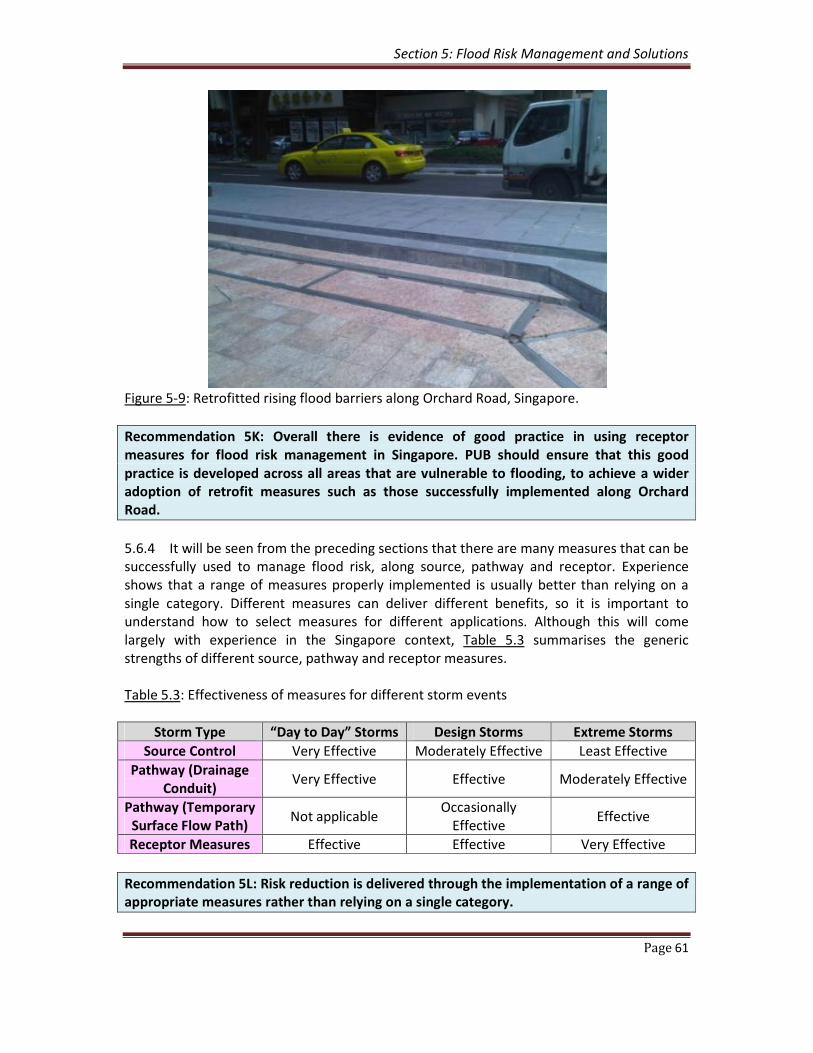
Section 5: Flood Risk Management and Solutions
Page 61
Figure 5-9: Retrofitted rising flood barriers along Orchard Road, Singapore.
Recommendation 5K: Overall there is evidence of good practice in using receptor
measures for flood risk management in Singapore. PUB should ensure that this good
practice is developed across all areas that are vulnerable to flooding, to achieve a wider
adoption of retrofit measures such as those successfully implemented along Orchard
Road.
5.6.4 It will be seen from the preceding sections that there are many measures that can be
successfully used to manage flood risk, along source, pathway and receptor. Experience
shows that a range of measures properly implemented is usually better than relying on a
single category. Different measures can deliver different benefits, so it is important to
understand how to select measures for different applications. Although this will come
largely with experience in the Singapore context, Table 5.3 summarises the generic
strengths of different source, pathway and receptor measures.
Table 5.3: Effectiveness of measures for different storm events
Storm Type “Day to Day” Storms Design Storms Extreme Storms
Source Control Very Effective Moderately Effective Least Effective
Pathway (Drainage
Conduit) Very Effective Effective Moderately Effective
Pathway (Temporary
Surface Flow Path) Not applicable
Occasionally
Effective Effective
Receptor Measures Effective Effective Very Effective
Recommendation 5L: Risk reduction is delivered through the implementation of a range of
appropriate measures rather than relying on a single category.

Section 5: Flood Risk Management and Solutions
Page 62
5.6.5 Experience elsewhere in the world shows that initially the implementation of source,
pathway and receptor measures has been driven by flood risk management, but once the
benefits of water quality control, amenity and biodiversity have been appreciated, then the
value from and enthusiasm for their use has risen appreciably. Singapore faces significant
future challenges from climate change, including sea level rise, increased storminess, and
rising temperatures. There will be growing pressures on water resources, and energy costs
will also rise significantly. Many of the source, pathway and receptor measures mentioned
above can also make a significant contribution to tackling these challenges, and this is a
further reason for making every effort to maximise their use.
Recommendations 5M: In implementing flood risk management measures, Singapore
strives to realise the maximum benefits to help address the many future environmental,
social and economic challenges that it faces.
5.7 Protection of Coastal Areas against tidal floods
5.7.1 Much of the development in Singapore is along the coastal fringe with significant
areas reclaimed from the sea. Thus there is a significant risk of tidal flooding to many of
these areas. The traditional approach to managing flood risk from tidal effects has been to
raise local platform levels. This has proved to be very effective, particularly as PUB has
recently revised its standards to account for potential future sea level rise (see Table 5.2).
This approach also avoids the need for wholesale construction of sea defences. However,
the approach is less useful when dealing with existing vulnerable areas that have not
benefitted from raised platform levels.
5.7.2 The Marina Barrage is a good example of coastal defence, since it protects the low
lying land areas immediately upstream from flooding due to high tides. It also creates a
fresh water reservoir for water supply and has important amenity benefits for Singapore’s
downtown and business areas. By careful design, the barrage does not appear to add
significantly to the risk of flooding in upstream drainage areas (see Section 2).
5.7.3 Despite this there are still some low lying coastal areas in Singapore, particularly
along the eastern coast, that do not benefit either from coastal defence measures or
platform raising. These will continue to be vulnerable to flooding, especially due to a
combination of high tide, storm surge and catchment run-off. Note that the same general
type of weather pattern that creates intense rainfall also can also create storm surges at
sea.
5.7.4 As part of drainage master planning, PUB should pay particular attention to these
areas and review the appropriateness of fitting local receptor measures to manage flood
risk in areas that will not benefit from platform raising or coastal defence works in the
future.

Section 5: Flood Risk Management and Solutions
Page 63
Recommendation 5N: As part of drainage master planning, PUB should pay particular
attention to low lying un-protected coastal areas and develop appropriate strategies for
retrofitting local receptor measures.
5.8 Adapting to Future Uncertainty
5.8.1 The world faces considerable future uncertainty due to a number of global
megatrends which include:
• Climate change
• Extreme storms
• Extended droughts
• Water scarcity
• Land scarcity
• Rising energy costs
• Population growth
5.8.2 In determining options for future interventions, PUB should account for the potential
impacts caused by these trends. Ideally, measures implemented in the short term should
not compromise future needs. It should not be necessary to undo measures implemented
now, at a future date. This approach is sometimes referred to as a “no regrets” approach.
5.8.3 A “no regrets” approach involves implementing schemes that share a number of
common features, which include:
• Flexible measures that can easily be adapted if future events prove to be different
from predicted. An example of this may be to build a storage facility of a particular
size but secure the space to expand it at the initial stage.
• Measures that would not be compromised by megatrends, for example avoiding
those that involve high energy use.
• Measures that deliver multiple benefits, particularly where they might address
megatrends. For example, localised storm water storage that might provide a source
of water for local use.
• Measures that can be delivered in stages over a period of time.
5.8.4 To support this, PUB will need to regularly review design parameters, progressively
enhance its modelling and monitoring capabilities, and check the adequacy and
performance of Singapore drainage systems as part of a master planning process.
Recommendation 5O: PUB should plan for the potential consequences of global
megatrends and ensure that long term drainage solutions do not compromise Singapore’s
capacity to respond to their impacts.
Section 5: Flood Risk Management and Solutions
Page 64
5.9 Conclusions
5.9.1 There are many examples of good drainage practice in Singapore. When reviewing
the floods of 2010 and 2011 it is important to set them in the context of the progressive
improvement to flood risk management over the years that has resulted in a long period
free from significant flooding prior to 2010. PUB appears to have all the necessary skills and
capability to develop its drainage area planning to meet the considerable challenges of the
future. However its focus on a traditional conveyance and transfer approach has prevented
it from taking a more systematic risk based approach to flooding. This in turn has limited the
range of measures it has used to manage flood risk.
5.9.2 The previous sections set out how PUB might move forward to implement a range of
flood risk management measures that will be more flexible in dealing with future
uncertainty, and which have the potential to deliver multiple benefits. It is important that
flood risk management is not tackled in isolation, but becomes an integrated part of
meeting Singapore’s future development needs overall.
5.10 Recommendations
5.10.1 The following recommendations are summarised from previous sub-sections:
(A) Using the modelling methods set out in Section 4, PUB assesses the overall level of
flood risk across Singapore (or over a significant sub catchment), reviews the
acceptability of floods in the light of recent events and determines a suitable trigger
level of risk;
(B) With appropriate consultation, and informed by historic flooding events, PUB
determines an appropriate target level for flood risk management;
(C) PUB develops a Drainage Master Plan to manage future flood risk in Singapore. The
drainage master plan will require periodic revision;
(D) Guidelines to regulate new and redevelopment projects should be developed to
make provisions for source control measures (such as compulsory compensatory
storage) so that run off is limited down to at least that from the “green field” site.
Also, the appropriateness of different source control measures for application in a
Singapore setting should be reviewed and tested, and pilot/demonstration projects
progressed in order to give guidance to developers and designers. PUB should
further evaluate the potential of retrofitting source control measures through a GIS
evaluation of drainage areas and simulation in drainage network models as part of
its drainage master planning;
(E) In delivering source control measures PUB seeks to maximise the multiple benefits
that source control can deliver;

Section 5: Flood Risk Management and Solutions
Page 65
(F) PUB should use drainage system simulation to evaluate the reduction in flood risk
delivered by future measures, including, but not limited to, increase of conveyance
capacity, removal of local conveyance bottlenecks, flow transfer to neighbouring
catchments, the construction of additional storage volume and other ways to delay
runoff. When proposing storage solutions, the location and sizing of tanks should be
defined precisely by testing in the drainage network model. Drainage pathway
solutions should be considered along with other measures. PUB should also use
drainage system simulation to evaluate the potential for real-time control;
(G) PUB should review evidence from the 2010 and 2011 floods, and its maintenance
procedures to determine what changes (if any) may be necessary to ensure that the
capacity of its drainage system is fully available to convey storm water during an
intense rainstorm event, and that the capacity is not inhibited by the accumulation
of sediment or debris that may be washed off during that event;
(H) A simulation model of the existing drainage system should be used to determine the
conveyance capacity of existing conduits and identify pinch points which if removed
would significantly improve drainage capacity without adversely affecting the system
performance downstream;
(I) The drainage system simulation model referred to in Section 4 should be extended
so that it can replicate surface flood pathways in extreme events. This will require
the acquisition of detailed topographical data for the Singapore area;
(J) The model referred to above should then be used to identify safe flood pathways
that can be used during extreme events to direct flood water away from vulnerable
areas. Sacrificial flood storage areas should be created where water can be safely
stored until the storm event has passed and drainage water levels have fallen. The
function of these pathways and storage areas should be communicated to the
public;
(K) Overall there is evidence of good practice in using receptor measures for flood risk
management in Singapore. PUB should ensure that this good practice is developed
across all areas that are vulnerable to flooding, to achieve a wider adoption of
retrofit measures such as those successfully implemented along Orchard Road;
(L) Risk reduction is delivered through the implementation of a range of appropriate
measures rather than relying on a single category. In implementing flood risk
management measures, Singapore strives to realise the maximum benefits to help
address the many future environmental, social and economic challenges that it
faces;
(M) In implementing flood risk management measures, Singapore strives to realise the
maximum benefits to help address the many future environmental, social and
economic challenges that it faces;

Section 5: Flood Risk Management and Solutions
Page 66
(N) As part of drainage master planning, PUB should pay particular attention to low lying
un-protected coastal areas and develop appropriate strategies for retrofitting local
receptor measures; and
(O) PUB should plan for the potential consequences of global megatrends and ensure
that long term drainage solutions do not compromise Singapore’s capacity to
respond to their impacts.

Section 6: Enhance Public Resilience towards Floods
Page 67
SECTION 6: Enhance Public Resilience towards Floods
6.1 PUB’s Public Communications Efforts and Challenges in Flood Management
6.1.1 The flood events of 2010 and 2011 along Orchard Road and other parts of Singapore
have affected the public’s perception of PUB’s drainage and flood management approaches
over the years. This was despite PUB’s efforts in effectively reducing the size of flood-prone
areas in Singapore from over 3,200 hectares in 1970s, to 49 hectares today. The panel
considered this achievement significant in a rapidly urbanized Singapore.
6.1.2 The Panel noted (in Section 2) the insurance claims arising from the floods and that
the intangible costs, such as damages to Singapore’s reputation, loss of business
opportunities/ investments, public trust in the government and PUB, etc., have not been
quantified. The Panel also noted that PUB had taken immediate actions since 2011 to assist
affected building owners, shop owners and residents, as well as help to protect building
entrances and basements by providing sandbags and technical advice. Follow up actions had
also been taken to ensure that buildings deemed to be at-risk installed flood barriers, as
well as to accelerate some of its drainage improvement projects.
6.1.3 Following the flood incidents in 2010, PUB had convened an Inter-Agency Drainage
Review Committee (IADRC), comprising representatives from various public agencies (URA,
BCA, NParks, SLA, JTC, LTA, HDB and NEA) to review the drainage design requirements for
effective drainage and flood management, and implemented changes to the drainage design
parameters so as to provide better safeguards against floods. The work of the IADRC
concluded with a report in December 2010, which was peer reviewed by an independent
panel, and the recommendations by the Committee were subsequently incorporated into
PUB’s Code of Practice on Surface Water Drainage, as well as its on-going drainage
improvement projects.
6.1.4 The Panel noted the significant efforts taken by PUB to readily convey information
on floods to the public. These included publishing the list of flood prone areas online,
creating a “Managing Flood Risk” micro-site on its corporate website, with links to its water
level sensor information, flood alerts and advisories, among others. The Panel also noted
PUB’s community relations efforts of working with the Grassroots, residents, building
management committees and professional bodies to share on its drainage design and flood
management approaches.
6.1.5 The Panel also noted that the 5 June 2011 floods led to greater public outcry. PUB’s
response after the 2010 floods and the good work done over the past year, were not
remembered. It was evident that public tolerance of flooding had decreased with time.
Their expectation of a flood-free Singapore had been encouraged by PUB’s achievement in
the reduction of the number of flood prone areas in Singapore. Responses and views were
also rapidly disseminated through mobile phones, and Internet. Social media had posed
significant challenges to the way PUB shares information with the public.

Section 6: Enhance Public Resilience towards Floods
Page 68
6.2 Public Education and Publicity Efforts on Floods
6.2.1 Following the 2010 and 2011 events, PUB had adopted a significantly more proactive
approach in sharing information on flood incidents and protection measures, as well as
communicating its flood management efforts. In the case of a heavy rainstorm event
resulting in floods, PUB will inform the public on the locations affected and the severity of
each incident via radio broadcasts, real-time updates on PUB’s Facebook and Twitter
accounts, and its corporate website. For serious flooding incidents, PUB will also issue press
releases and arrange for media briefings. The Panel noted that PUB strives to do its utmost
to keep the public informed before, during and after the flood, as well as work with the
media on feature articles to increase public awareness on PUB’s flood management efforts.
Some of the recent examples include PUB’s stepped-up drainage maintenance work (e.g.
inspection, cleansing) to ensure drains are free flowing, on-going drainage improvement
projects and the use of closed circuit televisions to improve flood monitoring.
6.2.2 While the Panel acknowledged PUB’s public education and publicity efforts thus far,
it is proposed that such efforts be strategically streamlined so as to provide clear objectives
and deliverables. Specifically, PUB may wish to consider enhancing its programme based on
the following considerations:
(a) Promoting Public Understanding and Appreciation of PUB’s Drainage Improvement
Plans: PUB should develop programmes that allow the public to better appreciate
its drainage design philosophy and flood management approaches. To this end, PUB
may provide comprehensive documentation of the following:
(i) Successes in reducing flood prone areas over the years;
(ii) Perspectives on the impact and frequency of past flood events viz-a-viz
current floods, based on actual events;
(iii) Challenges in developing the drainage infrastructure in Singapore, such as
competing land use requirements, high density developments, etc; and
(iv) Added benefits of drains on Singapore’s overall development, which includes
enhancing its water quality, introducing biodiversity and improved aesthetic
value to the living environment.
(b) Enhancing Public Awareness: Expectations of a flood-free Singapore is misplaced as
a majority of the drainage system of Singapore was designed for a 5-year return
period rainfall event. With increasing annual rainfall and increasing rainfall intensity
in the last 30 years, the number of flooding each year can be expected to go up and
not down. Notwithstanding the newly adopted higher design return period in the
Code Practice on Surface Water Drainage, flooding is still expected when the
designed capacity of the drainage system is exceeded.

Section 6: Enhance Public Resilience towards Floods
Page 69
(c) Enhancing Public Preparedness: PUB and its contractors cannot solve the problems
that will come with flooding on their own. The public must be engaged to help
reduce flood risks and be more prepared for dealing with floods. For example, the
public can help put in place comprehensive flood response and recovery plans,
install their own local flood protection barriers at basement/ property entrances,
and respond to media broadcasts on weather, floods and traffic conditions. In
addition, the public can also contribute by providing feedback to PUB should they
spot any flooding incident or blockages in drains.
(d) Public Response during heavy rains: Clear guidance should be provided to the
public during heavy storms. These include avoiding flood prone and flooded areas,
activation of and conducting checks on their flood protection measures, report
observations on the flood situation and blockages in the drainage systems to the
PUB’s hotline, provide feedback on flooded areas, including photos and video
footages where possible, and help to disseminate flood advisories to relatives,
friends and others within their community. The Panel noted that PUB’s online flood
advisories and brochures on flood management (which were disseminated to the
grassroots) are positive steps in this direction.
Recommendation 6A: PUB should develop and implement a strategic public outreach
programme to publicise and educate the general public proactively on its drainage plans
and flood management approaches so as to enhance public awareness and preparedness
towards floods.
6.2.3 In rolling out its public outreach programme, PUB may wish to consider launching an
education programme on floods to as many targeted segments of the community as
possible. The publicity can also be carried out through various platforms, e.g. information
packs, publicity pamphlets, public signages, roving exhibitions, site visits to drainage and
flood management facilities, information centres and operational facilities. The Panel noted
that PUB has already rolled out its public outreach on flood alerts through various new
media such Twitter and Facebook, as well as text alerts and iPhone Applications. In addition,
PUB could also leverage on its existing galleries, such as the Marina Barrage Gallery and
NEWater Visitor’s Centre, and even the ENV Gallery, to spread the message of effective
drainage and flood management approaches.
6.2.4 The Panel also holds the view that the media is a strategic partner in conveying key
messages with regard to drainage design and flood management. To this end, maintaining a
close relationship with the media is critical. The Panel noted that PUB already engages the
media through regular tea sessions with its Chief Executive, media releases and press
briefings. Specifically on drainage and floods, PUB could consider arranging for media
interviews / talk shows with key officers to promote the positive work that has been done
over the years in successfully reducing Singapore’s flood prone areas, as well as to highlight
the various challenges of drainage design and flood management in Singapore. Also, PUB
should continue to proactively engage the media before, during and after a heavy rainstorm
or flood incidents. For example:

Section 6: Enhance Public Resilience towards Floods
Page 70
(a) Before the onset of the monsoon seasons, PUB should continue to conduct media
briefings so as to alert the public of flood risks and enhance their preparedness.
(b) Following a heavy rain storm event, PUB should proactively inform the media on
whether floods have occurred, where and how severe the floods were, and what are
the possible causes and actions that needed to be taken.
(c) In the case of a serious flooding incident, a Media Briefing should be held to provide
the possible cause of flash flood, as well as the actions being/ would be taken. These
would help to minimise speculation and assure the public that the situation is under
control.
Recommendation 6B: The flood publicity and public education programme should reach
out to as many targeted segments of the community as possible (e.g. grassroots, schools,
community groups), and through a wide range of avenues (e.g. publicity pamphlets, info
pack, signage, roving exhibitions, etc). PUB should also develop a close working
relationship with the Media.
6.2.5 Such initiatives should be properly documented as a standard operating procedure
for public communications and engagement, so as to ensure consistency and disciplined
approach in managing flood events and public responses.
6.3 Observations from PUB’s Past Public Education and Engagement Initiatives
6.3.1 The Panel also noted the past successes of PUB’s campaigns and public education
initiatives. In particular, the Panel noted the following excellent examples:
(a) Water Conservation Campaigns, which was a sustained effort that started since the
1970s, with a comprehensive Water Conservation Plan first drawn up in 1981 to set
out Singapore’s water conservation strategy, as water demand continued to outpace
population growth. The plan adopted three key approaches of managing water
demand through (i) Pricing, (ii) Mandatory Requirements, and (iii) Continual Public
Education. This effort is still on-going, despite PUB’s achievements in ensuring
adequate water supply under its 4 Taps strategy, as water conservation continue to
be relevant today.
(b) Promotion of NEWater to encourage direct substitution by industries and
commercial premises, and to introduce it as an indirect potable water supply to the
general population. The Panel noted that Singapore was able to achieve large-scale
public acceptance of NEWater – which essentially is recycled used water – at an
unprecedented level compared with that in other developed and developing
countries. This was only possible through strong political leadership, supported by
extensive media engagement and publicity on the safety of the NEWater. As part of
the public engagement efforts, PUB also carried out surveys to assess public

Section 6: Enhance Public Resilience towards Floods
Page 71
acceptance of NEWater and conducted public education campaigns in schools,
community centres and workplaces. The Bedok NEWater Visitor Centre was also
launched in 2003 for visitors to learn about the NEWater technology and view the
production of NEWater first hand.
(c) Active, Beautiful and Clean (ABC) Waters Programme is an ambitious proposal that
aims to turn Singapore’s utilitarian drains and canals into aesthetic waterways and
bodies that enhances Singapore’s living environment by introducing aesthetic
features, recreational spaces alongside the functional purpose on cleansing the
stormwater runoff that ends up in reservoirs via the drainage network. Such
ambitious projects required active participation from various stakeholders from the
public, private and people sectors. To this end, PUB proactively conducted roving
exhibitions, demonstration projects, workshops and seminars to educate the general
public and People sectors. PUB also worked closely with the Public sector to set up
an Inter-Agency Working Committee to coordinate the implementation of the ABC
Waters Programme, worked with the Private sector to develop the ABC Waters
Guidelines, facilitated “Green Mark” points as well as set up the ABC Waters Review
Panel comprising top local architects, engineers and developers to review the ABC
Waters Master plan on an ad hoc basis.
These are best practices which can be replicated for Singapore’s drainage and flood
management strategies and approaches moving forward.
Recommendation 6C: PUB could leverage its previous successful experiences in public
education and engagement and replicate them to help the public better understand the
importance of Singapore’s drainage systems and flood management strategies.
6.4 Public Engagement on Drainage Projects
6.4.1 Public engagement is an important aspect of dealing with situations that requires
active participation from stakeholders. While PUB may roll out information packs, guidelines
and advisories, the various stakeholders need to internalize the concerns so that they can
also do their part to contribute positively. To this end, PUB may wish to consider having a
more inclusive public engagement strategy that involves regular consultations with the
public, professional bodies and other stakeholders, to seek their feedback and views on
drainage projects.
6.4.2 The Panel noted that PUB has put in place a comprehensive drainage master plan as
well as a rolling 5-year drainage improvement and development plan. To better engage
stakeholders, it is proposed that PUB explore a more inclusive public engagement strategy.
Broadly, PUB could conduct regular consultations to seek feedback and views on drainage
projects from the public, professional bodies and other key stakeholders. These
consultations may take various forms such as project briefings, focus group meetings and
discussions, site visits, etc, with the objective of providing opportunities to obtain their
views and comments on the design of the drainage solutions and construction

Section 6: Enhance Public Resilience towards Floods
Page 72
arrangements. For the general public, PUB may also consider setting up dedicated hotlines
for the specific projects, for the public to call and make enquiries on works schedules or
lodge their feedback during the construction stage.
6.4.3 At the same time, PUB may also consider engaging the public based on the specific
project types, as follows:
(a) For projects with significant public impacts, to engage the public through timely
education and information dissemination: This may be achieved through the
issuance of timely newsletters, setting up web sites, organizing exhibitions and
arranging meet-the-public sessions so as to establish more communication channels
to explain the objectives and scope for the projects. Such platforms will also allow
PUB to rally the public’s understanding and support for the projects as well as
elaborate on the mitigation measures that would be put in place during the
construction stage. Concurrently, opinions and feedback from the public can also be
sought to further improve on the design of the drainage solutions and construction
arrangements.
(b) For major projects with strategic and national significance, to engage public
through active participation in the planning and delivery of the projects: PUB may
consider introducing active public participation through focus group discussions prior
to the project implementation, including defining the objectives and scope of the
projects. In doing so, it will acknowledge equal standing for the public in setting the
agenda, the proposed project options and shaping the implementation approaches
and policies. PUB should ensure that the final project details incorporate the views
from the public, while balancing the interests of key stakeholders. At the same time,
PUB must also provide the necessary technical information and professional advice
so that both the public and stakeholders are able to come to an informed decision
together.
Recommendation 6D: PUB to develop an inclusive Public Engagement Strategy involving
stakeholders on drainage projects which has varying degrees of public impact, as well as
strategic and national significance.
6.4.4 The Panel noted that, in the case of the Orchard Road floods and the possible
improvement to the Stamford Canal, the public had been forthcoming in providing possible
suggestions on how the drainage system can be enhanced. These suggestions include:-
Suggestion Rationale Assessment
1 Storm water
retention/
detention ponds
These ponds may take various
forms (e.g. underground/
above-ground, centralised/
decentralised, etc) to store
excess stormwater upstream.
The ponds can also double up
The retention/ detention pond
concept is indeed a practical
approach for the management of
storm water flows at both
“source” and “receptor” (see
Section 5). The Panel also noted

Section 6: Enhance Public Resilience towards Floods
Page 73
Suggestion Rationale Assessment
for other purposes during dry
weather (e.g. fields)
that PUB has already
implemented such a system at
Opera Estate and is already
considering the same approach
for the upstream catchment of
the Stamford Canal.
2 Drainage pumps
and siphon
drainage
These systems may help to
increase the flow rates in the
drains, especially at bottleneck
in the system.
The suggestion is innovative and
may be considered for specific
locations along a closed drainage
network where the installation
of such pumps is feasible, and
where the downstream capacity
of the drain is able to cope with
the accelerated flow. This may
also be applicable for localised
areas where the internal
drainage network is isolated.
3 Underground
deep tunnels
These deep tunnels can take in
the storm water overflows from
the surface drains and help to
prevent floods.
The suggestion is technically
feasible, but may come at a
relatively high cost. Given
Singapore’s high premium for
land (surface and underground),
it may be prudent to synergise
the use of these underground
tunnels with other national
objectives (e.g. “harvesting”
flood waters to augment water
supply)
4 Diversion canals These canals can divert excess
storm waters to the drainage
systems in the adjacent
catchments (e.g. channel excess
storm water from Marina
catchment to MacRitchie
Reservoir/Lower Peirce
Reservoirs.)
The Panel noted that PUB has
already implemented such
measures for the Bukit Timah
Catchment, and will be looking
into the feasibility of diverting
the flows from the upper
Stamford Canal Catchment to
the Singapore River (see Section
5). Receiving drainage systems
would have to be able to cope
with the increased flow.
5 Porous
pavements
The use of perforated material
in urban roads, pavements and
plazas will help to absorb and
reduce surface run-off.
This suggestion is pragmatic and
is also recommended by the
Panel as a possible solution to
control storm water at source
(see Section 5).

Section 6: Enhance Public Resilience towards Floods
Page 74
Suggestion Rationale Assessment
6 Other suggestions include the concept of using
roads as flood plains, cloud seeding to forestall
against excessive cloud build-up, and the use of
regulation valves in canals to regulate water flow.
The Panel noted the
innovativeness of these
suggestions and acknowledge
their feasibility on a case-by-
case, subject to their cost-
effectiveness and the specific
site conditions (see Section 5).
6.4.5 The above suggestions should be publicised and PUB to consider the feasibility of
each suggestion seriously, including conducting pilot projects to assess the viability of such
suggestions. Where applicable, PUB should also publicise the adaptation and
implementation of some of the suggested solutions (e.g. storm water storage/ retention/
detention tanks, diversion canals, etc) to highlight PUB’s sincerity in gathering public opinion
and applying them if deemed relevant. At the same time, should some suggestions be
deemed impractical, PUB should make the effort to explain the reasons for not
implementing them.
Recommendation 6E: Feedback, views and suggestions from the public should be
publicised wherever possible, so as to acknowledge their contributions and develop
improved rapport.
6.5 Proactive Flood Management and Preparation
6.5.1 The Panel noted that PUB’s OMS is able to simulate past flood events and conduct
scenario analysis on the Marina Catchment based on previous rainfall patterns (via its
SOBEK modelling). In order to improve its monitoring capabilities, PUB will be increasing the
number of flow gauges from 45 to 64 by the end of February 2012. At the same time, the
Panel also noted that the OMS presently does not have the capability to generate accurate
flood risk maps due to the lack of high resolution digital elevation maps (DEMs).
Notwithstanding, these tools provide significant promise as PUB develops its Flood Early
Warning System (FEWS) that will facilitate a more proactive flood management and
preparedness strategies.
6.5.2 As highlighted in Section 4, there is the need for PUB to continually improve on its
drainage and flood modelling capabilities to pre-empt possible flood risks and identify areas
which are likely to be affected by floods. While such capabilities will allow PUB to enhance
its flood preparedness as well as identify gaps in its drainage design, they also serve as
useful basis to prepare for the operational aspects of flood management and prepare the
ground ahead of an impending flood event.
6.5.3 Flood risk maps are useful tools in identifying the extent of floods under different
rainfall scenarios. These maps may be considered for public release, although the Panel also
noted that there are concerns that the release of such flood risk maps will not be welcomed
by developers and homeowners as they may impact property prices and insurance
Section 6: Enhance Public Resilience towards Floods
Page 75
premiums within flood prone areas. Alternatively, the flood risk maps may be kept internal
but serve as a guide for PUB to develop its flood management approaches, through a risk-
based assessment of the likely outcomes and actions to be taken. For example, by
understanding the areas which are at risk of floods, PUB may be able to identify suitable
routing of the flood waters into safe areas such as open fields and parks during extreme
events. The maps will also provide useful basis on the types of advisories that PUB can issue
to motorists and people living / travelling in / to flood-risk areas. During an impending flood
event, the maps will also serve to assist in the deployment of PUB’s resources (e.g. duty
officers, contractors, machinery, pumps, etc). Through such efforts, the community will be
more informed and assured that necessary measures had been taken to reduce and manage
the flood risks.
Recommendation 6F: To develop a proactive Flood Management and Preparation Strategy
that involves the generation of Flood Risk Maps, enhanced flood modelling and prediction
capabilities with real-time flood risk mapping, and mitigation measures to minimise the
impact of flood on public facilities and infrastructures.
6.5.4 Even as PUB strengthens its “hardware,” effective flood management also requires
significant skills in managing the “heartware” of its people through enhancing the softer
skills of public communications. To this end, PUB may consider identifying training courses
for its frontline officers dealing with flood management and engaging affected parties to
enhance their presentation skills, media interview techniques, etc, so that they can
communicate with the public, media, professional bodies and other stakeholders in a
professional and convincing manner. Such training should be made compulsory for the more
senior policy-makers and engineers in PUB, NEA-MSS and MEWR. It will also be useful for
PUB to study the public engagement efforts undertaken in other countries which may also
be applied to Singapore.
Recommendation 6G: To enhance internal staff’s public communications skills through
professional courses in Public Relations, Media Engagement and Presentation skills.
6.6 Warning Systems and Public Response
6.6.1 The Panel noted that PUB actively provides timely updates to the public on flood
related information for early preparedness, through joint media briefings with MSS prior to
the monsoon seasons, updating its “Managing Flash Floods” micro-site, etc, so as to provide
the public ample time to take necessary precautions. PUB also receives heavy rain warning
alerts from NEA and informs the public through its Facebook and Twitter account, and has
implemented a water level information system which is available online, as well as alert
subscribers of rising water level in key drains and canals via SMS. Currently, PUB has 93
water level sensors around Singapore and will increase the number of sensors to 150 by the
end of 2011. PUB and NEA has, since Aug 2011, jointly launched the Integrated Heavy Rain
and Water Level Alert Service, which the public can subscribe to for free. Following this
announcement, the number of subscribers to the Water Level Alert Service increased from
about 800 in June 2011 to about 2,100 subscribers in November 2011.

Section 6: Enhance Public Resilience towards Floods
Page 76
6.6.2 PUB could consider developing a colour-coded FEWS based on the level of certainty
of a flood event happening and the corresponding advisories. One such system has been
implemented in Hong Kong by the Hong Kong Observatory14
, which serves as the basis for
the Hong Kong Drainage Services Department in its flood management response. In the case
of Singapore, the triggering of the warning system can be based on the recorded heavy
rainfall at reference rain gauges, or predicted heavy rainfall based on MSS’ radar images.
Colour codes can be tied to the severity of the warnings.
6.6.3 The alerts can also be structured to be released in phases. For example:
(a) The first warning signal will provide alerts on potential heavy rain that may develop
into more severe warning signal situations. Under such situation, there is the
likelihood of floods in some low-lying, poorly drained areas, and as such, PUB and
the relevant public agencies (e.g. transport operators, etc) should be on alert.
(b) More severe warning signals will alert the public of heavy rain which are likely to
bring about serious road flooding and traffic congestion. Once issued, the warning
signals should be broadcasted over radio, television, internet and PUB/MSS’
websites. The public will also be provided with advice on the appropriate actions to
take and stay tuned to media announcements for the latest information so as to
ensure their safety.
Recommendation 6H: To enhance existing public alert warning systems to alert the public
and government agencies of heavy rainstorms which may affect Singapore, and establish a
state of readiness within the public and essential services to deal with emergencies.
6.6.4 The Panel noted that there still exist flood prone areas within Singapore that is not
likely to be eliminated in the near term and subject to future development plans. In the
short term, for these areas, PUB may wish to consider developing and operating targeted,
location-based flood warning systems to alert concerned residents of potential floods and
ensure adequate state of readiness to deal with the floods. Automated gauging stations
could also be installed to monitor real-time water level and flow in these areas and provide
enhanced warnings to residents through automated phone calls, text alerts, etc. These
signals could also be used to activate PUB’s dedicated liaison officers for these areas, and
14 The Hong Kong Observatory operates the Rainstorm Warning System (RWS) in Hong Kong. Under the system,
there are three levels of warning: Amber, Red and Black. Amber warnings are issued when heavy rain
exceeding 30 mm in an hour is expected to fall generally over Hong Kong or has fallen and is likely to continue.
Red and Black warnings correspond to actual or predicted rainfall of 50 mm and 70 mm in an hour respectively.
The activation of RWS is based on the recorded or forecasted rainfall at 108 reference rain gauges over the
territory of Hong Kong. In general, if any 15 rain gauges out of the 108 reference rain gauges have recorded or
forecast rainfall amount of 30 mm, 50 mm or 70 mm in one running hour, the respective alert will be triggered.
The warning will be deactivated at once after falling below the threshold. The colour coded system will also
help to manage public expectations in the event of a false alarm. The warnings could be broadcast over the
radio, television and the internet.
Section 6: Enhance Public Resilience towards Floods
Page 77
action plans developed and enforced to combat the impending floods. This may be
extended nation-wide over the longer term.
Recommendation 6I: To consider piloting location-based Flood Warning Systems and
additional monitoring equipment for the flood prone areas as a first step towards a
nation-wide system.
6.6.5 The Panel noted that PUB presently has a public hotline. However, the hotline is not
manned on a 24-hour basis. In view of rising uncertainties in weather patterns, particularly
during the monsoon seasons, PUB may wish to consider setting up a dedicated 24-hr
Drainage Hotline to handle public complaints and feedback on drainage and flood matters.
The hotline should be publicised for public to provide feedback on flood incidents, blockages
in drains, etc. Specifically during the monsoon seasons, PUB may plan ahead and mobilize
sufficient resources to combat flood risks during heavy storms. In addition, PUB should
continue monitoring the flood situation from its Flood Emergency Control Centre, and direct
resources in an integrated manner.
Recommendation 6J: To set up a 24-hour Drainage Hotline to handle public complaints
and feedback on drainage and flood matters.
6.6.6 PUB’s flood operations should also be supported by clear action plans that draw the
necessary resources required to combat floods in the flood prone and low-lying areas. The
Action Plan should include the distribution of flood advisories to all residents in the flood
prone areas, assessing the community’s vulnerability and how to better manage and recover
from the impacts of floods for these areas with fewer resources. Businesses in these areas
should also be encouraged to develop and share flood response and recovery plans.
Recommendation 6K: To establish and rehearse active flood risk management and
recovery plans
6.7 Recommendations
6.7.1 A summary of the key recommendations to enhance the public’s resilience and
preparedness towards floods are as follows:
(A) PUB should develop and implement a strategic public outreach programme to
publicise and educate the general public proactively on its drainage plans and flood
management approaches so as to enhance public awareness and preparedness
towards floods;
(B) The flood publicity and public education programme should reach out to as many
targeted segments of the community as possible (e.g. grassroots, schools,
community groups), and through a wide range of avenues (e.g. publicity pamphlets,
info pack, signages, roving exhibitions, etc). PUB should also develop a close working
relationship with the Media;

Section 6: Enhance Public Resilience towards Floods
Page 78
(C) PUB could leverage its previous successful experiences in public education and
engagement and replicate them to help the public better understand the importance
of Singapore’s drainage systems and flood management strategies;
(D) PUB to develop inclusive Public Engagement Strategy involving stakeholders on
drainage projects which has varying degrees of public impact, as well as strategic and
national significance;
(E) Feedback, views and suggestions from the public should be publicised wherever
possible, so as to acknowledge their contributions and develop improved rapport;
(F) To develop a proactive Flood Management and Preparation Strategy that involves
the generation of Flood Risk Maps, enhanced flood modelling and prediction
capabilities with real-time flood risk mapping, and mitigation measures to minimise
the impact of flood on public facilities and infrastructures;
(G) To enhance internal staff’s public communications skills through professional
courses in Public Relations, Media Engagement and Presentation skills;
(H) To enhance existing public alert warning systems to alert the public and government
agencies of heavy rainstorms which may affect Singapore, and establish a state of
readiness within the public and essential services to deal with emergencies;
(I) To consider piloting location-based Flood Warning Systems and additional
monitoring equipment for the flood prone areas as a first step towards a nation-wide
system;
(J) To set up a 24-hour Drainage Hotline to handle public complaints and feedback on
drainage and flood matters; and
(K) To establish and rehearse active flood risk management and recovery plans

Acknowledgements
Page 79
Acknowledgements
This report on the key conclusions and recommendations of the Expert Panel on Drainage
Design and Flood Protection Measures would not have been possible without the
contributions of various organisations and individuals who provided valuable inputs and
general support.
We would like to thank the Public Utilities Board and Meteorological Service Singapore for
providing valuable information on drainage and weather. We would also like to thank the
following individuals, who were generous with their time, and for providing us with valuable
inputs and support:
- RADM(NS) Chew Men Leong, Chief Executive, PUB
- Mr Khoo Teng Chye, Executive Director, Centre for Liveable Cities [former Chief
Executive, PUB]
- Ms Wong Chin Ling, Director-General, MSS
- Ms Patricia Ee, Acting Director (Weather Services), MSS
- Mr John Low, Acting Director (Climate Science), MSS
- Mr Tan Yok Gin, Assistant Chief Executive (Operations), PUB
- Mr Yap Kheng Guan, Senior Consultant, PUB
- Mr Tan Nguan Sen, Director (Catchment and Waterways), PUB
In particular, we would like to extend our deepest appreciation to the following members of
the secretariat team for their excellent support:
- Mr Cheang Kok Chung, Director (Water Policy), MEWR
- Mr Young Joo Chye, Director (Policy and Planning), PUB
- Mr Ridzuan Ismail, Deputy Director (Policy and Planning), PUB
- Mr Jeremy Tay, Senior Assistant Director (Water Policy), MEWR
- Mr Jonathan Lim, Executive Engineer (Water Systems Unit), PUB
- Mr Woo Yong Keong, Senior Executive (Water Policy), MEWR
- Ms Cheong Xin Ling, Executive (Water Systems Unit), PUB

Appendix 1
Page 80
Appendix 1
Background Information on Singapore Weather Systems, Drainage Design and Flood
Management Approaches
A1 Climate in Singapore
A1.1 Singapore experiences a tropical climate which tends to be warm and humid, with
abundant rainfall of about 2400mm per year. The winds are generally light but with diurnal
variation due to the land and sea breezes. Monsoons dominate Singapore’s weather
throughout the year. There are 2 distinct monsoon seasons in Singapore – the Northeast
(NE) Monsoon and the Southwest (SW) Monsoon. Separating these two monsoon seasons
are relatively short inter-monsoon periods.
A1.2 The three main rain-bearing weather systems that affect Singapore are the monsoon
surges, Sumatra squalls and convective showers/ thunderstorms. Monsoon surges typically
occur during the NE Monsoon while Sumatra squalls commonly occur during the SW
Monsoon and inter-monsoon seasons. Convective showers/ thunderstorms can occur
throughout the year and is not confined to any particular monsoon seasons. Figure A1
shows the mean monthly rainfall and the corresponding monsoon periods.
Figure A1: Mean monthly rainfall for Singapore (period from 1869 to 2010)
A1.3 The NE Monsoon season, which typically lasts from December to March, has two
phases – wet phase (December to January) and a dry phase (February to early March).
During the wet phase, the NE Monsoon is characterised by short duration thundery showers
in the afternoon and early evening, and about two to four episodes of monsoon surges.
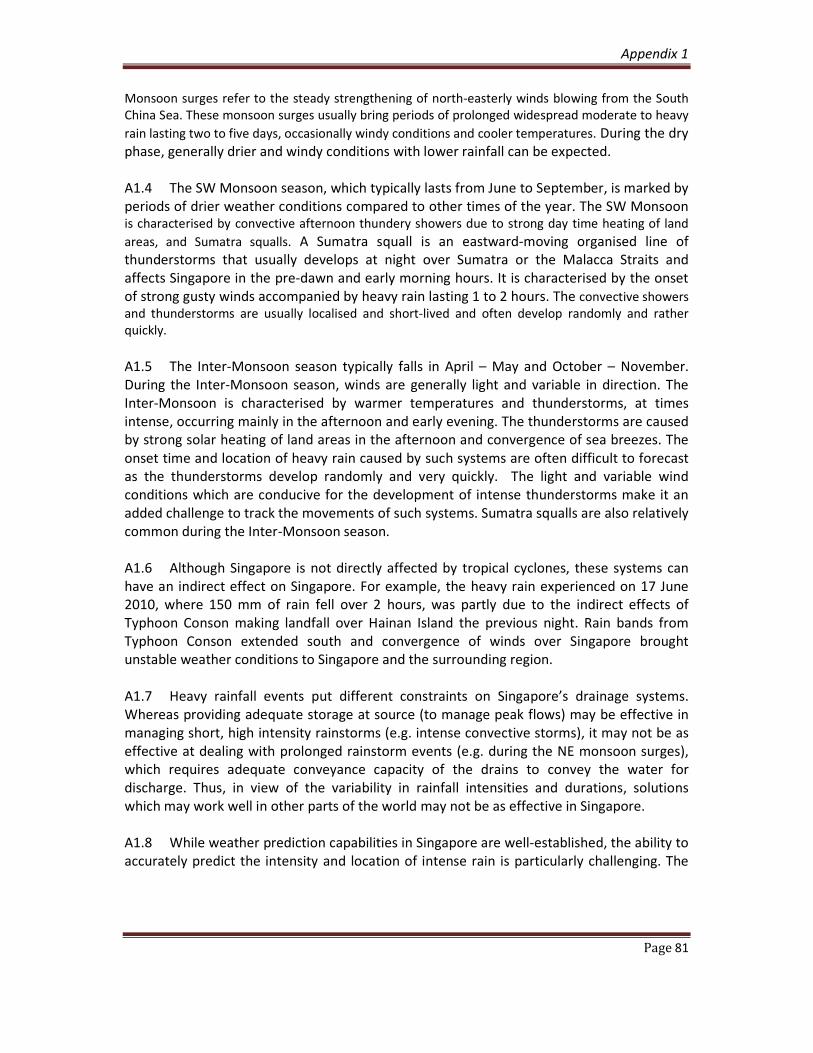
Appendix 1
Page 81
Monsoon surges refer to the steady strengthening of north-easterly winds blowing from the South
China Sea. These monsoon surges usually bring periods of prolonged widespread moderate to heavy
rain lasting two to five days, occasionally windy conditions and cooler temperatures. During the dry
phase, generally drier and windy conditions with lower rainfall can be expected.
A1.4 The SW Monsoon season, which typically lasts from June to September, is marked by
periods of drier weather conditions compared to other times of the year. The SW Monsoon
is characterised by convective afternoon thundery showers due to strong day time heating of land
areas, and Sumatra squalls. A Sumatra squall is an eastward-moving organised line of
thunderstorms that usually develops at night over Sumatra or the Malacca Straits and
affects Singapore in the pre-dawn and early morning hours. It is characterised by the onset
of strong gusty winds accompanied by heavy rain lasting 1 to 2 hours. The convective showers
and thunderstorms are usually localised and short-lived and often develop randomly and rather
quickly.
A1.5 The Inter-Monsoon season typically falls in April – May and October – November.
During the Inter-Monsoon season, winds are generally light and variable in direction. The
Inter-Monsoon is characterised by warmer temperatures and thunderstorms, at times
intense, occurring mainly in the afternoon and early evening. The thunderstorms are caused
by strong solar heating of land areas in the afternoon and convergence of sea breezes. The
onset time and location of heavy rain caused by such systems are often difficult to forecast
as the thunderstorms develop randomly and very quickly. The light and variable wind
conditions which are conducive for the development of intense thunderstorms make it an
added challenge to track the movements of such systems. Sumatra squalls are also relatively
common during the Inter-Monsoon season.
A1.6 Although Singapore is not directly affected by tropical cyclones, these systems can
have an indirect effect on Singapore. For example, the heavy rain experienced on 17 June
2010, where 150 mm of rain fell over 2 hours, was partly due to the indirect effects of
Typhoon Conson making landfall over Hainan Island the previous night. Rain bands from
Typhoon Conson extended south and convergence of winds over Singapore brought
unstable weather conditions to Singapore and the surrounding region.
A1.7 Heavy rainfall events put different constraints on Singapore’s drainage systems.
Whereas providing adequate storage at source (to manage peak flows) may be effective in
managing short, high intensity rainstorms (e.g. intense convective storms), it may not be as
effective at dealing with prolonged rainstorm events (e.g. during the NE monsoon surges),
which requires adequate conveyance capacity of the drains to convey the water for
discharge. Thus, in view of the variability in rainfall intensities and durations, solutions
which may work well in other parts of the world may not be as effective in Singapore.
A1.8 While weather prediction capabilities in Singapore are well-established, the ability to
accurately predict the intensity and location of intense rain is particularly challenging. The
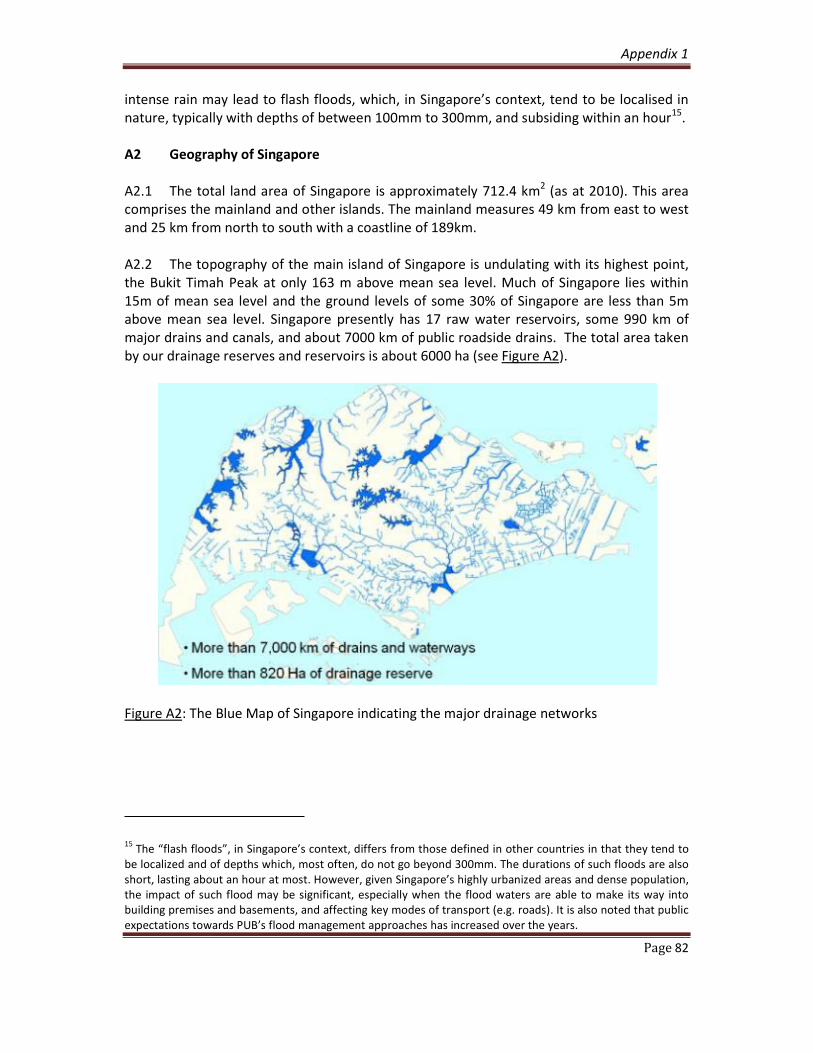
Appendix 1
Page 82
intense rain may lead to flash floods, which, in Singapore’s context, tend to be localised in
nature, typically with depths of between 100mm to 300mm, and subsiding within an hour15.
A2 Geography of Singapore
A2.1 The total land area of Singapore is approximately 712.4 km2 (as at 2010). This area
comprises the mainland and other islands. The mainland measures 49 km from east to west
and 25 km from north to south with a coastline of 189km.
A2.2 The topography of the main island of Singapore is undulating with its highest point,
the Bukit Timah Peak at only 163 m above mean sea level. Much of Singapore lies within
15m of mean sea level and the ground levels of some 30% of Singapore are less than 5m
above mean sea level. Singapore presently has 17 raw water reservoirs, some 990 km of
major drains and canals, and about 7000 km of public roadside drains. The total area taken
by our drainage reserves and reservoirs is about 6000 ha (see Figure A2).
Figure A2: The Blue Map of Singapore indicating the major drainage networks
15 The “flash floods”, in Singapore’s context, differs from those defined in other countries in that they tend to
be localized and of depths which, most often, do not go beyond 300mm. The durations of such floods are also
short, lasting about an hour at most. However, given Singapore’s highly urbanized areas and dense population,
the impact of such flood may be significant, especially when the flood waters are able to make its way into
building premises and basements, and affecting key modes of transport (e.g. roads). It is also noted that public
expectations towards PUB’s flood management approaches has increased over the years.

Appendix 1
Page 83
A3 Climate Change Studies and Initiatives
A3.1 In 2007, the National Environment Agency (NEA) commissioned a nation-wide
climate change study16 to project the effects and impacts of global climate change17 on
Singapore up to year 2100. The study projects a rise in sea-level by the year 2100 and
changes in meteorological patterns such as wind speed, temperature and rainfall, with
implications on Singapore’s water resources and physical infrastructure.
A3.2 Phase 1 of the Climate Study was completed in Dec 2009 and the findings of the
Study were reviewed by a panel of international peer reviewers who were involved in the
drafting of the Intergovernmental Panel on Climate Change (IPCC) Assessment Reports. The
peer reviewers noted at the time that the first tranche of results produced no discernible
trends in rainfall projections and recommended that rainfall findings be re-visited and the
use of as many global climate models as possible so as to assign a higher degree of
confidence. Phase 2, which examines the impact of climate change on Singapore’s
infrastructure, is under way, as well as studies to update rainfall projections through further
“downscaling”18 (i.e. zooming in to local scale from global climate models).
A3.3 Looking ahead, the MSS is building up capabilities in climate science through the
following efforts:
a. The Centre for Climate Research Singapore (CCRS) is being established to develop
deep expertise in climate science and to focus on research on tropical weather and
climate systems in the region such as convective thunderstorms, monsoons, El Niño
and La Niña. CCRS is a research institution within MSS and builds on the existing
resources of MSS Climate Science Department. As part of MSS, it will work closely
with the Weather Services Department and the Association of Southeast Asian
Nations (ASEAN) Specialised Meteorological Centre.
b. A Climate Science Experts Network is being established to build relationships and
catalyze research activity in Singapore. Climate research in the local research
institutes is in the early growth stage and the network will tap on local expertise
across a range of climate-related domains, as well as stimulat interest in a new
generation of scientists/ meteorologists.
16 The Study builds on the work and findings of the IPCC’s 4th Assessment Report (AR4) and follows the IPCC’s
methodologies. The methodologies and computer models adopted for the Study were peer reviewed by a
panel of international experts familiar with IPCC methodologies.
17
Globally, climate models are still fairly coarse to be of use to develop important decisions at the regional or
local level, thus the need to conduct downscaling of the GCM output to get fine scale climate information for
policy decisions.
18
Globally, climate models are still relatively coarse (resolution of tens to hundreds of kilometres). Scientists
must conduct downscaling of the general circulation models’ output to get fine scale climate information for
policy decisions at the regional or local level.

Appendix 1
Page 84
c. NEA has recently signed an MOU with the United Kingdom’s Meteorological Office
(UK Met Office) Hadley Centre for Climate Change to develop a 3yr collaboration
programme involving the joint development and implementation of climate models,
exchange of scientist and regional climate research. An inaugural 3 days climate
workshop in May 2011 saw 18 participants from ASEAN national meteorological
services coming to Singapore to learn climate downscaling from the Hadley Centre’s
experts. These scientists were in Singapore to install their latest regional climate
model under the collaboration programme.
The Panel noted that the MSS will be conducting in-house studies to build up its
expertise. Dynamical downscaling will be conducted to obtain updated temperature
and rainfall projections using the UK Met Office Hadley Centre PRECIS19 regional
climate model. MSS is also studying the intensity and frequency trends of intense
thunderstorms in Singapore.
A4 Development of Singapore
A4.1 Flood prone areas20 in Singapore have decreased steadily due to improvements
made to our drainage systems including fast tracking of flood alleviation schemes. From
about 3,200 hectares in the 1970s, these have been reduced by nearly 98% to about 49
hectares (as at January 2012), despite large scale urbanisation since independence (see
Figure A3).
19 PRECIS refers to the ongoing “Providing Regional Climates for Impacts Studies” project to develop a regional
climate modeling system which can be applied to any area of the globe to generate detailed climate change
projections.
20
In Singapore’s context, “flood prone areas” are defined as “those areas which are low-lying and/or do not
have adequate drainage, with past records of flooding.” These areas may be inland areas or near the coastlines
(i.e. susceptible to the risk of tidal flooding). As more and more of Singapore’s drainage systems are dammed
up to form estuarine reservoirs (e.g. the western reservoirs, Marina Reservoir, Punggol-Serangoon Reservoir,
etc), coupled with Singapore’s judicious application of minimum platform/ reclamation levels, floods due to
tidal influence has generally been reduced. In particular, the Panel noted that the flood events of 2010 and
2011 occurred mostly in the inland areas which were not affected by tidal influence.

Appendix 1
Page 85
Figure A3: Reduction in Flood Prone Areas despite Increasing Urbanisation
A4.2 Limited land and competing land use oblige Singapore to optimise its land
requirements for public infrastructure, through judicious land use master planning by public
agencies, spearheaded by the Urban Redevelopment Authority (URA). In addition, PUB also
constantly explores the integration of drainage with other land uses. For instance, where
feasible, drains are covered to allow it to double up as pavements. Examples of this include
the closed sections of Stamford Canal in downtown Orchard Road, as well as numerous
private housing estates and park connectors across Singapore. As part of the Active,
Beautiful and Clean (ABC) Waters Programme, land developers are also encouraged to
integrate drainage infrastructure with their developments, while park connectors are
typically located alongside the drains/ canals, usually within the drainage reserves.
A5 Overall Water Management Strategy for Singapore
A5.1 Part of Singapore’s drainage systems also serves an important function of conveying
storm waters into the 17 raw water reservoirs as a source for water supply. Without natural
lakes, one key strategy for Singapore has been to dam up river and canals to create
estuarine reservoirs, with recent examples being the Marina, Punggol and Serangoon
Reservoirs (see Figure A4). With these reservoir schemes, two-thirds of Singapore is now
water catchments. The drains in these catchments thus serve the dual function of rain water
harvesting by channelling the flows to the raw water reservoirs for subsequent treatment
into potable water, as well as for storm water conveyance to prevent floods.

Appendix 1
Page 86
Figure A4: Singapore’s Water Catchments
A5.2 With the damming up of more waterways, there have been concerns on the efficacy
of the drainage systems in conveying storm waters for the purposes of flood prevention,
especially for the more urbanised water catchments. This concern is particularly evident in
the case of the Marina Reservoir which receives storm waters from the urban areas of the
Stamford Canal, Bukit Timah, Kallang, Geylang and Singapore River Catchments. However, in
the case of the Marina Barrage, it is noted that flood prevention and alleviation continue to
be the main objective behind its design.
A6 PUB’s Drainage Management Strategy and Achievements over Past Few Decades
Singapore’s Historical Flood Situation
A6.1 In Singapore’s early days, floods were relatively common and widespread. Many of
the floods occurred in the city centre, which was on relatively low lying land, with several
many areas being just above the high tide level. One of the worst floods ever to occur took
place in Dec 1978, where almost a quarter of Singapore’s annual rainfall for 1978 fell in a
single day. Seven people lost their lives and total damages from the floods were estimated
at S$5.75 mil (based on 1978 prices)
Drainage Master Plan
A6.2 Through the years, the government has carried out numerous flood alleviation and
prevention projects in flood prone areas, including the widening and deepening of canals,
implementation of diversion canals, as well as tide-gate systems and pumped drainage to
protect low lying areas from floods and tidal inundation. The projects were guided by the
Drainage Master Plan, a comprehensive plan first drawn up in the 1970s to guide the future
drainage planning, and updated over the years to take into consideration new

Appendix 1
Page 87
developments and changes in design considerations. The main focus of the drainage master
plan was threefold, namely, to target flood prone areas, safeguard drainage reserves for
future drainage development, as well as prevent floods by ensuring that adequate drainage
is put in place ahead of every new land development projects.
A6.3 As part of Singapore’s drainage master planning process, the drainage improvement
projects under the master plan are regularly updated, taking into consideration inputs from
relevant agencies. PUB in turn provides the drainage requirements towards the
development and review of URA’s land use Master Plan. One key requirement is to
safeguard land reserves for future drainage development. To date, a total land area of some
820 ha (about 1.2% of Singapore) have been set aside as drainage reserves.
Flood Management Strategies
A6.4 PUB today adopts the three key strategies in flood management of flood alleviation,
flood prevention and drainage rehabilitation. These are elaborated as follows:
a. Flood Alleviation: Flood alleviation projects are planned for and implemented to tackle
and reduce the size of flood prone areas by improving the drainage in these areas. This
was achieved despite increasing urbanization and includes the adoption of a wide range
of drainage solutions – from the conventional widening and deepening of drains, to
more challenging methods of diversion canals and detention ponds. At the same time,
PUB also closely monitors and investigates all flood incidences. Hotspot areas, once
identified, will be tracked and resolved by expediting scheduled drainage improvement
works or implementing new drainage solutions, where feasible.
b. Flood Prevention: Flood prevention measures are imposed and planned for ahead of
new developments so as to ensure that new flood prone areas do not emerge with
increasing and more intense urbanization. This involves a holistic approach in ensuring
judicial land use development through deliberate master planning (e.g. securing of
drainage reserves), imposing of drainage requirements based on current and projected
land use (e.g. design storms, run-off coefficients), and implementing building plans and
development controls (e.g. minimum platform levels, reclamation levels). For low-lying
areas, flood prevention measures are also planned for and implemented wherever
feasible.
For buildings which are at-risk to floods, PUB also prescribes measures that will protect
buildings against floodwaters entering their basement premises and critical facilities.
These include installing crests in the form of humps or flood barriers at the entrances to
basements, or building walls around substation rooms to protect them from floodwater
damage.
c. Drainage Rehabilitation: Drainage rehabilitation is necessary to maintain smooth flow of
storm water so that it can be swiftly conveyed and discharged to the sea or impounding
reservoirs. Drains which are nearing the end of its economic life (around 30-40 years), or

Appendix 1
Page 88
deemed structurally compromised, will be identified and scheduled for rehabilitation.
Where possible, drainage rehabilitation works will also be carried out in conjunction
with the Estate Upgrading Programme, where older private estates are rejuvenated
through upgrading and development of infrastructure) for economies of scale and
minimise inconvenience to residents.
A6.5 To guide developers and public agencies in the design and implementation of
drainage schemes, PUB has put in place a Code of Practice on Surface Water Drainage.
Specific requirements on minimum platform levels and crest protection to safeguard
buildings and key installations are also provided for under the Code of Practice.

Appendix 2
Page 89
Appendix 2
Computation of the Annual Maximum Rainfall Intensities for different return periods
using the R-based “extRemes” Toolkit
B1 Extreme Value Theory
B1.1 The most common approach to model rare extreme events (e.g. temperature,
rainfall) involves fitting a statistical model to the annual (or seasonal or monthly) time series
of extreme data. There are two general methods. The first method is called the “peaks-
over-threshold” or POT method and produces a set of extremes which will typically have a
Generalized Pareto or GP distribution. The second, more commonly used method is called
the “block maximum” method. In this method, a sample of extreme values is obtained by
selecting the maximum (or in some cases minimum) value observed in a block period.
Blocks are typically one year or a season or month. Statistical theory has shown that the
Generalized Extreme Value (GEV) distribution is appropriate for the block maxima when
blocks are sufficiently large.
B1.2 GEV assumes a distribution for the extreme data and finds the best fit for the data.
The three families of distributions in the GEV are as shown in Figure B1.

Appendix 2
Page 90
Figure B1 shows three GEV distributions, the Gumbel (light tail), Frechet (heavy tail) and
Weibull (bounded upper tail). Generally, extreme rainfall intensity distribution follows the
Frechet and Gumbel distributions.
B1.3 The extreme value theory that underlies the GP and GEV distributions assumes that
the underlying climate is stationary. Although very long return periods can be computed
from the fitted distribution, the confidence in the return level decreases rapidly when the
period is more than twice the length of the original data set. The confidence interval can be
computed from the fitted GEV distribution and the range grows with longer return periods.
2 Procedure to compute Return Periods using the GEV distribution
B2.1 The maximum monthly rainfall records are pre-processed and the steps to input the
data into the R-based extRemes software are as follows:
• Preparing 60-min rainfall totals (yearly) or 60-min rainfall totals (monthly) data
• Read the data into R file. (R is a statistical software environment in which extRemes
toolkit is run)
• Analyze and fit using the Generalized Extreme Value
• Extract the return values using Parameter Confidence Interval.

Appendix 2
Page 91
B2.2 The histogram plots of two rainfall stations shown in Figure B2 have shapes
approximating the GEV distributions. A good fit of the GEV distribution implies that the
(yearly or monthly) time series of 60-min rainfall totals is well represented by the GEV
distribution and the retrieved GEV parameters can adequately approximate the annual
maximum 60-min intensity for N-year return periods where N is the number of years.
Figure B2: Histogram plots produced by GEV analysis that uses 60-min rainfall totals (yearly)
(top row) and 60-min rainfall totals (monthly) (bottom row) for stations S23 and S25.
The GEV analysis process produced four graphs and textual information to assess the
goodness of the fit. The four diagnostic plots, generated using 60-min rainfall total (yearly)
for a sample station, are shown in Figure B3. A visual examination of the diagnostic output
charts shows that the 60-min rainfall total (yearly) data do not provide a good fit of the GEV
distribution. Figure B4 shows similar plots but using the 60-min rainfall total (monthly) data.
Having more data points in the monthly time series help to improve the goodness-of-fit of
the GEV distribution and produce smaller uncertainty ranges in the return level plot.
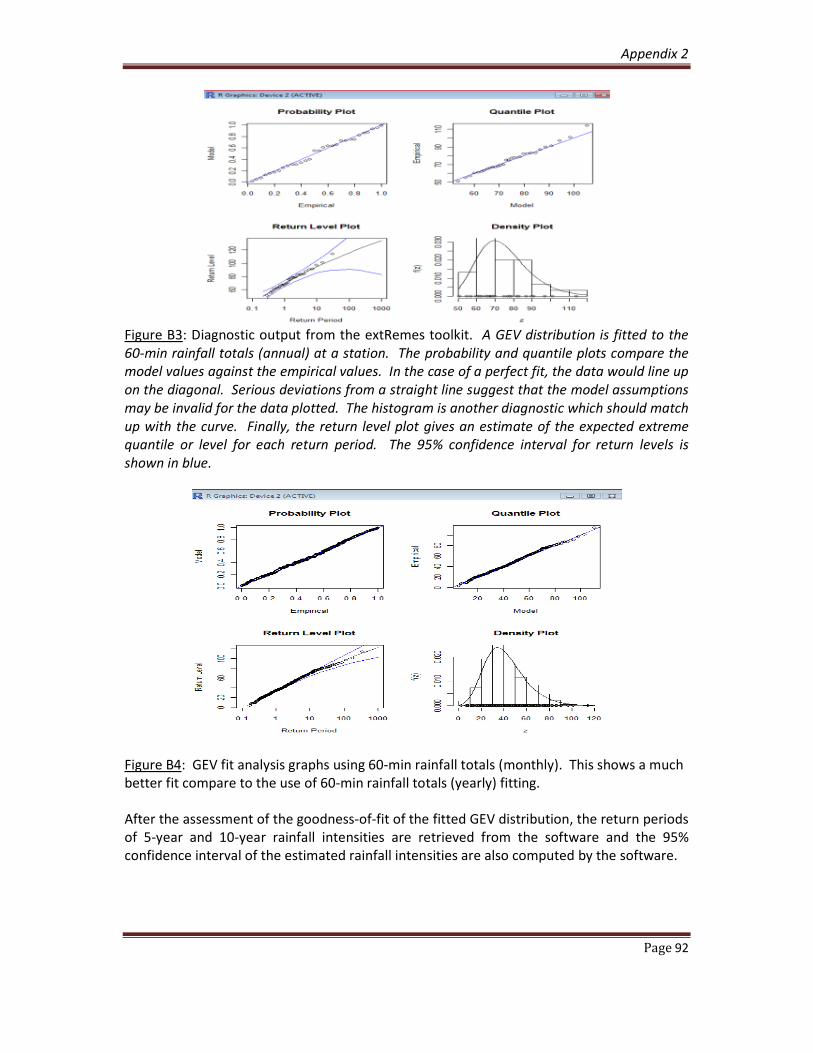
Appendix 2
Page 92
Figure B3: Diagnostic output from the extRemes toolkit. A GEV distribution is fitted to the
60-min rainfall totals (annual) at a station. The probability and quantile plots compare the
model values against the empirical values. In the case of a perfect fit, the data would line up
on the diagonal. Serious deviations from a straight line suggest that the model assumptions
may be invalid for the data plotted. The histogram is another diagnostic which should match
up with the curve. Finally, the return level plot gives an estimate of the expected extreme
quantile or level for each return period. The 95% confidence interval for return levels is
shown in blue.
Figure B4: GEV fit analysis graphs using 60-min rainfall totals (monthly). This shows a much
better fit compare to the use of 60-min rainfall totals (yearly) fitting.
After the assessment of the goodness-of-fit of the fitted GEV distribution, the return periods
of 5-year and 10-year rainfall intensities are retrieved from the software and the 95%
confidence interval of the estimated rainfall intensities are also computed by the software.
