explaining dubai’s aviation model - dubai international airport
TRANSCRIPT

Explaining Dubai’s Aviation Model
June 2011
A report for Emirates and Dubai Airports
June 2011
Contents
Executive Summary................................................................................... 3
1 The benefits created by Dubai’s aviation sector ..................................................................................................... 9
Introduction........................................................................................................ 10 How transport and a number of other key
sectors have driven Dubai’s economic growth over the past decade......................................................................................... 11 How the aviation sector benefits Dubai’s
economy ............................................................................................................ 13 Direct benefits .............................................................................................. 13 Indirect benefits ............................................................................................ 13 Induced effect............................................................................................... 14 Catalytic benefits .......................................................................................... 14 Total impact.................................................................................................. 15
How Dubai’s aviation sector creates benefits for global economy and international air travellers................................................. 17
2 What factors account for the success of Dubai’s aviation sector?..................................................................... 31
Introduction........................................................................................................ 31 The government’s role in Dubai’s economic
development ...................................................................................................... 32 Ownership of Dubai Airports and Emirates ....................................................................................................... 32 Openness ..................................................................................................... 35 Airport ownership around the world ............................................................. 37 Charging at Dubai’s airports......................................................................... 40
Consensus based approach to investment ....................................................... 44 Efficient operations............................................................................................ 44 A focus on growth and underserved markets.................................................... 56
3 The economic impact of Dubai’s aviation sector in 2020 ...................................................................................... 61
Explaining Dubai’s aviation model June 2011
Executive Summary
The aviation sector makes a substantial contribution to Dubai’s economy…
In this report Dubai’s aviation sector is defined as the airport operator, Dubai Airports, the
aircraft ground handling company and the passenger and cargo services provided by all
the airlines operating out of Dubai International.
The aviation sector contributes to Dubai’s economy through a number of channels. We
group these into two broad categories - the sector’s ‘economic footprint’ and its ‘catalytic
benefits’.
…and today it supports 125,000 jobs in Dubai including direct, supply chain and induced
jobs…
The aviation sector directly employs 58,000 people and contributes US$6.2 billion to
Dubai’s GDP.
The aviation sector indirectly supports 43,000 jobs and contributes US$3.5 billion to
Dubai’s GDP, through its purchases of goods and services from local businesses.
The aviation sector supports a further 23,900 jobs and contributes US$2.0 billion to
Dubai’s GDP, through the spending of those directly and indirectly employed in the
aviation sector.
Altogether, the aviation sector’s economic footprint today supports over 125,000 jobs and
contributes US$11.7 billion to Dubai’s GDP.
…and a further 134,000 jobs in Dubai’s tourism industry…
Aviation supports Dubai’s economy in more ways than its own economic footprint. The key
sectors of travel and tourism, financial and professional services, and logistics all depend
on the aviation sector for their success. Indeed, without the aviation sector it is hard to
imagine Dubai as it is today, with its distinctive skyline and large retail developments, a
3

Explaining Dubai’s aviation model June 2011
magnet for foreign visitors, expatriate workers and foreign businesses. We quantify these
wider ‘catalytic’ benefits of aviation through two channels: tourism and connectivity.
Travel and tourism, whether for business or leisure, make a large contribution to the Dubai
economy. The overwhelming majority of foreign visitors who travel to Dubai arrive by air,
and we calculate that their spending supports nearly 134,000 jobs and contributes US$7.9
billion to Dubai’s GDP.
The connections created between cities and markets represent an important infrastructure
asset that generates benefits through attracting foreign direct investment and talent,
enabling business clusters, specialisation and other spill-over impacts on the economy’s
productive capacity. We calculate that these ‘connectivity’ benefits contribute US$2.5
billion to Dubai’s GDP.
Taking into account all the ways in which the aviation sector contributes to Dubai’s
economy, we calculate that today it supports over 250,000 jobs and contributes over
US$22 billion to Dubai’s GDP. To give a sense of the scale of these benefits, they
represent around 19% of total employment in Dubai, and 28% of Dubai’s GDP.
…and also generates benefits for the global economy and consumers
Not only is the success of Dubai’s aviation sector good for Dubai’s economy, it also
benefits the global economy. It promotes global tourism. It creates connections between
cities and countries. These connections represent an important infrastructure asset that
benefits passengers, and businesses from many countries. It promotes strong
competition, ensuring for passengers efficient and high quality air services.
We calculate the economic benefits for 10 countries: Australia, Brazil, China, France,
Germany, India, Mauritius, South Africa, the United Kingdom and the United States,
focusing on the air transport services provided by Emirates Airline, Dubai’s home carrier.
For Mauritius the tourism benefits are substantial, equivalent to 1.0% of GDP. For others
the benefits are significant in absolute terms. For instance, the tourism benefits contribute
over US$1.0 billion to GDP for both Australia and India.
India, Mauritius and South Africa gain the most from improved connectivity, which
contributes a further 0.1% to 0.2% to their GDP. Connectivity benefits are significant in
4
Explaining Dubai’s aviation model June 2011
absolute terms for China (equivalent to US$1.4 billion of GDP), and for the UK and the US
(US$0.8 billion each).
Consumer benefits, in the form of the difference between what the consumer is willing to
pay and the actual fare, are high for travellers flying to and from Mauritius, South Africa
and India, where consumer benefits are equivalent to 0.7%, 0.6% and 0.4% of these
countries’ GDPs respectively. For India and the UK we calculate that consumer benefits
exceed US$1.0 billion. The benefits were also significant in absolute terms for Australia
(US$0.8 billion), together with China, Germany and the United States (US$0.5 billion
each).
What factors account for the success of Dubai’s aviation sector?
The success of Dubai’s aviation sector derives from a number of strengths, which are the
product of strategic decisions that the government of Dubai and the aviation sector have
taken in the past. These strengths include: an awareness of aviation’s economic
importance on the part of the government of Dubai; openness; a consensus based
approach to investment; a focus on growth and linking underserved markets; and efficient
operations. Added to these is Dubai’s favourable location at the intersection of Europe,
Asia and Africa. We look at these strengths in turn.
Government awareness…
The government has played a leading role in Dubai’s economic development. The relationship
between the government and the aviation sector is a consensus-based partnership that allows
important decisions to be made quickly and carried through effectively. The success of the
partnership is dependant on the government’s awareness of the importance of aviation to Dubai’s
economy and the shared vision provided by the Strategic Plan of the Dubai Government.
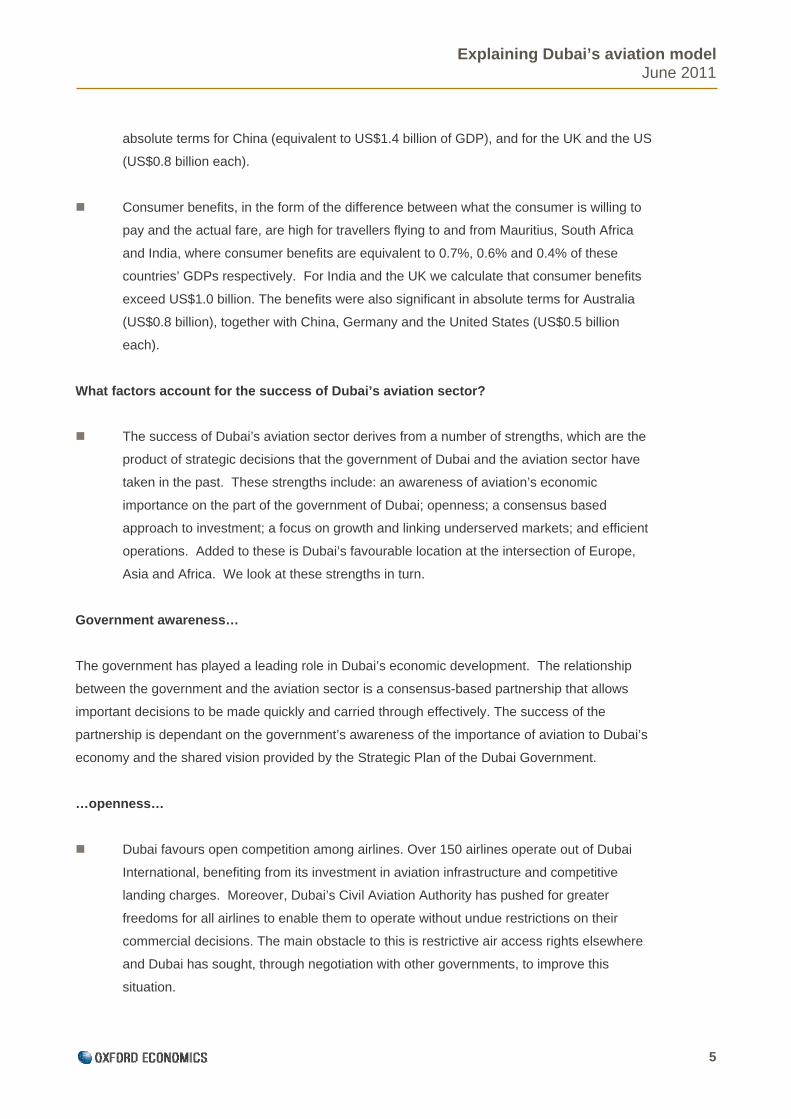
…openness…
Dubai favours open competition among airlines. Over 150 airlines operate out of Dubai
International, benefiting from its investment in aviation infrastructure and competitive
landing charges. Moreover, Dubai’s Civil Aviation Authority has pushed for greater
freedoms for all airlines to enable them to operate without undue restrictions on their
commercial decisions. The main obstacle to this is restrictive air access rights elsewhere
and Dubai has sought, through negotiation with other governments, to improve this
situation.
5

Explaining Dubai’s aviation model June 2011
Based on a comparison of airport charges, competition among the majority of the largest
100 international airports, including Dubai International, is conducted on a level playing
field. For a minority of the largest 100 international airports, however, airport charges are
seriously distorted by taxes. Among the ten airports with the highest airport charges, for
instance, tax accounts for over half of the total charge.
Ranked according to their airport charges (whether taxes are included or not), Dubai
International lies close to the middle of the largest 100 international airports, with roughly
an equal number of airports above it as there are below it in terms of their charges.
We compare Dubai International to a panel of 16 airports chosen either because of their
scale of operations, or for their proximity to Dubai. This panel comprises: Abu Dhabi,
Amsterdam, Ataturk (Istanbul), Bangkok, Beijing, Cairo, Charles De Gaulle (Paris), Doha,
Frankfurt, Hong Kong, Incheon, Jeddah, London Heathrow, Narita (Tokyo), Shanghai and
Singapore. The average airport charge (excluding taxes) at Tokyo and the four European
airports was US$55.5 per passenger, compared with US$26.6 per passenger at the
remaining eleven airports. Among this eleven, Dubai International is most similar to
Bangkok, Incheon and Shanghai in its level of charges. Excluding taxes, Dubai
International’s airport charges are only 4% below the average charge for these eleven
airports.
…a consensus based approach to investment…
Dubai’s aviation sector has benefited from its consensus based approach to investment
that has helped Dubai Airports and Emirates expand together, supporting each other’s
growth. This success has been possible because of the importance given to investing in
transport infrastructure. Dubai’s Strategic Plan identifies transport infrastructure as a
priority area for investment (‘world-class infrastructure designed to suit the requirements of
all users’), and its guiding principles to economic development include: innovation in
launching initiatives, speed and accuracy in project execution and unique relationship and
partnership with the private sector.
…focus on growth and underserved markets…
Dubai’s aviation sector has benefited from a focus on growth that has allowed it to
capitalise on the growing demand from passengers in Asia and Africa. In 2000, Dubai
International had the capacity to handle 22 million passengers. Through heavy investment
in upgrading its facilities, the airport had the capacity to handle 60 million passengers in
6

Explaining Dubai’s aviation model June 2011
2010. Over the same period, the actual number of passengers handled by the airport
increased from around 12 million to 47 million.
Emirates has targeted underserved routes. Through tapping into pent-up demand, the
airline has increased passenger numbers six-fold over the course of a decade. Emirates
has expanded its fleet almost four-fold to accommodate this demand. The success of this
strategy is reflected by the airline’s overall passenger seat load factor that has averaged
76% over the past decade.
…efficient operations…
While Dubai Airports is directly owned by the government and Emirates is owned by
Investment Corporation of Dubai (ICD), a government owned investment company, this is
not unusual in the global aviation industry. What is more unusual is that despite
government ownership, Emirates is run on a commercial basis without government
financial support.
Dubai’s success is exemplified by the efficiency of Emirates’ operations. To help us to
evaluate Emirates’ operating performance, we compare Emirates to a panel of 13 other
airline companies during the financial year ending in 2009/10. These companies are:
American Airlines, Air France-KLM, Air India, British Airways, Cathay Pacific, Jet Airways,
Lufthansa, Malaysia Airlines, Qantas, Singapore Airlines, SriLankan Airlines, Thai
Airways, and United Airlines. Among this panel of airlines there is a disparity between the
average labour costs among the European and North American airlines and the rest
(US$94,575 and US$49,510 per employee, respectively).
Emirates operates a young and modern fleet of aircraft. This brings many benefits for
Emirates’ passengers and also benefits the airline through lower maintenance and fuel
costs.
Among our panel of airlines, Emirates has one of the highest operating margins (0.6 cents
per available seat kilometre). Only Cathay Pacific and Thai Airways operate with larger
margins. American Airlines and Singapore Airlines manage to break even with slender
operating margins. Six of the panel operate with a negative margin.
Emirates profits have been sufficient to pay for all the investment in its fleet and repay its
loans over the past decade. Moreover, contrary to widely held belief, Emirates does not
receive government support through subsidies or other financial interventions, but has in
7

Explaining Dubai’s aviation model June 2011
fact paid out annual dividends to the government of Dubai totalling US$1.6 billion since
2002.
…and its strategic location
Dubai’s aviation sector has benefited from the emirate’s strategic location within eight
hours flight of most major destinations and two-thirds of the world’s population. For many
air travellers who do not stay in Dubai but instead use it as a place to connect as they go
to other countries, Dubai’s location is its principle attraction. However, tourism, trade and
commerce in Dubai depends on Dubai’s aviation sector, and clear synergies have
developed as the aviation sector’s success has assisted the growth of other key sectors
which in turn have generated additional demand for air transport services.
Aviation’s importance to Dubai is expected to continue to grow over the next decade
We expect the economic contribution of Dubai’s aviation sector to rise to 32% of Dubai’s
GDP and about 22% of its employment by 2020.
Financial results for 2010/11
Emirates released its annual report for the financial year 2010/11 on 10 May. Although its
release came too late for the data to be incorporated into our analysis, the information
contained in the latest numbers is consistent with our findings. Emirates continues to be
profitable despite difficult trading conditions. In 2010/11, it reported its highest profit in its
25 year history. Robust revenue growth (25% higher on the year) was driven by strong
growth in passenger numbers (revenue per passenger kilometre (RPKM) increased by
16.0% on the year), a 80% passenger seat factor, the highest in the airline’s history, and a
rebound in the Cargo business as world trade improved (tonnage increased 12% on the
year). The Annual Report, marking the company’s silver jubilee, notes that the airline has
become the world’s largest airline by scheduled international passenger-kilometres flown.
8

9
Explaining Dubai’s aviation model June 2011
1 The benefits created by Dubai’s aviation sector
Key points
We calculate that the aviation sector today supports over 259,000 jobs
and contributes US$22.1 billion to Dubai’s GDP.1 To give a sense of
the scale, these benefits represent around 19% of total employment in
Dubai and 28% of Dubai’s GDP.
The aviation sector supports 125,100 jobs and contributes US$11.7
billion to Dubai’s GDP through its economic footprint.
Moreover, Dubai’s travel and tourism sector depends almost entirely on
foreign visitors who arrive by air. We calculate that the spending by air
travellers supports nearly 134,000 jobs and contributes US$7.9 billion
to Dubai’s GDP.
Air connections between cities and countries constitute an important
infrastructure asset that increases the productivity of key sectors in
Dubai’s economy by attracting foreign direct investment and talent,
enabling business clusters, and specialisation. We calculate that these
‘connectivity benefits’ contribute US$2.5 billion to Dubai’s GDP.
Not only is the success of Dubai’s aviation sector good for Dubai’s
economy it also benefits the global economy. In this report we have
calculated the benefits created through tourism and connectivity
together with the benefits created for air passengers for 10 countries:
Australia, Brazil, China, France, Germany, India, Mauritius, South
Africa, the United Kingdom and the United States.
Spending by air travellers flying with Emirates makes an important
contribution to many of these countries’ economies. For Mauritius the
tourism benefits are substantial, equivalent to 1.0% of GDP. For
others, such as Australia and India, the benefits are significant in
absolute terms.
India, Mauritius and South Africa gain the most from improved
connectivity, which contributes a further 0.1% to 0.2% to their GDP.
Connectivity benefits are significant in absolute terms for China, the
United Kingdom and the United States.
Consumer benefits, explained in a later section, are also high. For
Mauritius and South Africa they are equivalent to 0.7% and 0.6% of
these countries’ GDPs. For Australia, China, Germany, India, the
United Kingdom and the United States the annual benefit exceeds
US$0.5 billion.
1 Dubai is one of seven emirates that comprise the United Arab Emirates (UAE). Unless
specifically stated, all numbers in the report refer to Dubai and not to the UAE.
Explaining Dubai’s aviation model June 2011
Introduction
This report looks at the economic benefits created by Dubai’s aviation sector. In
doing so the report attempts to answer three related questions. The first question concerns the nature of these economic benefits – how they arise and the extent of their reach. Dubai’s aviation sector has experienced rapid growth
over the past decade. In part this success reflects the rapid growth in Dubai’s economy which will have generated demand for air transport services. But Dubai’s investment in its aviation sector has also contributed to the success of
sectors such as travel and tourism, logistics, financial services and professional services that depend on being well connected to the global economy. We call such spillovers the ‘catalytic benefits’ of the aviation sector, which we calculate
to be substantial.
The success of Dubai’s aviation sector also benefits the global economy. Through improving connections between cities and countries, Dubai’s aviation sector promotes international tourism, generates connectivity benefits for
businesses in many countries, and expands the choices open to air passengers, many of whom are not staying in Dubai but are using it as a place to connect as they go to other countries. We look at these global benefits for a number of
countries and find that they can be significant.
Second, given the benefits that Dubai’s aviation sector creates for Dubai and for the global economy, it is natural to ask what factors underlie this success. In some quarters this success is viewed with suspicion, being seen as evidence of
government support and unfair competition. We look at this in some depth and we conclude that this view is incorrect. Instead, in our view the success of Dubai’s aviation sector derives from a number of strengths, which are the
product of strategic decisions that the government of Dubai and the aviation sector have taken in the past. These strengths include openness, efficient operations, a focus on growth and underserved markets and a consensus based
approach to investment.
The third question concerns the future. Will Dubai’s aviation sector continue to play as important a role in Dubai’s economy as it currently does? Based on our view about the sector’s underlying strengths and forecasts for air passenger
demand published by Airbus and Boeing, we conclude that it most probably will. We calculate that in 2020 the sector will be continuing to generate substantial benefits for Dubai’s economy, and that the catalytic benefits will play an even
more prominent role than they do today.
These three questions provide the structure for this report. Section 1 continues with a brief look at how several key sectors, including transport, have made an important contribution to Dubai’s economic growth over the past decade and a
half. We discuss the channels through which the aviation sector creates economic benefits, where we distinguish between the sector’s economic footprint and the sector’s catalytic benefits. We then quantify the benefits that
Dubai’s aviation sector currently generates both for Dubai and for 10 other countries. Section 2 looks at the factors that have underpinned the success of Dubai’s aviation model and Section 3 looks ahead to 2020.
10

Explaining Dubai’s aviation model June 2011
How transport and a number of other key sectors have driven
Dubai’s economic growth over the past decade
Today, Dubai’s economy is built around tourism; service industries, such as IT and finance; a vibrant re-export business, centred on well integrated transport
and logistical hubs; and real estate. While the retail and wholesale sectors (distributive trades) benefit from the large numbers of foreign visitors that shop at landmark developments, such as the Dubai Mall and Dubai Duty Free.
Chart 1.1 shows the growth in Dubai’s nominal Gross Domestic Product (GDP)
over the past 15 years, together with the contributions made from individual sectors of the economy. Given the attention often paid to Dubai’s property sector, perhaps the most striking feature of Chart 1.1 is how important
distributive trades, tourism and transport have been in driving growth in Dubai’s economy.
Chart 1.1: Nominal GDP since 1995
-
50
100
150
200
250
300
1995
1996
1997
1998
1999
2000
2001
2002
2003
2004
2005
2006
2007
2008
2009
Production
Other services
Transport
Trade & tourism
Banking & finance
Property
Extraction
Nominal GDP (billion Dirhams)
Source: Various, Dubai Statistical Centre
11
12
Explaining Dubai’s aviation model June 2011
Trade & tourism (5.5)
Transport (2.3)
Extraction (-0.2)
Production (2.2)
Property (4.4)
Banking & finance (0.5)Other services
(1.3)
Nominal GDP 16%
Average annual growth
rate 1995 - 2009
Numbers in brackets show each sector's contribution to overall GDP growth in percentage points
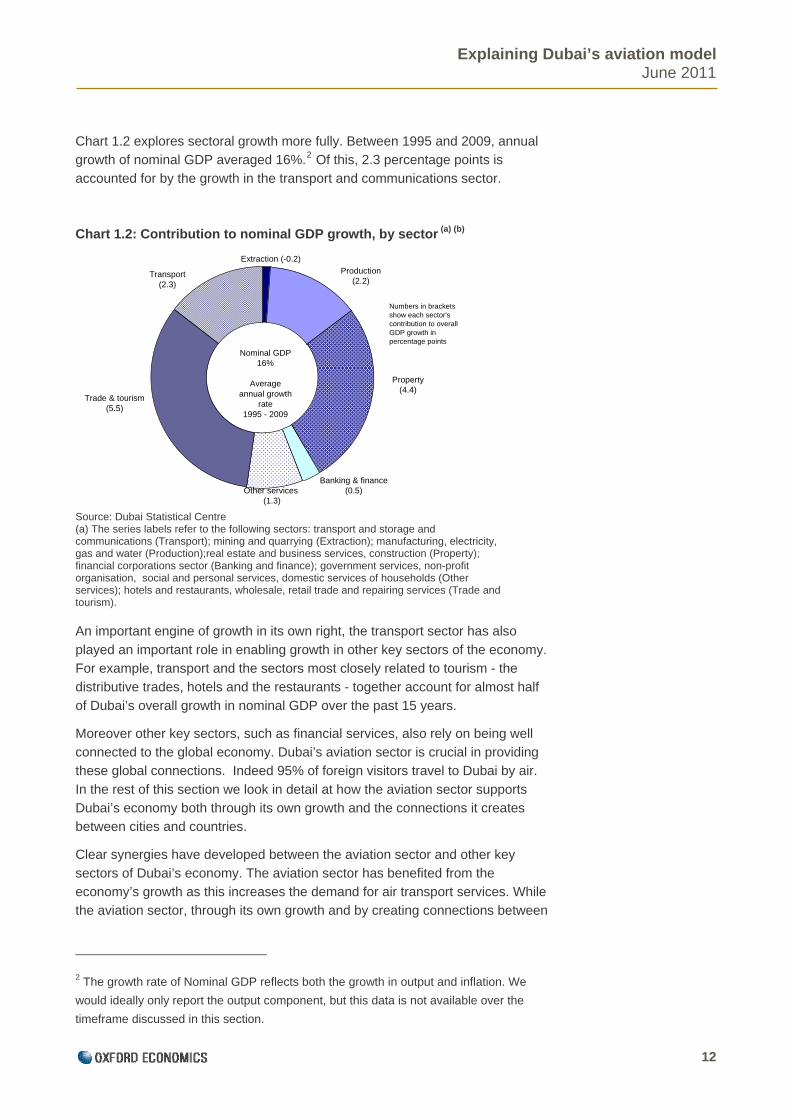
Chart 1.2 explores sectoral growth more fully. Between 1995 and 2009, annual growth of nominal GDP averaged 16%.2 Of this, 2.3 percentage points is accounted for by the growth in the transport and communications sector.
Chart 1.2: Contribution to nominal GDP growth, by sector (a) (b)
Source: Dubai Statistical Centre (a) The series labels refer to the following sectors: transport and storage and communications (Transport); mining and quarrying (Extraction); manufacturing, electricity, gas and water (Production);real estate and business services, construction (Property); financial corporations sector (Banking and finance); government services, non-profit organisation, social and personal services, domestic services of households (Other services); hotels and restaurants, wholesale, retail trade and repairing services (Trade and tourism).
An important engine of growth in its own right, the transport sector has also
played an important role in enabling growth in other key sectors of the economy. For example, transport and the sectors most closely related to tourism - the distributive trades, hotels and the restaurants - together account for almost half
of Dubai’s overall growth in nominal GDP over the past 15 years.
Moreover other key sectors, such as financial services, also rely on being well connected to the global economy. Dubai’s aviation sector is crucial in providing these global connections. Indeed 95% of foreign visitors travel to Dubai by air.
In the rest of this section we look in detail at how the aviation sector supports Dubai’s economy both through its own growth and the connections it creates between cities and countries.
Clear synergies have developed between the aviation sector and other key
sectors of Dubai’s economy. The aviation sector has benefited from the economy’s growth as this increases the demand for air transport services. While the aviation sector, through its own growth and by creating connections between
2 The growth rate of Nominal GDP reflects both the growth in output and inflation. We
would ideally only report the output component, but this data is not available over the
timeframe discussed in this section.

Explaining Dubai’s aviation model June 2011
Dubai and other countries has assisted the growth in other key sectors of the economy.
How the aviation sector benefits Dubai’s economy
In this report benefits are measured in two ways: (1) the contribution the sector makes towards GDP, a measure of the total output produced in the economy,
and (2) the employment that this production supports.
This report quantifies several types of benefits that are explained below.
Direct benefits
Direct benefits are the contributions to Dubai’s GDP and employment that are attributable directly to the aviation sector, through the activities of the airport
operator, ground support activities and the airline operations based out of Dubai.
The direct employment benefit is the total number of people employed in the sector, which in 2010 equalled 58,200 jobs.
When measured in terms of its contribution to GDP, the direct benefit is calculated as the total "value added" generated by the firms that comprise
Dubai’s aviation sector. A firm’s value added is calculated as the difference between its total sales and the cost of its purchases from other firms. As its name implies, were we to add up the value added along an entire production
chain we would arrive at the sales value of the final good. Much the same applies at the national level. Here the value of all final output is GDP, and value added provides a measure of how much each firm (and sector) contributes to
this total.
On this basis, the aviation sector contributed US$6.2 billion to Dubai’s GDP in 2010.
In 2010, the aviation sector generated value added of US$93,700 for each person it employed, almost 60% above the average labour productivity for the
whole economy. This high level of productivity reflects the relatively high proportion of engineers, pilots and other skilled workers in the workforce with the fact that aviation is a relatively capital-intensive sector.
Indirect benefits
To run an airport and to operate flights to and from it requires not only the services of the airport operator, ground handling and airlines. All these firms depend heavily on locally produced goods and services supplied by firms
outside the aviation sector. The aviation sector therefore generates indirect benefits by supporting jobs and economic activity along its supply chain.
Similar to the direct benefits, the indirect contribution is also measured in terms of value added. In this case the value added is embodied in the goods and
services supplied to the aviation sector from firms in other sectors of the Dubai economy. To capture the full supply chain, we need to add up the value added
13

14
Explaining Dubai’s aviation model June 2011
along the whole production chain – not only the direct suppliers, but the firms that supply them, and so on.
We calculate that in 2010, the aviation sector contributed US$3.5 billion to Dubai’s GDP and supported 43,000 jobs along its supply chain.
Induced effect
A further stimulus to GDP and employment comes about through the spending of those employed in the sector and its local supply chain. These benefits would be felt by general retail, in restaurants, by leisure services and many other local
businesses.
We calculate that the induced benefit contributes around US$2.0 billion to Dubai’s GDP, and supports almost 23,900 jobs.
Catalytic benefits
In addition to this economic footprint, this report also quantifies the catalytic
benefits which the aviation sector generates for other sectors of Dubai’s economy. These catalytic benefits arise (1) through the impetus that the aviation sector gives to Dubai’s travel and tourism sector and (2) the wider spillover
impacts created through the air connections between cities and countries. We look at each of these catalytic benefits in turn.
Tourism benefits
Dubai is an important tourist destination, and travel and tourism, whether for business or leisure, makes a large contribution to the Dubai economy. Many
landmark developments in Dubai are tourism attractions in their own right, such as the Burj Khalifa, the tallest building in the world. Large numbers of visitors also take advantage of developments such as the Dubai Mall and Dubai Duty
Free that are among the world’s largest retail operations of their type.3 Indeed, retail tourism, where foreign visitors come to Dubai primarily to shop at its premier retail developments, is big business. These developments act as an
important growth engine.
The overwhelming majority of foreign visitors who travel to Dubai arrive by air. Based on the number of passengers arriving at Dubai International who stopped over in Dubai, the average length of stay and the average spend per visitor
(based on data for the UAE as a whole), we estimate that aviation facilitated Dubai’s tourism sector to the tune of US$7.9 billion (in valued added terms), and supported almost 133,900 jobs within Dubai. These benefits came through the
direct and indirect channels. These estimates appear reasonable when compared with the number of visitor stays reported by Dubai’s official tourism statistics.
3 Based on its turnover in 2009, Dubai Duty Free was the largest Duty Free operation in
the world, according to a study conducted by Generation Research. Dubai Mall is one
of the world’s largest shopping malls whether measured by its area or number of shops,

15
Explaining Dubai’s aviation model June 2011
Wider connectivity benefits
Connectivity, as we explain below, contributes US$2.5 billion in value added to Dubai’s economy.
Dubai’s aviation sector benefits from the emirates’ strategic location within eight hours flight of most major destinations and two-thirds of the world’s population.
Benefiting from this location, the over 150 airlines that currently operate out of Dubai International provide nonstop services to 220 destinations around the world.
Studies on aviation call these linkages ‘connectivity’. Dubai’s connectivity
reflects both the overall passenger traffic that its airports handle, together with the importance of destinations that can be flown to. Increased connectivity benefits passengers by reducing the time spent in transit, increasing the
frequency of service, allowing for shorter waiting times and better targeting of departure and arrival times.
Improvements in connectivity give Dubai-based businesses greater access to foreign markets, encouraging exports. Opening domestic markets to foreign
competitors can also be an important driver behind reducing unit production costs, either by forcing domestic firms to adopt best international practices in production and management methods or by encouraging innovation. These
competitive pressures improve productivity of firms throughout the economy: a process given further impetus through the free movement of investment capital and workers between countries.
Research has shown that economies that are more connected, relative to their
size, will experience faster growth in the long term. For instance, research by Oxford Economics, has found that a 10% change in connectivity relative to GDP increases an economy’s long-run productivity by around 1.1%.4 Drawing on
detailed data on passenger traffic supplied by Emirates and Dubai Airports, we estimate that Dubai’s connectivity has increased by 80% over the last decade. Much of this improvement is down to the considerable investment that Dubai has
made in its aviation sector, together with its openness to other airlines. Through the positive impact that this has had on Dubai’s connectivity, we estimate that this policy today contributes US$2.5 billion in value added to Dubai’s economy.
Total impact
Table 1.1 summarises the analysis, by reporting the benefits from each of the channels we have discussed above.
The total economic benefit to Dubai’s economy is the sum of the benefits flowing through these five channels. In terms of gross value added, the total benefit was
US$ 22.1 billion in 2010, equivalent to 28% of Dubai’s GDP.
4 See ‘ TFP growth and the transport sector: a dynamic industry panel analysis’ (1999),
by Simon Price.

16
Explaining Dubai’s aviation model June 2011
2010
Total Contribution to GDP 22.1 (28%)Comprised of:
(1) Economic Footprint 11.7 Comprised of :
(1a) Direct 6.2 (1b) Indirect 3.5 (1c) Induced 2.0
(2) Catalytic Benefit 10.4 Comprised of:
(2a) Tourism 7.9 (2b) Connectivity 2.5
Total Employment Contribution 259.0 (19%)Comprised of:
(1) Economic Footprint 125.1 Comprised of :
(1a) Direct 58.2 (1b) Indirect 43.0 (1c) Induced 23.9
(2) Catalytic Benefit 133.9 Comprised of:
(2a) Tourism 133.9
Panel A: Contribution to GDP (US$ billion)
Panel B: Contribution to employment (000's)
Of this total, aviation’s economic footprint contributed US$11.7 billion, with the direct, indirect and induced components contributing US$6.2 billion, US$3.5 billion and US$2.0 billion respectively.
Catalytic benefit contributed US$ 10.4 billion to Dubai’s GDP. Of this, tourism accounted for US$ 7.9 billion and connectivity US$ 2.5 billion.
In total, the aviation sector supported 259,000 jobs in 2010, 19% of total
employment in Dubai. Of this total, just over 125,000 are supported through the aviation sector’s economic footprint. The jobs supported through the direct, indirect and induced channels are 58,200, 43,000, and 23,900 respectively. The
catalytic benefits (tourism) supported a further 125,100 jobs.
Dubai Benefiting Others: Ethiopian Airlines
Ethiopian Airlines is expanding rapidly. In the five years ending in FY2009/10,
its passenger numbers increased on average by 15% each year. In FY2009/10
Table 1.1: Aviation’s contribution to Dubai’s GDP and Employment
Footnote In brackets are shown aviation’s contributions as a proportion of Dubai’s GDP and as a proportion of total employment in the Dubai economy.

Explaining Dubai’s aviation model June 2011
it carried 3.15 million passengers, with direct services to 56 international
destinations.
Dubai is a key destination for Ethiopian Airlines. The airline operates
approximately 9 services per week to Dubai. Around 8.4% of Ethiopian’s
passengers fly to Dubai, representing 7.7% of all international passengers who
fly to and from Ethiopia.
Dubai offers Ethiopian Airlines a wealth of onward connections. By flying to
Dubai, the airline can offer its passengers the benefit of one-stop connections to
85 destinations in the Middle East and Asia. These onward connections are
additional to the 17 destinations in these regions that Ethiopian Airlines flies to
directly. This significantly improves the connectivity of the services offered by
Ethiopian’s own flights. Of the 245,000 passengers that flew between Addis
Ababa and Dubai 2010, many continued their journey onwards from Dubai, with
JFK, Beijing and Shanghai being popular destinations.
These connections also benefit Ethiopia’s rapidly expanding economy, which
has grown by 7.0% a year over the past five years. The tourism sector accounts
for over 4% of Ethiopia’s GDP. Over 85% of foreign tourists arrive by air. We
calculate that tourists travelling with Ethiopian Airlines through Dubai contribute
almost US$75 million to Ethiopian GDP.
How Dubai’s aviation sector creates benefits for global economy
and international air travellers
Not only is the success of Dubai’s aviation sector good for Dubai’s economy, it also benefits the global economy. It promotes global tourism. It creates connections between cities and countries - what we have termed ‘connectivity’ –
which represents an important infrastructure asset that enables the flow of investment and people between countries, the transfer of knowledge and other ‘spillover’ benefits. Connectivity also benefits air passengers, and through strong
competition they benefit from efficient and high-quality air services.
We calculate these economic benefits for the following 10 countries
Australia Brazil China France Germany
India Mauritius South Africa United Kingdom United States
which we present in the pages that follow as a series of one page case studies. On each page, the information is organised into five sections.
Background – reports the country’s population and GDP, important statistics
concerning the country’s aviation sector, such as the number of aircraft movements each year and the number of passengers and tonnage of freight carried. It also reports the Airbus and Boeing forecasts for the growth in
passenger traffic.
17

Explaining Dubai’s aviation model June 2011
18
Emirates - provides a snap shot of Emirates presence in each market. It reports the year that Emirates first flew to the country; the number of passengers and the tonnage of freight carried by Emirates, and the share these represented of
the total market; the airports Emirates flies to; and the amount Emirates spends in advertising and sponsorship.
Connectivity benefits - reports the country’s connectivity expressed as a ratio to its GDP. As we have discussed in the context of Dubai’s economy, this ratio
is useful when thinking about the spillover benefits that the aviation sector can generate for other sectors of the economy. This ratio indicates whether the connections offered by a country’s aviation infrastructure are ‘adequate’ given
the size of the economy.
We base our calculations on Emirates’ passenger flows. This simplifies the calculations as it uses Dubai International as its home base. The international benefits arise, however, from Dubai’s connectivity. This reflects the connections
provided by the services offered by all the airlines that operate from the airport (of which there are currently over 150). As such, our estimates should be interpreted as illustrating the benefits created by the whole of Dubai’s aviation
sector. The results show how much a country’s connectivity index would change without Emirates and if this change alters a country’s connectivity ranking.
Consumer benefits - Dubai’s aviation sector creates benefits for international air travellers. Strong competition among airlines benefits air travellers by
ensuring that air services are efficient, responsive to their needs and that air fares remain competitive.
The fares that air travellers pay for their flights do not necessarily reflect the full value they place on the air services they use. Instead, for many travellers the full
value (the maximum they would be willing to pay for the ticket) will typically be above the actual fare. Economists call this additional benefit enjoyed by the consumer, consumer surplus.
Emirates demonstrates competitively priced fares, based on overall market
demand and conditions. Strong competition benefits all air travellers through increasing their consumer surplus. For the ten countries we estimate the additional consumer surplus passengers enjoy due to Emirates presence in the
market.
Our estimates should be treated as indicative only. For instance, our modelling does not attempt to account for a number of complex issues - for instance, how airlines respond to each others actions, or how they compete on quality of
service. We believe our calculations are, however, a useful guide to the potential benefits enjoyed by international air travellers from Emirates presence in the market.
Tourism benefits - estimates the benefit to the tourism industry in each country
created through the visitors who fly with Emirates.
We use the travel and tourism data published by the World Travel and Tourism Council (WTTC) for data on the level of foreign visitor spending in each country. We then use mode of transport data from the World Tourism Organisation

19
Explaining Dubai’s aviation model June 2011
(UNWTO) to assign a share of this to the aviation industry and we derive our tourism benefit by attributing part of this aviation share to Emirates based on its share of international passenger traffic to the country. .

20
Explaining Dubai’s aviation model June 2011
AUSTRALIA
Emirates in Australia Year of first flight: 1996 Emirates pax to/from Australia in 2009: 1,225,123 Emirates share of international pax: 5.0% Emirates freight to/from Australia 2009: 31,204 tns Emirates share of freight: n/a Airports served by Emirates: Sydney, Melbourne, Brisbane, Perth Emirates spending in Australia (advertising ,sponsorship): US$39.5m
All other a ir lines
95%
Emirates5%
A ustral ia2009
24,476,536International
pax
Background Aviation growth forecast: Australia Population (2009): 22,165,000 GDP (2009): US$848.8 billion Aviation in 2009 Total international pax: 24,476,536 Forecast growth Airbus forecast: 7.3% per annum Boeing Forecast: 6.0% per annum
Connectivity benefits Australia connectivity density index 2009: 0.39 Impact without Emirates on: - GDP loss: US$248m
0.387
0.377
0.365
0.370
0.375
0.380
0.385
0.390
Australia Australia (without EK)
Connectivity per $ billion GDP
Consumer benefits Monetary benefit to air travellers: US$0.84bn
0.84
0.0
0.1
0.2
0.3
0.4
0.5
0.6
0.7
0.8
0.9
All passengers
Passenger benefits ($ billion)
Tourism benefits 2009 International Tourism GDP (including indirect): US$26.8 bn Proportion of tourists arriving by air: almost 100% Tourism GDP due to Emirates: US$1.33 bn
26.8325.49
0
5
10
15
20
25
30
International
2009 International TourismEconomy
International tourism economywithout Emirates
Tourism Economy GDP ($ billion)
0
50
100
150
200
250
300
2005 2008 2011 2014 2017 2020
0
50
100
150
200
250
300
Pax (millions)
Pax (millions)
Airbus forecast
Boeing forecast

Explaining Dubai’s aviation model June 2011
21
BRAZIL Background Aviation growth forecast: Brazil Population (2009): 191,481,000 GDP (2009): US$2,010 billion Aviation in 2009 Total international pax: 13,115,010 Total freight: 511,399 tonnes Forecast growth Airbus forecast: 7.0% per annum Boeing Forecast: 15.2% per annum
Emirates in Brazil Year of first flight: 2007 Emirates pax to/from Brazil in 2009: 151,900 Emirates share of international pax: 1.2% Emirates freight to/from Brazil in 2009: 6,264 tns Emirates share of freight: 1.2% Airports served by Emirates: Sao Paulo Emirates spending in Brazil (advertising, sponsorship): US$5.4m
All other a ir lines98.8%
Emirates1.2%
Brazil2009
13,115,010 intern ation al
pax
Connectivity benefits Brazil connectivity density index 2009: 0.16 Impact without Emirates on: - GDP loss: US$260m
0.160
0.159
0.157
0.159
0.161
Brazil Brazil (without EK)
Connectivity per $ billion GDP
Consumer benefits Monetary benefit to air travellers: US$0.1bn Monetary benefit to cargo shippers: US$0.02bn
0.10
0.02
0.00
0.02
0.04
0.06
0.08
0.10
0.12
All passengers Freight
0.000
0.002
0.004
0.006
0.008
0.010
0.012
0.014
0.016
0.018
Passenger benefits ($ billion)
Freight benefits ($ billion)
Tourism benefits 2009 International Tourism GDP (including indirect): US$5.5 bn Proportion of tourists arriving by air: 74% Tourism GDP due to Emirates: US$0.05 bn
5.46 5.41
1
2
3
4
5
6
International Tourism Economy GDP ($ billion)
0
2009 International Tourism Economy International tourism economy withoutEmirates
0
100
200
300
400
500
600
700
2005 2008 2011 2014 2017 2020
0
100
200
300
400
500
600
700
x (millions)
Pax (millions)
Pa
Boeing forecast
Airbus forecast

Explaining Dubai’s aviation model June 2011
22
CHINA Background Aviation growth forecast: China Population (2009): 1,334,740,000 GDP (2009): US$9,047 billion Aviation in 2009 Total international pax: 87,214,257 Total freight: 6,277,003 tonnes Forecast growth Airbus forecast: 7.4% per annum Boeing Forecast: 7.6% per annum
0
200
400
600
800
1,000
1,200
2005 2008 2011 2014 2017 2020
0
200
400
600
800
1,000
1,200
Pax (millions)
Pax (millions)
Boeing forecast
Airbus forecast
Emirates in China Year of first flight: 2004 Emirates pax to/from China in 2009: 834,791 Emirates share of international pax: 1.0% Emirates freight to/from China in 2009: 55,442 tns Emirates share of freight: 0.9% Airports served by Emirates: Shanghai, Beijing, Guangzhou Emirates spending in China: (advertising, sponsorship): US$8.7m
All other a ir lines99.0%
Emirates1.0%
China2009
87,214,257 in ternatio nal
pax
Connectivity benefits China connectivity density index 2009: 0.19 Impact without Emirates on:
- GDP loss: US$1.4bn
0.185
0.183
0.180
0.185
0.190
China China (without EK)
Connectivity per $ billion GDP
Consumer benefits Monetary benefit to air travellers: US$0.53bn Monetary benefit to cargo shippers: US$0.15bn
Tourism benefits 2009 International Tourism GDP (including indirect): US$40.9 bn Proportion of tourists arriving by air: 13% Tourism GDP due to Emirates: US$0.05 bn
40.93 40.88
5
10
15
20
25
30
35
40
45
International Tourism Economy GDP ($ billion)
0.530.15
0.0
0.1
0.2
0.3
0.4
0.5
0.6
All passengers Freight
0.00
0.02
0.04
0.06
0.08
0.10
0.12
0.14
0.16
Passenger benefits ($ billion)
Freight benefits ($ billion)
0
2009 International Tourism Economy International tourism economywithout Emirates
Explaining Dubai’s aviation model June 2011
23
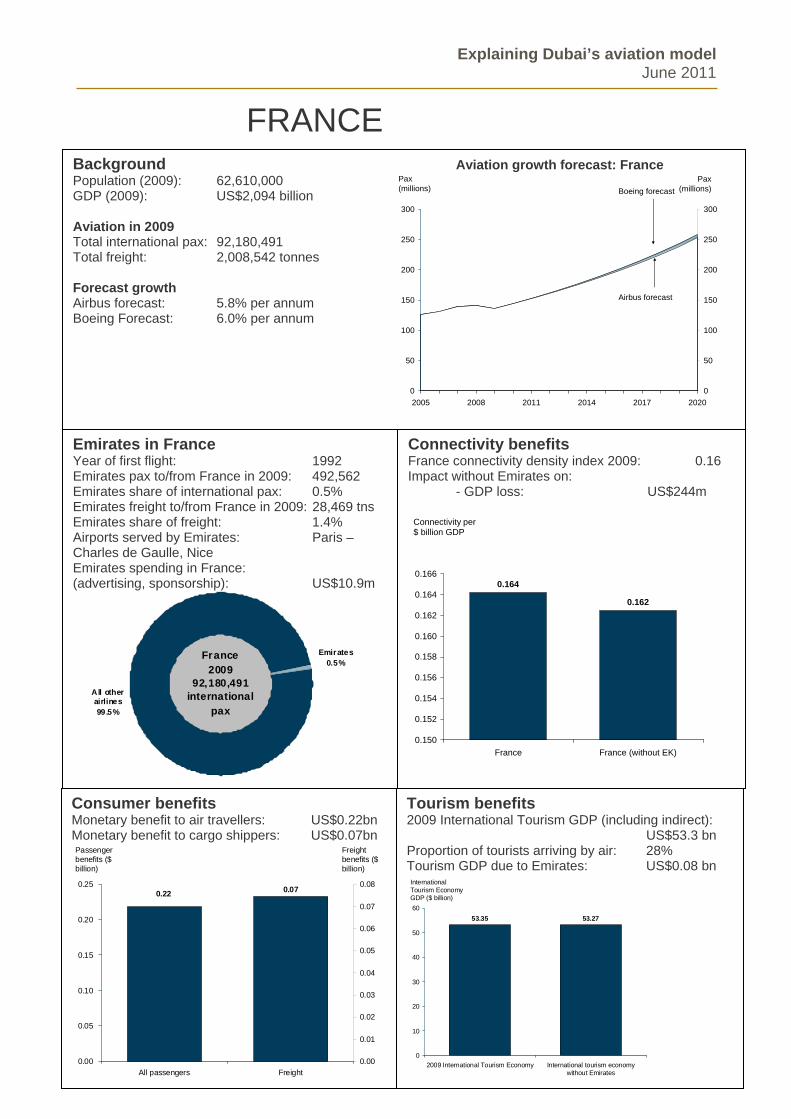
FRANCE Background Aviation growth forecast: France Population (2009): 62,610,000 GDP (2009): US$2,094 billion Aviation in 2009 Total international pax: 92,180,491 Total freight: 2,008,542 tonnes Forecast growth Airbus forecast: 5.8% per annum Boeing Forecast: 6.0% per annum
Emirates in France Year of first flight: 1992 Emirates pax to/from France in 2009: 492,562 Emirates share of international pax: 0.5% Emirates freight to/from France in 2009: 28,469 tns Emirates share of freight: 1.4% Airports served by Emirates: Paris – Charles de Gaulle, Nice Emirates spending in France: (advertising, sponsorship): US$10.9m
Emirates0.5%
All other airlines99.5%
France2009
92,180,491 international
pax
Connectivity benefits France connectivity density index 2009: 0.16 Impact without Emirates on:
- GDP loss: US$244m
0.164
0.162
0.150
0.152
0.154
0.156
0.158
0.160
0.162
0.164
0.166
France France (without EK)
Connectivity per $ billion GDP
Consumer benefits Monetary benefit to air travellers: US$0.22bn Monetary benefit to cargo shippers: US$0.07bn
0.22 0.07
0.00
0.05
0.10
0.15
0.20
0.25
All passengers Freight
0.00
0.01
0.02
0.03
0.04
0.05
0.06
0.07
0.08
Passenger benefits ($ billion)
Freight benefits ($ billion)
Tourism benefits 2009 International Tourism GDP (including indirect): US$53.3 bn Proportion of tourists arriving by air: 28% Tourism GDP due to Emirates: US$0.08 bn
53.35 53.27
10
20
30
40
50
60
International Tourism Economy GDP ($ billion)
0
2009 International Tourism Economy International tourism economywithout Emirates
0
50
100
150
200
250
300
2005 2008 2011 2014 2017 2020
0
50
100
150
200
250
300
Pax (millions)
Pax (millions)Boeing forecast
Airbus forecast

Explaining Dubai’s aviation model June 2011
24
GERMANY Background Aviation growth forecast: Germany Population (2009): 81,802,000 GDP (2009): US$2,812 billion Aviation in 2009 Total international pax: 130,576,488 Total freight: 3,162,626 Forecast growth Airbus forecast: 5.8% per annum Boeing Forecast: 6.0% per annum
0
50
100
150
200
250
300
350
400
2005 2008 2011 2014 2017 2020
0
50
100
150
200
250
300
350
400
Pax (millions)
Pax (millions)Boeing forecast
Airbus forecast
Emirates in Germany Year of first flight: 1987 Emirates pax to/from Germany in 2009: 1,202,204 Emirates share of international pax: 0.9% Emirates freight to/from Germany 2009: 96,457 tns Emirates share of freight: 3.1% Airports served by Emirates: Frankfurt, Munich, Dusseldorf, Hamburg Emirates spending in Germany: (advertising, sponsorship): US$28.3m
Emirat es0.9%
All other airlines99.1%
Germany2009
130,576,488 international
pax
Connectivity benefits Germany connectivity density index 2009: 0.19 Impact without Emirates on:
- GDP loss: US$551m
0.1910.188
0.150
0.160
0.170
0.180
0.190
0.200
Germany Germany (without EK)
Connectivity per $ billion GDP
Consumer benefits Monetary benefit to air travellers: US$0.51bn Monetary benefit to cargo shippers: US$0.28bn
Tourism benefits 2009 International Tourism GDP (including indirect): US$44.1 bn Proportion of tourists arriving by air: 38% Tourism GDP due to Emirates: US$0.16 bn
44.08 43.92
10
15
20
25
30
35
40
45
500.51
0.28
0.0
0.1
0.2
0.3
0.4
0.5
0.6
All passengers Freight
0.00
0.05
0.10
0.15
0.20
0.25
0.30
Passenger benefits ($ billion)
Freight benefits ($ billion)
0
5
2009 International Tourism Economy International tourism economywithout Emirates
International Tourism Economy GDP ($ billion)

Explaining Dubai’s aviation model June 2011
25
INDIA Background Aviation growth forecast: India Population (2008): 1,154,000,000 GDP (2009): US$3,615 billion Aviation in 2009 Total international pax: 31,191,631 Total freight: 1,190,881 tonnes Forecast growth Airbus forecast: 6.3% per annum Boeing Forecast: 7.3% per annum
Emirates in India Year of first flight: 1985 Emirates pax to/from India in 2009: 3,901,206 Emirates share of international pax: 12.5% Emirates freight to/from India in 2009: 161,164 tns Emirates share of freight: 13.5% Airports served by Emirates: Mumbai, Ahmedabad, Bengaluru, Chennai, Delhi, Hyderabad, Kochi, Kolkata, Kozhikode, Thiruvananthapuram Emirates spending in India (advertising, sponsorship): US$18.2m
Emirates12.5%
All other airlines87.5%
India2009
31,191,631 international
pax
Connectivity benefits India connectivity density index 2009: 0.10 Impact without Emirates on:
- GDP loss: US$612m
0.103
0.087
0.075
0.080
0.085
0.090
0.095
0.100
0.105
India India (without EK)
Connectivity per $ billion GDP
Consumer benefits Monetary benefit to air travellers: US$1.63bn Monetary benefit to cargo shippers: US$0.44bn
1.63 0.44
0.0
0.2
0.4
0.6
0.8
1.0
1.2
1.4
1.6
1.8
All passengers Freight
0.00
0.05
0.10
0.15
0.20
0.25
0.30
0.35
0.40
0.45
0.50
Passenger benefits ($ billion)
Freight benefits ($ billion)
Tourism benefits 2009 International Tourism GDP (including indirect): US$10.7 bn Proportion of tourists arriving by air: 89% Tourism GDP due to Emirates: US$1.2 bn
10.67
9.48
2
4
6
8
10
12
0
2009 International Tourism Economy International tourism economywithout Emirates
International Tourism Economy GDP ($ billion)
0
50
100
150
200
250
2005 2008 2011 2014 2017 2020
0
50
100
150
200
250
Pax (millions)
Pax (millions)
Boeing forecast
Airbus forecast

Explaining Dubai’s aviation model June 2011
26
MAURITIUS
Emirates in Mauritius Year of first flight: 2002 Emirates pax to/from Mauritius in 2009: 269,538 Emirates share of international pax: 11.8% Emirates freight to/from Mauritius 2009: 5,091 tns Emirates share of freight: n/a Airports served by Emirates: SRR Emirates spending in Mauritius (advertising, sponsorship): US$0.66m
All other air lines88.2%
Emirates11.8%
Mauritius2009
2,291,000 international
pax
Background Aviation growth forecast: Mauritius Population (2009): 1,288,000 GDP (2009): US$16.32 billion Aviation in 2009 Total international pax: 2,291,000 Forecast growth Airbus forecast: 7.5% per annum Boeing Forecast: 6.5% per annum
Connectivity benefits Mauritius connectivity density index 2009: 0.62 Impact without Emirates on:
- GDP loss: US$30m
0.619
0.516
0.460
0.480
0.500
0.520
0.540
0.560
0.580
0.600
0.620
0.640
Mauritius Mauritius (without EK)
Connectivity per $ billion GDP
Consumer benefits Monetary benefit to air travellers: US$0.11bn
0.11
0.00
0.02
0.04
0.06
0.08
0.10
0.12
All passengers
Passenger benefits ($ billion)
Tourism benefits 2009 International Tourism GDP (including indirect): US$1.4 bn Proportion of tourists arriving by air: 97% Tourism GDP due to Emirates: US$0.2 bn
1.35
1.20
0.2
0.4
0.6
0.8
1.0
1.2
1.4
1.6
International Tourism Economy GDP ($ billion)
0.0
2009 International Tourism Economy International tourism economywithout Emirates
2.0
2.5
3.0
3.5
4.0
4.5
5.0
5.5
2005 2008 2011 2014 2017 2020
2.0
2.5
3.0
3.5
4.0
4.5
5.0
5.5
Pax (millions)
Pax (millions)
Airbus forecast
Boeing forecast

Explaining Dubai’s aviation model June 2011
27
SOUTH AFRICA Background Aviation growth forecast: South Africa Population (2009): 49,464,000 GDP (2009): US$504.5 billion Aviation in 2009 Total international pax: 9,636,546 Total freight: 231,885 tonnes Forecast growth Airbus forecast: 3.7% per annum Boeing Forecast: 4.0% per annum
0
10
20
30
40
50
60
2005 2008 2011 2014 2017 2020
0
10
20
30
40
50
60
Pax (millions)
Pax (millions)Boeing forecast
Airbus forecast
Emirates in South Africa Year of first flight: 1995 Emirates pax to/from South Africa 2009: 807,799 Emirates share of international pax: 8.4% Emirates freight to/from South Africa ’09 34,075 tns Emirates share of freight: 14.7% Airports served by Emirates: Johannesburg, Cape Town, Durban Emirates spending in South Africa: (advertising, sponsorship): US$8.4m
E mirates8.4%
All other air lines91.6%
South Africa2009
9,636,546 international
pax
Connectivity benefits South Africa connectivity density index 2009: 0.15 Impact without Emirates on:
- GDP loss: US$101m
0.153
0.135
0.000
0.020
0.040
0.060
0.080
0.100
0.120
0.140
0.160
0.180
South Africa South Africa (without EK)
Connectivity per $ billion GDP
Consumer benefits Monetary benefit to air travellers: US$0.45bn Monetary benefit to cargo shippers: US$0.09bn
Tourism benefits 2009 International Tourism GDP (including indirect): US$8.3 bn Proportion of tourists arriving by air: 27% Tourism GDP due to Emirates: US$0.2 bn
8.32 8.14
2
3
4
5
6
7
8
90.45
0.09
0.00
0.05
0.10
0.15
0.20
0.25
0.30
0.35
0.40
0.45
0.50
All passengers Freight
0.00
0.01
0.02
0.03
0.04
0.05
0.06
0.07
0.08
0.09
0.10
Passenger benefits ($ billion)
Freight benefits ($ billion)
0
1
2009 International Tourism Economy International tourism economy withoutEmirates
International Tourism Economy GDP ($ billion)
Explaining Dubai’s aviation model June 2011
28
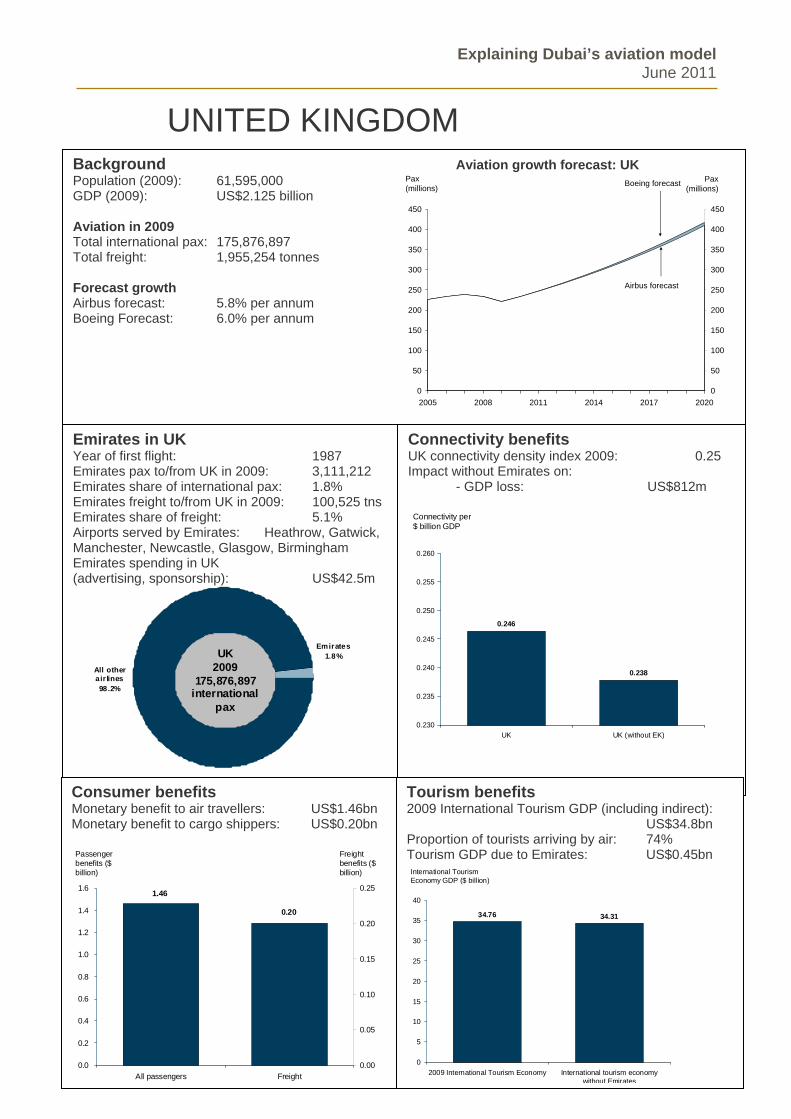
UNITED KINGDOM Background Aviation growth forecast: UK Population (2009): 61,595,000 GDP (2009): US$2.125 billion Aviation in 2009 Total international pax: 175,876,897 Total freight: 1,955,254 tonnes Forecast growth Airbus forecast: 5.8% per annum Boeing Forecast: 6.0% per annum
Emirates in UK Year of first flight: 1987 Emirates pax to/from UK in 2009: 3,111,212 Emirates share of international pax: 1.8% Emirates freight to/from UK in 2009: 100,525 tns Emirates share of freight: 5.1% Airports served by Emirates: Heathrow, Gatwick, Manchester, Newcastle, Glasgow, Birmingham Emirates spending in UK (advertising, sponsorship): US$42.5m
Emirates1.8%
All other air lines98.2%
UK2009
175,876,897 international
pax
Connectivity benefits UK connectivity density index 2009: 0.25 Impact without Emirates on:
- GDP loss: US$812m
0.246
0.238
0.230
0.235
0.240
0.245
0.250
0.255
0.260
UK UK (without EK)
Connectivity per $ billion GDP
Consumer benefits Monetary benefit to air travellers: US$1.46bn Monetary benefit to cargo shippers: US$0.20bn
1.46
0.20
0.0
0.2
0.4
0.6
0.8
1.0
1.2
1.4
1.6
All passengers Freight
0.00
0.05
0.10
0.15
0.20
0.25
Passenger benefits ($ billion)
Freight benefits ($ billion)
Tourism benefits 2009 International Tourism GDP (including indirect): US$34.8bn Proportion of tourists arriving by air: 74% Tourism GDP due to Emirates: US$0.45bn
34.76 34.31
0
5
10
15
20
25
30
35
40
2009 International Tourism Economy International tourism economywithout Emirates
International Tourism Economy GDP ($ billion)
0
50
100
150
200
250
300
350
400
450
2005 2008 2011 2014 2017 2020
0
50
100
150
200
250
300
350
400
450
Pax (millions)
Pax (millions)
Boeing forecast
Airbus forecast

Explaining Dubai’s aviation model June 2011
29
UNITED STATES
Emirates in USA Year of first flight: 2004 Emirates pax to/from USA in 2009: 838,016 Emirates share of international pax: 0.6% Emirates freight to/from USA in 2009: 28,694 tns Emirates share of freight: 0.4% Airports served by Emirates: New York (JFK), Los Angeles, Houston, San Francisco Emirates spending in USA (advertising, sponsorship): US$22.3m
Emirates0.6%
All other air lines
99.4%
USA2009
149,817,574 international
pax
Background Aviation growth forecast: USA Population (2009): 306,656,000 GDP (2009): US$14,119 billion Aviation in 2009 Total international pax: 149,817,574 Total freight: 6,974,087 tonnes Forecast growth Airbus forecast: 3.7% per annum Boeing Forecast: 4.0% per annum
Consumer benefits Monetary benefit to air travellers: US$0.51bn Monetary benefit to cargo shippers: US$0.07bn
0.51 0.07
0.0
0.1
0.2
0.3
0.4
0.5
0.6
All passengers Freight
0.00
0.01
0.02
0.03
0.04
0.05
0.06
0.07
0.08
Passenger benefits ($ billion)
Freight benefits ($ billion)
Tourism benefits 2009 International Tourism GDP (including indirect):
US$136.4bn Proportion of tourists arriving by air: 55% Tourism GDP due to Emirates: US$0.42 bn
Connectivity benefits US connectivity density index 2009: 0.43 Impact without Emirates on:
- GDP loss: US$758m
0.427
0.425
0.420
0.421
0.422
0.423
0.424
0.425
0.426
0.427
0.428
US US (without EK)
Connectivity per $ billion GDP
136.38 135.97
0
20
40
60
80
100
120
140
160
2009 International Tourism Economy International tourism economywithout Emirates
Tourism Economy GDP ($ billion)
0.0
500.0
1,000.0
1,500.0
2,000.0
2,500.0
2005 2008 2011 2014 2017 2020
-
500.0
1,000.0
1,500.0
2,000.0
2,500.0
Pax (millions)
Pax (millions)
A
Boeing forecast
irbus forecast

Explaining Dubai’s aviation model June 2011
30
Data Source NotesBackgroundPopulation National Statistics Agencies / Haver AnalyticsGDP IMF World Economic Outlook Expressed in US$ Purchasing Parity terms
Aircraft MovementsAirports Council International Airport Traffic Report 2009
International PaxAirports Council International Airport Traffic Report 2009
There may be some slight differences between market share data derived from ACI Airport Traffic Report compared to local market data sources - but the former was used for consistency among the ten country case studies.
Total FreightAirports Council International Airport Traffic Report 2009 See above
Airport statisticsAirports Council International Airport Traffic Report 2009 See above
Forecasts
AirbusBoeing Current Market Outlook (www.boeing.com/commercial/cmo/)
BoeingAirbus Global Market Forecast 2010 (www.airbus.com/company/market/gmf2010/)
Emirates in …Year of first flight EmiratesEmirates pax EmiratesEmirates freight EmiratesEmirates spending EmiratesConnectivity benefitsConnectivity density index International Air Transport Association
GDP loss
Calculated using Oxford Economics' estimate of elasticity of GDP to aviation connectivity, See 'TFP growth and the transport sector: a dynamic industry panel analysis', 1999, by Simon Price.
Consumer Benefits
Customer benefits
The benefit received by all international passengers. Calculated using demand elasticities reported in 'Estimating Air Travel Demand Elasticities', Intervistas Consulting, 2007.
Tourism benefitsTourism GDP Oxford EconomicsProportion of tourists arriving by ai UN World Tourism Organisationr
Table of Sources used in Section 3

Explaining Dubai’s aviation model June 2011
2 What factors account for the success of Dubai’s aviation sector?
Key points
The success of Dubai’s aviation sector derives from a number of
strengths. These strengths include:
The Dubai Government demonstrates an awareness of the importance
of aviation for enabling growth in key sectors of Dubai’s economy. This
is apparent in Dubai’s strategic plan and also manifests itself in
decision making that is consensus based, timely and effective.
Dubai favours open competition among airlines. This openness is
reflected in the large number of airlines that operate out of Dubai
International (currently over 150); Dubai’s liberal aviation policy that has
pushed for greater freedoms for all airlines to enable them to operate
without undue restrictions on their commercial decisions; and
competitive airport charges.
A consensus based approach to investment that has helped Dubai
Airports and Emirates expand together, supporting each other’s growth.
A focus on growth and underserved markets that has enabled the
airport to increase the number of passengers it handles from 12 million
to 47 million over the past decade.
Introduction
Given the benefits that Dubai’s aviation sector creates for Dubai, it is natural to
ask what factors underlie this success. In this section we identify four key strengths which are the product of strategic decisions that the government of Dubai and the aviation sector have taken in the past. These strengths are:
awareness of aviation’s economic importance on the part of the government
of Dubai;
an aviation policy that favours open competition among airlines;
a consensus based approach to investment; and
a focus on growth and underserved markets.
We look at each of these strengths in turn.
31

Explaining Dubai’s aviation model June 2011
32
The government’s role in Dubai’s economic development
The government has played a leading role in Dubai’s economic development. This is recognised in Dubai’s Strategic Plan to 2015, announced by HH Sheikh Mohammed bin Rashid Al Maktoum, Vice President and Prime Minister of the
UAE and Ruler of Dubai in February 2007. The Plan explains the principles guiding economic development initiatives and the key sectors where its initiatives will be focused. The plan identifies transport infrastructure as a priority
area for public investment (“world-class infrastructure designed to suit the requirements of all users”), and its guiding principles for economic development: the adoption of free market economy principles, innovation in launching
initiatives, speed and accuracy in project execution and unique relationship and partnership with the private sector.
The importance of the partnership between the government and the aviation sector was emphasised during interviews with key stakeholders in the aviation
sector. They describe the relationship as a consensus-based partnership that allows important decisions to be made quickly and carried through effectively, enabling the industry to successfully adapt to the almost four-fold increase in the
number of passengers travelling through Dubai over the past decade. Stakeholders attributed the success of the partnership to the government’s awareness of the importance of aviation to Dubai’s economy and the shared
vision provided by the Strategic Plan. They also pointed to the small number of parties involved, which allows decisions to be reached quickly.
The Strategic Plan emphasises the importance of the free market. In the aviation sector this is reflected, for instance, in the decision to run Emirates as a
standalone company that operates without financial assistance from the government (see page 53). Free markets depend on open competition. The commitment to openness is seen in the number of airlines operating out of Dubai
International (currently over 150), its competitive landing charges (see page 41), its pursuit of open skies agreements (see page 35), and the government commitment to provide the necessary airport infrastructure to serve the interests
of all airlines and passengers (see page 55).
Ownership of Dubai Airports and Emirates
The government ownership of key aviation organisations is shown in the attached organisational chart (Figure 2.1).
Dubai Airports manages and operates Dubai International (together with the
recently opened Dubai World Central). Both airports are directly owned by the government of Dubai.
Several key organisations are owned indirectly by the government through the Investment Corporation of Dubai (ICD). The Emirates Group owns a number of
aviation-related businesses such as Emirates (airline) and dnata, the ground handling company. The Group also owns a number of other smaller aviation-related businesses as well as interests in hotels, leisure and tourism.

Explaining Dubai’s aviation model June 2011
33
Ti
A
a
he ICD also owns Dubai Duty Free which is housed at Dubai International but s run as a separate business to the airport.
ir regulation for Dubai is undertaken by Dubai’s Civil Aviation Authority in
ssociation with the UAE’s General Civil Aviation Authority.
Dubai Benefiting Others: Royal Brunei Airlines
Royal Brunei Airlines is Brunei’s home carrier, wholly owned by the government
of Brunei and based at Brunei International Airport. With a fleet size of 10
aircraft, Royal Brunei transports its passengers to 18 destinations around the
world.
Dubai is a key network airport for Royal Brunei Airlines. In 2009, around 15% of
Royal Brunei’s passengers flew to Dubai, representing 12.8% of all international
passengers who fly to and from Brunei.
Dubai also provides important onward connections for Royal Brunei. The
London-Brunei connection is of particular importance to the airline and its
passengers. Exercising their 5th freedom rights, Dubai provides Royal Brunei
with an invaluable refuelling post to continue their journey on to their final
destination.
These connections also benefit the economy, opening Brunei to visitors from
around the world. When only considering the impact of foreign visitors, tourism
accounts for approximately 2.4% of Brunei’s GDP. We calculate that tourists
travelling with Royal Brunei through Dubai contribute approximately
US$2.5million to the Brunei economy.
Another way to gauge Royal Brunei’s importance to Brunei’s economy is simply
to compare its passenger traffic with Brunei’s population. In 2009, the airline
carried 1 million passengers (uplifted and discharged), over twice the number of
Brunei’s population of approximately 400,000.

Explaining Dubai’s aviation model June 2011
34
Government of Dubai
Investment Corporation of Dubai
dnataEmirates
Other ICD Companies
Dubai Airports
Dubai Civil Aviation Authority
Dubai International Airport
DUBAI AVIATION OWNERSHIP STRUCTURE
Dubai World Central Emirates Group
Group companies
Figure 2.1 : Dubai’s aviation ownership structure

Explaining Dubai’s aviation model June 2011
35
While owned by the government of Dubai through the ICD, Emirates itself publishes annual reports which include audited financial statements.5 The financial
statements show that the company is neither supported through government subsidies nor receives capital injections from the government.6 As the company’s sole shareholder, the ICD receives dividends from the company which it pays out of
its operating profits. Since 2002, for instance, Emirates has paid dividends to the ICD every year. These dividend payments have totalled US$1.6 billion, equivalent to an average payment of US$176 million each year.
Openness
Dubai has a very liberal aviation policy. 7 This liberal policy has two distinct but mutually supporting aspects.
Dubai favours open competition among airlines. There are currently over 150 airlines that operate out of Dubai International, benefiting from its infrastructure and
competitive landing charges. Moreover, Emirates, while government owned, is operated as a fully commercial and profitable organisation. In many countries, however, competition among airlines is distorted through government regulations
and taxation (whether intentionally or not).
Second, Dubai’s Civil Aviation Authority, working with its UAE equivalent (the General Civil Aviation Authority) has pushed for greater freedoms for airlines to enable them to operate without undue restrictions on their commercial decisions.
The main obstacle to this is restrictive air access rights elsewhere and Dubai through its civil aviation authorities has sought to improve this situation through negotiation with other governments.
5 The financial statements are audited by PriceWaterhouseCoopers a leading international
accountancy firm.
6 Emirates was launched in 1985. The government of Dubai provided US$10 million, of
seed capital together with two B727-200 aircraft and buildings that housed Emirates
Training College. That year, the company leased two further aircraft from Pakistan
International Airlines.
7 Dubai’s approach to aviation sector – in particular its openness and its efficient operations
- are sometimes referred to as its “Open Skies” policy.
Explaining Dubai’s aviation model June 2011
36
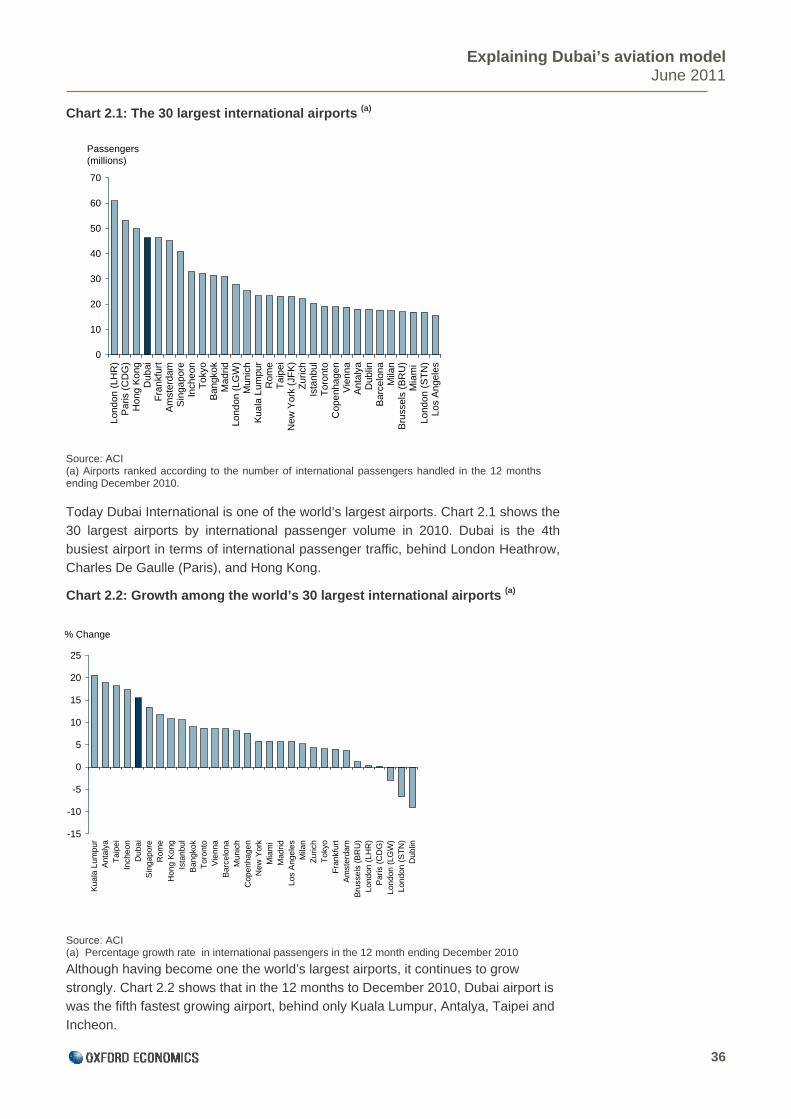
Chart 2.1: The 30 largest international airports (a)
ource: ACI ed according to the number of international passengers handled in the 12 months
oday Dubai International is one of the world’s largest airports. Chart 2.1 shows the
t international airports (a)
e growth rate in international passengers in the 12 month ending December 2010
rt is
Incheon.
S
0
10
20
30
40
50
60
70
Lon
don
(LH
R)
Par
is (
CD
G)
Ho
ng K
ong
Dub
aiF
ran
kfur
tA
mst
erda
mS
inga
pore
Inch
eon
To
kyo
Ban
gkok
Mad
ridLo
ndo
n (
LGW
)M
unic
hK
uala
Lum
pur
Rom
eT
aip
eiN
ew Y
ork
(JF
K)
Zu
rich
Ista
nbul
Tor
onto
Cop
enh
age
nV
ien
naA
ntal
yaD
ublin
Ba
rcel
ona
Mila
nB
russ
els
(BR
U)
Mia
mi
Lon
don
(S
TN
)L
os A
nge
les
Passengers (millions)
(a) Airports rankending December 2010.
T
30 largest airports by international passenger volume in 2010. Dubai is the 4th busiest airport in terms of international passenger traffic, behind London Heathrow, Charles De Gaulle (Paris), and Hong Kong.
Chart 2.2: Growth among the world’s 30 larges
-15
-10
-5
0
5
10
15
20
25
Kua
la L
umpu
rA
ntal
yaT
aip
ei
Inch
eo
nD
uba
iS
inga
pore
Rom
eH
ong
Kon
gIs
tan
bul
Ban
gkok
Tor
ont
oV
ienn
aB
arce
lona
Mun
ich
Co
pen
hag
enN
ew Y
ork
Mia
mi
Mad
ridLo
s A
nge
les
Mila
nZ
uric
hT
okyo
Fra
nkf
urt
Am
ster
dam
Bru
ssel
s (B
RU
)L
ond
on (
LH
R)
Pa
ris
(CD
G)
Lon
don
(LG
W)
Lon
don
(S
TN
)D
ubl
in
% Change
ource: ACI S
(a) Percentag
Although having become one the world’s largest airports, it continues to grow
strongly. Chart 2.2 shows that in the 12 months to December 2010, Dubai airpowas the fifth fastest growing airport, behind only Kuala Lumpur, Antalya, Taipei and

Explaining Dubai’s aviation model June 2011
37
Airport ownership around the world
Across the
0%
10%
20%
30%
40%
50%
60%
70%
80%
90%
100%
Mid
dle
Eas
t
Asi
a/P
acifi
c
Nor
thA
mer
ica
Eu
rope
Afr
ica
Ce
n &
S.
Am
eric
a
Wo
rld
Public Private
world, it is very common for airports to be owned and run by publicly owned organisations. The extent of public ownership of the world’s airlines is
rried out in 2007 by the International Civil Aviation Authority (ICAO). It covered almost 600 airports located across the world.8
Chart 2.3: Airport ownership in 2007
Source: ICAO
The report’s findings are presented in Chart 2.3. According to the ICAO study,
seven out of ten airports are publicly owned. The study found that a clear majority of nder public ownership for the majority of regions. Public ownership is
pe
e (autonomous), but which is orts
he operation
revealed in two recent reports.
ICAO Study
The first of these studies was ca
airports are umost common in the Middle East, followed by Asia-Pacific, North America, Euro
and Africa. Only in Central and South America was public ownership not dominant, where just over half of airports are publicly owned.
The study distinguished between direct public ownership – as is the case with Dubai – and indirect ownership. Indirect ownership is where the airport is operated
by an organisation that has operational independencultimately owned by the government. The study found that around a half of airpin public ownership were operated by an autonomous organisation.
The ICAO study also looked at airport concessions, where a private sector airport
operator is given the right to operate an airport for a given term, while ownership remains with either central or local government. Towards the end of tterm, the concession is usually put to a competitive tender; and if the current
operator wishes to retain its rights to operate the airport, it has to compete against
8 ‘Ownership, Organization and Regulatory Practices of Airports and Air Navigation
Services Providers, 2007’, ICAO, (2008).

Explaining Dubai’s aviation model June 2011
38
rival bidders. Over a quarter of airports were operated under this type of arrangement.
Less common are joint ventures between the public and private sectors a
initiatives towa
Public Owned78%
Private 9%
Mixed Ownership
13%
nd other
rds partial privatisation. The exception is Europe where the ICAO
y, carried out in 2010, covered 404 airports across Europe. 9
up
lic
ts ken into account, the private sector
t 2.4: Airport ownership in Europe 2010
Source: ACI Europe
found one in ten airports was partially privatised. This was examined further in a study of European airports conducted by the Airport Council International (ACI)
which we turn to next.
ACI Study
The ACI stud
The study’s findings are shown in Chart 2.4. Similar to the ICAO study, the ACI found that an overwhelming majority of airports are in public ownership. ACI’sreport found that almost eight out of ten airports were in full public ownership.
The remaining 13% of airports were in some form of mixed ownership. This gro
was almost equally split between those where the majority interest lay with puborganisations and those ventures where private companies had the majority interest. A very small number of airports were run as joint ventures where public
and private had equal stakes in the venture.
Less than one in ten airports was in full private ownership. With controlling interes(meaning greater or equal to 50% interest) tacontrols just over 15% of airports in Europe.
Char
9 ACI Europe (2010) “The Ownership of Europe’s Airports”.

Explaining Dubai’s aviation model June 2011
39
Dubai Benefiting Others: China Southern
China’s largest airline, China Southern is expanding rapidly. In 2009, it carried
approximately 66.3 million passengers – more than twice the number of passengers
recorded just 5 years previously. This made it the 6th largest airline in the world,
and the largest outside of the US, measured by the number of passengers carried.
Regardless of the metric used, the numbers are impressive. With a fleet size
numbering more than 420 aircraft. A key destination within its network is Dubai,
China Southern has significant point to point traffic with Dubai. In 2010, it carried
approximately 200,000 passengers to and from Dubai, representing an increase of
nearly 40% on the previous year.
Dubai provides China Southern with an invaluable staging post. With transit
passengers accounting for 7% of their total traffic with Dubai, the airport allows
China Southern to exercise their 5th freedom rights and extend their reach to
important destinations such as Jeddah in Saudi Arabia.
Dubai is also important for China Southern’s transfer passengers, who can switch to
one of the over 150 airlines that currently operate from Dubai International. Popular
onward connections for their passengers include Mehrabad, and London Heathrow.
The tourism sector in 2010 accounted for almost 1% of China’s GDP. Over 13% of
foreign tourists arrive by air. We estimate that tourists travelling with China
Southern through Dubai contribute US$12 million to Chinese GDP. However, with
the international tourism market in China forecast to increase six-fold over the next
20 years10, the connectivity that Dubai offers China Southern is likely to play an
important role in enabling this expansion in tourism to become reality.
10 Based on forecasts from the Oxford Economics Global Macroeconomic Model
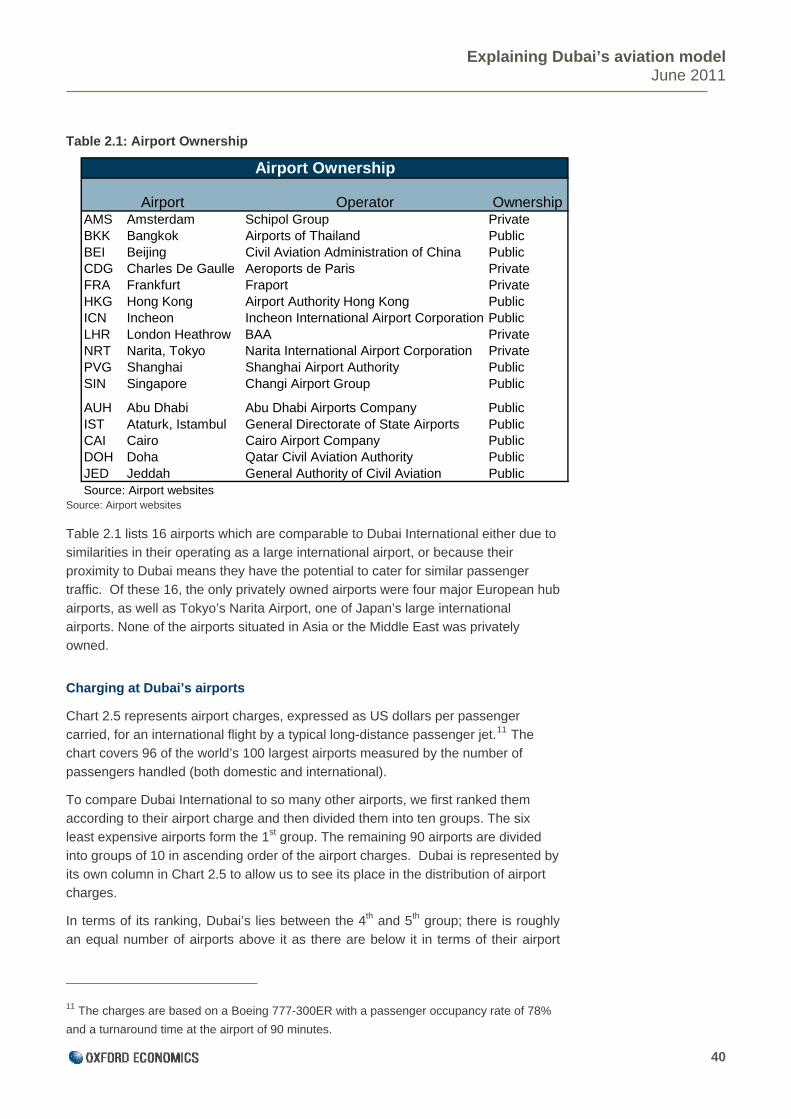
Explaining Dubai’s aviation model June 2011
40
AMS Amsterdam Schipol Group PrivateBKK Bangkok Airports of Thailand Public
Ownership
Airport Ownership
Airport Operator
BEI Beijing Civil Aviation Administration of China Public
International Airport Corporation PrivatePVG Shanghai Shanghai Airport Authority Public
PublicDOH Doha Qatar Civil Aviation Authority Public
CDG Charles De Gaulle Aeroports de Paris PrivateFRA Frankfurt Fraport PrivateHKG Hong Kong Airport Authority Hong Kong PublicICN Incheon Incheon International Airport Corporation PublicLHR London Heathrow BAA PrivateNRT Narita, Tokyo Narita
SIN Singapore Changi Airport Group Public
AUH Abu Dhabi Abu Dhabi Airports Company PublicIST Ataturk, Istambul General Directorate of State Airports PublicCAI Cairo Cairo Airport Company
JED Jeddah General Authority of Civil Aviation PublicSource: Airport websites
Table 2.1: Airport Ownership
able 2.1 lists 16 airports which are comparable to Dubai International either due to
er
Charging at Dubai’s airports
Chart 2.5 represents airport charges, expressed as US dollars per passenger carried, for an international flight by a typical long-distance passenger jet.11 The chart covers 96 of the world’s 100 largest airports measured by the number of
passengers handled (both domestic and international).
To compare Dubai International to so many other airports, we first ranked them according to their airport charge and then divided them into ten groups. The six least expensive airports form the 1st group. The remaining 90 airports are divided
into groups of 10 in ascending order of the airport charges. Dubai is represented by its own column in Chart 2.5 to allow us to see its place in the distribution of airport charges.
In terms of its ranking, Dubai’s lies between the 4th and 5th group; there is roughly
an equal number of airports above it as there are below it in terms of their airport
Source: Airport websites
T
similarities in their operating as a large international airport, or because their proximity to Dubai means they have the potential to cater for similar passengtraffic. Of these 16, the only privately owned airports were four major European hub
airports, as well as Tokyo’s Narita Airport, one of Japan’s large international airports. None of the airports situated in Asia or the Middle East was privately owned.
11 The charges are based on a Boeing 777-300ER with a passenger occupancy rate of 78%
and a turnaround time at the airport of 90 minutes.

Explaining Dubai’s aviation model June 2011
41
c
0
20
40
60
80
100
120
10th 9th 8th 7th 6th 5th Dubai 4th 3rd 2nd 1st
Landing charges Passenger charges
US$ per passenger
harges. Given its ranking, Dubai can be described as a typical or average airport
Chart 2.5: Airport charges at Dubai International and 96 of the world’s largest airports, 2010 (a)
om ) The chart reports the average airport charge for ten groups of airports. The average charge for
ges
Chart 2.5 also illustrates the split between landing charges and passenger charges. landing, air traffic control, and noise and emission
charges; the latter covers security, infrastructure and passengers taxes.
is
average landing charge
does not exceed US$20 per passenger for any of the ten groups. In other words,
own in Chart 2.6, so that a comparison of the two charts shows how
taxation distorts airports’ relative competitiveness. Among t ost costly
removed, the distribution of airport charges appears much more uniform than in
Chart 2.5. For the airports in the 10th group, airport charges are significantly
with respect to its charges.
Source: Airport Charges.c(athe ten most expensive airports is shown by the column labeled 10th (group); the column labeled 9th, shows the average charge for the next ten most expensive airports; and so on until, the last group (1st ) contains the six least expensive airports. Dubai International is shown separately.
It is clear from this chart that the distribution of airport charges across the ten groups is highly skewed: the level of charges for the 8th, 9th and 10th groups –
covering the 30 most expensive airports – is much higher than the level of charfor the remaining groups.
The former covers charges for
When compared to the distribution for the total charge, it is a striking feature of thchart that landing charges (the dark blue component in each column) are muchmore evenly distributed across the ten groups. In fact, the
the high charges levied by the most expensive airports are almost entirely accounted for by the passenger charges (including taxes).
Looking at passenger charges in more detail, Chart 2.6 shows the distribution of
airport charges excluding government taxes. The airports are arranged in the samegroups as sh
he 10 m
airports (10th group), taxes account for over half the total charge, and around 10% of the total charge for 20 airports in the 8th and 9th groups. With these taxes
increased through taxation, undermining the competitiveness of these airports to the detriment of the aviation sector in their countries.

Explaining Dubai’s aviation model June 2011
42
0
20
40
60
80
100
120
10th 9th 8th 7th 6th 5th Dubai 4th 3rd 2nd 1st
Landing charges Passenger charges exluding Govt Taxes
US$ per
Chart 2.6: Airport charges, excluding government taxes 2010
passenger
Source: Airport Charges.com
Among the remaining airports (7th through to the 1st group), relative charges appear much less distorted by taxation, with the ranking of airports in Chart 2.6 largely
t
ered as peers. The charges at these 16 equivalent
most of
unaffected by having taxation removed. Likewise, Dubai’s position, placed between
the 4th and 5th groups also remains unchanged. So although heavy taxation is a serious issue for a sizable minority of airports, competition among the majority of
ernational airports, including Dubai International, is conducted on a level playing in
field.
In Table 2.1, 16 airports are listed which are comparable to Dubai International because either they are large international hub airports or they are situated sufficiently nearby to be consid
airports are compared with Dubai’s in Chart 2.7. When contrasted, Dubai International is amongst the least expensive of these airports, with only Jeddah, Shanghai and Abu Dhabi having lower charges. However, the charges at
these airports are very similar, with eleven airports having a total charge of less than US$35 per passenger (recall that Dubai International’s charge is US$25 per passenger). Charges for the remaining six most expensive airports are generally
much higher. The highest airport charge among the sample of 96 airports was at London Heathrow where airport charges were US$126 per passenger.
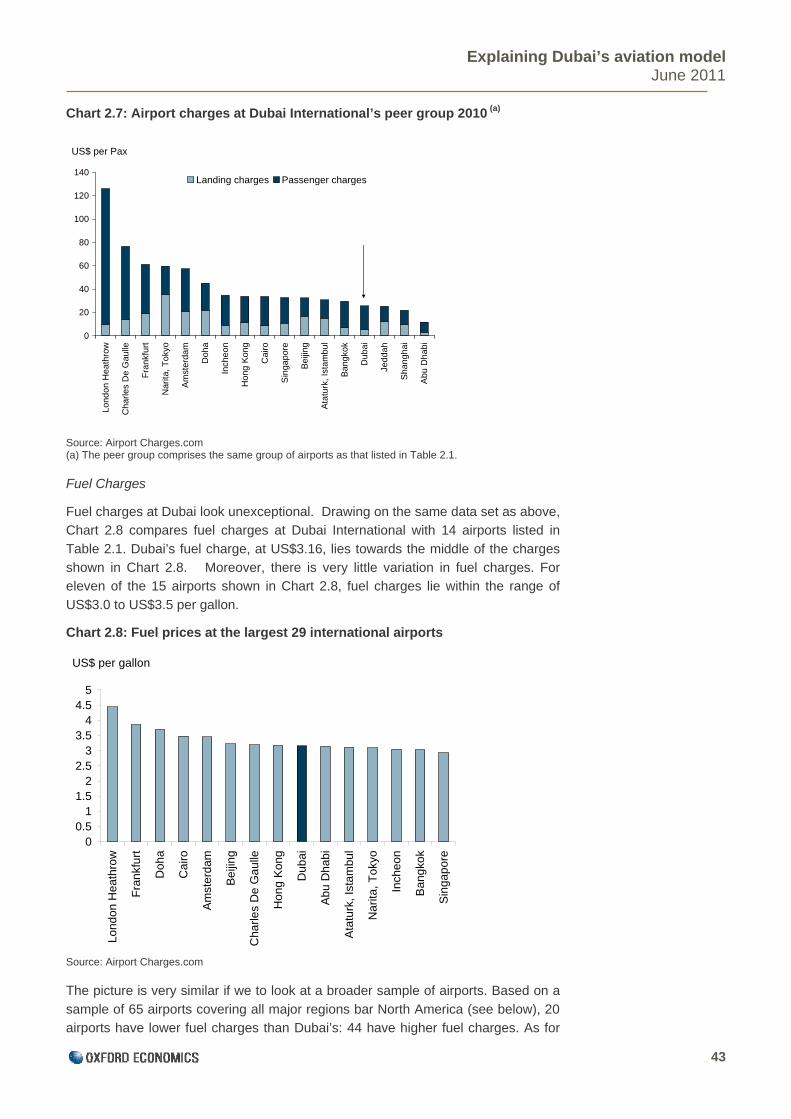
Explaining Dubai’s aviation model June 2011
43
0
20
40
60
80
100
120
140
Lo
nd
on
He
ath
row
Ch
arl
es
De
Ga
ulle
Fra
nkf
urt
Na
rita
, T
oky
o
Am
ste
rda
m
Doh
a
Inch
eo
n
Ho
ng
Ko
ng
Cai
ro
Sin
gapo
re
Be
ijin
g
Ata
turk
, Is
tam
bu
l
Ba
ng
kok
Dub
ai
Jed
da
h
Sh
an
gh
ai
Ab
u D
ha
bi
Landing charges Passenger charges
US$ per Pax
00.5
1
Lon
don
He
ath
row
Fra
nkf
urt
Doh
a
Cai
ro
Am
ste
rda
m
Be
ijin
g
Cha
rles
De
Ga
ulle
Ho
ng
Kon
g
Dub
ai
Ab
u D
hab
i
Ata
turk
, Is
tam
bul
Na
rita
, To
kyo
Inch
eon
Ban
gko
k
Sin
gap
ore
(a)
) The peer group comprises the same group of airports as that listed in Table 2.1.
in
es
f the 15 airports shown in Chart 2.8, fuel charges lie within the range of
Source: Airport Charges.com
The picture is very similar if we to look at a broader sample of airports. Based on a
sample of 65 airports covering all major regions bar North America (see below), 20 airports have lower fuel charges than Dubai’s: 44 have higher fuel charges. As for
Chart 2.7: Airport charges at Dubai International’s peer group 2010
Source: Airport Charges.com (a
Fuel Charges
Fuel charges at Dubai look unexceptional. Drawing on the same data set as above, Chart 2.8 compares fuel charges at Dubai International with 14 airports listed
Table 2.1. Dubai’s fuel charge, at US$3.16, lies towards the middle of the chargshown in Chart 2.8. Moreover, there is very little variation in fuel charges. Foreleven o
1.52
2.53
3.54
4.55
US$ per gallon
US$3.0 to US$3.5 per gallon.
Chart 2.8: Fuel prices at the largest 29 international airports

Explaining Dubai’s aviation model June 2011
44
the variation of fuel charges, 62 of the 65 airports had a fuel charge within the range
one airport to
price data, op US airports
es/taxes that
arison is based orts this is
vel of fuel prices
cate (1) ) and the fuel
t from BP, Shell,
Exxonmobil at
nt of Dubai owns the emirate’s major airports and airlines. There is
of a small number of senior individuals in reach decisions
ntrasting it to the
erating margins.12
on 10 May. into our analysis, our findings
tural disasters continued in many parts of
s, Emirates
of US$3.0 to US$3.5 per gallon.
The data suggests that fuel charges generally do not vary much from
the next. We did however encounter several problems with the fuelwhich we think justifies caution in interpreting the data. We had to drfrom the comparison because the data was reported inclusive of charg
prevented them being compared with the other airports. The compon charges in mid-March. As we are interested in the variation across airpnot a particular problem, but the reader should be aware that the le
will vary over time. Despite these caveats, we feel that the data does indithat fuel charges are quite similar across many large airports and (2charges at Dubai are in this respect quite typical.
Emirates purchases fuel uplifted at Dubai International Airpor
Chevron, ENOC and Emojet – a joint venture between Emarat andcommercial market rates.
Consensus based approach to investment
The governmenothing unusual in this, as public ownership of airports is very common across the
world, and many countries also either own or support their home airlines.
What is more unusual is the awareness by the government of how important its aviation sector is to the emirate’s economic development. This awareness manifests itself in effective decision making that is results-focused. Another
advantage flows from the abilitygovernment and in the aviation sector to maintain close contact anduickly. q
Efficient operations
In this section, we examine Emirates operating performance by co
revenue generated by other airlines, along with their costs and op
Financial results for 2010/11
Emirates released its annual report for the financial year 2010/11 Although its release came too late for the data to be incorporatedthe information contained in the latest numbers is consistent with
(below). It was a difficult year for all airlines. A number of severe nadisrupted global air transport services, political instability the world and jet fuel prices rose sharply. Despite these problem
12 The airlines companies covered in this section and the airlines they operate are listed in
ox 2.3 (page 59). The financial data reported in this section refer to company results B
unless otherwise stated. Many of the companies have business interests that extend
beyond airline operations. For Lufthansa, the financial data refer to its Passenger Airline
Group and Logistics businesses.

Explaining Dubai’s aviation model June 2011
45
Africa Middle East
Chart 2.9: Emirates’ revenue by region, FY2009/10 (a)
11%
West Asia/Indian
Ocean13%
12%
East Asia & Australasia
28%
Americas
Europe27%
e year), reflecting strong growth in passenger
in revenue. Over three quarters
as earned through its Europe, East Asia and Australasia routes (see Chart 2.9); a quarter coming from South Asia and Africa markets; and a
further tenth from the Americas. In total, these regions account for close to 90% of
Singapore Airlines, Thai Airways, British Airways, American Airlines, United Airlines14, Lufthansa, Air France-KLM, Qantas, SriLankan Airlines, Malaysia
9%
Source: Emirates (a) Financial year ending March 2010
To help us to evaluate Emirates’ operating performance, we compare Emirates to a panel of 13 other airline companies. These companies are: Cathay Pacific,
reported its highest profit in its 25 year history. Profitability was driven by strong revenue growth (25% higher on th
numbers (revenue per passenger kilometre (RPKM) increased by 16.0% on the year), a 80% passenger seat factor, the highest in the airline’s history, and a rebound in the Cargo business as world trade improved (tonnage increased 12% on
the year). The Annual Report, marking the company’s silver jubilee, is able to report that the airline has become the world’s largest airline by scheduled international passenger-kilometres flown.
Comparison of airline revenues
In FY2009/10, Emirates generated US$11.8 billion
of this revenue was earned through its passenger operations, with its cargo business accounting for most of the remainder.13
Over half of this revenue w
Emirates’ total revenue.
13 Emirate’s air freight division is called Emirates SkyCargo.
14 Throughout this section data for United Airlines refers to financial year ending Decembe
2009 and therefore does not include
r
Continental Airlines.

Explaining Dubai’s aviation model June 2011
46
555
308287 283
267
225198 188
106 95
374398
0
100
200
300
500
Luft
hans
a
Uni
ted
Air
line
s
Cat
hay
Pac
ific
Em
irate
s
Qan
tas
Brit
ish
Airw
ays
Air
Fra
nce
-KLM
Am
eric
anA
irlin
es
Sin
gapo
reA
irlin
es
Tha
i Airw
ays
Jet
Airw
ays
Mal
ays
iaA
irlin
es
SriL
anka
nA
irlin
es
Air
Indi
a
ay lines.15 Most of the Asian airlines – Jet Airways, Thai
irways, Malaysia Airlines and SriLankan Airlines and Air India – have much lower
stands out as earning high revenue per employee oted that this relates to their Passenger
ployee productivity.
Source: Airlines’ annual reports (a) Converted to US$ using average exchange rate for the relevant financial year. (b) Malaysia Airlines refers to year ending December 2009 the most recent results available (c) Lufthansa and Emirates relate to their airline operations only
Another way to compare the performance of different airlines is to make allowance for differences in sizes of their fleets. With larger airlines able to generate more
solute terms, a better comparison is based on revenue generation
e measure of fleet size is available seat kilometres es account of differences in aircraft seating capacity as well as
Airlines, Air India, and Jet Airways. Many of these companies operate several airlines. Singapore Airlines, for instance, includes its namesake, together with SIA
Cargo and SilkAir. The 13 companies in total operate 38 airlines. A list of the airlines is given in Box2.3 at the end of this Section.
Chart 2.10 shows the revenue earned per employee, for both Emirates together with the 13 other airline companies in our panel. In 2010, Emirates generated
$398,000 in revenue per employee, which is comparable to airlines such as CathPacific, Qantas and United AirA
revenue per employee. Lufthansa of US$555,000, although it should be nAirline Group and Logistics Divisions only. These differences will reflect a number of
factors such as average air fares, passenger seat factors, the number of passengers for each member of cabin staff, and em
600
US$ (000s)
Chart 2.10: Revenue per employee, financial year ending 2010(a) (b) (c)
428 419400
revenues in ab
per unit of ‘fleet size’. An intuitiv(ASKM). ASKM takthe distances flown. Comparing airlines on the basis of the revenues per ASKM
(RASKM) provides a better gauge of their relative financial performance thancomparing their headline results.
15 ny’s financial year
009 data.
Throughout the remainder of this section, 2010 refers to each compa
ending in 2010. The figures reported related to the financial year 2010 for all but one
airline, Malaysia Airlines, for which we use financial year 2
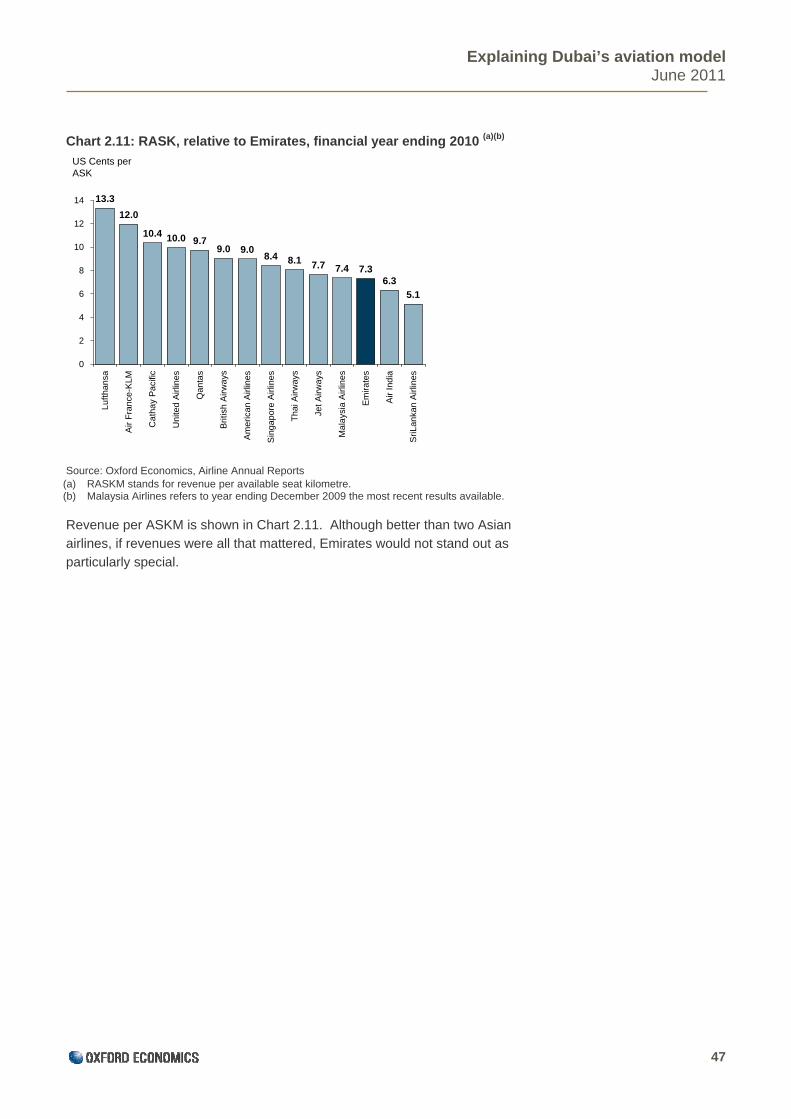
Explaining Dubai’s aviation model June 2011
47
US Cents per ASK
Chart 2.11: RASK, relative to Emirates, financial year ending 2010 (a)(b)
13.3
12.0
10.4 10.0 9.79.0
8.1
5.1
6.37.37.47.7
8.49.0
0
2
4
6
8
10
12
14
Lu
Air
Fr
Ca
tha
Un
ited
A
Br
Am
Sin
ga
po
re A
T
Ma
la
Sri
La
nka
n A
irlin
es
fth
an
sa
ance
-KLM
y P
a irlin
es
Qa
nta
s
itish
Air
wa
ys
eri
can
Air
line
s
irlin
es
ha
i Air
wa
ys
Jet
Air
w
ysia
Air
line
s
Em
ira
tes
Air
Ind
ia
cific ays
Source: Oxford Economics, Airline Annual Reports (a) RASKM stands for revenue per available seat kilometre. (b) Malaysia Airlines refers to year ending December 2009 the most recent results availa
Revenue per ASKM is shown in Chart 2.11. Although better than airlines, if revenues were all that mattered, Emirates would not standparticularly special.
ble.
two Asian out as
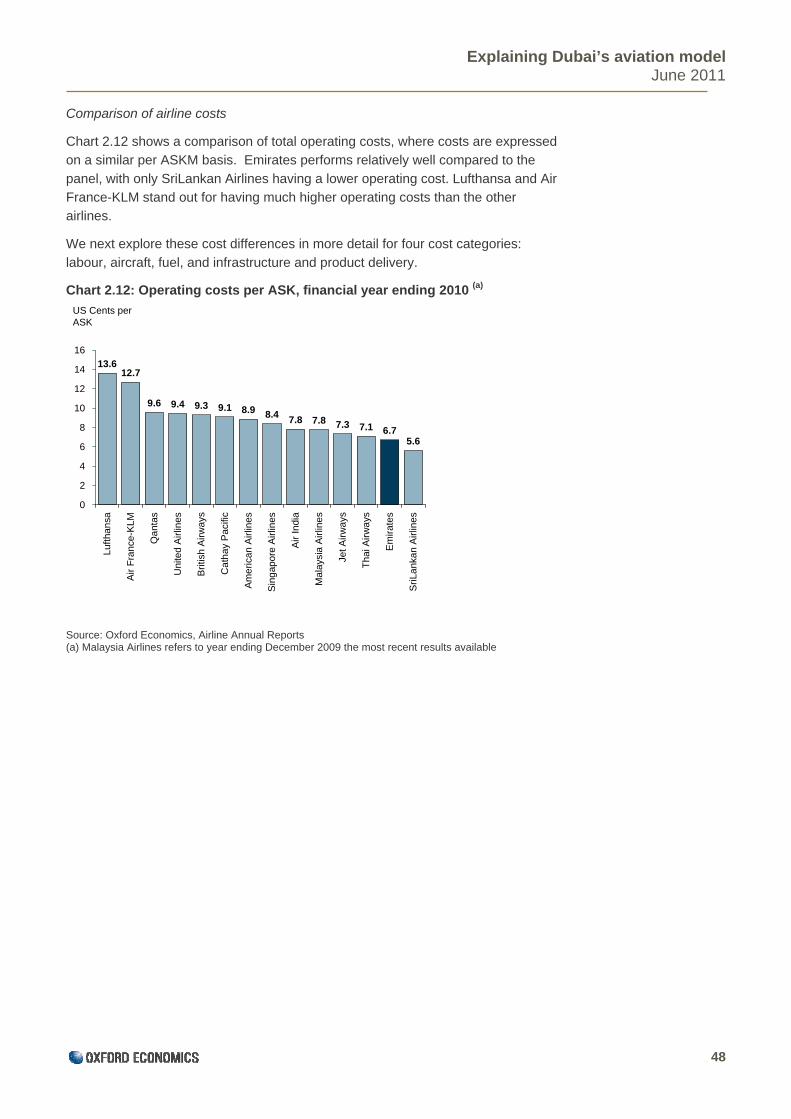
Explaining Dubai’s aviation model June 2011
48
Comparison of airline costs
ressed mpared to the
sa and Air the other
es:
(a)
Source: Oxford Economics, Airline Annual Reports (a) Malaysia Airlines refers to year ending December 2009 the most recent results available
Chart 2.12 shows a comparison of total operating costs, where costs are expon a similar per ASKM basis. Emirates performs relatively well co
panel, with only SriLankan Airlines having a lower operating cost. LufthanFrance-KLM stand out for having much higher operating costs thanairlines.
We next explore these cost differences in more detail for four cost categori
labour, aircraft, fuel, and infrastructure and product delivery.
Chart 2.12: Operating costs per ASK, financial year ending 2010
13.612.7
9.6 9.4 9.3 9.1 8.9 8.4
5.66.77.17.37.87.8
0
2
4
6
8
10
12
14
16
Br Ca
th
Am
eric
Sin
gap
o
Mal
ays Je
SriL
ank
a
US Cents per ASK
Lufth
ansa
Air
Fra
nce-
KLM
Qa
ntas
Uni
ted
Air
lines
itish
Airw
ays
ay P
aci
fic
an A
irlin
es
re A
irlin
es
Air
Indi
a
ia A
irlin
es
t Airw
ays
Tha
i Airw
ays
Em
irat
es
n A
irlin
es

Explaining Dubai’s aviation model June 2011
49
In Chart 2.13, each category
2.01
0.45
0.85
0.69
0.02
0
0.5
1
1.5
2
2.5
Labour Aircraft Fuel Infrastructure &Productdelivery
4-Peer Average
US Cents per ASK
is represented by a column that shows the difference
5 ASKM). There were very slight differences in infrastructure and product
es.
between Emirates’ cost and the average cost for these four airlines. The chart
shows that these four airlines had for these four cost categories an overall cost that was 2.01 US cents per ASKM above Emirates (right-hand column in Chart 2.13). This overall difference was mostly explained by higher aircraft costs (0.85 cents per
ASKM), higher fuel costs (0.69 cents per ASKM), and higher labour costs (0.4cents per delivery (0.02 cents per ASKM).
We look at labour, aircraft and fuel costs in turn.
Chart 2.13: Cost differentials (a)
Source: Oxford Economics, Airline Annual Reports (a) The four airlines are Singapore Airlines, Cathay Pacific, Thai Airways, and Malaysia Airlin.

Explaining Dubai’s aviation model June 2011
50
Labour costs
Labour costs vary considerably across airlines (Chart 2.14). This shows average labour cost per employee (expressed in US$) for Emirates and the 13 other airlines.
The most striking feature of this chart is the disparity between the level of labour
costs among the European, and North American airlines and the rest. Whereas labour costs averaged US$ 94,575 per employee for the five airlines from those regions, labour costs averaged arou
nd half of this amount (US$49,510) for the 16 s a relatively high labour
third lower than the average for ican carriers. It is clear that geography plays an
portant role(the level of wa
Emirates andUS$45,000 resp
of their historothers. With compaon recruiting
invariably murelocate overse
Chart 2.14:
Source: Oxford Economics, Airline Annual Reports (a) Malaysia Airlines refers to year ending December 2009 the most recent results available
Aircraft costs
remaining eight airlines. Even Cathay Pacific which hacost for an Asian airline has labour costs around athe five European and North Amer
im in determining labour costs, reflecting local labour market conditions g s, unionisation etc) in airlines’ home countries.
Singapore Airlines have very similar labour costs at US$47,000 and ectively. These two airlines, which have much in common in terms
y and business models (see Box 2.2), stand somewhat apart from the ratively small populations in their home countries, they must rely
staff from abroad: a relatively expensive strategy as foreign staff
st be offered attractive remuneration packages to induce them to as.
Labour cost per employee, financial year ending 2010 (a)
e
110100
65
47 45
3424 23
17
47
0
20
40
100
120
Lufth
ansa
Air
Fra
nce-
KLM
Qa
ntas
Uni
ted
Air
lines
Am
eric
an A
irlin
es
Brit
ish
Airw
ays
Ca
thay
Pa
cific
Tha
i Airw
ays
Em
irat
es
Sin
gap
ore
Airl
ines
Mal
aysi
a A
irlin
es
Air
Indi
a
Jet A
irway
s
SriL
ank
an A
irlin
es
Labour cost per employee(US$ 000s)
92 92 888077
60
16 These are weighted average across the airlines using (employment as weights), to reflect
differences in the size of the various airlines.
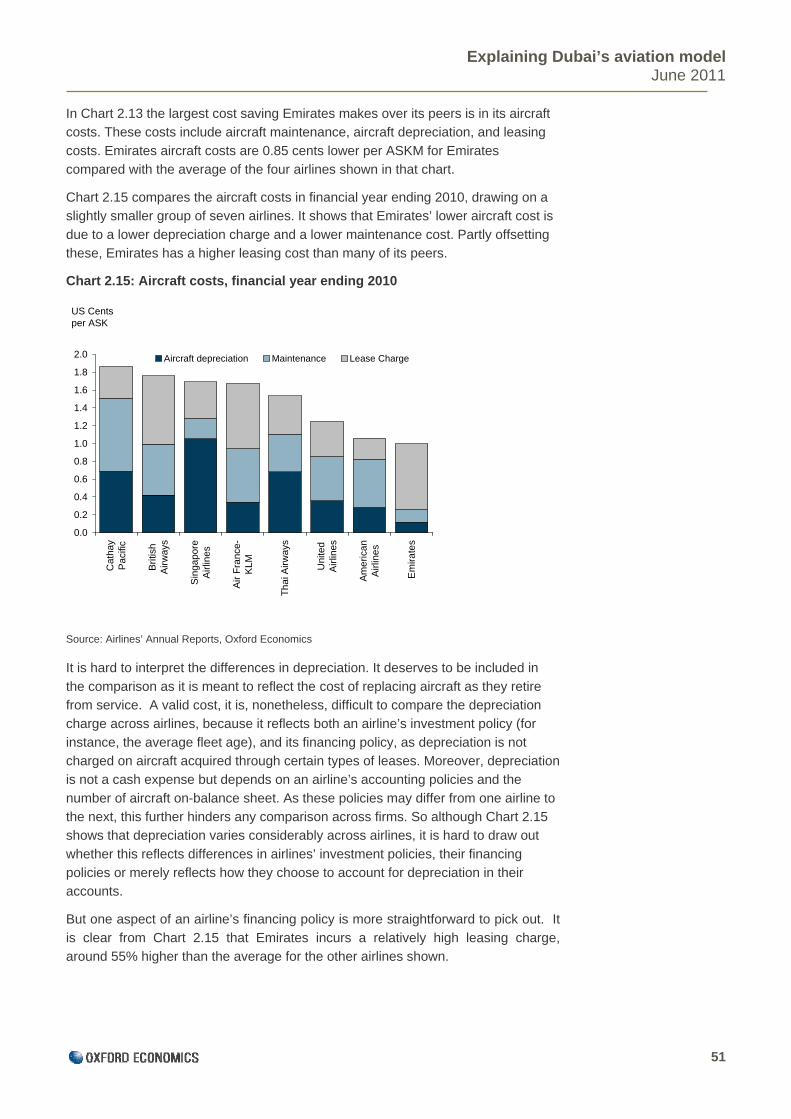
Explaining Dubai’s aviation model June 2011
51
In Chart 2.13 the largest cost saving Emirates makes over its peers is in its aircraft
t is
g
be included in
g aircraft as they retire are the depreciation
nt policy (for
tion is not er, depreciation s and the
m one airline to ugh Chart 2.15
, it is hard to draw out
financing e to account for depreciation in their
rline’s financing policy is more straightforward to pick out. It
is clear from Chart 2.15 that Emirates incurs a relatively high leasing charge, around 55% higher than the average for the other airlines shown.
costs. These costs include aircraft maintenance, aircraft depreciation, and leasing
costs. Emirates aircraft costs are 0.85 cents lower per ASKM for Emirates compared with the average of the four airlines shown in that chart.
Chart 2.15 compares the aircraft costs in financial year ending 2010, drawing on a slightly smaller group of seven airlines. It shows that Emirates’ lower aircraft cos
due to a lower depreciation charge and a lower maintenance cost. Partly offsettinthese, Emirates has a higher leasing cost than many of its peers.
Chart 2.15: Aircraft costs, financial year ending 2010
US Cents per ASK
0.6
0.8
1.0
1.2
1.4
1.6
1.8
2.0 Aircraft depreciation Maintenance Lease Charge
0.0
y
0.2
0.4
Cat
haP
acifi
c
Bri
tish
Airw
ays
Sin
gapo
reA
irlin
es
Air
Fra
nce-
KLM
Th
ai A
irway
s
Uni
ted
Air
line
s
Am
eric
an
Airl
ine
s
Em
irate
s
Source: Airlines’ Annual Reports, Oxford Economics
It is hard to interpret the differences in depreciation. It deserves to
the comparison as it is meant to reflect the cost of replacinfrom service. A valid cost, it is, nonetheless, difficult to compcharge across airlines, because it reflects both an airline’s investme
instance, the average fleet age), and its financing policy, as depreciacharged on aircraft acquired through certain types of leases. Moreovis not a cash expense but depends on an airline’s accounting policie
number of aircraft on-balance sheet. As these policies may differ frothe next, this further hinders any comparison across firms. So althoshows that depreciation varies considerably across airlines
er this reflects differences in airlines’ investment policies, their wheth
policies or merely reflects how they choosaccounts.
But one aspect of an ai

Explaining Dubai’s aviation model June 2011
52
Chart 2.1517 compares the cost of aircraft leasing across airlines. Leases are acommon way for airlines to acquire aircraft. Airlines use various types of leases an
the numbers shown in Chart 2.15 reflect the cost from all types oDepending on the type of lease, lessors can either be major finan
d
f leases. cial institutions
f aircraft in the industry. In
among other benefits to these types
lity in managing it
arge. This is one rs a new and
rt 2.15). A modern
cted in a
ccessful at
ng high levels kan Airlines
rate lower revenues than their peers.
such as banks, or specialised aircraft leasing companies. Leases vary considerably
in their terms, and airlines can pay more if they wish to return aircraft after a few years or wish to retain the flexibility to do so (operating leases typically providethese types of benefits over finance leases).
At 69 months, Emirates’ has one of the youngest fleets o
part, this will reflect the fleet’s recent expansion, but operating leases, having a high proportion of the fleet financed throughof leases (around 71%) should provide Emirates with more flexibi
fleet age in the future. It pays for this privilege in a higher lease chof the costs that Emirates accepts for being able to offer its passengefully modern fleet.
Maintenance costs
A relatively young fleet of aircraft requires less maintenance (Cha
fleet also benefits from the latest advances in fuel economy. This is reflerelatively low fuel cost per ASKM (see Chart 2.13), but also has valuable environmental benefits as well.
Airline operating margins
We have seen airlines such as Lufthansa and Air France-KLM are su
generating high revenues. They achieve this, however, through incurriared to other airlines. Other airlines, exemplified by SriLanof cost comp
and Malaysia Airlines contain costs but gene
17 United Airlines data excludes Continental Airlines
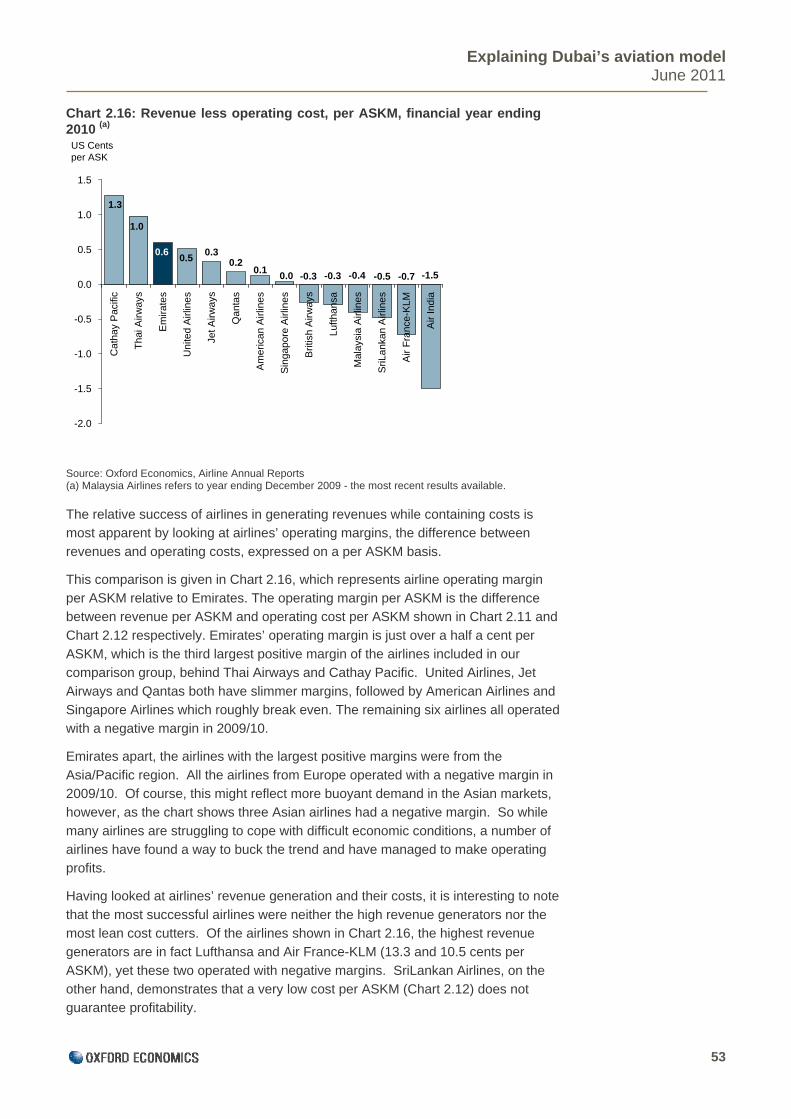
Explaining Dubai’s aviation model June 2011
53
Chart 2.16: Revenue less operating cost, per ASKM, financial year ending 2010 (a)
Source: Oxford Economics, Airline Annual Reports (a) Malaysia Airlines refers to year ending December 2009 - the most recent results available.
The relative success of airlines in generating revenues while containing comost apparent by looking at airlines’ o
sts is perating margins, the difference between
sts, expressed on a per ASKM basis.
ASKM, which is the third largest positive margin of the airlines included in our comparison group, behind Thai Airways and Cathay Pacific. United Airlines, Jet
Airways and Qantas both have slimmer margins, followed by American Airlines and Singapore Airlines which roughly break even. The remaining six airlines all operated with a negative margin in 2009/10.
Emirates apart, the airlines with the largest positive margins were from the
Asia/Pacific region. All the airlines from Europe operated with a negative margin in 2009/10. Of course, this might reflect more buoyant demand in the Asian markets, however, as the chart shows three Asian airlines had a negative margin. So while
many airlines are struggling to cope with difficult economic conditions, a number of airlines have found a way to buck the trend and have managed to make operating profits.
Having looked at airlines’ revenue generation and their costs, it is interesting to note
that the most successful airlines were neither the high revenue generators nor the most lean cost cutters. Of the airlines shown in Chart 2.16, the highest revenue generators are in fact Lufthansa and Air France-KLM (13.3 and 10.5 cents per
ASKM), yet these two operated with negative margins. SriLankan Airlines, on the other hand, demonstrates that a very low cost per ASKM (Chart 2.12) does not guarantee profitability.
revenues and operating co
This comparison is given in Chart 2.16, which represents airline operating marginper ASKM relative to Emirates. The operating margin per ASKM is the difference between revenue per ASKM and operating cost per ASKM shown in Chart 2.11 and
Chart 2.12 respectively. Emirates’ operating margin is just over a half a cent per
0.30.6
1.0
1.3
0.5
1.0
1.5
US Cents per ASK
-1.5-0.7-0.5-0.4-0.3-0.30.00.1
0.2
-1.5
-1.0
-0.5
0.0
Cat
hay
Pac
ific
Tha
i Airw
ays
Em
irate
s
Uni
ted
Air
line
s
Jet A
irway
s
Qan
tas
Am
eric
an
Air
line
s
Sin
gap
ore
Airl
ine
s
Brit
ish
Airw
ays
Lufth
ansa
Mal
aysi
a A
irlin
es
SriL
anka
n A
irlin
es
Air
Fra
nce-
KLM
Air
Indi
a
0.5
-2.0
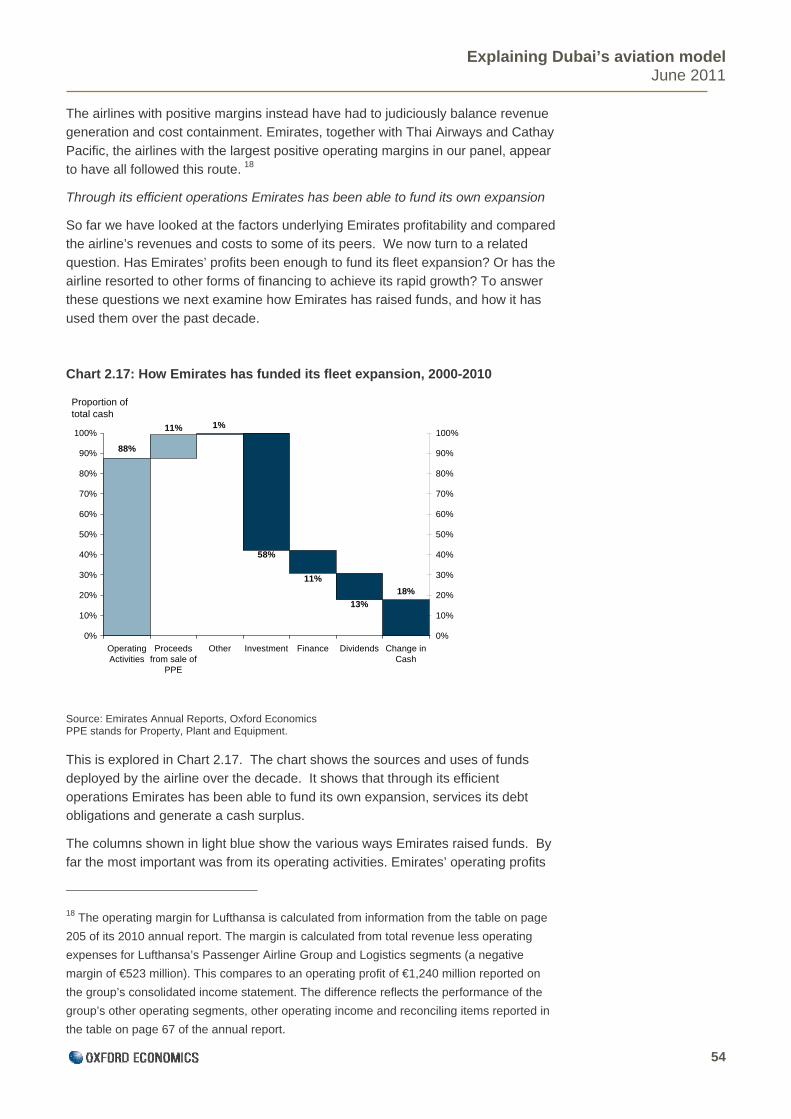
Explaining Dubai’s aviation model June 2011
54
The airlines with positive margins instead have had to judiciously balance revenuegeneratio
n and cost containment. Emirates, together with Thai Airways and Cathay
panel, appear
xpansion
pared rn to a related
sion? Or has the th? To answer
s, and how it has
10
t.
ds
Pacific, the airlines with the largest positive operating margins in ourto have all followed this route. 18
Through its efficient operations Emirates has been able to fund its own e
So far we have looked at the factors underlying Emirates profitability and comthe airline’s revenues and costs to some of its peers. We now tu
question. Has Emirates’ profits been enough to fund its fleet expanairline resorted to other forms of financing to achieve its rapid growthese questions we next examine how Emirates has raised fund
used them over the past decade.
Chart 2.17: How Emirates has funded its fleet expansion, 2000-20
Source: Emirates Annual Reports, Oxford Economics PPE stands for Property, Plant and Equipmen
This is explored in Chart 2.17. The chart shows the sources and uses of fundeployed by the airline over the decade. It shows that through its efficient
operations Emirates has been able to fund its own expansion, services its debt obligations and generate a cash surplus.
The columns shown in light blue show the various ways Emirates raised funds. By far the most important was from its operating activities. Emirates’ operating profits
18 The operating margin for Lufthansa is calculated from information from the table on page
205 of its 2010 annual report. The margin is calculated from total revenue less operating
expenses for Lufthansa’s Passenger Airline Group and Logistics segments (a negative
margin of €523 million). This compares to an operating profit of €1,240 million reported on
the group’s consolidated income statement. The difference reflects the performance of th
group’s other operating segment
e
s, other operating income and reconciling items reported in
the table on page 67 of the annual report.
1%11%
88%
70% 70%
80%
90%
100%
80%
90%
100%
Proportion of total cash
58%40%
50%
60%
40%
50%
60%
13%
11%
18%
0%
10%
20%
30%
OperatingActivities
Proceedsfrom sale of
PPE
Other Investment Finance Dividends Change inCash
0%
10%
20%
30%

Explaining Dubai’s aviation model June 2011
55
after allowance is made for non-cash expenses such as depreciation and the need to fund changes in working capital (such as inventory, and accounts receivable).
Operating activities accounted for over 88% of the total funds raised, with asset sales (11%) accounting for most of the remainder.
The columns shown in dark blue depict the uses to which these funds were put. These funds must cover the firm’s investment and pay its investors and creditors.
Each of these absorbed 58%, 13% and 11% respectively of the funds that Emirates generated over the course of the decade. The remaining item, shown as the last column on the right in Chart 2.17, is the increase in the company’s liquid reserves
cash and other financial investments that can be converted into cash at short notice.
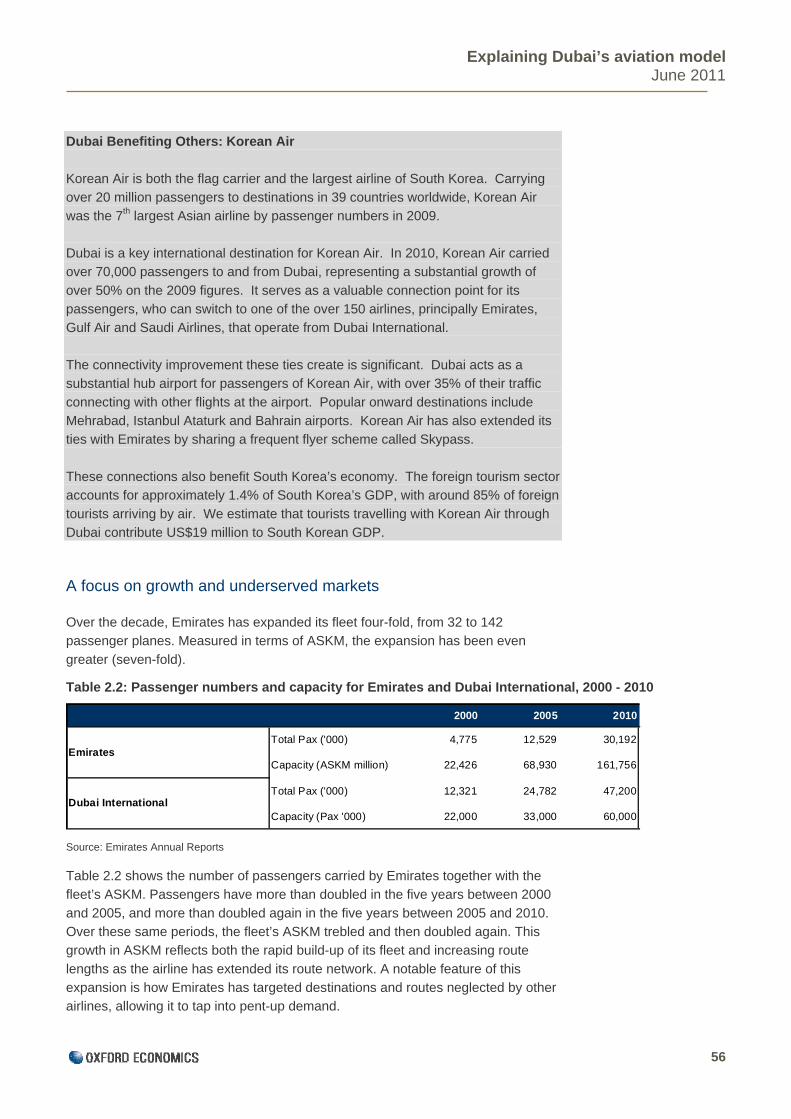
Explaining Dubai’s aviation model June 2011
56
Dubai Benefiting Others: Korean Air
Korean Air is both the flag carrier and the largest airline of South Korea. Carrying
over 20 million passengers to destinations in 39 countries worldwide, Korean Air
was the 7th largest Asian airline by passenger numbers in 2009.
Dubai is a key international destination for Korean Air. In 2010, Korean Air carried
over 70,000 passengers to and from Dubai, representing a substantial growth of
over 50% on the 2009 figures. It serves as a valuable connection point for its
passengers, who can switch to one of the over 150 airlines, principally Emirates,
Gulf Air and Saudi Airlines, that operate from Dubai International.
The connectivity improvement these ties create is significant. Dubai acts as a
substantial hub airport for passengers of Korean Air, with over 35% of their traffic
connecting with other flights at the airport. Popular onward destinations include
Mehrabad, Istanbul Ataturk and Bahrain airports. Korean Air has also extended its
ties with Emirates by sharing a frequent flyer scheme called Skypass.
These connections also benefit South Korea’s economy. The foreign tourism sector
accounts for approximately 1.4% of South Korea’s GDP, with around 85% of foreign
tourists arriving by air. We estimate that tourists travelling with Korean Air through
Dubai contribute US$19 million to South Korean GDP.
A focus on growth and underserved markets
Over the decade, Emirates has expanded its fleet four-fold, from 32 to 142 passenger planes. Measured in terms of ASKM, the expansion has been even
greater (seven-fold).
Table 2.2: Passenger numbers and capacity for Emirates and Dubai International, 2000 - 2010
Source: Emirates Annual Reports
Table 2.2 shows the number of passengers carried by Emirates together with the fleet’s ASKM. Passengers have more than doubled in the five years between 2000
and 2005, and more than doubled again in the five years between 2005 and 2010. Over these same periods, the fleet’s ASKM trebled and then doubled again. This growth in ASKM reflects both the rapid build-up of its fleet and increasing route
lengths as the airline has extended its route network. A notable feature of this expansion is how Emirates has targeted destinations and routes neglected by other airlines, allowing it to tap into pent-up demand.
2000 2005 2010
Total Pax ('000) 4,775 12,529 30,192
Capacity (ASKM million) 22,426 68,930 161,756
Total Pax ('000) 12,321 24,782 47,200
Capacity (Pax '000) 22,000 33,000 60,000
Emirates
Dubai International

Explaining Dubai’s aviation model June 2011
57
As it has grown, so Emirates has accounted for a bigger share of Dubai ning of the decade, Emirates
ngers handled at Dubai International; by the
engers per year.
hrough heavy investment in upgrading its facilities, the airport could handle 60
ght of
ave
ttracted other airlines, with over 150 airlines currently operating out of Dubai.
enger seat
ctor: the cost of operating a plane varies little if fewer seats are filled. If RASKM
es has achieved over the past decade. Although it has varied, it has averaged 76% through this period. An
een its achievement in
er the years.
International’s passenger traffic. At the begin
accounted for around one third of passeend of the decade that had increased to around two thirds.
Dubai Airports has kept up with Emirates’ rapid expansion by expanding its own capacity. In 2000, Dubai International could handle 22 million pass
Tmillion passengers in 2010. Through this investment, Dubai Airports offers airlines and their passengers some of the best facilities in the industry. Added to this,
Emirates has demonstrated that Dubai‘s strategic location within eight hours flimost major destinations, and its attraction as a centre of tourism, trade and commerce, can be turned into a competitive advantage. These strengths h
a
By targeting underserved routes, Emirates has kept its passenger seat factor high
Airlines’ revenues depend on how successful they are in filling their planes with passengers. Other things equal, the higher the passenger seat factor the higher the RASKM. On the other hand, airline costs depend much less on the pass
faare above costs per ASKM, which they are for Emirates, then a decrease in the passenger seat factor will compress any margin between the two, squeezing profits.
The passenger seat factor is an important operating statistic for airlines.
Chart 2.18 shows the passenger seat factor that Emirat
important factor underlying Emirates’ profitability has b
keeping its passenger seat load factor consistently high ov
Chart 2.18: Emirates passenger seat factor
74
75
76
77
78
79
80
Source: Emirates Annual Reports
73
70
71
72
2000/1 2003/4 2006/7 2009/10
Passenger Seat Factor (%)
Source : Emirates

Explaining Dubai’s aviation model June 2011
58
Box 2.1: Emirates financial performance – what other reports have said.
Three major banks, the Royal Bank of Scotland (RBS), UBS and Deutsche Bank
(DB), have written detailed reports on Emirates in recent years. Their conclusions
are summarised below.
RBS19
RBS examined whether the growth plans of Gulf carriers posed a serious threat to
the survival of European network airlines. They concluded that the Gulf carriers
growth was most likely to come from serving fast growing markets in Asia and
Africa and that the major European airlines were not seriously threatened by their
expansion.
In a subsequent report, RBS examined whether the growth in regions such as Asia
and Africa would warrant Emirates plans to bring the total number of A380 super-
jumbos in their fleet to 90, from the 15 currently in operation. Based on the
forecasts published by Airbus and Boeing, they conclude that there is sufficient
market growth to accommodate the planned expansion in Emirates fleet. This
conclusion is in agreement with the results of the analysis presented in Section 3 of
this report.
UBS 20
UBS compared Emirates operating costs with those of European and Asian airlines.
Emirates costs were in line with the more efficient Asian carriers, and were much
lower than the European airlines. This is consistent with the finding presented in
Section 2 of this report.
UBS looked at whether Emirates was benefiting from financial assistance from
government of Dubai. It found no evidence to support this. As explained in Section
2 of this report, we also found no evidence to support this either. Instead, Emirates’
operating profits have been sufficient to fund its fleet expansion, with money left
over to pay out dividends.
UBS concludes that Emirates’ success is down to its young fleet and dynamic
corporate culture, good management (and a government willing to support its
aviation sector), and finally the location of its home hub, Dubai International, that
has allowed it to establish itself in fast growing markets.
Deutsche Bank (DB)21
DB looked at the threat that Emirates poses to major European airlines. It reached a
similar conclusion to RBS, namely that Emirates expansion was most likely to be
‘What would you do with 90 A380s?’ The Royal Bank of Scotland, January 2011.
‘What does Emirates mean for Europe’, UBS, January 2005.
‘Global Airline Sector – Laying the foundation for Global M&A’, Deutsche Bank, January
011.
19
20
21
2

Explaining Dubai’s aviation model June 2011
59
directed at its fastest growing markets. As these fast growing markets are mostly in
Asia and Africa, Emirates did not present a serious threat to the European airlines.
Box 2.2: Dubai and Singapore
In 1937, the history of civil aviation in Dubai began when an air agreement
was signed for a flying boat base for aircraft of Imperial Airways. In the 1940s flying
boats were operated by British Overseas Airways Corporation (BOAC). When the
airport opened in 1960, it was made of compacted sand. In 1965, the airport saw
the opening of an asphalt runway, additions and improvements to major buildings
on site, and the first few visits of large jets. The 1970s brought wide body aircraft
and further airport development. These developments continued throughout the
period, allowing for the eventual handling of Boeing 747 and Concorde aircraft.
Dubai’s second runway opened in 1984.
Over the course of the past decade, Dubai International has developed
substantially. Terminal 2 opened in 1998, followed by Concourse 1 in 2000, and
over the past decade has seen further improvements to its airport runway system
and infrastructure. In 2008, Terminal 3 opened, with Concourse 3 expected to open
towards the end of 2012. These developments will enable the airport to handle 75
million passengers a year, allowing further growth in passenger numbers from their
current level of approaching 50 million.
The success story of aviation in Dubai bears a striking resemblance with that of
Singapore’s during its period of rapid growth that spanned the 1950s up until the
late 1970s. Singapore Airlines started out as government-owned Malaysian Airways
in 1947, before its renaming in 1972. The government of Singapore retains a
majority interest through its investment in the company Tamasek Holdings.
Like Emirates, Singapore Airlines is allowed to operate without government
interference in its commercial decisions. With this model, Singapore Airlines has
grown to have a fleet of 108 aircraft that carries 16.5 million passengers per year.
Emirates has also adopted similar strategies, whereby each airplane can fly from its
home hub nonstop to any major city in the world.
Singapore’s Changi International Airport is publicly owned. In 2010, it handled 40
million passengers, somewhat less than 47 million handled at Dubai International.
Like Dubai today, Singapore developed into a major aviation hub despite having a
relatively small domestic market (the populations of Dubai and Singapore are 2 and
5 million respectively). For both Singapore and Dubai, success in aviation has been
built around its national airline. In the case of Singapore, the strategy was to exploit
the synergy between growth in its national carrier and in its main hub airport.
Importantly, this partnership between airport and airline helped each to commit to
long-term investment projects.
For Dubai, Open Skies is at the heart of this kind of strategy, providing the
connectivity needed to (1) drive its airports’ growth, and (2) increase the potential
market size needed for airlines to grow. But no airline can expect to capitalise on
th is if it is not a formidable competitor. Indeed, this possibly explains why two
airlines are leaders in efficiency, competitiveness, and innovation.
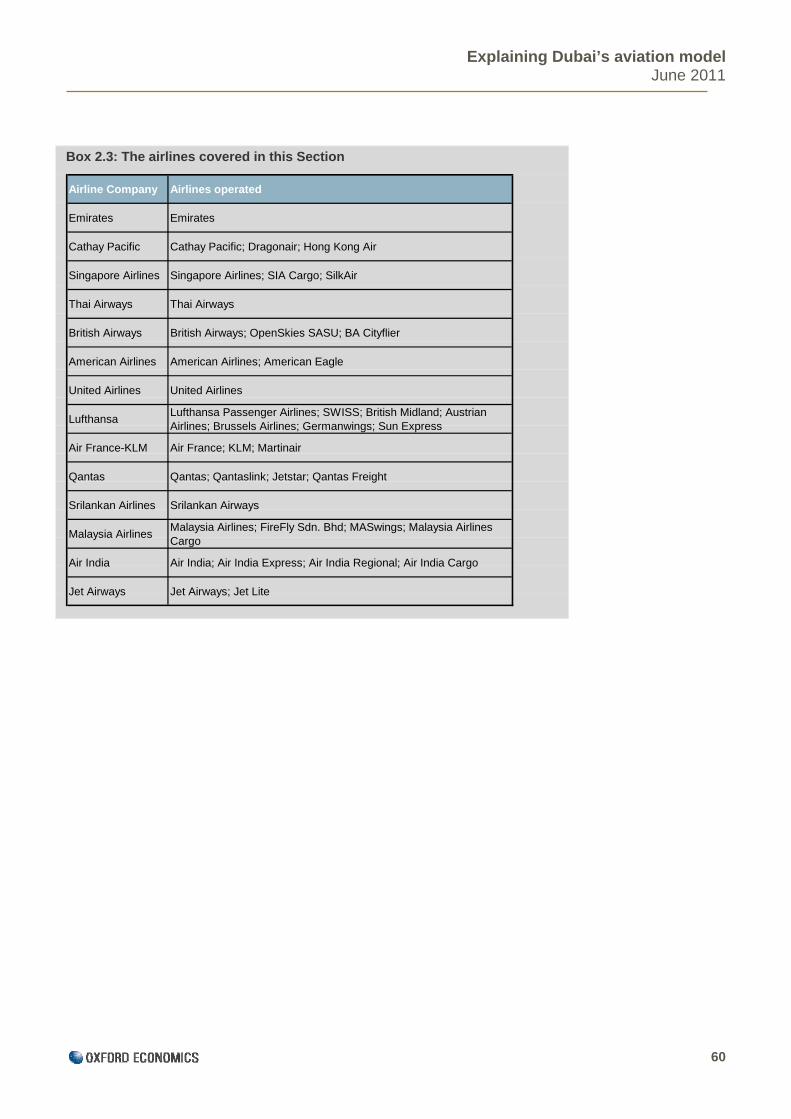
Explaining Dubai’s aviation model June 2011
60
Box 2.3: The airlines covered in this Section
Airline Company Airlines operated
Emirates Emirates
Cathay Pacific Cathay Pacific; Dragonair; Hong Kong Air
Singapore Airlines Singapore Airlines; SIA Cargo; SilkAir
Thai Airways Thai Airways
British Airways British Airways; OpenSkies SASU; BA Cityflier
r; Qantas Freight
American Airlines American Airlines; American Eagle
United Airlines United Airlines
LufthansaLufthansa Passenger Airlines; SWISS; British Midland; Austrian Airlines; Brussels Airlines; Germanwings; Sun Express
Air France-KLM Air France; KLM; Martinair
Qantas Qantas; Qantaslink; Jetsta
Srilankan Airlines Srilankan Airways
Malaysia AirlinesMalaysia Airlines; FireFly Sdn. Bhd; MASwings; Malaysia Airlines Cargo
Air India Air India; Air India Express; Air India Regional; Air India Cargo
Jet Airways Jet Airways; Jet Lite
Explaining Dubai’s aviation model June 2011
61
3 The economic impact of Dubai’s aviation sector in 2020
Key points
Based on our view about the sector’s underlying strengths, and forecasts
for air passenger demand published by Airbus and Boeing, we conclude
that Dubai’s aviation sector will continue to play as important a role in
Dubai’s economy as it currently does.
We calculate that in 2020 the sector will support 373,000 jobs in Dubai and
contribute US$45.4 billion to Dubai’s GDP (at 2010 prices). To give a
sense of the scale of these benefits, they are equivalent to 22% of total
employment in 2020 and 32% of GDP in that year.
Catalytic benefits play an even more prominent role than they do today.
Whereas today catalytic benefits account for around a half of the total
benefits (whether measured in terms of GDP or employment), we calculate
that their contribution will increase to over 60% of the total benefits by
2020.
Investment in aviation is a long-term commitment. Whether developing the
s and facilities at either of Dubai’s two airports, or renewing and expaEmirates’ aircraft fleet, these investments impose substantial costs on the se
e early years, whereas the potential benefits lie mostly in the future. Dubai’
ctor continues to invest heavily in its infrastructure, its aircraft fleet andits staff. So it is worthwhile to consider what future benefits Dubai may gain from itsontinuing commitment to aviation. To this end, this section looks ahead ove
terminal nding ctor in s
in
r the
next decade to consider what the economic benefits might be in 2020.
Future growth in Emirates’ air passenger traffic
Our analysis starts with a forecast for the growth in air passenger traffic over the next ten years. For this we use the forecasts published by Boeing and Airbus, the world’s two largest airplane manufacturers.
To derive a forecast for the number of passengers that Emirates will carry in 2020,
for each region we grow the current level of passengers by the average of the Boeing and Airbus forecasts. In doing this we are assuming that Emirates does not capture market share from other airlines, but that instead its passenger growth
simply keeps pace with the growth in the overall market. Given Emirates success over the past decade, we view this assumption as conservative. On this basis Emirates passenger growth will average 6.6% a year over the next decade. This
implies that by 2020, the number of passengers travelling with Emirates will have increased by around 86%, compared with their current level.
Emirates fleet expansion
Emirates currently has a large order book for new aircraft. It has published orders for 75 A380s, for 70 A350s and for 48 B777s. Some of these will be to replace their
existing fleet of aircraft as these are withdrawn from service. To provide an illustration we estimate Emirates potential fleet in 2020, we assume that aircraft are retired after roughly 12 years, that the published new orders are delivered evenly
th
aviation se
c

Explaining Dubai’s aviation model June 2011
62
over the next decade, and that no aircraft remain on order at 2020. On this basis, we project that the Emirates fleet will grow to 249 by 2020. Its cargo fleet will
similarly grow from 9 to 23 aircraft over the same period.
ating capacity on the different types of aircraft that s in its current fleet and on order, we estimate that the expansion of its
s only city in line with industry forecasts for
Airbus and Boeing l
rowth
n the industry as a whole. Yet more uncertain is the future direction of regulation of international air transport services. If regulation continues
ral air
as Table 1.2
f
By taking account of the seEmirates hapassenger fleet will increase its seating capacity by just over 80% over the next
decade.
A striking conclusion of this analysis is that Emirates current order book isufficient to allow the airline to increase its capaoverall market growth in the regions that its operations are concentrated on.
No forecast is certain, and any forecast over a decade must be subject to
considerable uncertainty. However, there are a couple of reasons to think that Emirates may experience faster growth in demand than theforecasts suggest. First these forecasts reflect a view about the industries overal
growth over the next decade. Individual firms may experience quite different grates as they either gain or lose market share. Given Emirates strong financial performance over the past decade, it is quite likely that Emirates will achieve a
higher rate of growth tha
to move towards greater liberalisation, then Dubai’s policy of negotiating libe
transport agreements is more likely to pay off to the benefit of Emirates and Dubai’s aviation sector more generally.
Table 3.1: Future growth in air passenger traffic (a)
Source: Various sources. (a) Apart from the column for 2020, this table is the same
Capacity at Dubai International
Emirates’ growth might be constrained were capacity at Dubai’s airports not to increase sufficiently to accommodate it.22 Table 3.1, shows how the numbers of
passengers flying with Emirates has increased over the past decade together with our forecast for Emirates passenger numbers for 2020. Also shown in the table, ishow the number of passengers handled by Dubai International has grown over the
past ten years, and our projection for 2020. Alongside this is shown the evolution othe airport’s passenger capacity. The 2020 projection is based on published figures for current plans to develop the airport.
22 Dubai Airports also operates the recently opened Dubai World Central (DWC) situated
near Jebel Ali, around 40 kilometres from Dubai City. Although no passenger services
currently operate from DWC, were Dubai airport to provide adequate capacity to absorb
Emirates entire operation sometime in the future, Emirates might choose to use the other
airport to accommodate its own growth.
2000 2005 201
Total Pax ('000) 4,775 12,529 30,
Capacity (ASKM million) 22,426 68,9Emirates
0 2020
192 56,105
30 161,756 292,963
12,321 24,782 47,200 74,807
0,000 90,000 Dubai International
Total Pax ('000)
Capacity (Pax '000) 22,000 33,000 6

Explaining Dubai’s aviation model June 2011
63
Based on the numbers reported in Table 2.2, we see no reason why the growth in Emirates’ passenger numbers will not be accommodated through Dubai Airpo
current plans to further develop the airports.
rts’
Dubai Benefiting Others: Garuda Indonesia
In 2009, Garuda Indonesia carried approximately 11.2 million passengers to and
from 31 domestic and 19 international destinations around the world. As the
national carrier of Indonesia, Garuda has experienced rapid growth over the last 10
years, with passenger numbers doubling over this period, firmly cementing their
place as the largest airline in Indonesia.
In June 2010 Garuda established new services to Dubai and Amsterdam Airports
(exercising their 5th freedom rights to provide a one-stop European service via
Dubai). In only the first 6 months of operation, over 70,000 people flew to and from
Dubai, with 65% of these passengers continuing their journey with Garuda to
Amsterdam. Following the success of this new route, Garuda plans to capitalise on
the greater connectivity that Dubai affords the airline by offering other European
routes to Frankfurt, Paris, London and Rome in the near future.
As well as an important transit destination for Garuda, the new services to Dubai
offer Garuda’s passengers a wealth of onward destinations to explore. With the
majority of Garuda’s services covering the Asia-Pacific region, Dubai provides a
gateway at which its passengers can connect with one of over 150 airlines, to fly on
to destinations across Africa, Europe and the Middle East.
The increased connectivity resulting from Garuda’s services to and from Dubai also
provides benefits to the Indonesian economy through tourism. In 2010, nearly 70%
of foreign tourists arrived by air, contributing approximately US$7.8 billion to GDP.
We estimate that tourists travelling with Garuda through Dubai contributed US$27.6
million to the Indonesian economy.
decade the two catalytic channels, tourism and
nsion of the tourism-related activities will only be possible should Dubai Airports and Emirates expand their operations in line with their current published plans, as shown in Table 3.1.
Catalytic benefits in 2020
It seems likely that over the next
connectivity, will play an increasingly important role is underpinning growth throughout Dubai’s economy.
Supported through the continued investment in Dubai’s aviation sector, we believe that the sectors that will benefit most from this are the hotel and catering sector and
the distributive trades. Growth in these sectors over the course of the next decade will increase their combined share of GDP from 32% in 2009 to 40% in 2020, an increase of 8 percentage points. The overwhelming majority of overseas visitors will
rely on air transport to reach Dubai, so that this expa
Many other sectors of Dubai’s economy will benefit from the continued investment
in the aviation sector. The growth of tourism will ultimately provide support for the construction sector. Dubai is likely to continue to attract from abroad both investment and highly skilled workers to work in its business services and financial

Explaining Dubai’s aviation model June 2011
64
2010 2020
Panel A: Contribution to GDP (US$ billion)
Total Contribution to GDP 22.1 (28%) 45.4 (32%)
..
Total Employment Contribution 259.0 (19%) 372.9 (22%)
t 43.0 61.9 (1c) Induced 23.9 ..
t (000's)
Comprised of:(1) Economic Footprint 11.7 16.5 Comprised of :
(1a) Direct 6.2 10.5 (1b) Indirect 3.5 5.9 (1c) Induced 2.0
(2) Catalytic Benefit 10.4 28.9 Comprised of:
(2a) Tourism 7.9 18.8 (2b) Connectivity 2.5 10.1
Panel B: Contribution to employmen
Comprised of:(1) Economic Footprint 125.1 145.7 Comprised of :
(1a) Direct 58.2 83.8 (1b) Indirec
(2) Catalytic Benefit 133.9 227.2 Comprised of:
Tourism 133.9 227.2
sectors. Moreover, aviation provides a necessary part of the transport infrastructurethat supports Dubai’s role as a logistical hub that handles large volumes of foreign
trade, much of it destined to be re-exported to
elsewhere in the region and beyond. recasts for passenger traffic
, hat most benefit from connectivity (the
The
Our connectivity estimates are based on growth fopublished by Boeing and Airbus.
Our calculations assume that Dubai continues to grow strongly, albeit at a
somewhat lower rate than that witnessed during the past decade.
Our projections are also consistent with the view that the future drivers of Dubai’s growth will be mainly come through tourism related activities (hotels and cateringwholesale and retail sectors), and sectors t
production and service industries, including banking and finance).
Table 3.2: Aviation’s contribution to Dubai’s GDP and Employment
Footnotes: (a) In brackets are shown aviation’s contributions as a proportion of Dubai’s GDP and as a proportion of total employment in the Dubai economy. (b) There is no induced benefit in 2020, this is indicated by “..” in the table.
Our estimates for the economic benefits in 2020 are reported in Table 3.2. 2010 estimates are reported alongside for ease of comparison.

Explaining Dubai’s aviation model June 2011
65
In 2020, Aviation’s total contribution to GDP is US$45.4 billion, 32% of projected GDP (28% in 2010).
Aviation’s total economic footprint is projected to be US$16.5 billion in 2020. This
total is comprised of a direct benefit of US$10.5 billion, and an indirect benefit oUS$5.9 billion. There is no induced
f benefit in 2020, as the benefit in 2010 comes
e
f the total
conomic benefit. Whether measured in terms of GDP or employment, the catalytic 0% in
from temporary adjustments in the wake of the global financial crisis that ar
unlikely to persist to 2020. Tourism and connectivity together come to US$28.9 billion.
The total employment benefit is close to 372,900 jobs, 22% of Dubai’s projected employment in 2020 (19% in 2010).
Compared to 2010, the catalytic benefits contribute a larger share o
ebenefits contribute around 60% of the total benefit, compared to around 52010.
Box 3.1 How connectivity contributes to Dubai’s long-run growth
Connectivity reflects the range, frequency or service; the economic importance of
destinations; and the number of onward connections available through each
country’s aviation network. Improvements in connectivity achieved in recent
decades have brought benefits to users of air transport services by: reducing time
spent in transit; increasing the frequency of service; allowing for shorter waiting
times and better targeting of departure and arrival times; and improving the quality
of service, such as reliability, punctuality and quality of the travel experience.
Improvements in connectivity enhance the economic performance of the wider
economy through enhancing its overall level of productivity. This improvement in
firm productivity outside the aviation sector comes through two main channels: first,
through the effects on domestic firms of increased access to foreign markets, and
increased foreign competition in the home market, and second, through the free
movement of investment capital and workers between countries. Improved
connectivity gives Dubai-based businesses greater access to foreign markets,
which in turn encourages exports. Opening domestic markets to foreign competitors
can also be an important driver behind reducing unit production costs, either by
forcing domestic firms to adopt best international practices in production and
management methods or by encouraging innovation.
A simple thought experiment considering the impact on trade from eliminating the
air transport network suggests the economic benefit of connectivity is substantial.
Moreover, the recent experience of businesses in Europe during the volcanic ash-
induced airspace closures of 2010, as just-in-time supply chains failed, provides a
more concrete illustration of how dependent modern economies are on their air
transport infrastructures.
A number of recent studies have attempted to quantify the long-term impact on a
country’s GDP that results from an improvement in connectivity. Given that the
supply-side benefits of connectivity come through promoting international trade and
inward investment, any impact is likely to manifest itself gradually. As was
discussed in the main text in relation to the IATA Connectivity Index (see page 15),
it is sensible to scale connectivity measures by GDP. Based on academic research
into the role of public transport investment in generating long-term economic

66
Explaining Dubai’s aviation model June 2011
growth, work by Oxford Economics suggests that a 10% increase in connectivity,
relative to GDP, will raise the level of productivity in the economy by a little under
1.1% over the long term. This estimate is used in this study to derive the
connectivity benefits reported in Section 2 (benefits to Dubai) and Section 3
(benefits to onward markets).

OXFORD Abbey House, 121 St Aldates Oxford, OX1 1Tel: +44 1865 LONDO
HB, UK 268900
N
Broadwall House, 21 Broadwall London, SE1 9PL, UK Tel: +44 207 803 1400 AST
Lagan House, Sackville Street Lisburn, BT27 4AB, UK Tel: +44 28 9266 0669 NEW YORK 817 Broadway, 10th Floor New York, NY 10003, USA Tel: +1 646 786 1863 PHILADELPHIA 303 Lancaster Avenue, Suite 1b Wayne PA 19087, USA Tel: +1 610 995 9600 SINGAPORE
No.1 North Bridge Road High Street Centre #22-07 Singapore 179094 Tel: +65 6338 1235 PARIS Huysmans
75006 Paris, France Tel: + 33 6 79 900 846 email: [email protected]
www.oxfordeconomics.com