explaining ethiopia's recent inflationwe review the sources of the recent spike in ethiopia’s...
TRANSCRIPT

Disclaimer: This report represents solely the views, analysis, and judgement of the Cepheus research team and does not necessarily reflect the views or opinions of the Fund’s Managing Partners, Advisors, or Investors.
We review the sources of the recent spike in Ethiopia’s inflation. To this end, we collected and tabulated the Central Statistical Authority’s monthly price data by detailed product lines (covering the 600-plus items that make up the inflation index) and by key analytical categories (food vs non-food, goods vs services and imported vs local items). In addition, we explore a range of possible explanatory factors—monetary developments, supply-side shocks, administratively-set price changes, global price pressures, exchange rate pass-through, wholesale/retail market structures, and public expectations—and offer our views on their relative significance in explaining Ethiopia’s current inflationary episode.
Ethiopia’s inflation rate has remained stubbornly high in recent months, and reached a five-year high of close to 18 percent in August 2019, despite having dropped briefly to single-digit levels at the end of 2018. Notable features of the current inflationary episode include: § Four consecutive months of above 15 percent inflation: Year-on-year
inflation has remained in the range of 15-18 percent between May and August 2019, up significantly from the 9.3 percent inflation registered as recently as November 2018 (Table 1).
§ High month-on-month-inflation: While the end of the fiscal year normally shows high levels of monthly inflation, this year’s outturns were much higher than normal, with month-on-month price increases of 4.3%, 1.5%, 1.3%, and 2.4% over the past four months. The peak rate of 4.3 percent m-o-m inflation in May 2019 was the highest seen in seven years (Table 2).
§ Food vs non-food items: As of end-August, food inflation of 23 percent was roughly double the 12 percent rate for non-food items. Given the 54 percent weight of food in Ethiopia’s price index (one of the world’s highest), the high rate of food price increases dominates developments in the overall cost-of-living index. Within food, some widely consumed items showing high price increases were bread and cereals, including teff (prices up 26.7%), vegetables (+37.6%), meat (+25.7%) and edible oils (+6.7%). Food and non-food inflation closely followed each other for most of the past five years, but began to show a major divergence starting in April 2019 (Table 3).
§ Goods vs services: Based on our estimates, goods inflation was around 19.8 percent at end-August, while services inflation was much more modest at 12.1 percent as of August 2019 on year-on-year basis (Table 4).
Explaining Ethiopia’s Recent Inflation
RESEARCH & ANALYTICS

RESEARCH & ANALYTICS
Disclaimer: This report represents solely the views, analysis, and judgement of the Cepheus research team and does not necessarily reflect the views or opinions of the Fund’s Managing Partners, Advisors, or Investors.
2
§ Imports vs local products: Inflation of domestically produced products was 22.8 percent by our estimation, while inflation of imported items was less than half that rate at only 10.3 percent (Table 4).
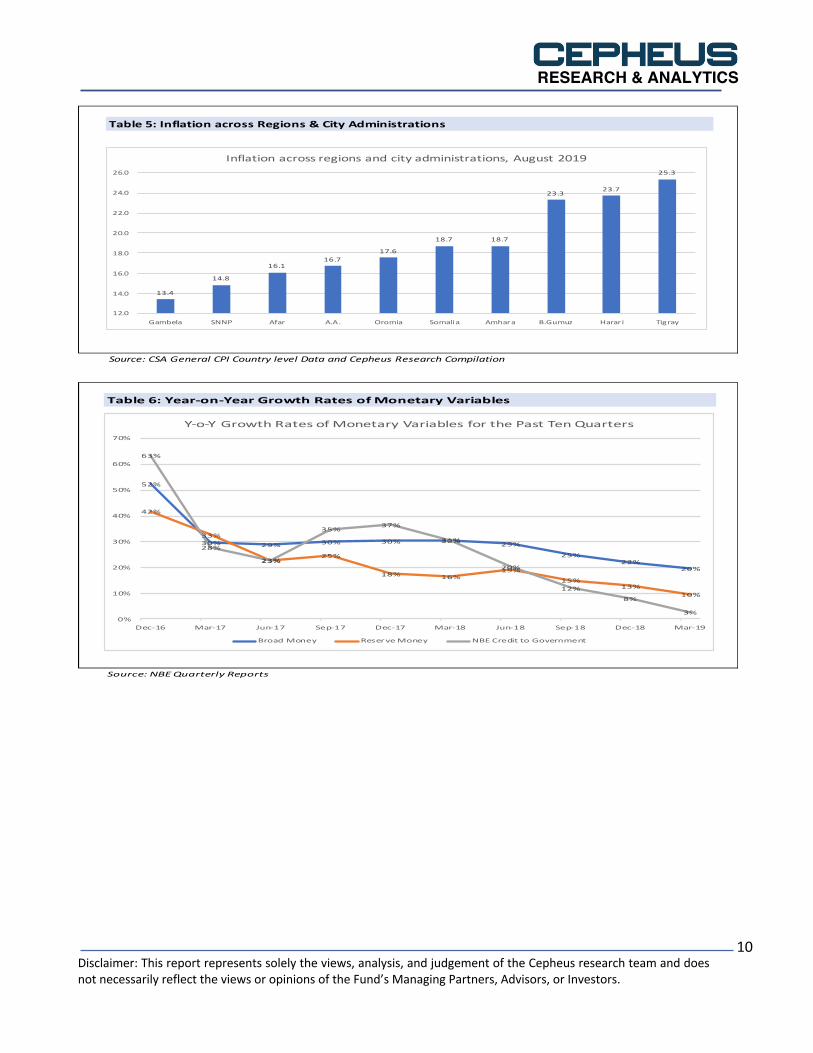
§ Regional variations: Regional variations in inflation rates remain large, with
some regions showing twice the rate of price increases as others. Tigray, Harari, and Benishangul Gumuz registered the highest inflation rates (25.3%, 23.7%, and 23.3% respectively) while Dire Dawa, Gambela, and SNNP are among those with the lowest rates (13.0%, 13.4%, and 14.8%) (Tables 5).
The sources of inflation At least seven potential explanatory variables can be considered as underlying sources of inflation, based on the macroeconomic literature and given Ethiopia’s specific circumstances. These contributory factors include: § Monetary developments: Money supply growth beyond the economy’s
capacity to absorb and expand real economic activity generally leads to inflation. In this context, a review of Ethiopia’s money supply data for the past two years show a slowdown in money supply growth just as there has been a rise in recorded inflation. Broad money supply rose by 19.6 percent as of March 2019 (latest available date), which is a much more restrained growth rate from the 29 percent annual growth observed in both June 2017 and June 2018. In addition, growth in central bank base money has turned sharply lower, registering 9.6 percent growth as of March 2019 as opposed to growth rates of 23 percent and 19 percent seen at the end of the last two fiscal years. Growth in central bank lending to the government (3 percent year-on-year as of March 2019) is also now much lower than the growth rates seen one or two years ago. At first glance, therefore, money supply growth does not appear to be an obvious contributor to the recent spike in inflation and, if anything, inflation has been rising despite a sharp slowdown in the growth of various measures of money supply (Table 6).
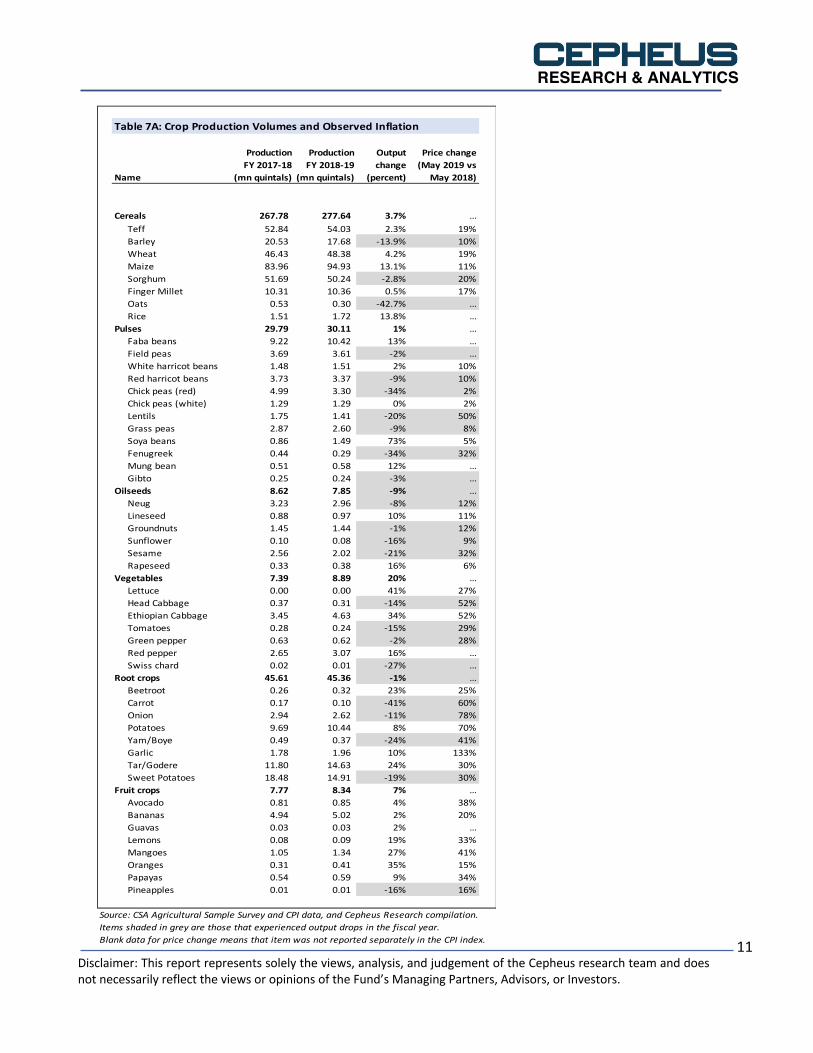
§ Supply-side shocks and disruptions: Sharp declines in the supplies of key commodities, due either to a fall in output or the failure of harvested supplies to reach consumer markets, can lead to jumps in the prices of those affected products. In this context, a key question is whether there has been a drop in the output of major crops and/or a disruption to the transport, logistics, or marketing chains of these crops. On both counts, the data seem to at least partly suggest that this has been the case.
o Output effects: While virtually all food items showed price increases
this past year, those whose output fell this year have shown larger price jumps—on average—than those whose output rose. More specifically, crops whose output fell over the past fiscal year showed average price increases of 23 percent from year-ago levels, while crops whose output increased have shown price increases (excluding outliers) of 19 percent

RESEARCH & ANALYTICS
Disclaimer: This report represents solely the views, analysis, and judgement of the Cepheus research team and does not necessarily reflect the views or opinions of the Fund’s Managing Partners, Advisors, or Investors.
3
from year-ago levels.1 Looking specifically at some widely consumed food items, one observes a notable correlation between output drops and higher prices—as is the case for onions (output down 11%, prices up 78%), lentils (output down 20%, prices up 50%), tomatoes (output down 15%, prices up 29%), and carrots (output down 41%, prices up 60%) (Tables 7A,7B, 8)
o Distribution effects: Besides trends in output levels, the distribution of
particular food items may be just as important—to the extent that harvested produce does not reach its intended markets in the desired time and quantities. In this context, public officials and sector participants have suggested that transport interruptions took place in the months of April-June, as large numbers of transport trucks were directed to address urgent wheat and fertilizer imports on the Addis-Djibouti corridor, implicitly leaving less resources available for internal transport of food items. This is a plausible explanation and seems corroborated by large fertilizer/wheat imports in April-June and by anecdotal information that transport resources were indeed diverted to the Djibouti port in the months just preceeding the rainy season. The interruption of normal transport flows to certain regions (linked in a few cases to localized unrest) might have also been a notable contribution to those regions with the highest inflation.
§ Administered Prices: Changes in government-controlled prices can
contribute to inflation as policy decisions to raise prices automatically feed through to inflation, especially if those prices have high weights in the CPI index. In this context, administratively set prices in Ethiopia include fuel, electricity, water, telecom charges, and government distributed staples such as bread, wheat, sugar, and cooking oil.2 Announcements of planned policy changes can also have an impact, as appears to have been the case for passenger vehicles (whose prices rose sharply due to expectations of tighter restrictions on the permitted age of used car imports). Using official price data for Addis Ababa’s inflation index, for example, we find that wheat products (wheat flour, wheat bread, white wheat), cars, sugar, and cooking oil had large price increases from year-ago levels and that several of these had material weights in the CPI index (2.44 percent, 1.06 percent, 0.91 percent, and 1.70 percent respectively). By our calculations, about 1 percentage point of the 16.7 percent year-on-year Addis Ababa inflation can be attributed to changes in such administratively-set prices (Table 9).
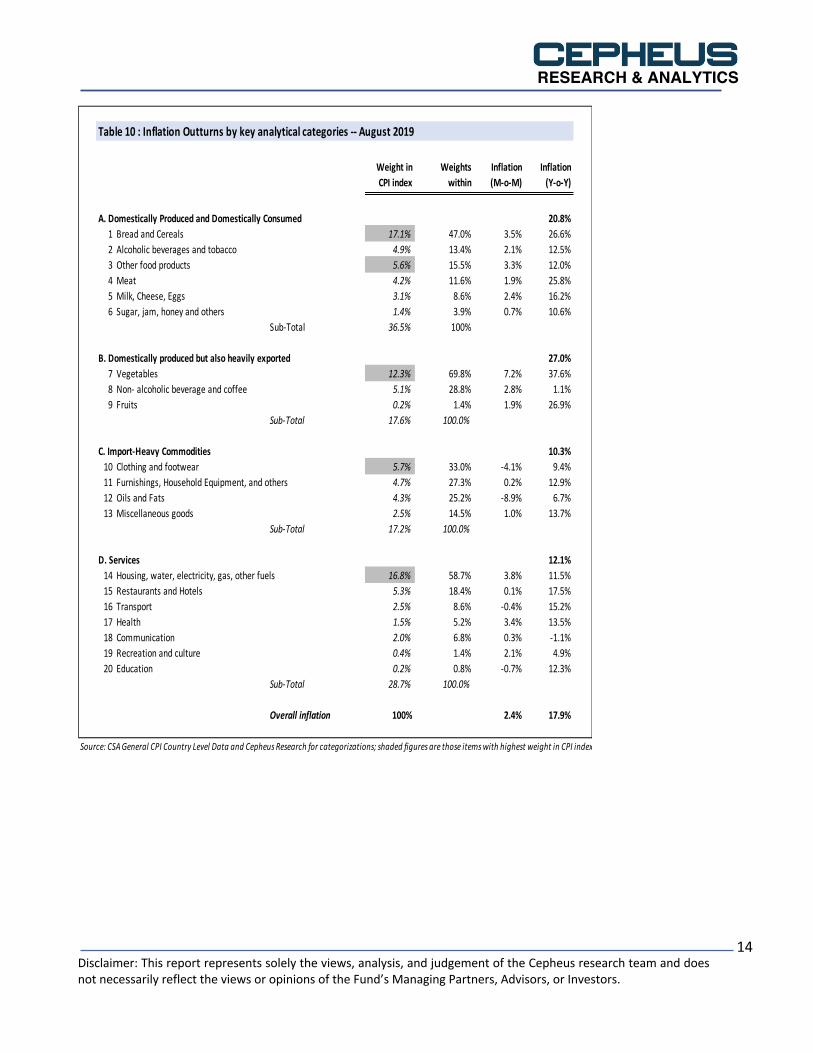
§ Imported inflation: For August 2019, domestically produced goods and/or commodities (excluding services) contributed more to inflation (20 to 27 percent) than imported commodities inflation (10.3 percent). For the latter, given the Birr’s near 7 percent decline from year-ago levels, only about 3
1 Based on CSA's Agriculture Sample Survey data for the 2018-19 crop harvest released in June 2019, and excluding one outlier (garlic) with unusually large price changes (+133%). 2 Only bakeries securing government-subsidized wheat are subject to bread-related price controls, while those who do not access such wheat supplies are free to set their own prices.
RESEARCH & ANALYTICS
Disclaimer: This report represents solely the views, analysis, and judgement of the Cepheus research team and does not necessarily reflect the views or opinions of the Fund’s Managing Partners, Advisors, or Investors.
4
percentage points of the 10 percent inflation in imported goods can potentially be attributed to global price increases. This indicates that global price pressures have not been the main contributors to the inflationary surge in the country, pointing instead to the role of mainly domestic developments and conditions (Table 10).
§ Exchange rate pass-through: A sizeable exchange rate depreciation can raise
the Birr prices of imported items and thus affect the consumer price index (CPI) in proportion to the share of imports in the CPI index. We estimate 17 to 30 percent of the CPI index is comprised of imports or products that utilize mainly imported inputs—thus impacting the CPI to this proportion. For the year to August 2019, the Birr depreciation has been 6.3 percent but the decline in the currency has been a more significant 24 percent considering the two year period to August 2019. To the extent that one considers the cumulative two-year impact of the Birr depreciation, and taking the estimated share of imports in the CPI at between 17 to 30 percent, then the exchange rate pass-through would be on the order of 4 to 7 percentage points. Indeed, a comparison of low-inflation vs high-inflation periods over the past decade would suggest that years following Birr devaluations tend to stand out for showing comparatively higher inflation rates (Table 11).
§ Wholesale and retail markets: The structure of wholesale and retail markets
can affect price levels—reflecting, for example, the number of competitive players and/or the existence of monopolistic or oligopolistic structures. However, it is difficult to attribute a spike in inflation to the nature of wholesale/retail markets unless there was some fundamental change in these structures during that inflationary episode. In Ethiopia’s case, we find it hard to pinpoint such sudden recent changes in wholesale/retail markets or structures, and indeed sense that markets for most food products are quite diverse and comprised of numerous suppliers, wholesalers, and retailers. Accordingly, the view that wholesale/retail market structures are to blame for high inflation seems hard to accept without any apparent shifts in the structure or competitiveness of those markets.
§ Public expectations and confidence: Public sentiment on current and prospective economic and political conditions can, in principle, contribute to inflationary expectations and become a self-fulfilling prophecy whereby expectations of high inflation do indeed generate high inflation. In this regard, broader political and economic developments can lead the public to anticipate upcoming price increases—for example a sharp jump in the parallel market rate can generate such expectations as can political tensions and unrest. Such developments were partly evident in the March-June period and it is possible that they made some modest contribution to inflation—though quantifying their precise effects is of course difficult.

RESEARCH & ANALYTICS
Disclaimer: This report represents solely the views, analysis, and judgement of the Cepheus research team and does not necessarily reflect the views or opinions of the Fund’s Managing Partners, Advisors, or Investors.
5
Given all of the above contributory factors, what conclusion should we draw about their relative significance and the most important culprits? In our judgement, the underlying sources for Ethiopia’s current inflationary episode can be grouped as follows: § Least Important: We would first rule out those that seem least significant in
explaining the rise in Ethiopia’s inflation, namely the structure of wholesale/retail markets, imported inflation, and administrative price changes. As noted earlier, without any material change in wholesale/retail markets in recent months, blaming such market structures for rising inflation seems erroneous. And with respect to the impact of imported inflation and administered prices, their estimated magnitudes are seen to be very limited, at perhaps just 1 percentage point of the observed 17.9 percent inflation.
§ Moderate impacts: We would identify two contributors as having moderate impacts, namely monetary factors and exchange rate pass-through effects:
o On monetary policy, beyond the already observed slowdown in
money supply growth, the fact that most non-food and services categories did not have high inflation suggests that monetary factors were likely less relevant (one would reasonably expect high inflation across most products if monetary factors had been more dominant). Still, while monetary factors haven’t worsened inflation, it is also the case that they might have helped make inflation somewhat lower had there been even tighter policies than actually pursued (if, say, recent growth in broad money was lower than 20 percent or if, for example, credit growth at private banks was kept more restrained than the 43 percent growth rate observed as of June 2019) (Table 12).
o Regarding exchange rate pass-through effects, Ethiopia does tend to experience sharp jumps in inflation following a devaluation (Table 12A). For example, inflation averaged just 8.7 percent during the twelve months prior to the October 2017 devaluation but then averaged 15.0 percent for the twelve months after the devaluation (or an extra 6.3 percentage points for a 15 percent devaluation). Such a pass-through is not far off from the elasticitiy estimates of recent IMF empirical analysis, which suggests a 30 percent pass-through (of exchange rate adjustments to inflation) and thus 4.3 percentage points of extra inflation—all else equal—following a 15 percent devaluation.3 But taking a two-year cumulative view since the 2017 devaluation appears unjustified, as the current inflationary episode (May-August 2019) started more than 18 months after the October 2017 devaluation and was preceeded by roughly six months of near single-digit inflation between November 2018 and April 2019 (Table 12B). Indeed, by the beginning of 2019, pass-through effects from the
3 See IMF’s 2017 Article IV Report released January 2018 and also World Bank’s November 2018 note on “Ethiopia: Impacts of the Birr Devaluation on Inflation”.
RESEARCH & ANALYTICS
Disclaimer: This report represents solely the views, analysis, and judgement of the Cepheus research team and does not necessarily reflect the views or opinions of the Fund’s Managing Partners, Advisors, or Investors.
6
October 2017 devaluation are likely to have been minimal. Only the gradual exchange rate crawl of around 6 percent per year could be seen as having contributed to some extra inflation as of mid-2019, but the amounts attributable to this gradual exchange rate depreciation would be of minor magnitudes (just 1.8 percentage points out of the 17.9 percent inflation, based on the IMF’s pass-through estimates for the one-year impact of a 6 percent depreciation).
§ Main contributor: This leaves the most significant culprit, in our view, as
food-related supply-side shocks, involving a combination of lower harvests and transport disruptions. As noted above, the main underlying food items contributing to inflation are readily quantifiable and identified to be “just vegetables and cereals”—or perhaps even more narrowly ‘just onions and teff’. Indeed, a scenario analysis shows that if just these two categories had experienced only moderate inflation over the past year (say 5 percent each), then end-August 2019 inflation figure would have been only 9.9 percent rather than the actual outturn of 17.9 percent.
Implications and Outlook To summarize, the most significant culprit for Ethiopia’s recent inflation appears to have been a supply-side shock that affected two items with high weights in the Ethiopian consumer basket (vegetables and cereals); most tellingly, excluding these two items, inflation is actually just below 10 percent. Of course, the fact that inflation arose mainly from ‘just vegetables and cererals’ does not make it any less adverse or burdensome for the general public, but it does suggest—in our view—that: (1) the recent inflation should have a temporary duration once these crop-specific shocks dissipate with the upcoming harvest (via the restoration of normal supplies and transport services); (2) an abrupt tightening of monetary or fiscal policies appears unnecessary for now (as macro tightening is an inappropriate response to a food price shock and could instead hurt private sector growth); and (3) radical measures against wholesale and retail outlets are probably not very helpful at this point and might even be counter-productive if available supplies of these widely consumed commodities dwindle even further from current levels.4 In terms of the inflation outlook for the remainder of the fiscal year, a return to single-digit inflation is not likely any time soon. Indeed, the analysis above suggests that: (1) food inflation will remain quite elevated until harvests from the new crop year begin to reach food markets in late 2019; and (2) current macroeconomic conditions and rates of money supply growth seem consistent with and contributing to ‘underlying’ non-food and services inflation of 10-12 percent. At the same time, inflationary pressures from some previously
4 The January 2011 episode of government enacting price controls and taking actions against retail outlets is instructive in this regard. In that case, these measures did not manage to control inflation (which went on to double from 17% in January 2011 to around 34% a year later) and were discontinued gradually over time.

RESEARCH & ANALYTICS
Disclaimer: This report represents solely the views, analysis, and judgement of the Cepheus research team and does not necessarily reflect the views or opinions of the Fund’s Managing Partners, Advisors, or Investors.
7
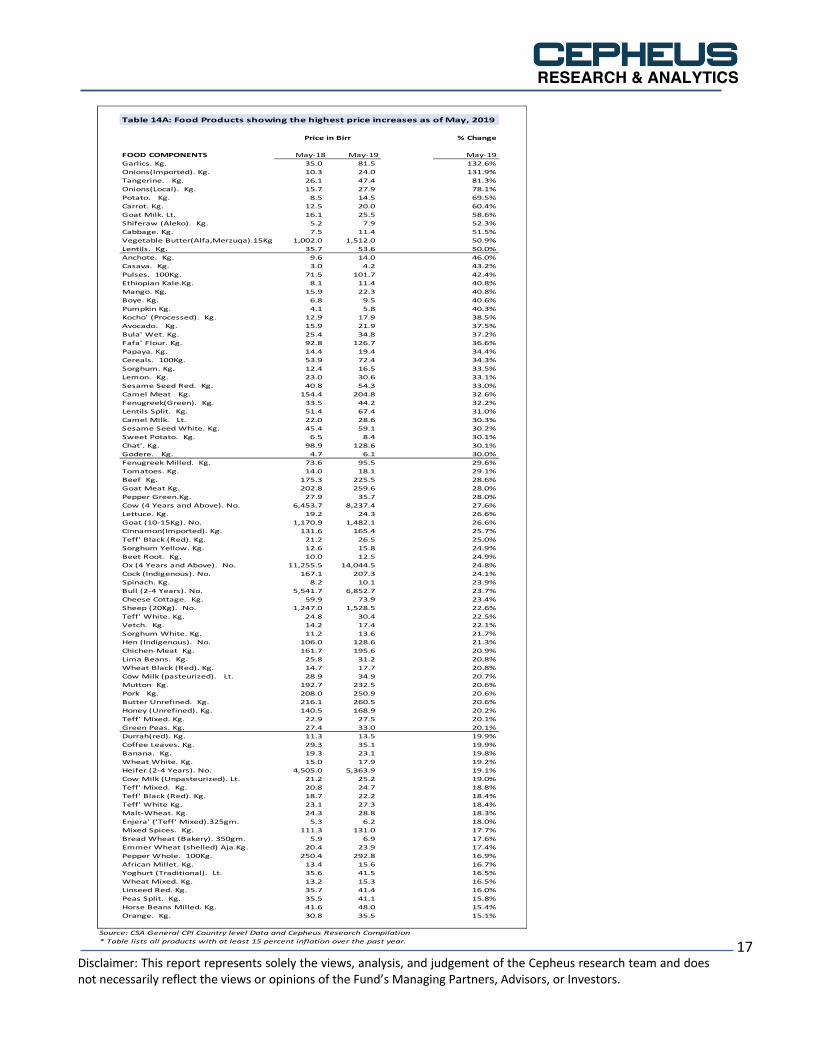
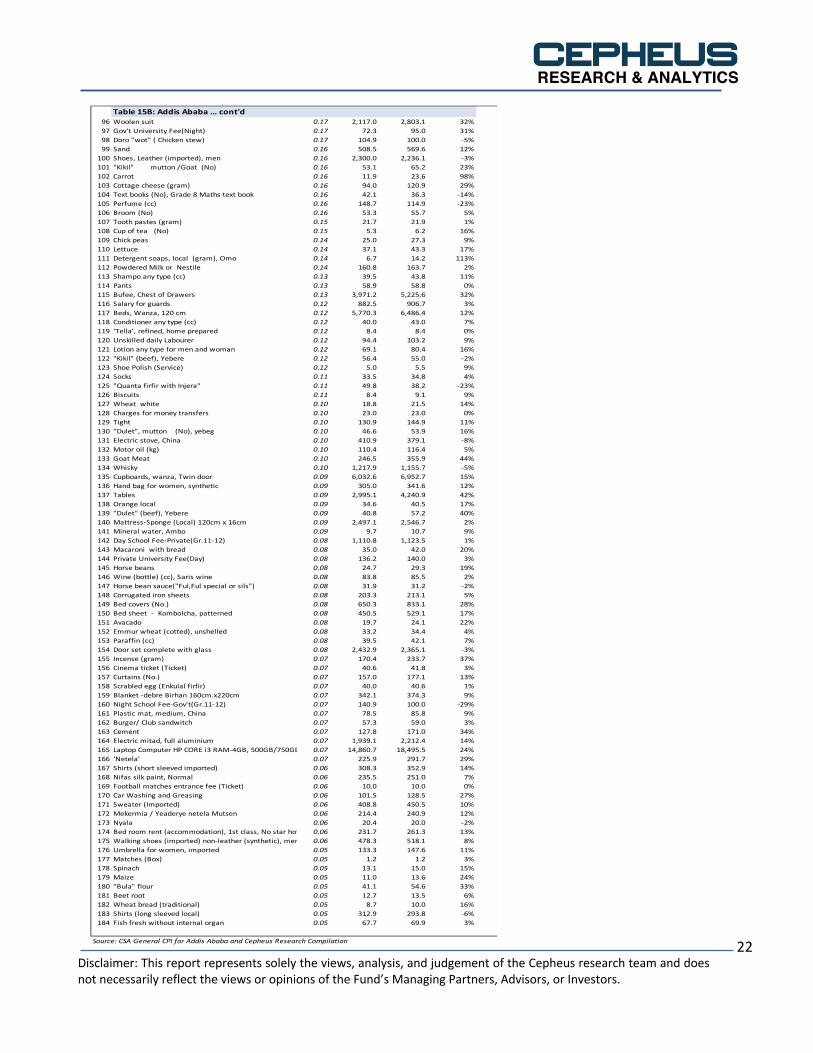
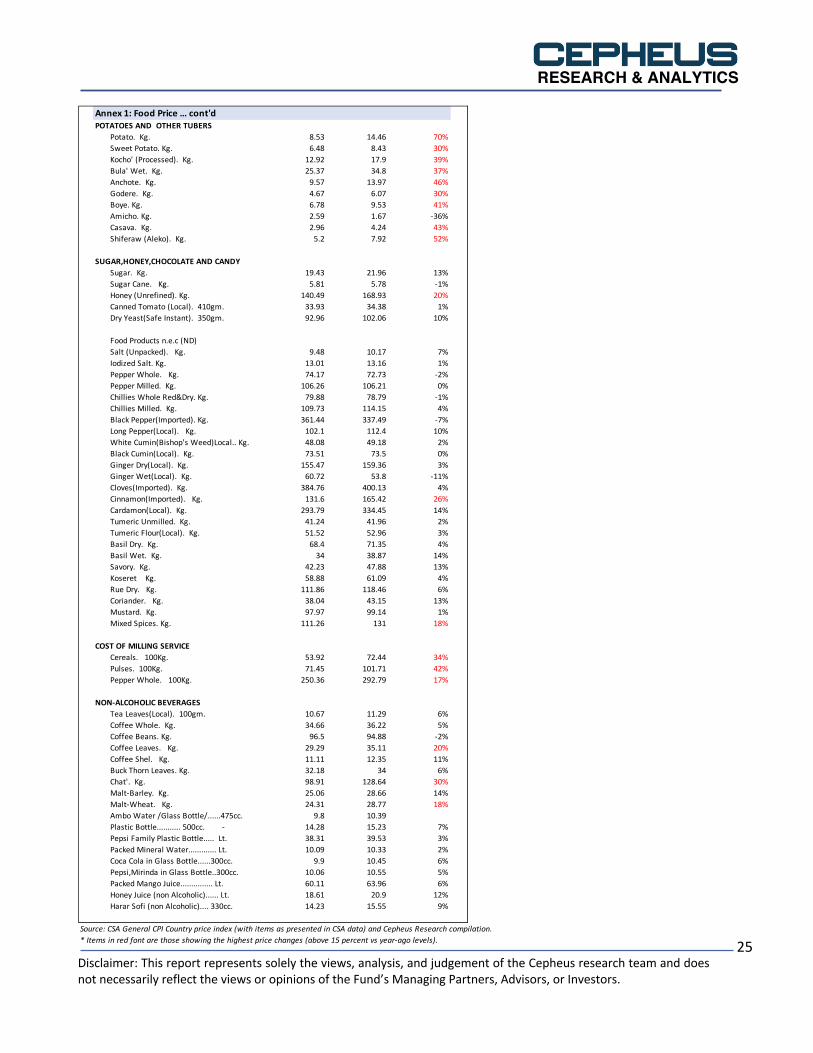
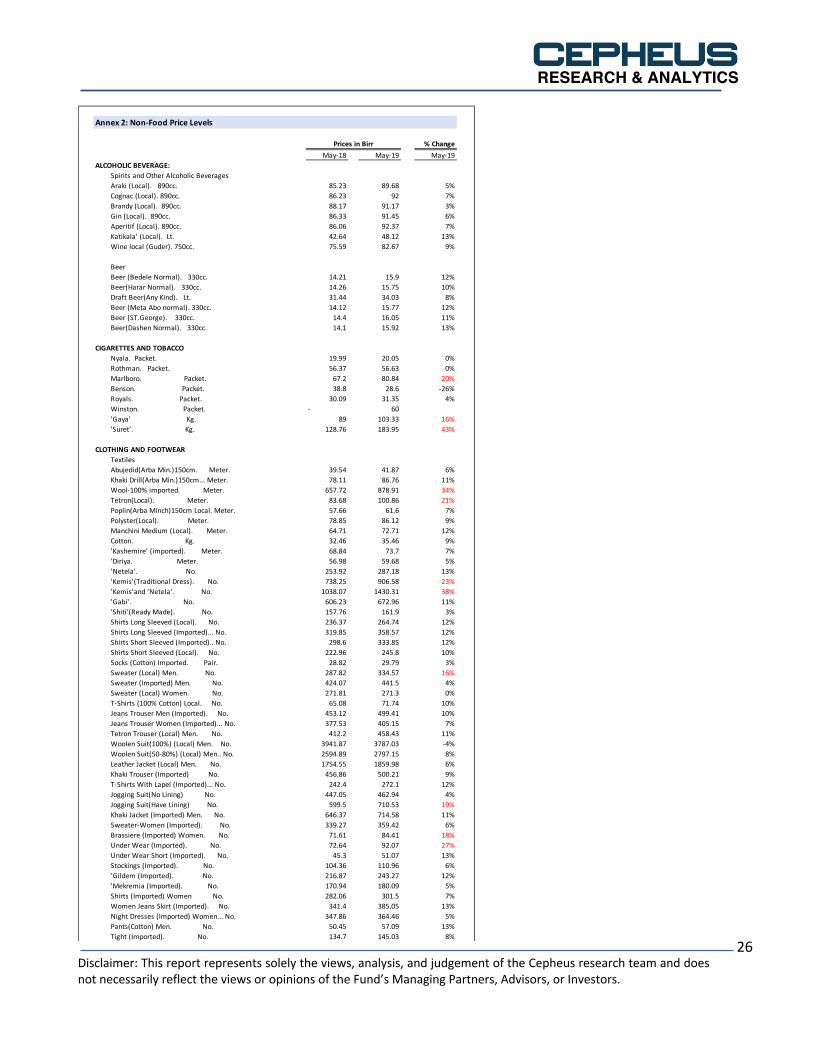
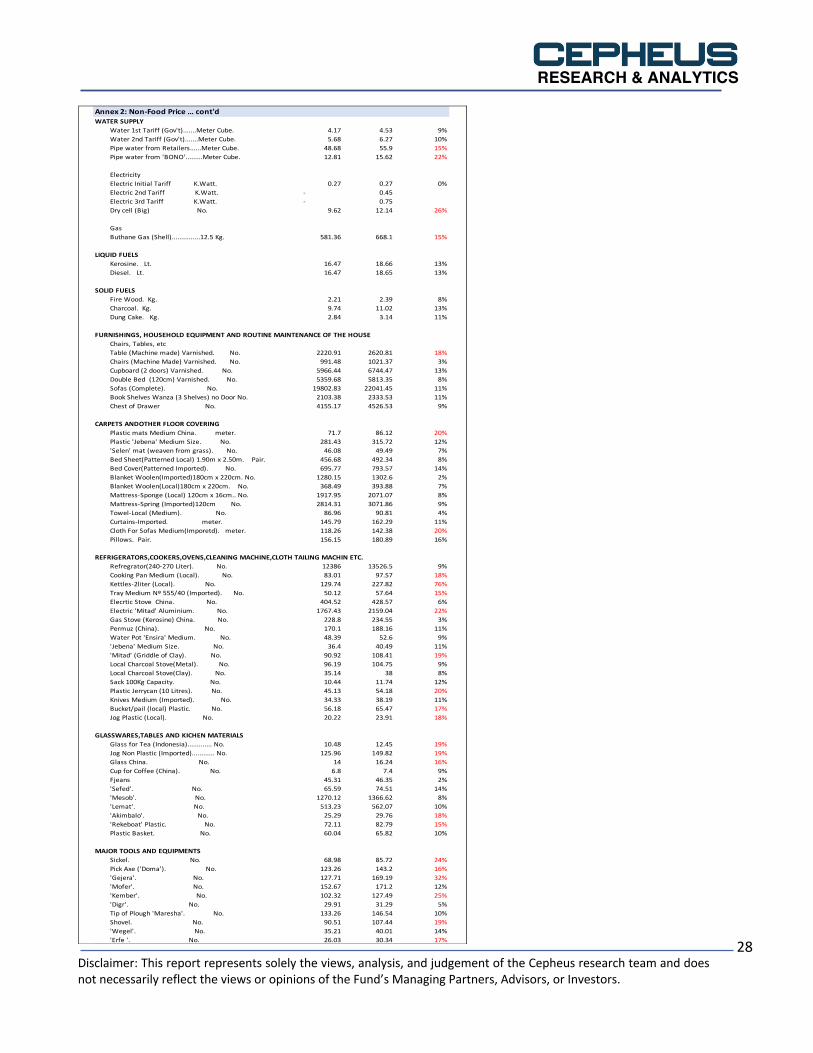
important sources should be low and subdued for the period ahead—whether considering administered price changes (no major policy shifts are announced), imported inflation (IMF’s WEO projections show low commodity price increases), or exchange rate pass-through effects (the budget does not indicate and neither do we foresee a devaluation this fiscal year). Taken all together, and as noted in our Quarterly Macroeconomic Review of Q2:2019, we forecast inflation to remain in the mid-teens until the start of the crop harvesting period (October-December), and expect much lower inflation rates to appear only in early 2020 when favourable base effects (i.e. the high index level in early 2019) help produce lower year-on-year inflation figures and allow inflation to fall towards 10 percent by the end of the fiscal year (June 2020) (Table 13). It is of course possible that some new shocks could keep the inflation rate in the mid-teens even up to mid-2020, for example due to: (1) major political unrest or destabilizing events that adversely affect public expectations; (2) a jump in global oil prices that feeds through many local prices; or (3) a rapid freeing of government-set prices for widely consumed staples and services. For the moment, however, we see all three of these as unlikely to materialize and thus do not consider them as major risks to our baseline projections for the current fiscal year. Finally, we provide a snapshot of the underlying product-by-product drivers of Ethiopia’s inflation by tabulating publicly released CSA data on price levels for both Addis Ababa and on a nation-wide basis. The appendices contain price level data covering: (1) Food items showing the highest nation-wide price increases over the past year (Table 14A); (2) Non-food items showing the highest nation-wide price increases over the past year (Table 14B); (3) a ranking of the Addis Abeba CPI index components showing the highest price increases over the past year (Table 15A); (4) a ranking of the Addis Ababa CPI index components with the largest weights (Table 15B); (5) a listing of the 600-plus products used for the construction of the nation-wide inflation index (Table 16A); and (6) a listing of the near-200 products used to compile Addis Ababa’s consumer price index (Table 16B).

RESEARCH & ANALYTICS
Disclaimer: This report represents solely the views, analysis, and judgement of the Cepheus research team and does not necessarily reflect the views or opinions of the Fund’s Managing Partners, Advisors, or Investors.
8
Table 1: Country Level Year-on-Year Inflation (June 2013-August 2019)
aq`
Source: CSA General CPI Country level Data and Cepheus Research Compilation
0.0
5.0
10.0
15.0
20.0
25.0
Jun Aug Oct Dec Feb Apr Jun Aug Oct Dec Feb Apr Jun Aug Oct Dec Feb Apr Jun Aug Oct Dec Feb Apr Jun Aug Oct Dec Feb Apr Jun Aug Oct Dec Feb Apr Jun Aug
2013/14 2014/15 2015/16 2016/17 2017/18 2018/19 2019/20
General YoY Inflation (June 2013-August 2019)
Table 2: Country Level Month-on-Month Inflation (June 2013-August 2019)
Source: CSA General CPI Country level Data and Cepheus Research Compilation
-3.0
-2.0
-1.0
0.0
1.0
2.0
3.0
4.0
5.0
Jun Aug Oct Dec Feb Apr Jun Aug Oct Dec Feb Apr Jun Aug Oct Dec Feb Apr Jun Aug Oct Dec Feb Apr Jun Aug Oct Dec Feb Apr Jun Aug Oct Dec Feb Apr Jun Aug
2013/14 2014/15 2015/16 2016/17 2017/18 2018/19 2019/20
General MoM Inflation (June 2013-August 2019)

RESEARCH & ANALYTICS
Disclaimer: This report represents solely the views, analysis, and judgement of the Cepheus research team and does not necessarily reflect the views or opinions of the Fund’s Managing Partners, Advisors, or Investors.
9
Table 3: Country Level Food and Non-Food Year-on-Yearl Inflation (June 2013-August 2019)
Source: CSA General CPI Country level Data and Cepheus Research Compilation
0.0
5.0
10.0
15.0
20.0
25.0
Jun Aug
Oct
Dec
Feb
Apr
Jun Aug
Oct
Dec
Feb
Apr
Jun Aug
Oct
Dec
Feb
Apr
Jun Aug
Oct
Dec
Feb
Apr
Jun Aug
Oct
Dec
Feb
Apr
Jun Aug
Oct
Dec
Feb
Apr
Jun Aug
2013/14 2014/15 2015/16 2016/17 2017/18 2018/19 2019/20
Food and Non-Food YoY Inflation (June 2013-August 2019)
Food YoY Inflation Non-Food YoY Inflation
Table 4: Inflation by Analytical Category (August 2017-August 2019)
Source: CSA General CPI Country level Data and Cepheus Research categorizations
-25.0%
-15.0%
-5.0%
5.0%
15.0%
25.0%
35.0%
Aug-17 Oct-17 Dec-17 Feb-18 Apr-18 Jun-18Aug-18 Oct-18 Dec-18 Feb-19 Apr-19 Jun-19
Aug-19
Inflation by Analytical Catagory
Domestically Produced and Domestically Consumed Domestically produced but also heavily exported Import-Heavy Commodities Services
RESEARCH & ANALYTICS
Disclaimer: This report represents solely the views, analysis, and judgement of the Cepheus research team and does not necessarily reflect the views or opinions of the Fund’s Managing Partners, Advisors, or Investors.
10
Table 5: Inflation across Regions & City Administrations
Source: CSA General CPI Country level Data and Cepheus Research Compilation
13.4
14.8
16.116.7
17.6
18.7 18.7
23.323.7
25.3
12.0
14.0
16.0
18.0
20.0
22.0
24.0
26.0
Gambela SNNP Afar A.A. Oromia Somalia Amhara B.Gumuz Harar i Tigray
Inflation across regions and city administrations, August 2019
Table 6: Year-on-Year Growth Rates of Monetary Variables
Source: NBE Quarterly Reports
52%
30% 29% 30% 30% 30% 29%
25%22%
20%
42%
33%
23%25%
18% 16%19%
15%13%
10%
63%
28%
23%
35%37%
31%
20%
12%
8%
3%0%
10%
20%
30%
40%
50%
60%
70%
Dec-16 Mar-17 Jun-17 Sep-17 Dec-17 Mar-18 Jun-18 Sep-18 Dec-18 Mar-19
Y-o-Y Growth Rates of Monetary Variables for the Past Ten Quarters
Broad Money Reserve Money NBE Credit to Government
RESEARCH & ANALYTICS
Disclaimer: This report represents solely the views, analysis, and judgement of the Cepheus research team and does not necessarily reflect the views or opinions of the Fund’s Managing Partners, Advisors, or Investors.
11
Table 7A: Crop Production Volumes and Observed Inflation
Name
Production FY 2017-18
(mn quintals)
Production FY 2018-19
(mn quintals)
Output change
(percent)
Price change (May 2019 vs
May 2018)
Cereals 267.78 277.64 3.7% …Teff 52.84 54.03 2.3% 19%Barley 20.53 17.68 -13.9% 10%Wheat 46.43 48.38 4.2% 19%Maize 83.96 94.93 13.1% 11%Sorghum 51.69 50.24 -2.8% 20%Finger Millet 10.31 10.36 0.5% 17%Oats 0.53 0.30 -42.7% …Rice 1.51 1.72 13.8% …
Pulses 29.79 30.11 1% …Faba beans 9.22 10.42 13% …Field peas 3.69 3.61 -2% …White harricot beans 1.48 1.51 2% 10%Red harricot beans 3.73 3.37 -9% 10%Chick peas (red) 4.99 3.30 -34% 2%Chick peas (white) 1.29 1.29 0% 2%Lentils 1.75 1.41 -20% 50%Grass peas 2.87 2.60 -9% 8%Soya beans 0.86 1.49 73% 5%Fenugreek 0.44 0.29 -34% 32%Mung bean 0.51 0.58 12% …Gibto 0.25 0.24 -3% …
Oilseeds 8.62 7.85 -9% …Neug 3.23 2.96 -8% 12%Lineseed 0.88 0.97 10% 11%Groundnuts 1.45 1.44 -1% 12%Sunflower 0.10 0.08 -16% 9%Sesame 2.56 2.02 -21% 32%Rapeseed 0.33 0.38 16% 6%
Vegetables 7.39 8.89 20% …Lettuce 0.00 0.00 41% 27%Head Cabbage 0.37 0.31 -14% 52%Ethiopian Cabbage 3.45 4.63 34% 52%Tomatoes 0.28 0.24 -15% 29%Green pepper 0.63 0.62 -2% 28%Red pepper 2.65 3.07 16% …Swiss chard 0.02 0.01 -27% …
Root crops 45.61 45.36 -1% …Beetroot 0.26 0.32 23% 25%Carrot 0.17 0.10 -41% 60%Onion 2.94 2.62 -11% 78%Potatoes 9.69 10.44 8% 70%Yam/Boye 0.49 0.37 -24% 41%Garlic 1.78 1.96 10% 133%Tar/Godere 11.80 14.63 24% 30%Sweet Potatoes 18.48 14.91 -19% 30%
Fruit crops 7.77 8.34 7% …Avocado 0.81 0.85 4% 38%Bananas 4.94 5.02 2% 20%Guavas 0.03 0.03 2% …Lemons 0.08 0.09 19% 33%Mangoes 1.05 1.34 27% 41%Oranges 0.31 0.41 35% 15%Papayas 0.54 0.59 9% 34%Pineapples 0.01 0.01 -16% 16%
Source: CSA Agricultural Sample Survey and CPI data, and Cepheus Research compilation.Items shaded in grey are those that experienced output drops in the fiscal year.Blank data for price change means that item was not reported separately in the CPI index.

RESEARCH & ANALYTICS
Disclaimer: This report represents solely the views, analysis, and judgement of the Cepheus research team and does not necessarily reflect the views or opinions of the Fund’s Managing Partners, Advisors, or Investors.
12
Ranked by the growth in given crop's output volume (from worst to best)
Change in Volume
Change in Price
Oats -42.7% …Carrot -41.5% 60%Fenugreek -33.9% 32%Chick peas (red) -33.9% 2%Swiss chard -27.3% …Yam/Boye -24.3% 41%Sesame -21.2% 32%Lentils -19.6% 50%Sweet Potatoes -19.3% 30%Pineapples -16.2% 16%Sunflower -16.1% 9%Tomatoes -15.1% 29%Barley -13.9% 10%Head Cabbage -13.8% 52%Onion -10.7% 78%Red harricot beans -9.5% 10%Grass peas -9.1% 8%Neug -8.4% 12%Sorghum -2.8% 20%Gibto -2.7% …Field peas -2.1% …Green pepper -1.6% 28%Groundnuts -0.8% 12%Chick peas (white) 0.0% 2%Finger Millet 0.5% 17%Bananas 1.6% 20%White harricot beans 1.8% 10%Teff 2.3% 19%Guavas 2.3% …Avocado 4.1% 38%Wheat 4.2% 19%Potatoes 7.8% 70%Papayas 8.9% 34%Lineseed 9.6% 11%Garlic 9.8% 133%Mung bean 12.1% …Faba beans 13.0% …Maize 13.1% 11%Rice 13.8% …Red pepper 16.1% …Rapeseed 16.3% 6%Lemons 19.2% 33%Beetroot 23.2% 25%Tar/Godere 24.0% 30%Mangoes 27.4% 41%Ethiopian Cabbage 34.2% 52%Oranges 35.0% 15%Lettuce 41.4% 27%Soya beans 72.8% 5%
Source: CSA Agricultural Sample Survey and CPI data, Cepheus Research compilation.
Table 7B: Crop Production Changes and Observed Inflation

RESEARCH & ANALYTICS
Disclaimer: This report represents solely the views, analysis, and judgement of the Cepheus research team and does not necessarily reflect the views or opinions of the Fund’s Managing Partners, Advisors, or Investors.
13
Table 8: Price Change vs Supply Growth
Source: CSA General CPI Country level Data and Cepheus Research Compilation
y = -0.2685x + 0.2627
0%
10%
20%
30%
40%
50%
60%
70%
80%
-42% -22% -2% 18% 38% 58%
Price
Chan
ge
Supply Change
Price Change vs Supply Change
Price Change vs Supply Growth Linear (Price Change vs Supply Growth)
Teff
Tomatoes
Carrots
Wheat
Onions
Soya Beans
Table 9: Products with administred prices (Addis Ababa CPI index)
PRODUCT DESCRIPTION Weight in AA
CPI (% total)
Weight within
group (%
total)
Birr price,
Aug 2018
Birr price,
Aug 2019
Price
change
Wheat Flour (factory processed) 0.42% 3.1% 20.64 26.49 28%Wheat bread (bakery) 1.87% 13.9% 6.19 7.75 25%Toyota Corolla Used Imported 1.06% 7.9% 579,719 724,569 25%Wheat bread (traditional) 0.05% 0.4% 8.68 10.05 16%Wheat white 0.10% 0.8% 18.79 21.49 14%Sugar 0.91% 6.7% 18.41 21.00 14%Edible oil (Imported) 1.70% 12.6% 25.17 25.41 1%Water 1st Tariff (Gov't) 0.62% 4.6% 1.75 1.75 0%Electricity 1.75% 13.0% 0.27 0.27 0%Telephone charges, per minute 4.99% 37.0% 0.23 0.23 0%
Sub-total or Total 13.5% 100.0%
Addis Ababa Inflation, Y-o-Y, End-August 2019 16.7%Weighted inflation of admin-price products 7.60%
Contribution of admin-price products to AA inflation: 1.03%
Source: CSA General CPI Country level Data and Cepheus Research Compilation
RESEARCH & ANALYTICS
Disclaimer: This report represents solely the views, analysis, and judgement of the Cepheus research team and does not necessarily reflect the views or opinions of the Fund’s Managing Partners, Advisors, or Investors.
14
Table 10 : Inflation Outturns by key analytical categories -- August 2019
Weight in CPI index
Weights within
Category
Inflation (M-o-M)
Inflation (Y-o-Y)
A. Domestically Produced and Domestically Consumed 20.8%1 Bread and Cereals 17.1% 47.0% 3.5% 26.6%2 Alcoholic beverages and tobacco 4.9% 13.4% 2.1% 12.5%3 Other food products 5.6% 15.5% 3.3% 12.0%4 Meat 4.2% 11.6% 1.9% 25.8%5 Milk, Cheese, Eggs 3.1% 8.6% 2.4% 16.2%6 Sugar, jam, honey and others 1.4% 3.9% 0.7% 10.6%
Sub-Total 36.5% 100%
B. Domestically produced but also heavily exported 27.0%7 Vegetables 12.3% 69.8% 7.2% 37.6%8 Non- alcoholic beverage and coffee 5.1% 28.8% 2.8% 1.1%9 Fruits 0.2% 1.4% 1.9% 26.9%
Sub-Total 17.6% 100.0%
C. Import-Heavy Commodities 10.3%10 Clothing and footwear 5.7% 33.0% -4.1% 9.4%11 Furnishings, Household Equipment, and others 4.7% 27.3% 0.2% 12.9%12 Oils and Fats 4.3% 25.2% -8.9% 6.7%13 Miscellaneous goods 2.5% 14.5% 1.0% 13.7%
Sub-Total 17.2% 100.0%
D. Services 12.1%14 Housing, water, electricity, gas, other fuels 16.8% 58.7% 3.8% 11.5%15 Restaurants and Hotels 5.3% 18.4% 0.1% 17.5%16 Transport 2.5% 8.6% -0.4% 15.2%17 Health 1.5% 5.2% 3.4% 13.5%18 Communication 2.0% 6.8% 0.3% -1.1%19 Recreation and culture 0.4% 1.4% 2.1% 4.9%20 Education 0.2% 0.8% -0.7% 12.3%
Sub-Total 28.7% 100.0%
Overall inflation 100% 2.4% 17.9%
Source: CSA General CPI Country Level Data and Cepheus Research for categorizations; shaded figures are those items with highest weight in CPI index

RESEARCH & ANALYTICS
Disclaimer: This report represents solely the views, analysis, and judgement of the Cepheus research team and does not necessarily reflect the views or opinions of the Fund’s Managing Partners, Advisors, or Investors.
15
Table 11: Macroeconomic variables during high and low inflation periods over the last decade
Current High Inflation Period Past High Inflation Period Recent Low Inflation Period2017-18 and 2018-19 2010-11 and 2011-12 2012-13 to 2016-17
Two fiscal years Two fiscal years Five fiscal yearsInflation indicators
Inflation (end of period) 15.0% 29.4% 8.5%Inflation (period average) 13.6% 26.1% 9.3%Food Inflation 17.0% 33.4% 9.0%Non-Food Inflation 15.1% 23.3% 7.4%
Growth (supply-side) indicatorsGDP Growth 7.9% 10.1% 9.7%Agriculture Growth 3.3% 6.9% 5.6%
Exchange rate policy indicatorsExchange rate (period average), % depreciation 12.0% 16.1% 5.4%EXchange rate (end of period), % depreciation 12.0% 12.6% 5.4%
Monetary policy indicatorsBroad Money Growth 24.6% 34.7% 24.8%Reserve Money Growth 14.3% 17.6% 17.3%Net Credit to Government Growth 20.1% 8.2% 20.8%Bank Deposits Growth 25.9% 36.0% 24.6%Credit by All Banks Growth 23.1% 49.9% 29.4%Credit by Private Banks Growth 38.3% 27.8% 31.6%
Source: CSA General CPI Country level Data and Cepheus Research Compilation
Table 12A: Exchange Rate Devaluation vs Inflation
Source: CSA General CPI Country level Data and Cepheus Research Compilation
-10.00
-5.00
0.00
5.00
10.00
15.00
20.00
25.00
30.00
35.00
40.00
45.00
Jul
Sep
Nov
Jan Mar
May Ju
lSe
pNo
vJan Mar
May Ju
lSe
pNo
vJan Mar
May Ju
lSe
pNo
vJan Mar
May Ju
lSe
pNo
vJan Mar
May Ju
lSe
pNo
vJan Mar
May Ju
lSe
pNo
vJan Mar
May Ju
lSe
pNo
vJan Mar
May Ju
lSe
pNo
vJan Mar
May Ju
lSe
pNo
vJan Mar
May Ju
l
2009/10 2010/11 2010/11 2011/12 2012/13 2013/14 2014/15 2015/16 2016/17 2017/18 2018/19 2019/20
Exchange vs Inflation
General YoY Inflation Exchange rate devalaution
Devaluation Oct 2017=15.6%
Devaluation Sept 2010=19.2%

RESEARCH & ANALYTICS
Disclaimer: This report represents solely the views, analysis, and judgement of the Cepheus research team and does not necessarily reflect the views or opinions of the Fund’s Managing Partners, Advisors, or Investors.
16
Table 12B: General Inflation (October 2016-August 2019)
Source: CSA General CPI Country level Data and Cepheus Research Compilation
4.0
6.0
8.0
10.0
12.0
14.0
16.0
18.0
Oct Nov Dec Jan Feb Mar Apr May Jun Jul Aug Sep Oct Nov Dec Jan Feb Mar Apr May Jun Jul Aug Sep Oct Nov Dec Jan Feb Mar Apr May Jun Jul Aug
2016/17 2017/18 2018/19 2019/20
General Inflation
12 months beforedevaluation = 8.7%
12 months afterdevaluation = 15.0%
Nov 2018-Apr 2019 = 10.9%
May-Aug 2019= 16.2%
Table 13: Inflation Projections to end-2019
Price index M-o-M inflation Y-o-Y inflation
ActualsApril 2019 136.4 1.8% 12.9%May 2019 142.3 4.3% 16.3%June 2019 144.4 1.5% 15.3%July 2019 146.3 1.3% 15.5%August 2019 149.8 2.4% 17.9%
ProjectionsSeptember 2019 151.3 1.0% 17.7%October 2019 150.4 -0.6% 17.4%November 2019 149.3 -0.7% 17.9%December 2019 149.8 0.3% 16.5%
Source: Cepheus Research; M-o-M inflation projections guided by recent trends and historical medians
RESEARCH & ANALYTICS
Disclaimer: This report represents solely the views, analysis, and judgement of the Cepheus research team and does not necessarily reflect the views or opinions of the Fund’s Managing Partners, Advisors, or Investors.
17
Table 14A: Food Products showing the highest price increases as of May, 2019
% Change
FOOD COMPONENTS May-18 May-19 May-19Garlics. Kg. 35.0 81.5 132.6%Onions(Imported). Kg. 10.3 24.0 131.9%Tangerine. Kg. 26.1 47.4 81.3%Onions(Local). Kg. 15.7 27.9 78.1%Potato. Kg. 8.5 14.5 69.5%Carrot. Kg. 12.5 20.0 60.4%Goat Milk. Lt. 16.1 25.5 58.6%Shiferaw (Aleko). Kg. 5.2 7.9 52.3%Cabbage. Kg. 7.5 11.4 51.5%Vegetable Butter(Alfa,Merzuqa).15Kg 1,002.0 1,512.0 50.9%Lentils. Kg. 35.7 53.6 50.0%Anchote. Kg. 9.6 14.0 46.0%Casava. Kg. 3.0 4.2 43.2%Pulses. 100Kg. 71.5 101.7 42.4%Ethiopian Kale.Kg. 8.1 11.4 40.8%Mango. Kg. 15.9 22.3 40.8%Boye. Kg. 6.8 9.5 40.6%Pumpkin Kg. 4.1 5.8 40.3%Kocho' (Processed). Kg. 12.9 17.9 38.5%Avocado. Kg. 15.9 21.9 37.5%Bula' Wet. Kg. 25.4 34.8 37.2%Fafa' Flour. Kg. 92.8 126.7 36.6%Papaya. Kg. 14.4 19.4 34.4%Cereals. 100Kg. 53.9 72.4 34.3%Sorghum. Kg. 12.4 16.5 33.5%Lemon. Kg. 23.0 30.6 33.1%Sesame Seed Red. Kg. 40.8 54.3 33.0%Camel Meat Kg. 154.4 204.8 32.6%Fenugreek(Green). Kg. 33.5 44.2 32.2%Lentils Split. Kg. 51.4 67.4 31.0%Camel Milk. Lt. 22.0 28.6 30.3%Sesame Seed White. Kg. 45.4 59.1 30.2%Sweet Potato. Kg. 6.5 8.4 30.1%Chat'. Kg. 98.9 128.6 30.1%Godere. Kg. 4.7 6.1 30.0%Fenugreek Milled. Kg. 73.6 95.5 29.6%Tomatoes. Kg. 14.0 18.1 29.1%Beef Kg. 175.3 225.5 28.6%Goat Meat Kg. 202.8 259.6 28.0%Pepper Green.Kg. 27.9 35.7 28.0%Cow (4 Years and Above). No. 6,453.7 8,237.4 27.6%Lettuce. Kg. 19.2 24.3 26.6%Goat (10-15Kg). No. 1,170.9 1,482.1 26.6%Cinnamon(Imported). Kg. 131.6 165.4 25.7%Teff' Black (Red). Kg. 21.2 26.5 25.0%Sorghum Yellow. Kg. 12.6 15.8 24.9%Beet Root. Kg. 10.0 12.5 24.9%Ox (4 Years and Above). No. 11,255.5 14,044.5 24.8%Cock (Indigenous). No. 167.1 207.3 24.1%Spinach. Kg. 8.2 10.1 23.9%Bull (2-4 Years). No. 5,541.7 6,852.7 23.7%Cheese Cottage. Kg. 59.9 73.9 23.4%Sheep (20Kg). No. 1,247.0 1,528.5 22.6%Teff' White. Kg. 24.8 30.4 22.5%Vetch. Kg. 14.2 17.4 22.1%Sorghum White. Kg. 11.2 13.6 21.7%Hen (Indigenous). No. 106.0 128.6 21.3%Chichen-Meat Kg. 161.7 195.6 20.9%Lima Beans. Kg. 25.8 31.2 20.8%Wheat Black (Red). Kg. 14.7 17.7 20.8%Cow Milk (pasteurized). Lt. 28.9 34.9 20.7%Mutton Kg. 192.7 232.5 20.6%Pork Kg. 208.0 250.9 20.6%Butter Unrefined. Kg. 216.1 260.5 20.6%Honey (Unrefined). Kg. 140.5 168.9 20.2%Teff' Mixed. Kg. 22.9 27.5 20.1%Green Peas. Kg. 27.4 33.0 20.1%Durrah(red). Kg. 11.3 13.5 19.9%Coffee Leaves. Kg. 29.3 35.1 19.9%Banana. Kg. 19.3 23.1 19.8%Wheat White. Kg. 15.0 17.9 19.2%Heifer (2-4 Years). No. 4,505.0 5,363.9 19.1%Cow Milk (Unpasteurized). Lt. 21.2 25.2 19.0%Teff' Mixed. Kg. 20.8 24.7 18.8%Teff' Black (Red). Kg. 18.7 22.2 18.4%Teff' White Kg. 23.1 27.3 18.4%Malt-Wheat. Kg. 24.3 28.8 18.3%Enjera' ('Teff' Mixed).325gm. 5.3 6.2 18.0%Mixed Spices. Kg. 111.3 131.0 17.7%Bread Wheat (Bakery). 350gm. 5.9 6.9 17.6%Emmer Wheat (shelled) Aja.Kg. 20.4 23.9 17.4%Pepper Whole. 100Kg. 250.4 292.8 16.9%African Millet. Kg. 13.4 15.6 16.7%Yoghurt (Traditional). Lt. 35.6 41.5 16.5%Wheat Mixed. Kg. 13.2 15.3 16.5%Linseed Red. Kg. 35.7 41.4 16.0%Peas Split. Kg. 35.5 41.1 15.8%Horse Beans Milled. Kg. 41.6 48.0 15.4%Orange. Kg. 30.8 35.5 15.1%
Source: CSA General CPI Country level Data and Cepheus Research Compilation * Table lists all products with at least 15 percent inflation over the past year.
Price in Birr

RESEARCH & ANALYTICS
Disclaimer: This report represents solely the views, analysis, and judgement of the Cepheus research team and does not necessarily reflect the views or opinions of the Fund’s Managing Partners, Advisors, or Investors.
18
Table 14B: Non-food Products showing the highest price increases as of May, 2019
% ChangeNON-FOOD COMPONENTS May-18 May-19 May-19Photo Copy 1.0 2.0 94.2%Kettles-2liter (Local). No. 129.7 227.8 75.6%Tour Travel Enterprise(Gov't) No. 400.0 600.0 50.0%Penicillin injection(4 Mu. Local)..Bottle. 14.4 21.4 49.0%New Motor Cycles(100-120cc) 40,325.6 59,031.1 46.4%Suret'. Kg. 128.8 184.0 42.9%Net For Table Tennis.No. 107.1 152.5 42.4%Toyota Corolla Used Imported 518,710.8 734,846.9 41.7%Paracitamole(500mg) Local.20 Pills. 5.9 8.4 41.2%Dama' (Plastic). PACKET. 343.4 480.6 39.9%Insecticides. 500cc. 93.8 130.8 39.4%Gear Repair No. 282.3 391.8 38.8%Kemis'and 'Netela'. No. 1,038.1 1,430.3 37.8%English Dictionaries(Oxford). No. 196.5 267.9 36.4%Gov't University Fee(Night) Month. 63.6 86.1 35.4%Wool-100% imported. Meter. 657.7 878.9 33.6%Ballpoint Bic Kenya. No. 5.2 7.0 33.3%Candles(Big). No. 5.8 7.7 32.8%Gejera'. No. 127.7 169.2 32.5%Chess(Plastic). PACKET. 366.1 477.3 30.4%Cassette Normal Record(Local Song). No. 15.6 20.3 29.8%Asprin (300mg) Local. 20 Pills. 6.0 7.7 28.1%Sandal Wood. No. 0.7 0.9 26.4%Electric Hair Dryer Machine No 4,353.3 5,458.6 25.4%Hair Butter (Traditional) Kg 204.4 255.7 25.1%Insulin(India). Bottle. 108.6 135.6 24.8%Kember'. No. 102.3 127.5 24.6%Astazol(Mibendazol) India.20 Pills. 11.5 14.4 24.5%Sickel. No. 69.0 85.7 24.3%Kadprim(Co-trimoxcazol) Local...20 Pills. 10.9 13.5 24.0%Kemis'(Traditional Dress). No. 738.3 906.6 22.8%Power IC change 295.9 362.2 22.4%Table Tennis Ball No. 5.1 6.2 22.4%Electric 'Mitad' Aluminium. No. 1,767.4 2,159.0 22.2%Volleyball No. 539.0 657.2 21.9%Injection Service Charge (Private).. Once. 3.8 4.6 21.9%Camel For Loading 13,934.0 16,927.1 21.5%Zenit/Samira Liquid (Local). 300Cc 27.5 33.3 21.1%Electric Hair Trimming/Cutting Machine USA-Super Taper. No1,709.5 2,067.1 20.9%Tyre for Automobile Local.No. 2,070.4 2,500.9 20.8%Tetron(Local). Meter. 83.7 100.9 20.5%Private University Fee(Day). Month. 89.1 107.4 20.5%Newspaper Addis Zemen No. 5.4 6.5 20.5%Cloth For Sofas Medium(Imporetd). meter. 118.3 142.4 20.4%Marlboro. Packet. 67.2 80.8 20.3%Plastic Jerrycan (10 Litres). No. 45.1 54.2 20.1%Dot Pencils (Local). No. 2.7 3.2 19.5%Zenit/Samira Solid (Local). 350gm 25.0 29.8 19.5%Shoes Plastic Women (Imported). Pair. 40.5 48.3 19.4%Mitad' (Griddle of Clay). No. 90.9 108.4 19.2%Jog Non Plastic (Imported) No. 126.0 149.8 18.9%Kahaki/Tetron Suit (Boys). No. 266.0 316.3 18.9%Glass for Tea (Indonesia) No. 10.5 12.5 18.8%Shovel. No. 90.5 107.4 18.7%Vermox(100mg) Local.12 Pills. 5.9 7.0 18.6%Jogging Suit(Have Lining) No. 599.5 710.5 18.5%Jog Plastic (Local). No. 20.2 23.9 18.2%Desktop computer DELL 7020 CORE i3 RAM-4GB 500GB HD.No.15,924.5 18,802.1 18.1%Shaver Non-chargable No 25.7 30.4 18.0%Table (Machine made) Varnished. No. 2,220.9 2,620.8 18.0%Brassiere (Imported) Women. No. 71.6 84.4 17.9%Hair dressing Normal No 20.1 23.6 17.8%Plastic Bag Kurtu 'festal' (Big). No. 3.7 4.3 17.7%Akimbalo'. No. 25.3 29.8 17.7%Cooking Pan Medium (Local). No. 83.0 97.6 17.5%Umbrella for male medium Non-folded (China) No 1104.6 122.9 17.5%Sendal Plastic Shoe Male(Local).Pair. 40.1 47.1 17.3%Cart Fare.Tr 2.8 3.2 17.0%Repair of Footwear Pair. 64.3 75.1 16.9%Day School Fee-Private(Gr.9-10). Month. 503.2 588.0 16.9%Erfe '. No. 26.0 30.3 16.6%Bucket/pail (local) Plastic. No. 56.2 65.5 16.5%Sharp' For Female. No. 101.5 118.2 16.5%X-Ray(For TB) (Private).Once. 129.4 150.7 16.5%Shirt Long Sleeved(Imported)Boys. No. 204.8 238.5 16.4%Shoe Cleaning No. 5.8 6.8 16.4%Sport Shoes Men (Imported). 503.9 586.1 16.3%Blades Original. No 1.8 2.1 16.3%Sweater (Local) Men. No. 287.8 334.6 16.2%Pick Axe ('Doma'). No. 123.3 143.2 16.2%Gaya' Kg. 89.0 103.3 16.1%Net For Volleyball No. 342.5 397.5 16.1%Glass China. No. 14.0 16.2 16.0%Barbery Normal Cut No 17.3 20.0 15.8%T-Shirt Short Sleeved(Imported).. No. 153.1 177.2 15.7%Cement/Bag/(Local). 50Kg. 145.2 168.0 15.7%School Uniform For Boys No. 325.5 376.1 15.5%Amoxcil (500mg) Imported... 20 Caps. 110.4 127.5 15.5%Labratory Test Fee (Private). Once. 18.3 21.2 15.5%Sendal Leather Shoe Male(Local).Pair. 262.0 302.0 15.3%Matches. Box. 1.4 1.6 15.2%Unskilled Service (Daily Laborer). Day. 87.2 100.3 15.0%Tray Medium Nº 555/40 (Imported). No. 50.1 57.6 15.0%Maid Servant. Month. 582.3 669.6 15.0%Single Tooth extraction (Privet). Once. 237.3 272.8 15.0%
Source: CSA General CPI Country level Data and Cepheus Research Compilation * Table lists all products with at least 15 percent inflation over the past year.
Price in Birr

RESEARCH & ANALYTICS
Disclaimer: This report represents solely the views, analysis, and judgement of the Cepheus research team and does not necessarily reflect the views or opinions of the Fund’s Managing Partners, Advisors, or Investors.
19
Table 15A: Addis Ababa Consumer Prices
Ranked by price change for past year (highest to lowest)
PRODUCT DESCRIPTION Weight Aug-18 Aug-19 Price change Garlic 0.57 41.7 167.2 301%Detergent soaps, local (gram), Omo 0.14 6.7 14.2 113%Carrot 0.16 11.9 23.6 98%Onions 1.56 15.1 26.0 72%Lentils 1.88 40.2 62.7 56%Goat Meat 0.10 246.5 355.9 44%Tables 0.09 2,995.1 4,240.9 42%"Dulet" (beef), Yebere 0.09 40.8 57.2 40%Pepper green 0.21 36.9 51.5 39%Potato 0.77 6.7 9.3 39%Banana 0.27 20.7 28.4 37%Incense (gram) 0.07 170.4 233.7 37%Cabbage 0.23 9.2 12.6 36%Zenit (cc), liquid 0.29 26.7 35.9 35%Teff' black 0.66 20.6 27.5 34%Cement 0.07 127.8 171.0 34%"Bula" flour 0.05 41.1 54.6 33%Woolen suit 0.17 2,117.0 2,803.1 32%Edible oil local (cc) 1.36 67.8 89.6 32%Teff' mixed 4.64 22.6 29.7 32%Bufee, Chest of Drawers 0.13 3,971.2 5,225.6 32%Gov't University Fee(Night) 0.17 72.3 95.0 31%Injera 1.88 5.4 7.0 30%Firewood chopped, KG 0.20 2.7 3.5 30%Teff' white 3.06 25.3 32.8 30%Beef 4.83 164.6 213.3 30%‘Netela’ 0.07 225.9 291.7 29%Cottage cheese (gram) 0.16 94.0 120.9 29%Wheat Flour (factory processed) 0.42 20.6 26.5 28%Bed covers (No.) 0.08 650.3 833.1 28%‘Kemis’ and Netela’ 0.51 1,108.2 1,413.9 28%Car Washing and Greasing 0.06 101.5 128.5 27%Rings, 4gm 18 Karat Gold, Local 0.22 5,799.4 7,335.2 26%Kitfo’, Minced and spiced Beef 0.22 134.0 169.2 26%Wheat bread (bakery) 1.87 6.2 7.8 25%Toyota Corolla Used Imported 1.06 579,719.5 724,568.8 25%Laptop Computer HP CORE i3 RAM-4GB, 500GB/750GB HD0.07 14,860.7 18,495.5 24%Maize 0.05 11.0 13.6 24%"Kikil" mutton /Goat (No) 0.16 53.1 65.2 23%Cooking pan 0.28 123.3 151.0 23%Mutton (Sheep alive) 2.07 1,568.5 1,920.4 22%Avacado 0.08 19.7 24.1 22%Spaghetti 0.65 30.8 37.4 21%Macaroni with bread 0.08 35.0 42.0 20%Horse beans 0.08 24.7 29.3 19%Laboratory fee (Excluding HIV test), stool test, private 1.22 29.4 34.9 19%Laundry soaps, imported (gram) 0.37 12.1 14.3 18%Shoes, Leather (local), women 0.47 338.7 400.3 18%Macaroni 0.23 24.9 29.4 18%Cough syrup ( Bottle), Ephadex 0.19 25.2 29.8 18%School Uniform For Boys 0.20 405.2 477.5 18%Detergent soaps, imported (gram) 0.20 6.7 7.8 18%Bed sheet - Kombolcha, patterned 0.08 450.5 529.1 17%Chicken, Cock alive 0.89 195.4 228.9 17%Sofas, Wanza, 7 seat 0.39 16,572.6 19,402.5 17%Salary for servants, maid 1.78 1,099.0 1,286.0 17%Orange local 0.09 34.6 40.5 17%Lettuce 0.14 37.1 43.3 17%"Tegamino" 0.69 36.3 42.2 17%Lotion any type for men and woman 0.12 69.1 80.4 16%Keywot’ mutton/Goat, stew 0.21 58.7 68.3 16%Cup of tea (No) 0.15 5.3 6.2 16%"Dulet", mutton (No), yebeg 0.10 46.6 53.9 16%Wheat bread (traditional) 0.05 8.7 10.0 16%Cupboards, wanza, Twin door 0.09 6,032.6 6,952.7 15%Mixed pulses, milled 0.55 51.5 59.4 15%Cow Milk (pasteurized) Lt 0.86 25.0 28.8 15%Modess, (Roll) 0.35 21.7 24.9 15%Motor Fuels, Benzene 0.69 18.8 21.5 15%Kerosine (cc) 0.27 16.4 18.8 15%Charcoal (gram) 2.68 14.5 16.6 15%Yebeg Tibs’, mutton roasted, Sheep 0.33 69.7 79.8 15%Spinach 0.05 13.1 15.0 15%Shirts (short sleeved imported) 0.06 308.3 352.9 14%Wheat white 0.10 18.8 21.5 14%Deodorant for men/female 0.18 77.7 88.7 14%Electric mitad, full aluminium 0.07 1,939.1 2,212.4 14%Shoes, Leather (Local), boys 0.29 344.2 392.6 14%Sugar 0.91 18.4 21.0 14%Mobile Apparatus(Techno) 0.43 682.5 774.6 13%Doctor’s fee, Private 0.41 53.1 60.2 13%Curtains (No.) 0.07 157.0 177.1 13%Bed room rent (accommodation), 1st class, No star hotel0.06 231.7 261.3 13%Butter unrefined (gram) 0.68 247.0 278.3 13%Toilet soaps (gram), GIV 0.38 8.9 10.0 13%Beds, Wanza, 120 cm 0.12 5,770.3 6,486.4 12%

RESEARCH & ANALYTICS
Disclaimer: This report represents solely the views, analysis, and judgement of the Cepheus research team and does not necessarily reflect the views or opinions of the Fund’s Managing Partners, Advisors, or Investors.
20
Table 15A: Addis Ababa … cont'dMekermia / Yeaderye netela Mutsen 0.06 214.4 240.9 12%A House with 2 bed rooms and 24-32 meter square(Private)9.97 2,390.7 2,680.6 12%Yebere Keywot’, Beef stew 1.06 55.7 62.4 12%Sand 0.16 508.5 569.6 12%Hand bag for women, synthetic 0.09 305.0 341.6 12%Exercise books, 50 leaves 0.28 12.7 14.2 11%Shampo any type (cc) 0.13 39.5 43.8 11%Salt 0.18 8.8 9.7 11%Umbrella for women, imported 0.05 133.3 147.6 11%Shoes, Canvas (imported), men 0.17 285.7 316.3 11%Tight 0.10 130.9 144.9 11%Hair dressing, normal without dye 0.65 48.0 53.1 11%Sweater (Imported) 0.06 408.8 450.5 10%Cup of coffee 0.41 8.9 9.7 10%"Bozena shiro" 0.19 42.4 46.6 10%Mineral water, Ambo 0.09 9.7 10.7 9%Blanket -debre Birhan 160cm.x220cm 0.07 342.1 374.3 9%‘Chat’ 0.22 130.2 142.4 9%Unskilled daily Labourer 0.12 94.4 103.2 9%Chick peas 0.14 25.0 27.3 9%Plastic mat, medium, China 0.07 78.5 85.8 9%Peas 1.71 27.4 29.9 9%Barley White 0.23 19.4 21.2 9%Shoe Polish (Service) 0.12 5.0 5.5 9%Beer, (St George, Bedele, Harar... ) 0.82 15.0 16.4 9%Biscuits 0.11 8.4 9.1 9%Toilet paper (Roll) 0.23 13.6 14.7 8%Walking shoes (imported) non-leather (synthetic), men 0.06 478.3 518.1 8%Shirts (long sleeved imported) 0.43 330.2 357.2 8%Tea leaves 0.21 10.8 11.7 8%Laundry soaps, local (gram) 0.77 10.8 11.6 8%Conditioner any type (cc) 0.12 40.0 43.0 7%Coca Cola 0.71 10.2 10.9 7%Amoxycillin (No) 0.20 20.6 22.0 7%Rice 0.26 25.3 27.0 7%Nifas silk paint, Normal 0.06 235.5 251.0 7%Paraffin (cc) 0.08 39.5 42.1 7%Liquide Soups (cc), Largo 0.74 37.5 39.9 6%Beet root 0.05 12.7 13.5 6%Shoes, Leather (local), men 0.40 519.6 550.6 6%"Kornis/ Obama" meal 0.66 85.0 90.0 6%Titution Fee (Private)For chlidren 4-6 years 0.93 764.1 807.1 6%Eggs/indigenous (No.) 0.63 54.1 57.1 6%Motor oil (kg) 0.10 110.4 116.4 5%Coffee beans 1.41 102.1 107.6 5%Candles (No.) 0.26 7.4 7.8 5%Spaghetti (pasta) with bread 0.31 40.0 42.0 5%Bus fare (within town),10 km, one way per person 0.50 2.1 2.1 5%Corrugated iron sheets 0.08 203.3 213.1 5%Broom (No) 0.16 53.3 55.7 5%Socks 0.11 33.5 34.8 4%Jeans trousers for boys 0.32 318.5 330.5 4%Emmur wheat (cotted), unshelled 0.08 33.2 34.4 4%T - Shirt 0.40 257.6 266.8 4%Color Television 23/24 Inch Flat screen (Samsung,Sony,LG)0.31 6,385.3 6,597.9 3%Fish fresh without internal organ 0.05 67.7 69.9 3%Cinema ticket (Ticket) 0.07 40.6 41.8 3%Burger/ Club sandwitch 0.07 57.3 59.0 3%Private University Fee(Day) 0.08 136.2 140.0 3%Matches (Box) 0.05 1.2 1.2 3%Salary for guards 0.12 882.5 906.7 3%Jeans trousers 1.32 465.6 478.1 3%Ethiopian Kale 0.36 15.0 15.3 2%Pepper whole 2.04 76.6 78.2 2%Mattress-Sponge (Local) 120cm x 16cm 0.09 2,497.1 2,546.7 2%Wine (bottle) (cc), Saris wine 0.08 83.8 85.5 2%Powdered Milk or Nestile 0.14 160.8 163.7 2%Scrabled egg (Enkulal firfir) 0.07 40.0 40.6 1%Day School Fee-Private(Gr.11-12) 0.08 1,110.8 1,123.5 1%Tooth pastes (gram) 0.15 21.7 21.9 1%Edible oil (Imported) (cc) 1.70 25.2 25.4 1%‘Tella’, refined, home prepared 0.12 8.4 8.4 0%Water 1st Tariff (Gov't) 0.62 1.8 1.8 0%Electricity 1.75 0.3 0.3 0%Taxi fare (Trip) 3.31 1.5 1.5 0%Telephone charges, per minute 4.99 0.2 0.2 0%Football matches entrance fee (Ticket) 0.06 10.0 10.0 0%Charges for money transfers 0.10 23.0 23.0 0%Pants 0.13 58.9 58.8 0%Nyala 0.06 20.4 20.0 -2%Horse bean sauce("Ful,Ful special or sils") 0.08 31.9 31.2 -2%"Kikil" (beef), Yebere 0.12 56.4 55.0 -2%Barbery, men 0.48 23.1 22.4 -3%Shoes, Leather (imported), men 0.16 2,300.0 2,236.1 -3%Door set complete with glass 0.08 2,432.9 2,365.1 -3%Shoes, Canvas (imported), women 0.22 285.7 277.7 -3%Refrigerator, medium size, 750 cc 0.28 17,862.9 17,070.3 -4%Doro "wot" ( Chicken stew) 0.17 104.9 100.0 -5%Whisky 0.10 1,217.9 1,155.7 -5%Shirts (long sleeved local) 0.05 312.9 293.8 -6%Fasting meal without fish 1.80 50.0 46.9 -6%Tomato 0.94 18.8 17.6 -6%"Tibs", beef , Yebere 0.38 96.3 89.1 -7%Electric stove, China 0.10 410.9 379.1 -8%Text books (No), Grade 8 Maths text book 0.16 42.1 36.3 -14%Perfume (cc) 0.16 148.7 114.9 -23%"Quanta firfir with Injera" 0.11 49.8 38.2 -23%Night School Fee-Gov't(Gr.11-12) 0.07 140.9 100.0 -29%
Source: CSA General CPI for Addis Ababa and Cepheus Research Compilation

RESEARCH & ANALYTICS
Disclaimer: This report represents solely the views, analysis, and judgement of the Cepheus research team and does not necessarily reflect the views or opinions of the Fund’s Managing Partners, Advisors, or Investors.
21
Table 15B: Addis Ababa Consumer Prices
Ranked by product weight in the CPI index (highest to lowest)
PRODUCT DESCRIPTION Weight Aug-18 Aug-19 Price change 1 A House with 2 bed rooms and 24-32 sqm (private) 9.97 2,390.7 2,680.6 12%2 Telephone charges, per minute 4.99 0.2 0.2 0%3 Beef 4.83 164.6 213.3 30%4 Teff mixed 4.64 22.6 29.7 32%5 Taxi fare (Trip) 3.31 1.5 1.5 0%6 Teff white 3.06 25.3 32.8 30%7 Charcoal (gram) 2.68 14.5 16.6 15%8 Mutton (Sheep alive) 2.07 1,568.5 1,920.4 22%9 Pepper whole 2.04 76.6 78.2 2%
10 Lentils 1.88 40.2 62.7 56%11 Injera 1.88 5.4 7.0 30%12 Wheat bread (bakery) 1.87 6.2 7.8 25%13 Fasting meal without fish 1.80 50.0 46.9 -6%14 Salary for servants, maid 1.78 1,099.0 1,286.0 17%15 Electricity 1.75 0.3 0.3 0%16 Peas 1.71 27.4 29.9 9%17 Edible oil (Imported) (cc) 1.70 25.2 25.4 1%18 Onions 1.56 15.1 26.0 72%19 Coffee beans 1.41 102.1 107.6 5%20 Edible oil local (cc) 1.36 67.8 89.6 32%21 Jeans trousers 1.32 465.6 478.1 3%22 Laboratory fee (Excluding HIV test), stool test, private 1.22 29.4 34.9 19%23 Yebere Keywot’, Beef stew 1.06 55.7 62.4 12%24 Toyota Corolla Used Imported 1.06 579,719.5 724,568.8 25%25 Tomato 0.94 18.8 17.6 -6%26 Tuition Fee (Private)For chlidren 4-6 years 0.93 764.1 807.1 6%27 Sugar 0.91 18.4 21.0 14%28 Chicken, Cock alive 0.89 195.4 228.9 17%29 Cow Milk (pasteurized) Lt 0.86 25.0 28.8 15%30 Beer, (St George, Bedele, Harar... ) 0.82 15.0 16.4 9%31 Potato 0.77 6.7 9.3 39%32 Laundry soaps, local (gram) 0.77 10.8 11.6 8%33 Liquide Soups (cc), Largo 0.74 37.5 39.9 6%34 Coca Cola 0.71 10.2 10.9 7%35 Motor Fuels, Benzene 0.69 18.8 21.5 15%36 "Tegamino" 0.69 36.3 42.2 17%37 Butter unrefined (gram) 0.68 247.0 278.3 13%38 "Kornis/ Obama" meal 0.66 85.0 90.0 6%39 Teff' black 0.66 20.6 27.5 34%40 Spaghetti 0.65 30.8 37.4 21%41 Hair dressing, normal without dye 0.65 48.0 53.1 11%42 Eggs/indigenous (No.) 0.63 54.1 57.1 6%43 Water 1st Tariff (Gov't) 0.62 1.8 1.8 0%44 Garlic 0.57 41.7 167.2 301%45 Mixed pulses, milled 0.55 51.5 59.4 15%46 ‘Kemis’ and Netela’ 0.51 1,108.2 1,413.9 28%47 Bus fare (within town),10 km, one way per person 0.50 2.1 2.1 5%48 Barbery, men 0.48 23.1 22.4 -3%49 Shoes, Leather (local), women 0.47 338.7 400.3 18%50 Mobile Apparatus(Techno) 0.43 682.5 774.6 13%51 Shirts (long sleeved imported) 0.43 330.2 357.2 8%52 Wheat Flour (factory processed) 0.42 20.6 26.5 28%53 Cup of coffee 0.41 8.9 9.7 10%54 Doctor’s fee, Private 0.41 53.1 60.2 13%55 Shoes, Leather (local), men 0.40 519.6 550.6 6%56 T - Shirt 0.40 257.6 266.8 4%57 Sofas, Wanza, 7 seat 0.39 16,572.6 19,402.5 17%58 Toilet soaps (gram), GIV 0.38 8.9 10.0 13%59 "Tibs", beef , Yebere 0.38 96.3 89.1 -7%60 Laundry soaps, imported (gram) 0.37 12.1 14.3 18%61 Ethiopian Kale 0.36 15.0 15.3 2%62 Modess, (Roll) 0.35 21.7 24.9 15%63 Yebeg Tibs’, mutton roasted, Sheep 0.33 69.7 79.8 15%64 Jeans trousers for boys 0.32 318.5 330.5 4%65 Spaghetti (pasta) with bread 0.31 40.0 42.0 5%66 Color Television 23/24 Inch Flat screen (Samsung,Sony,LG) 0.31 6,385.3 6,597.9 3%67 Zenit (cc), liquid 0.29 26.7 35.9 35%68 Shoes, Leather (Local), boys 0.29 344.2 392.6 14%69 Cooking pan 0.28 123.3 151.0 23%70 Exercise books, 50 leaves 0.28 12.7 14.2 11%71 Refrigerator, medium size, 750 cc 0.28 17,862.9 17,070.3 -4%72 Banana 0.27 20.7 28.4 37%73 Kerosine (cc) 0.27 16.4 18.8 15%74 Rice 0.26 25.3 27.0 7%75 Candles (No.) 0.26 7.4 7.8 5%76 Toilet paper (Roll) 0.23 13.6 14.7 8%77 Cabbage 0.23 9.2 12.6 36%78 Barley White 0.23 19.4 21.2 9%79 Macaroni 0.23 24.9 29.4 18%80 ‘Chat’ 0.22 130.2 142.4 9%81 Shoes, Canvas (imported), women 0.22 285.7 277.7 -3%82 Rings, 4gm 18 Karat Gold, Local 0.22 5,799.4 7,335.2 26%83 Kitfo’, Minced and spiced Beef 0.22 134.0 169.2 26%84 Tea leaves 0.21 10.8 11.7 8%85 Keywot’ mutton/Goat, stew 0.21 58.7 68.3 16%86 Pepper green 0.21 36.9 51.5 39%87 Amoxycillin (No) 0.20 20.6 22.0 7%88 School Uniform For Boys 0.20 405.2 477.5 18%89 Detergent soaps, imported (gram) 0.20 6.7 7.8 18%90 Firewood chopped, KG 0.20 2.7 3.5 30%91 Cough syrup ( Bottle), Ephadex 0.19 25.2 29.8 18%92 "Bozena shiro" 0.19 42.4 46.6 10%93 Deodorant for men/female 0.18 77.7 88.7 14%94 Salt 0.18 8.8 9.7 11%95 Shoes, Canvas (imported), men 0.17 285.7 316.3 11%
RESEARCH & ANALYTICS
Disclaimer: This report represents solely the views, analysis, and judgement of the Cepheus research team and does not necessarily reflect the views or opinions of the Fund’s Managing Partners, Advisors, or Investors.
22
Table 15B: Addis Ababa … cont'd96 Woolen suit 0.17 2,117.0 2,803.1 32%97 Gov't University Fee(Night) 0.17 72.3 95.0 31%98 Doro "wot" ( Chicken stew) 0.17 104.9 100.0 -5%99 Sand 0.16 508.5 569.6 12%
100 Shoes, Leather (imported), men 0.16 2,300.0 2,236.1 -3%101 "Kikil" mutton /Goat (No) 0.16 53.1 65.2 23%102 Carrot 0.16 11.9 23.6 98%103 Cottage cheese (gram) 0.16 94.0 120.9 29%104 Text books (No), Grade 8 Maths text book 0.16 42.1 36.3 -14%105 Perfume (cc) 0.16 148.7 114.9 -23%106 Broom (No) 0.16 53.3 55.7 5%107 Tooth pastes (gram) 0.15 21.7 21.9 1%108 Cup of tea (No) 0.15 5.3 6.2 16%109 Chick peas 0.14 25.0 27.3 9%110 Lettuce 0.14 37.1 43.3 17%111 Detergent soaps, local (gram), Omo 0.14 6.7 14.2 113%112 Powdered Milk or Nestile 0.14 160.8 163.7 2%113 Shampo any type (cc) 0.13 39.5 43.8 11%114 Pants 0.13 58.9 58.8 0%115 Bufee, Chest of Drawers 0.13 3,971.2 5,225.6 32%116 Salary for guards 0.12 882.5 906.7 3%117 Beds, Wanza, 120 cm 0.12 5,770.3 6,486.4 12%118 Conditioner any type (cc) 0.12 40.0 43.0 7%119 ‘Tella’, refined, home prepared 0.12 8.4 8.4 0%120 Unskilled daily Labourer 0.12 94.4 103.2 9%121 Lotion any type for men and woman 0.12 69.1 80.4 16%122 "Kikil" (beef), Yebere 0.12 56.4 55.0 -2%123 Shoe Polish (Service) 0.12 5.0 5.5 9%124 Socks 0.11 33.5 34.8 4%125 "Quanta firfir with Injera" 0.11 49.8 38.2 -23%126 Biscuits 0.11 8.4 9.1 9%127 Wheat white 0.10 18.8 21.5 14%128 Charges for money transfers 0.10 23.0 23.0 0%129 Tight 0.10 130.9 144.9 11%130 "Dulet", mutton (No), yebeg 0.10 46.6 53.9 16%131 Electric stove, China 0.10 410.9 379.1 -8%132 Motor oil (kg) 0.10 110.4 116.4 5%133 Goat Meat 0.10 246.5 355.9 44%134 Whisky 0.10 1,217.9 1,155.7 -5%135 Cupboards, wanza, Twin door 0.09 6,032.6 6,952.7 15%136 Hand bag for women, synthetic 0.09 305.0 341.6 12%137 Tables 0.09 2,995.1 4,240.9 42%138 Orange local 0.09 34.6 40.5 17%139 "Dulet" (beef), Yebere 0.09 40.8 57.2 40%140 Mattress-Sponge (Local) 120cm x 16cm 0.09 2,497.1 2,546.7 2%141 Mineral water, Ambo 0.09 9.7 10.7 9%142 Day School Fee-Private(Gr.11-12) 0.08 1,110.8 1,123.5 1%143 Macaroni with bread 0.08 35.0 42.0 20%144 Private University Fee(Day) 0.08 136.2 140.0 3%145 Horse beans 0.08 24.7 29.3 19%146 Wine (bottle) (cc), Saris wine 0.08 83.8 85.5 2%147 Horse bean sauce("Ful,Ful special or sils") 0.08 31.9 31.2 -2%148 Corrugated iron sheets 0.08 203.3 213.1 5%149 Bed covers (No.) 0.08 650.3 833.1 28%150 Bed sheet - Kombolcha, patterned 0.08 450.5 529.1 17%151 Avacado 0.08 19.7 24.1 22%152 Emmur wheat (cotted), unshelled 0.08 33.2 34.4 4%153 Paraffin (cc) 0.08 39.5 42.1 7%154 Door set complete with glass 0.08 2,432.9 2,365.1 -3%155 Incense (gram) 0.07 170.4 233.7 37%156 Cinema ticket (Ticket) 0.07 40.6 41.8 3%157 Curtains (No.) 0.07 157.0 177.1 13%158 Scrabled egg (Enkulal firfir) 0.07 40.0 40.6 1%159 Blanket -debre Birhan 160cm.x220cm 0.07 342.1 374.3 9%160 Night School Fee-Gov't(Gr.11-12) 0.07 140.9 100.0 -29%161 Plastic mat, medium, China 0.07 78.5 85.8 9%162 Burger/ Club sandwitch 0.07 57.3 59.0 3%163 Cement 0.07 127.8 171.0 34%164 Electric mitad, full aluminium 0.07 1,939.1 2,212.4 14%165 Laptop Computer HP CORE i3 RAM-4GB, 500GB/750GB HD 0.07 14,860.7 18,495.5 24%166 ‘Netela’ 0.07 225.9 291.7 29%167 Shirts (short sleeved imported) 0.06 308.3 352.9 14%168 Nifas silk paint, Normal 0.06 235.5 251.0 7%169 Football matches entrance fee (Ticket) 0.06 10.0 10.0 0%170 Car Washing and Greasing 0.06 101.5 128.5 27%171 Sweater (Imported) 0.06 408.8 450.5 10%172 Mekermia / Yeaderye netela Mutsen 0.06 214.4 240.9 12%173 Nyala 0.06 20.4 20.0 -2%174 Bed room rent (accommodation), 1st class, No star hotel 0.06 231.7 261.3 13%175 Walking shoes (imported) non-leather (synthetic), men 0.06 478.3 518.1 8%176 Umbrella for women, imported 0.05 133.3 147.6 11%177 Matches (Box) 0.05 1.2 1.2 3%178 Spinach 0.05 13.1 15.0 15%179 Maize 0.05 11.0 13.6 24%180 "Bula" flour 0.05 41.1 54.6 33%181 Beet root 0.05 12.7 13.5 6%182 Wheat bread (traditional) 0.05 8.7 10.0 16%183 Shirts (long sleeved local) 0.05 312.9 293.8 -6%184 Fish fresh without internal organ 0.05 67.7 69.9 3%
Source: CSA General CPI for Addis Ababa and Cepheus Research Compilation

RESEARCH & ANALYTICS
Disclaimer: This report represents solely the views, analysis, and judgement of the Cepheus research team and does not necessarily reflect the views or opinions of the Fund’s Managing Partners, Advisors, or Investors.
23
Annex 1: Food Price Levels
% ChangeMay-18 May-19 May-19
BREAD AND OTHER BAKERY PRODUCTS'Enjera' ('Teff' Mixed). 325gm. 5.29 6.24 18%'Dabo' (Traditional Ambasha)... 350gm. 6.3 7.08 12%'Dabo' (Traditional Sheleto)... 350gm. 4.65 5.29 14%Bread Wheat (Bakery). 350gm. 5.86 6.89 18%Biscuits (Local). 150gm. 7.22 7.68 6%
UNMILLED CEREALS/GRAINSTeff' White Kg. 23.09 27.33 18%Teff' Mixed. Kg. 20.82 24.74 19%Teff' Black (Red). Kg. 18.7 22.15 18%Wheat White. Kg. 15.02 17.91 19%Wheat Mixed. Kg. 13.17 15.34 16%Wheat Black (Red). Kg. 14.65 17.70 21%Barley White. Kg. 15.42 17.09 11%Barley Mixed. Kg. 13.2 14.31 8%Barley Black. Kg. 14.31 15.62 9%Barley for Beer. Kg. 15.95 17.80 12%Maize (White). Kg. 8.52 9.45 11%Durrah(red). Kg. 11.25 13.49 20%Sorghum Yellow. Kg. 12.64 15.79 25%Sorghum White. Kg. 11.17 13.59 22%Sorghum Red. Kg. 9.45 10.78 14%African Millet. Kg. 13.39 15.63 17%Rice (Imported). Kg. 24.48 26.73 9%Emmer Wheat (shelled) Aja. Kg. 20.4 23.94 17%Emmer Wheat (unshelled). Kg. 31.29 32.03 2%
CEREALS MILLEDTeff' White. Kg. 24.81 30.4 23%Teff' Mixed. Kg. 22.89 27.5 20%Teff' Black (Red). Kg. 21.23 26.54 25%Wheat White. Kg. 17.8 19.52 10%Wheat Mixed. Kg. 15.92 17.77 12%Barley White. Kg. 34.77 38.22 10%Barley Mixed. Kg. 35 39.02 11%Maize (White). Kg. 11.29 12.26 9%Emmer Wheat(Aja). Kg. 44.03 46.15 5%Sorghum. Kg. 12.37 16.51 33%'Furno Duket' Locally Processed.. Kg. 20.35 23.13 14%Fafa' Flour. Kg. 92.8 126.72 37%Serifam. Kg. 181.67 196.9 8%Dube' Flour. Kg. 50 44.72 -11%
PASTA AND OTHER PREPARED CEREAL PRODUCTSSpaghetti (Local) Without Egg. Kg. 31.49 33.63 7%Pastini. Kg. 36.18 38.06 5%Macaroni (Local) Without Egg. Kg. 25.78 27.02 5%
MEATBeef Kg. 175.31 225.45 29%Camel Meat Kg. 154.41 204.82 33%Goat Meat Kg. 202.83 259.64 28%Mutton Kg. 192.74 232.53 21%Pork Kg. 207.95 250.85 21%Chichen-Meat Kg. 161.73 195.61 21%
LIVESTOCKSheep (20Kg). No. 1247 1528.49 23%Goat (10-15Kg). No. 1170.9 1482.11 27%Heifer (2-4 Years). No. 4505.04 5363.92 19%Cow (4 Years and Above). No. 6453.7 8237.39 28%Bull (2-4 Years). No. 5541.74 6852.65 24%Ox (4 Years and Above). No. 11255.47 14044.49 25%Hen (Indigenous). No. 105.95 128.57 21%Cock (Indigenous). No. 167.08 207.32 24%
FISH AND FISH PRODUCTSFish Fresh. Kg. 57.22 59.28 4%Sardines (Imported). 125gm. 37.38 39.67 6%
DAIRY PRODUCTS AND EGGCow Milk (Unpasteurized). Lt. 21.15 25.17 19%Cow Milk (pasteurized). Lt. 28.91 34.89 21%Camel Milk. Lt. 21.95 28.59 30%Goat Milk. Lt. 16.08 25.51 59%Powdered Milk (Coast). 450gm. 171.64 187.61 9%Powdered Milk (NIDO). 450gm. 221.17 245.1 11%Yoghurt (Traditional). Lt. 35.58 41.45 16%Cheese Cottage. Kg. 59.89 73.92 23%Egg (Traditional). Dozen. 45.45 49.24 8%
Prices in Birr

RESEARCH & ANALYTICS
Disclaimer: This report represents solely the views, analysis, and judgement of the Cepheus research team and does not necessarily reflect the views or opinions of the Fund’s Managing Partners, Advisors, or Investors.
24
Annex 1: Food Price … cont'dEDIBLE OILS AND FATS
Butter Unrefined. Kg. 216.11 260.54 21%Cooking Oil (Imported). Lt. 26.63 27.36 3%Cooking Oil (Local). Lt. 70.33 74.32 6%Vegetable Butter(Sheno & Shady).. Kg. 157.86 171.85 9%Vegetable Butter(Alfa,Merzuqa)..15Kg. 1002.01 1511.98 51%
OIL SEEDSNiger Seed. Kg. 33.88 37.93 12%Linseed White. Kg. 73.17 77.92 6%Linseed Red. Kg. 35.69 41.4 16%Sesame Seed White. Kg. 45.4 59.11 30%Sesame Seed Red. Kg. 40.81 54.28 33%Sunflower White. Kg. 28.67 31.26 9%Castor Beans. Kg. 21.36 22.73 6%Rape Seed. Kg. 28.14 29.92 6%Ground Nut UnShelled. Kg. 37.74 42.22 12%
FRUITS FRESHBanana. Kg. 19.3 23.13 20%Orange. Kg. 30.82 35.48 15%Lemon. Kg. 23.01 30.63 33%Tangerine. Kg. 26.14 47.4 81%Papaya. Kg. 14.4 19.36 34%Grapes. Kg. 109.14 117.27 7%Avocado. Kg. 15.94 21.92 38%Mango. Kg. 15.85 22.31 41%Cactus. Kg. 6.85 6.35 -7%Pineapple. Kg. 23.09 26.83 16%Peach. Kg. 22.44 19.1 -15%Apple. Kg. 77.16 88.48 15%Dates. Kg. 79.36 93.97 18%
PULSES UNMILLEDHorse Beans. Kg. 20.28 22.93 13%Peas White. Kg. 25.24 28.57 13%Peas Green(dry). Kg. 22.05 23.92 8%Soya Beans. Kg. 23.1 24.29 5%Chick Peas. Kg. 23.35 23.8 2%Lentils. Kg. 35.74 53.62 50%Haricot Beans White. Kg. 17.11 18.83 10%Haricot Beans (Mixed). Kg. 13.6 15.02 10%Lima Beans. Kg. 25.83 31.21 21%Vetch. Kg. 14.24 17.38 22%Fenugreek(Green). Kg. 33.46 44.22 32%
PULSES MILLED OR SPLITHorse Beans Milled. Kg. 41.62 48.02 15%Peas Milled. Kg. 51.82 57.79 12%Chick Peas Milled. Kg. 57.46 59.49 4%Mixed Pulses Milled. Kg. 42.7 46.32 8%Vetch Milled. Kg. 32.47 34.76 7%Peas Split. Kg. 35.51 41.12 16%Peas Split(Roasted). Kg. 34.33 35.76 4%Horse Beans Split(Roasted). Kg. 29.12 32.86 13%Lentils Split. Kg. 51.43 67.35 31%Vetch Split(Roasted). Kg. 25.88 27.88 8%Chick Peas Split(Roasted). Kg. 38.8 39.08 1%Fenugreek Milled. Kg. 73.64 95.46 30%
VEGETABLES (FRESH)Ethiopian Kale. Kg. 8.06 11.35 41%Cauliflower. Kg. 33.56 36.46 9%Cabbage. Kg. 7.51 11.38 52%Lettuce. Kg. 19.21 24.32 27%Spinach. Kg. 8.16 10.11 24%Carrot. Kg. 12.45 19.97 60%Tomatoes. Kg. 14.02 18.1 29%Onions(Local). Kg. 15.65 27.88 78%Onions(Imported). Kg. 10.34 23.98 132%Garlics. Kg. 35.04 81.51 133%Leaks. Kg. 17.52 20.1 15%Pepper Green. Kg. 27.89 35.69 28%Pumpkin Kg. 4.12 5.78 40%Green Peas. Kg. 27.44 32.96 20%Beet Root. Kg. 10.04 12.54 25%Maize Fresh('Yebekolo Eshet). No. 3.37 3.79 12%
RESEARCH & ANALYTICS
Disclaimer: This report represents solely the views, analysis, and judgement of the Cepheus research team and does not necessarily reflect the views or opinions of the Fund’s Managing Partners, Advisors, or Investors.
25
Annex 1: Food Price … cont'dPOTATOES AND OTHER TUBERS
Potato. Kg. 8.53 14.46 70%Sweet Potato. Kg. 6.48 8.43 30%Kocho' (Processed). Kg. 12.92 17.9 39%Bula' Wet. Kg. 25.37 34.8 37%Anchote. Kg. 9.57 13.97 46%Godere. Kg. 4.67 6.07 30%Boye. Kg. 6.78 9.53 41%Amicho. Kg. 2.59 1.67 -36%Casava. Kg. 2.96 4.24 43%Shiferaw (Aleko). Kg. 5.2 7.92 52%
SUGAR,HONEY,CHOCOLATE AND CANDYSugar. Kg. 19.43 21.96 13%Sugar Cane. Kg. 5.81 5.78 -1%Honey (Unrefined). Kg. 140.49 168.93 20%Canned Tomato (Local). 410gm. 33.93 34.38 1%Dry Yeast(Safe Instant). 350gm. 92.96 102.06 10%
Food Products n.e.c (ND)Salt (Unpacked). Kg. 9.48 10.17 7%Iodized Salt. Kg. 13.01 13.16 1%Pepper Whole. Kg. 74.17 72.73 -2%Pepper Milled. Kg. 106.26 106.21 0%Chillies Whole Red&Dry. Kg. 79.88 78.79 -1%Chillies Milled. Kg. 109.73 114.15 4%Black Pepper(Imported). Kg. 361.44 337.49 -7%Long Pepper(Local). Kg. 102.1 112.4 10%White Cumin(Bishop's Weed)Local.. Kg. 48.08 49.18 2%Black Cumin(Local). Kg. 73.51 73.5 0%Ginger Dry(Local). Kg. 155.47 159.36 3%Ginger Wet(Local). Kg. 60.72 53.8 -11%Cloves(Imported). Kg. 384.76 400.13 4%Cinnamon(Imported). Kg. 131.6 165.42 26%Cardamon(Local). Kg. 293.79 334.45 14%Tumeric Unmilled. Kg. 41.24 41.96 2%Tumeric Flour(Local). Kg. 51.52 52.96 3%Basil Dry. Kg. 68.4 71.35 4%Basil Wet. Kg. 34 38.87 14%Savory. Kg. 42.23 47.88 13%Koseret Kg. 58.88 61.09 4%Rue Dry. Kg. 111.86 118.46 6%Coriander. Kg. 38.04 43.15 13%Mustard. Kg. 97.97 99.14 1%Mixed Spices. Kg. 111.26 131 18%
COST OF MILLING SERVICECereals. 100Kg. 53.92 72.44 34%Pulses. 100Kg. 71.45 101.71 42%Pepper Whole. 100Kg. 250.36 292.79 17%
NON-ALCOHOLIC BEVERAGESTea Leaves(Local). 100gm. 10.67 11.29 6%Coffee Whole. Kg. 34.66 36.22 5%Coffee Beans. Kg. 96.5 94.88 -2%Coffee Leaves. Kg. 29.29 35.11 20%Coffee Shel. Kg. 11.11 12.35 11%Buck Thorn Leaves. Kg. 32.18 34 6%Chat'. Kg. 98.91 128.64 30%Malt-Barley. Kg. 25.06 28.66 14%Malt-Wheat. Kg. 24.31 28.77 18%Ambo Water /Glass Bottle/......475cc. 9.8 10.39Plastic Bottle........... 500cc. - 14.28 15.23 7%Pepsi Family Plastic Bottle..... Lt. 38.31 39.53 3%Packed Mineral Water............. Lt. 10.09 10.33 2%Coca Cola in Glass Bottle......300cc. 9.9 10.45 6%Pepsi,Mirinda in Glass Bottle..300cc. 10.06 10.55 5%Packed Mango Juice............... Lt. 60.11 63.96 6%Honey Juice (non Alcoholic)...... Lt. 18.61 20.9 12%Harar Sofi (non Alcoholic).... 330cc. 14.23 15.55 9%
Source: CSA General CPI Country price index (with items as presented in CSA data) and Cepheus Research compilation.* Items in red font are those showing the highest price changes (above 15 percent vs year-ago levels).
RESEARCH & ANALYTICS
Disclaimer: This report represents solely the views, analysis, and judgement of the Cepheus research team and does not necessarily reflect the views or opinions of the Fund’s Managing Partners, Advisors, or Investors.
26
Annex 2: Non-Food Price Levels
% ChangeMay-18 May-19 May-19
ALCOHOLIC BEVERAGE:Spirits and Other Alcoholic BeveragesAraki (Local). 890cc. 85.23 89.68 5%Cognac (Local). 890cc. 86.23 92 7%Brandy (Local). 890cc. 88.17 91.17 3%Gin (Local). 890cc. 86.33 91.45 6%Aperitif (Local). 890cc. 86.06 92.37 7%Katikala' (Local). Lt. 42.64 48.12 13%Wine local (Guder). 750cc. 75.59 82.67 9%
BeerBeer (Bedele Normal). 330cc. 14.21 15.9 12%Beer(Harar Normal). 330cc. 14.26 15.75 10%Draft Beer(Any Kind). Lt. 31.44 34.03 8%Beer (Meta Abo normal). 330cc. 14.12 15.77 12%Beer (ST.George). 330cc. 14.4 16.05 11%Beer(Dashen Normal). 330cc. 14.1 15.92 13%
CIGARETTES AND TOBACCONyala. Packet. 19.99 20.05 0%Rothman. Packet. 56.37 56.63 0%Marlboro. Packet. 67.2 80.84 20%Benson. Packet. 38.8 28.6 -26%Royals. Packet. 30.09 31.35 4%Winston. Packet. - 60'Gaya' Kg. 89 103.33 16%'Suret'. Kg. 128.76 183.95 43%
CLOTHING AND FOOTWEARTextilesAbujedid(Arba Min.)150cm. Meter. 39.54 41.87 6%Khaki Drill(Arba Min.)150cm... Meter. 78.11 86.76 11%Wool-100% imported. Meter. 657.72 878.91 34%Tetron(Local). Meter. 83.68 100.86 21%Poplin(Arba Minch)150cm Local. Meter. 57.66 61.6 7%Polyster(Local). Meter. 78.85 86.12 9%Manchini Medium (Local). Meter. 64.71 72.71 12%Cotton. Kg. 32.46 35.46 9%'Kashemire' (imported). Meter. 68.84 73.7 7%'Diriya. Meter. 56.98 59.68 5%'Netela'. No. 253.92 287.18 13%'Kemis'(Traditional Dress). No. 738.25 906.58 23%'Kemis'and 'Netela'. No. 1038.07 1430.31 38%'Gabi'. No. 606.23 672.96 11%'Shiti'(Ready Made). No. 157.76 161.9 3%Shirts Long Sleeved (Local). No. 236.37 264.74 12%Shirts Long Sleeved (Imported)... No. 319.85 358.57 12%Shirts Short Sleeved (Imported).. No. 298.6 333.85 12%Shirts Short Sleeved (Local). No. 222.96 245.8 10%Socks (Cotton) Imported. Pair. 28.82 29.79 3%Sweater (Local) Men. No. 287.82 334.57 16%Sweater (Imported) Men. No. 424.07 441.5 4%Sweater (Local) Women. No. 271.81 271.3 0%T-Shirts (100% Cotton) Local. No. 65.08 71.74 10%Jeans Trouser Men (Imported). No. 453.12 499.41 10%Jeans Trouser Women (Imported)... No. 377.53 405.15 7%Tetron Trouser (Local) Men. No. 412.2 458.43 11%Woolen Suit(100%) (Local) Men. No. 3941.87 3787.03 -4%Woolen Suit(50-80%) (Local) Men.. No. 2594.89 2797.15 8%Leather Jacket (Local) Men. No. 1754.55 1859.98 6%Khaki Trouser (Imported) No. 456.86 500.21 9%T-Shirts With Lapel (Imported)... No. 242.4 272.1 12%Jogging Suit(No Lining) No. 447.05 462.94 4%Jogging Suit(Have Lining) No. 599.5 710.53 19%Khaki Jacket (Imported) Men. No. 646.37 714.58 11%Sweater-Women (Imported). No. 339.27 359.42 6%Brassiere (Imported) Women. No. 71.61 84.41 18%Under Wear (Imported). No. 72.64 92.07 27%Under Wear Short (Imported). No. 45.3 51.07 13%Stockings (Imported). No. 104.36 110.96 6%'Gildem (Imported). No. 216.87 243.27 12%'Mekremia (Imported). No. 170.94 180.09 5%Shirts (Imported) Women No. 282.06 301.5 7%Women Jeans Skirt (Imported). No. 341.4 385.05 13%Night Dresses (Imported) Women... No. 347.86 364.46 5%Pants(Cotton) Men. No. 50.45 57.09 13%Tight (Imported). No. 134.7 145.03 8%
Prices in Birr

RESEARCH & ANALYTICS
Disclaimer: This report represents solely the views, analysis, and judgement of the Cepheus research team and does not necessarily reflect the views or opinions of the Fund’s Managing Partners, Advisors, or Investors.
27
Annex 2: Non-Food Price … cont'dREADY-MADE FOR CHILDREN
Sweater (Local) for Boys. No. 196.5 201.61 3%Socks (Imported) for Boys. Pair. 18.72 20.14 8%Jeans Trousers (Imported). No. 290.31 331.4 14%Shirt Long Sleeved(Imported)Boys. No. 204.82 238.5 16%School Uniform For Boys No. 325.53 376.08 16%Sweater (Imported) for Boys. No. 252.13 283.09 12%Sweater (Imported) for Girls. No. 243.21 270.79 11%Sweater (Local) for Girls. No. 186.12 208.27 12%Kemise(for childeren) No. 438.64 489.33 12%Baby Cloths(Complete). No. 240.88 270.78 12%T-Shirt Short Sleeved(Imported).. No. 153.07 177.17 16%Suit Full (Imported) For children.No. 507.23 563.34 11%Jeans Jacket & Trouser (Imported..No. 431.36 468.59 9%Shorts with T-Shirt For children..No. 283.92 313.16 10%Joging Suit(Imported)For children.No. 307.03 332.29 8%Hair Shawl ('Shash')Imported. No. 38.91 43 11%'Sharp' For Female. No. 101.46 118.23 17%Scarf (Imported). No. 85.81 97.45 14%Belt (Local) Machine Made. No. 111.26 123.93 11%Neck Tie Made of Silk. No. 120.12 134.23 12%
COST OF TAILORING,CLEANING AND REPAIRINGWoolen Suit (Men). No. 848.64 956.52 13%Kahaki/Tetron Suit (Men). No. 439.79 472.7 7%Kahaki/Tetron Suit (Boys). No. 266.01 316.29 19%Dry Cleaning Men's Woolen Suit... No. 51.69 56.28 9%
SHOES FOR ADULTShoes Leather Men(Local). Pair. 544.89 596.27 9%Shoes Leather Men(Imported). Pair. 1413.31 1403.02 -1%Sport Shoes Men (Imported). Pair. Non Leather (Imported). Pair.503.92 586.13 16%Walking Shoes Men Non Leather (Imported). Pair. 430.32 483.16 12%Walking Shoes Women Non Leather (Imported). Pair. 377.18 397.36 5%Canvas Shoes (China) Men. Pair. 259.13 292.17 13%Canvas Shoes (China) Women. Pair. 220.41 247.08 12%Shoes Plastic Women (Local). Pair. 32.51 36.08 11%Shoes Plastic Women (Imported). Pair. 40.48 48.34 19%Sliper With Bird Mark(Imported).Pair. 42.5 48 13%Sliper Plastic Male (Local). Pair. 42.34 46.94 11%Sliper Plastic Female (Local).. Pair. 41.7 44.99 8%Plastic Boot Shoe Male (Local). Pair. 152.46 173.66 14%Sendal Plastic Shoe Male(Local).Pair. 40.13 47.09 17%Sendal Leather Shoe Male(Local).Pair. 261.98 302.02 15%Shoe Leather,Women(Local). Pair. 257.04 279.87 9%Shoe Leather,Women(China). Pair. 360.15 382.31 6%Sliper Leather Women(Local). Pair. 211.77 221.94 5%
CHILDREN SHOESShoe Leather Boys (Local). Pair. 268.1 305.83 14%Shoe Leather Girls (Local). Pair. 221.77 250.9 13%Plastic Shoe Girls (Local). Pair. 27.33 29.6 8%Shoe Leather (Imported). Pair. 312.99 334.02 7%Walking Shoe Not Leather (Imported). Pair. 281.44 318.94 13%Sandals Leather Shoe(Local). Pair. 190.06 203.37 7%Shoes Rubber (Local). Pair. 34.33 36.2 5%Sliper Plastic (Local). Pair. 34.99 37 6%
REPAIR AND HIRE OF FOOTWEARShoe Cleaning No. 5.84 6.8 16%Repair of Footwear Pair. 64.28 75.13 17%
HOUSING RENT,WATER,ELECTRICTY,GAS,AND OTHER FUELSHouse RentA House with 2 bed rooms and 24-32 sqm, month 894.18 1148.12 28%Condominum 1 bed room (2nd floor) and 40-50 sqm, month 1138.6 874.64 -23%Construction MaterialsCement/Bag/(Local). 50Kg. 145.16 167.96 16%Jeso(Local). Kg. 3.55 3.56 0%Nail (7cm - 12cm) (Local). Kg. 86.69 79.49 -8%Nail With Cape (Local). Kg. 89.96 101.53 13%Corrugated Iron Sheet (.2mm). No. 208.69 221.52 6%Wood for House Construction('Atana'). No. 51.9 57.71 11%Wall Paints-Super Mega (Fluid) Normal........... 4Kg. 194.6 209.96 8%Wall Paints-Super Mega (Fluid) Plastic.. 4Kg. 338.83 378.85 12%Wall Paints-Super Mega (Fluid) Synthetic........... 4Kg. 386.3 476.86 23%Nifas silk Super Paint(Plastic). 4Kg. 324.18 360.86 11%Nifas silk Super Paint Normal 200.9 226.92 13%Coarse Aggregate Gravel.. Meter Cube. 528.33 533.35 1%Hollow Concrete Block(15x20x40 cm Cube)... 10.83 11.22 4%Bricks (25cm x 12cm x 6cm). No. 7.74 8.6 11%Floor Board 4m Length. No. 201.12 207.22 3%Iron Pipe 6mt.(1/2 inch) Imported.No. 387.68 477.77 23%Chipwood (125cm x 250cm x 8mm)... No. 303.49 299.54 -1%Sand .................... Meter Cube. - 356.07Gutter Nº 33. Meter. 115.2 128.39 11%Window Glass (50cm x 50cm x 4mm). No. 80.78 98.85 22%Water Reservior (1000 Lt) Tanker,Roto Plastic. No. 4264.59 4377.22 3%
RESEARCH & ANALYTICS
Disclaimer: This report represents solely the views, analysis, and judgement of the Cepheus research team and does not necessarily reflect the views or opinions of the Fund’s Managing Partners, Advisors, or Investors.
28
Annex 2: Non-Food Price … cont'dWATER SUPPLY
Water 1st Tariff (Gov't).......Meter Cube. 4.17 4.53 9%Water 2nd Tariff (Gov't).......Meter Cube. 5.68 6.27 10%Pipe water from Retailers......Meter Cube. 48.68 55.9 15%Pipe water from 'BONO'.........Meter Cube. 12.81 15.62 22%
ElectricityElectric Initial Tariff K.Watt. 0.27 0.27 0%Electric 2nd Tariff K.Watt. - 0.45Electric 3rd Tariff K.Watt. - 0.75Dry cell (Big) No. 9.62 12.14 26%
GasButhane Gas (Shell)...............12.5 Kg. 581.36 668.1 15%
LIQUID FUELSKerosine. Lt. 16.47 18.66 13%Diesel. Lt. 16.47 18.65 13%
SOLID FUELSFire Wood. Kg. 2.21 2.39 8%Charcoal. Kg. 9.74 11.02 13%Dung Cake. Kg. 2.84 3.14 11%
FURNISHINGS, HOUSEHOLD EQUIPMENT AND ROUTINE MAINTENANCE OF THE HOUSEChairs, Tables, etcTable (Machine made) Varnished. No. 2220.91 2620.81 18%Chairs (Machine Made) Varnished. No. 991.48 1021.37 3%Cupboard (2 doors) Varnished. No. 5966.44 6744.47 13%Double Bed (120cm) Varnished. No. 5359.68 5813.35 8%Sofas (Complete). No. 19802.83 22041.45 11%Book Shelves Wanza (3 Shelves) no Door No. 2103.38 2333.53 11%Chest of Drawer No. 4155.17 4526.53 9%
CARPETS ANDOTHER FLOOR COVERINGPlastic mats Medium China. meter. 71.7 86.12 20%Plastic 'Jebena' Medium Size. No. 281.43 315.72 12%'Selen' mat (weaven from grass). No. 46.08 49.49 7%Bed Sheet(Patterned Local) 1.90m x 2.50m. Pair. 456.68 492.34 8%Bed Cover(Patterned Imported). No. 695.77 793.57 14%Blanket Woolen(Imported)180cm x 220cm. No. 1280.15 1302.6 2%Blanket Woolen(Local)180cm x 220cm. No. 368.49 393.88 7%Mattress-Sponge (Local) 120cm x 16cm.. No. 1917.95 2071.07 8%Mattress-Spring (Imported)120cm No. 2814.31 3071.86 9%Towel-Local (Medium). No. 86.96 90.81 4%Curtains-Imported. meter. 145.79 162.29 11%Cloth For Sofas Medium(Imporetd). meter. 118.26 142.38 20%Pillows. Pair. 156.15 180.89 16%
REFRIGERATORS,COOKERS,OVENS,CLEANING MACHINE,CLOTH TAILING MACHIN ETC.Refregrator(240-270 Liter). No. 12386 13526.5 9%Cooking Pan Medium (Local). No. 83.01 97.57 18%Kettles-2liter (Local). No. 129.74 227.82 76%Tray Medium Nº 555/40 (Imported). No. 50.12 57.64 15%Elecrtic Stove China. No. 404.52 428.57 6%Electric 'Mitad' Aluminium. No. 1767.43 2159.04 22%Gas Stove (Kerosine) China. No. 228.8 234.55 3%Permuz (China). No. 170.1 188.16 11%Water Pot 'Ensira' Medium. No. 48.39 52.6 9%'Jebena' Medium Size. No. 36.4 40.49 11%'Mitad' (Griddle of Clay). No. 90.92 108.41 19%Local Charcoal Stove(Metal). No. 96.19 104.75 9%Local Charcoal Stove(Clay). No. 35.14 38 8%Sack 100Kg Capacity. No. 10.44 11.74 12%Plastic Jerrycan (10 Litres). No. 45.13 54.18 20%Knives Medium (Imported). No. 34.33 38.19 11%Bucket/pail (local) Plastic. No. 56.18 65.47 17%Jog Plastic (Local). No. 20.22 23.91 18%
GLASSWARES,TABLES AND KICHEN MATERIALSGlass for Tea (Indonesia)............. No. 10.48 12.45 19%Jog Non Plastic (Imported)............ No. 125.96 149.82 19%Glass China. No. 14 16.24 16%Cup for Coffee (China). No. 6.8 7.4 9%Fjeans 45.31 46.35 2%'Sefed'. No. 65.59 74.51 14%'Mesob'. No. 1270.12 1366.62 8%'Lemat'. No. 513.23 562.07 10%'Akimbalo'. No. 25.29 29.76 18%'Rekeboat' Plastic. No. 72.11 82.79 15%Plastic Basket. No. 60.04 65.82 10%
MAJOR TOOLS AND EQUIPMENTSSickel. No. 68.98 85.72 24%Pick Axe ('Doma'). No. 123.26 143.2 16%'Gejera'. No. 127.71 169.19 32%'Mofer'. No. 152.67 171.2 12%'Kember'. No. 102.32 127.49 25%'Digr'. No. 29.91 31.29 5%Tip of Plough 'Maresha'. No. 133.26 146.54 10%Shovel. No. 90.51 107.44 19%'Wegel'. No. 35.21 40.01 14%'Erfe '. No. 26.03 30.34 17%

RESEARCH & ANALYTICS
Disclaimer: This report represents solely the views, analysis, and judgement of the Cepheus research team and does not necessarily reflect the views or opinions of the Fund’s Managing Partners, Advisors, or Investors.
29
Annex 2: Non-Food Price … cont'dCLEANING AND MAINTENANCE,ARTICLES FOR CLEANING, PAPER PRODUCTS & OTHERS
Laundary Soap (Local). 200gm. 10.21 11.09 9%Laundary Soap (Imported). 200gm. 12 12.51 4%Detergent (Imported). 50gm. 5.24 5.74 10%Incense. Kg. 129.43 147.36 14%Sandal Wood. No. 0.72 0.91 26%Toilet Paper (Mamko). No. 14.05 14.62 4%Detergent(Local) 200gm. 12.77 13.45 5%Matches. Box. 1.38 1.59 15%Candles(Big). No. 5.83 7.74 33%Liquid Soap (Largo). Lt. 37.56 41.24 10%Plastic Barel 'Bermel'(200-220 Lt). No. 603.23 667.05 11%Insecticides. 500cc. 93.79 130.76 39%Air fresher 500cc. 83.17 95.6 15%Broom. No. 51.45 55.11 7%Plastic Bag Kurtu 'festal' (Big). No. 3.67 4.32 18%
DOMESTIC SERVICEMaid Servant. Month. 582.31 669.62 15%Unskilled Service (Daily Laborer).. Day. 87.22 100.34 15%Salary for Guard Month. 736.76 816.91 11%
HEALTHPharmaceutical productsAmpicillin(250 mg) Local..........20 Caps. 24.42 27.35 12%Tetracycline (250 mg) Local.......56 Caps. 32.55 35.45 9%Penicillin injection(4 Mu. Local)..Bottle. 14.36 21.39 49%Chloramphenicol(250mg) Local......56 Caps. 51.02 53.32 5%Paracitamole(500mg) Local........20 Pills. 5.94 8.39 41%Cough Syrup (Efadykse) Local. 125cc. 25.8 28.48 10%Bactrim(480mg) Local.............30 Pills. 15.67 17.99 15%Vermox(100mg) Local..............12 Pills. 5.91 7.01 19%Mezel(250mg) Local............... 30 Caps. 15.96 17.65 11%Asprin (300mg) Local............ 20 Pills. 5.98 7.66 28%Insulin(India). Bottle. 108.62 135.55 25%Amoxacillin(500mg) Local......... 16 Caps. 20.14 21.77 8%Magnesium Trisilicate Local......30 Pills. 10.57 12.04 14%Coartem (Swezerland).............24 Pills. 87.95 86.64 -1%Amoxcil (500mg) Imported......... 20 Caps. 110.42 127.53 15%Astazol(Mibendazol) India........20 Pills. 11.53 14.36 25%Kadprim(Co-trimoxcazol) Local...20 Pills. 10.89 13.5 24%
DOCTORS CONSULTATIONS AND LABRATORYDoctor's Fee (Government)...... per visit. 8.35 9.21 10%Doctor's Fee (Private)......... per visit. 26.48 30.31 14%Injection Service Charge (Private).. Once. 3.75 4.57 22%
DENTAL AND OTHER SERVICESSingle Tooth extraction (Privet).... Once. 237.3 272.81 15%
MEDICAL LABRATORY AND OTHER X-RAY SERVICESLabratory Test Fee (Private)........ Once. 18.34 21.18 15%Labratory Test Fee (Gov't).......... Once. 7.86 8.69 11%X-Ray(For TB) (Private)............. Once. 129.35 150.66 16%Ultrasound Womb (Private)........... Once. 132.42 148.4 12%Ultrasound Womb (Gov't)............. Once. 58.99 55.85 -5%
HOSPITAL SERVICESBed Charge (Gov't)................per day. 18.27 19.11 5%Bed Charge (Private)..............per day. 111.77 120.99 8%
TRANSPORTPURCHASE OF VEHICLES DIFFERENT MOTOR CARSNew Lifan Local....................... - -Toyota Corolla Used Imported.......... 518710.77 734846.92 42% MOTOR CYCLESNew Motor Cycles(100-120cc)........... 40325.57 59031.13 46% BICYCLESNew Bicycles For Adult................ 6017.98 6436.89 7%
ANIMAL DRAWN VEHICLES AND LOADCart Fare........................... Tr 2.76 3.23 17%Male Donkey For Loading.............. 2491.05 2721.11 9%Male Horse For Riding................ 4930.71 5231.33 6%Mule For Riding ..................... 8679.05 9219.31 6%Camel For Loading.................... 13933.95 16927.06 21%Animal Transport rental For a day For Transporting People......... Trip. 96.74 97.7 1%Animal Transport rental For a day For Transporting Goods.......... Trip. 65.5 73.6 12%
FUELS AND LUBRICANTSBenzene............................... 18.87 21.19 12%Motor Oil (Oilibya,Total)............. 105.46 119.9 14%PERSONAL TRANSPORT MAINTENANCE,SPARE PART AND REPAIR SERVICE FEE Technical inspection service For Automobile................. Once. 770.12 646.02 -16%Tyre for Automobile Local........... No. 2070.4 2500.88 21%Car Battrey - Bosech................ No. 2609.55 1207.28 -54%Tyre Repair For Automobile.......... Once. 26.95 27.98 4%Gear Repair......................... No. 282.27 391.83 39%Brake Repair........................ No. 266.85 300.03 12%Automobile Rents.................... Day. 842.54 725.65 -14%PARKING,DRIVING LICENSE,CAR TEST,TOOL FACILITIES & CAR RENTSAutomobile Driver Training. Once. 6123.5 6559.67 7%Automobile licences Fee Once. 259.28 257.98 -1%Parking Fee For Automobile. Minute. 0.91 0.43 -53% AUTOMOBILE,BAJAJ & TAXI RENT AND ANIMAL CART TRANSPORT SERVICESBus Fare (per km). Tarif. 0.4 0.42 5%Bus Fare (within Town) Trip. 1.44 1.58 10%Taxi-Mini Bus Fare Trip. 2.1 2.26 8%Bajaj Fare Trip. 2.44 3.07
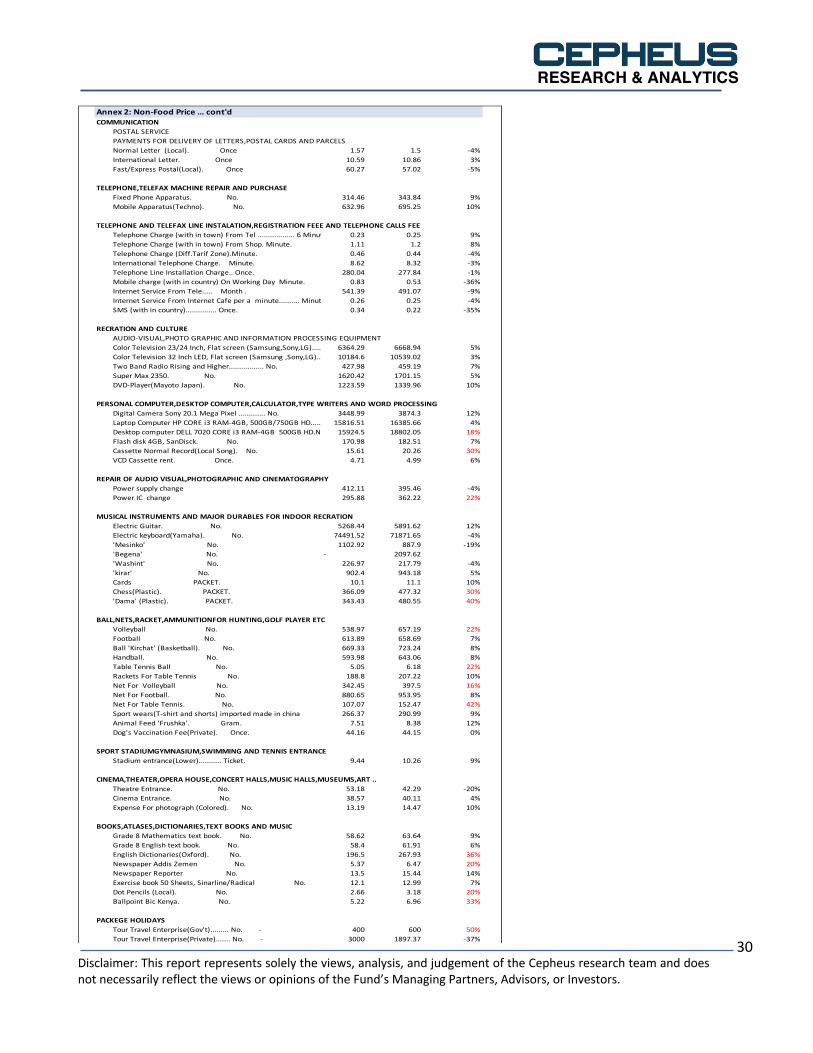
RESEARCH & ANALYTICS
Disclaimer: This report represents solely the views, analysis, and judgement of the Cepheus research team and does not necessarily reflect the views or opinions of the Fund’s Managing Partners, Advisors, or Investors.
30
Annex 2: Non-Food Price … cont'dCOMMUNICATION
POSTAL SERVICEPAYMENTS FOR DELIVERY OF LETTERS,POSTAL CARDS AND PARCELSNormal Letter (Local). Once 1.57 1.5 -4%International Letter. Once 10.59 10.86 3%Fast/Express Postal(Local). Once 60.27 57.02 -5%
TELEPHONE,TELEFAX MACHINE REPAIR AND PURCHASEFixed Phone Apparatus. No. 314.46 343.84 9%Mobile Apparatus(Techno). No. 632.96 695.25 10%
TELEPHONE AND TELEFAX LINE INSTALATION,REGISTRATION FEEE AND TELEPHONE CALLS FEETelephone Charge (with in town) From Tel .................. 6 Minute. 0.23 0.25 9%Telephone Charge (with in town) From Shop. Minute. 1.11 1.2 8%Telephone Charge (Diff.Tarif Zone).Minute. 0.46 0.44 -4%International Telephone Charge. Minute. 8.62 8.32 -3%Telephone Line Installation Charge.. Once. 280.04 277.84 -1%Mobile charge (with in country) On Working Day Minute. 0.83 0.53 -36%Internet Service From Tele..... Month . 541.39 491.07 -9%Internet Service From Internet Cafe per a minute.......... Minute. 0.26 0.25 -4%SMS (with in country)............... Once. 0.34 0.22 -35%
RECRATION AND CULTUREAUDIO-VISUAL,PHOTO GRAPHIC AND INFORMATION PROCESSING EQUIPMENTColor Television 23/24 Inch, Flat screen (Samsung,Sony,LG)....... No. 6364.29 6668.94 5%Color Television 32 Inch LED, Flat screen (Samsung ,Sony,LG)...... No. 10184.6 10539.02 3%Two Band Radio Rising and Higher................. No. 427.98 459.19 7%Super Max 2350. No. 1620.42 1701.15 5%DVD-Player(Mayoto Japan). No. 1223.59 1339.96 10%
PERSONAL COMPUTER,DESKTOP COMPUTER,CALCULATOR,TYPE WRITERS AND WORD PROCESSINGDigital Camera Sony 20.1 Mega Pixel ............. No. 3448.99 3874.3 12%Laptop Computer HP CORE i3 RAM-4GB, 500GB/750GB HD........... No.15816.51 16385.66 4%Desktop computer DELL 7020 CORE i3 RAM-4GB 500GB HD.No. 15924.5 18802.05 18%Flash disk 4GB, SanDisck. No. 170.98 182.51 7%Cassette Normal Record(Local Song). No. 15.61 20.26 30%VCD Cassette rent. Once. 4.71 4.99 6%
REPAIR OF AUDIO VISUAL,PHOTOGRAPHIC AND CINEMATOGRAPHYPower supply change 412.11 395.46 -4%Power IC change 295.88 362.22 22%
MUSICAL INSTRUMENTS AND MAJOR DURABLES FOR INDOOR RECRATIONElectric Guitar. No. 5268.44 5891.62 12%Electric keyboard(Yamaha). No. 74491.52 71871.65 -4%'Mesinko' No. 1102.92 887.9 -19%'Begena' No. - 2097.62'Washint' No. 226.97 217.79 -4%'kirar' No. 902.4 943.18 5%Cards PACKET. 10.1 11.1 10%Chess(Plastic). PACKET. 366.09 477.32 30%'Dama' (Plastic). PACKET. 343.43 480.55 40%
BALL,NETS,RACKET,AMMUNITIONFOR HUNTING,GOLF PLAYER ETCVolleyball No. 538.97 657.19 22%Football No. 613.89 658.69 7%Ball 'Kirchat' (Basketball). No. 669.33 723.24 8%Handball. No. 593.98 643.06 8%Table Tennis Ball No. 5.05 6.18 22%Rackets For Table Tennis No. 188.8 207.22 10%Net For Volleyball No. 342.45 397.5 16%Net For Football. No. 880.65 953.95 8%Net For Table Tennis. No. 107.07 152.47 42%Sport wears(T-shirt and shorts) imported made in china No. 266.37 290.99 9%Animal Feed 'Frushka'. Gram. 7.51 8.38 12%Dog's Vaccination Fee(Private). Once. 44.16 44.15 0%
SPORT STADIUMGYMNASIUM,SWIMMING AND TENNIS ENTRANCEStadium entrance(Lower)........... Ticket. 9.44 10.26 9%
CINEMA,THEATER,OPERA HOUSE,CONCERT HALLS,MUSIC HALLS,MUSEUMS,ART ..Theatre Entrance. No. 53.18 42.29 -20%Cinema Entrance. No. 38.57 40.11 4%Expense For photograph (Colored). No. 13.19 14.47 10%
BOOKS,ATLASES,DICTIONARIES,TEXT BOOKS AND MUSICGrade 8 Mathematics text book. No. 58.62 63.64 9%Grade 8 English text book. No. 58.4 61.91 6%English Dictionaries(Oxford). No. 196.5 267.93 36%Newspaper Addis Zemen No. 5.37 6.47 20%Newspaper Reporter No. 13.5 15.44 14%Exercise book 50 Sheets, Sinarline/Radical No. 12.1 12.99 7%Dot Pencils (Local). No. 2.66 3.18 20%Ballpoint Bic Kenya. No. 5.22 6.96 33%
PACKEGE HOLIDAYSTour Travel Enterprise(Gov't)......... No. - 400 600 50%Tour Travel Enterprise(Private)....... No. - 3000 1897.37 -37%
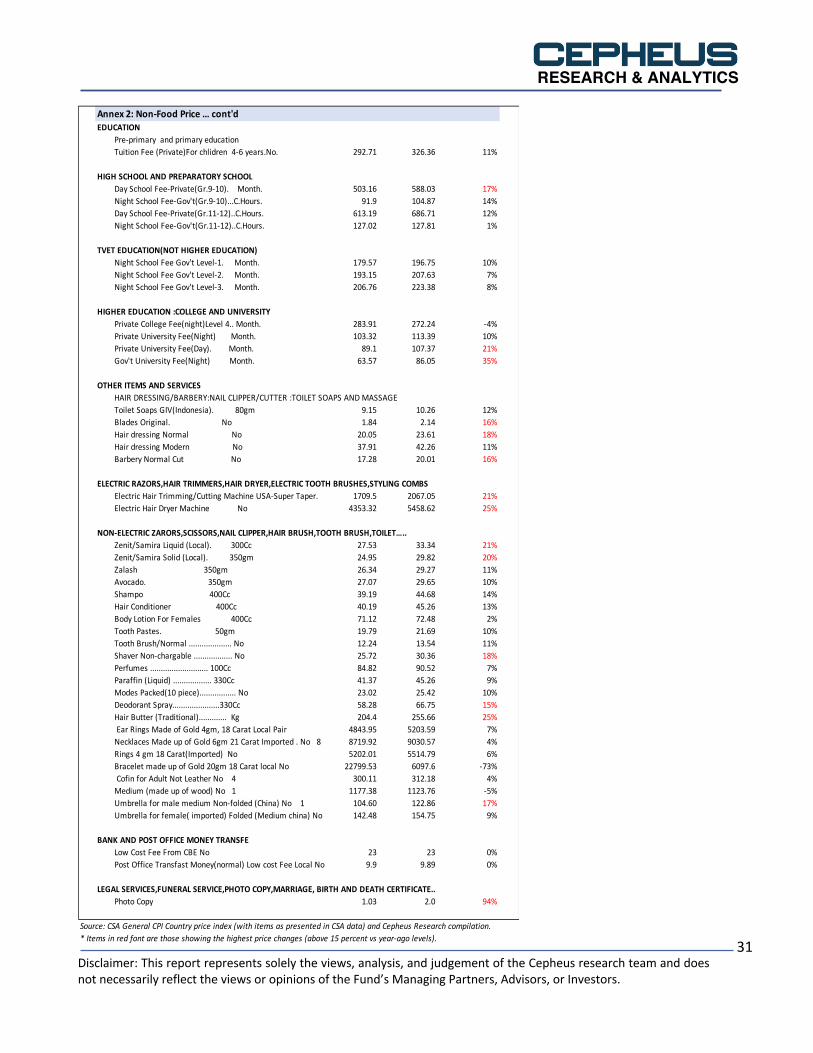
RESEARCH & ANALYTICS
Disclaimer: This report represents solely the views, analysis, and judgement of the Cepheus research team and does not necessarily reflect the views or opinions of the Fund’s Managing Partners, Advisors, or Investors.
31
Annex 2: Non-Food Price … cont'd
EDUCATION
Pre-primary and primary educationTuition Fee (Private)For chlidren 4-6 years.No. 292.71 326.36 11%
HIGH SCHOOL AND PREPARATORY SCHOOL
Day School Fee-Private(Gr.9-10). Month. 503.16 588.03 17%Night School Fee-Gov't(Gr.9-10)...C.Hours. 91.9 104.87 14%Day School Fee-Private(Gr.11-12)..C.Hours. 613.19 686.71 12%Night School Fee-Gov't(Gr.11-12)..C.Hours. 127.02 127.81 1%
TVET EDUCATION(NOT HIGHER EDUCATION)
Night School Fee Gov't Level-1. Month. 179.57 196.75 10%Night School Fee Gov't Level-2. Month. 193.15 207.63 7%Night School Fee Gov't Level-3. Month. 206.76 223.38 8%
HIGHER EDUCATION :COLLEGE AND UNIVERSITY
Private College Fee(night)Level 4.. Month. 283.91 272.24 -4%Private University Fee(Night) Month. 103.32 113.39 10%Private University Fee(Day). Month. 89.1 107.37 21%Gov't University Fee(Night) Month. 63.57 86.05 35%
OTHER ITEMS AND SERVICES
HAIR DRESSING/BARBERY:NAIL CLIPPER/CUTTER :TOILET SOAPS AND MASSAGE Toilet Soaps GIV(Indonesia). 80gm 9.15 10.26 12%Blades Original. No 1.84 2.14 16%Hair dressing Normal No 20.05 23.61 18%Hair dressing Modern No 37.91 42.26 11%Barbery Normal Cut No 17.28 20.01 16%
ELECTRIC RAZORS,HAIR TRIMMERS,HAIR DRYER,ELECTRIC TOOTH BRUSHES,STYLING COMBS
Electric Hair Trimming/Cutting Machine USA-Super Taper. No1709.5 2067.05 21%Electric Hair Dryer Machine No 4353.32 5458.62 25%
NON-ELECTRIC ZARORS,SCISSORS,NAIL CLIPPER,HAIR BRUSH,TOOTH BRUSH,TOILET…..
Zenit/Samira Liquid (Local). 300Cc 27.53 33.34 21%Zenit/Samira Solid (Local). 350gm 24.95 29.82 20%Zalash 350gm 26.34 29.27 11%Avocado. 350gm 27.07 29.65 10%Shampo 400Cc 39.19 44.68 14%Hair Conditioner 400Cc 40.19 45.26 13%Body Lotion For Females 400Cc 71.12 72.48 2%Tooth Pastes. 50gm 19.79 21.69 10%Tooth Brush/Normal .................... No 12.24 13.54 11%Shaver Non-chargable .................. No 25.72 30.36 18%Perfumes ........................... 100Cc 84.82 90.52 7%Paraffin (Liquid) .................. 330Cc 41.37 45.26 9%Modes Packed(10 piece)................. No 23.02 25.42 10%Deodorant Spray......................330Cc 58.28 66.75 15%Hair Butter (Traditional)............. Kg 204.4 255.66 25% Ear Rings Made of Gold 4gm, 18 Carat Local Pair 4843.95 5203.59 7%Necklaces Made up of Gold 6gm 21 Carat Imported . No 8 8719.92 9030.57 4%Rings 4 gm 18 Carat(Imported) No 5202.01 5514.79 6%Bracelet made up of Gold 20gm 18 Carat local No 22799.53 6097.6 -73% Cofin for Adult Not Leather No 4 300.11 312.18 4%Medium (made up of wood) No 1 1177.38 1123.76 -5%Umbrella for male medium Non-folded (China) No 1 104.60 122.86 17%Umbrella for female( imported) Folded (Medium china) No 2 142.48 154.75 9%
BANK AND POST OFFICE MONEY TRANSFE
Low Cost Fee From CBE No 23 23 0%Post Office Transfast Money(normal) Low cost Fee Local No 9.9 9.89 0%
LEGAL SERVICES,FUNERAL SERVICE,PHOTO COPY,MARRIAGE, BIRTH AND DEATH CERTIFICATE..
Photo Copy 1.03 2.0 94%
Source: CSA General CPI Country price index (with items as presented in CSA data) and Cepheus Research compilation.* Items in red font are those showing the highest price changes (above 15 percent vs year-ago levels).