explaining growth: a contest between models · explaining growth: a contest between models by ......
TRANSCRIPT

_____________________________________________________________________CREDIT Research Paper
No. 00/11
Explaining Growth: A Contest betweenModels
by
Michael Bleaney and Akira Nishiyama
_____________________________________________________________________
Centre for Research in Economic Development and International Trade,University of Nottingham
The Centre for Research in Economic Development and International Trade is based inthe School of Economics at the University of Nottingham. It aims to promote researchin all aspects of economic development and international trade on both a long term anda short term basis. To this end, CREDIT organises seminar series on DevelopmentEconomics, acts as a point for collaborative research with other UK and overseasinstitutions and publishes research papers on topics central to its interests. A list ofCREDIT Research Papers is given on the final page of this publication.
Authors who wish to submit a paper for publication should send their manuscript tothe Editor of the CREDIT Research Papers, Professor M F Bleaney, at:
Centre for Research in Economic Development and International Trade,School of Economics,University of Nottingham,University Park,Nottingham, NG7 2RD,UNITED KINGDOM
Telephone (0115) 951 5620Fax: (0115) 951 4159
CREDIT Research Papers are distributed free of charge to members of the Centre.Enquiries concerning copies of individual Research Papers or CREDIT membershipshould be addressed to the CREDIT Secretary at the above address.

_____________________________________________________________________CREDIT Research Paper
No. 00/11
Explaining Growth: A Contest betweenModels
by
Michael Bleaney and Akira Nishiyama
_____________________________________________________________________
Centre for Research in Economic Development and International Trade,University of Nottingham

The AuthorsMichael Bleaney is Professor and Akira Nishiyama is Research Student, both in theSchool of Economics, University of Nottingham.
____________________________________________________________ August 2000
Explaining Growth: A Contest between Models
byMichael Bleaney and Akira Nishiyama
AbstractRecent contributions to the empirical growth literature show no tendency to convergencein specification, as researchers seek to identify new variables that can account forsignificant regional effects in earlier work. We conduct non-nested tests between themodels of Barro (1997), Easterly and Levine (1997) and Sachs and Warner (1997). Thedata strongly prefer an encompassing model, but fail to reject any of the candidatemodels, implying that each model represents a partial truth. We identify a model thatincludes most (but not all) of the regressors in the candidate models and is robust to theinclusion of regional dummies.
Outline1. Introduction2. The Competing Models3. An Encompassing Model4. Conclusions

1
I INTRODUCTION
The empirics of growth has itself been a growth area of research in the last fifteen years,
stimulated by new theoretical developments and new data bases. In an article published in
1992, Levine and Renelt noted the proliferation of explanatory variables in published
growth regressions, and attempted to introduce some order into the discussion by
identifying the variables which were robustly significant across specifications. This
exercise has since been repeated with a different methodology and somewhat different
results (Sala-i-Martin, 1997). Nevertheless empirical growth research has continued to
show a strong tendency towards further proliferation of alternative specifications, and not
of convergence towards an agreed specification. New variables such as ethno-linguistic
diversity, measures of institutional quality, and the share of primary products exports in
GNP have been found to be statistically significant in growth regressions (Easterly and
Levine, 1997; Sachs and Warner, 1997).
This trend towards divergence has been driven by several factors. One is that investment
(one of Levine and Renelt’s few robust variables) has increasingly been seen as
endogenous to growth, and therefore part of what needs to be explained rather than part
of the explanation (e.g. Barro, 1997, pp. 32-3). A second factor is that the statistical
significance of regional dummy variables (e.g. for sub-Saharan Africa) in Barro’s (1991)
regression has been regarded as evidence of omitted regressors and therefore as a
challenge to be met by finding more acceptable alternatives. Thirdly, of course,
researchers are continually having new ideas and finding new data. The purpose of the
present paper is to test how some recent models, with different specifications, match up
against one another when tested on the same data set. The point of the exercise is that
these models contain very different explanatory variables. The models tested are those of
Sachs and Warner (1997) (whose data set we use), Barro (1997) and Easterly and Levine
(1997). Our main conclusion is that we can improve considerably on any one of these
models by adding elements from the others. This is encouraging in the sense that new
models are offering genuine value added.
2
II THE COMPETING MODELS
We consider three models that have figured in the recent empirical growth literature:
those of Barro (1997), Easterly and Levine (1997) and Sachs and Warner (1997). Barro’s
model is an update of his earlier work (Barro, 1991), but using a panel of ten-year
average growth rates instead of a pure cross-section. The main innovations in his 1997
specification are the inclusion of male (but not female) secondary and higher schooling, a
rule of law index, an index of democracy and its square, and an interactive term between
male schooling and initial per capita income. Easterly and Levine (1997) [EL hereafter]
emphasise the role of ethnic diversity or fractionalisation (defined as the probability that
two randomly chosen individuals belong to different ethnic groups). They also include a
measure of financial depth and a quadratic term in initial per capita income, together with
a number of other variables from Barro’s earlier work. They too use a panel of three ten-
year averages. Sachs and Warner (1997) [SW hereafter] emphasise openness to
international trade, the share of primary products in exports, exposure to a tropical
climate and landlockedness, as well as more standard variables. Their data set is a pure
cross-section of 1965-90 average growth rates.
3
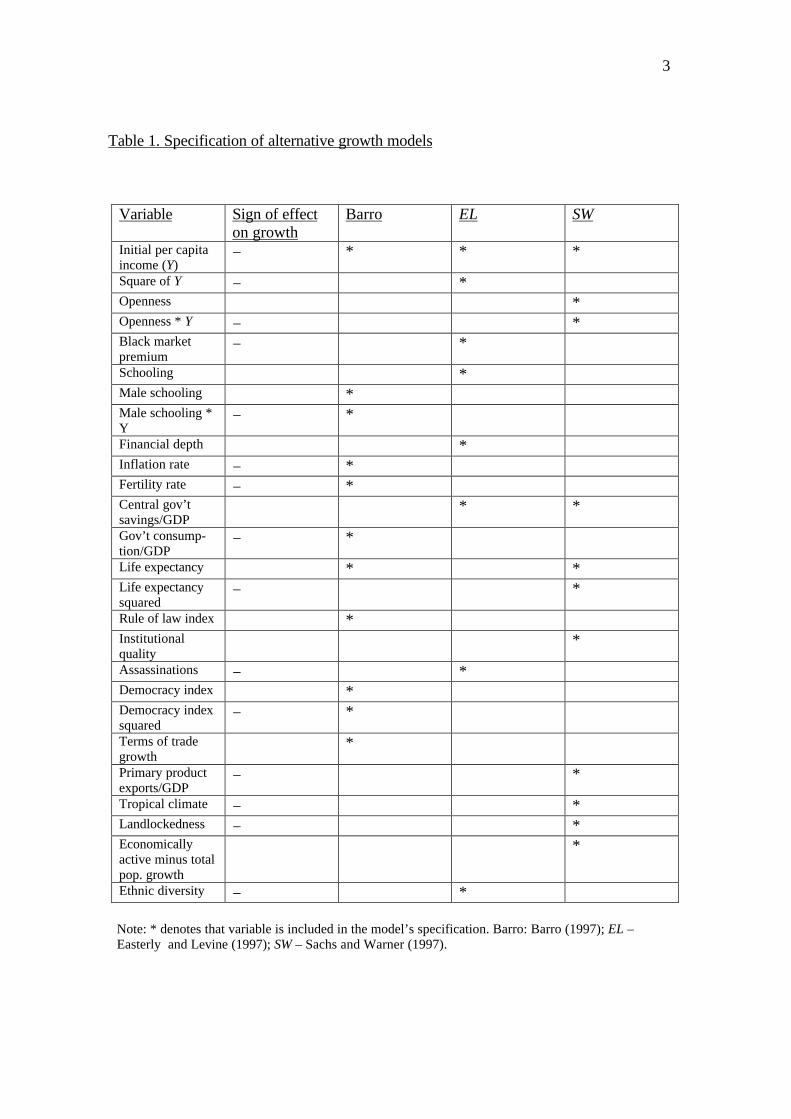
Table 1. Specification of alternative growth models
Variable Sign of effecton growth
Barro EL SW
Initial per capitaincome (Y)
− * * *
Square of Y − *Openness + *Openness * Y − *Black marketpremium
− *
Schooling + *Male schooling + *Male schooling *Y
− *
Financial depth + *Inflation rate − *Fertility rate − *Central gov’tsavings/GDP
+ * *
Gov’t consump-tion/GDP
− *
Life expectancy + * *Life expectancysquared
− *
Rule of law index + *Institutionalquality
+ *
Assassinations − *Democracy index + *Democracy indexsquared
− *
Terms of tradegrowth
+ *
Primary productexports/GDP
− *
Tropical climate − *Landlockedness − *Economicallyactive minus totalpop. growth
+ *
Ethnic diversity − *
Note: * denotes that variable is included in the model’s specification. Barro: Barro (1997); EL – Easterly and Levine (1997); SW – Sachs and Warner (1997).

4
The extent of the variation in the regression specifications of these three models is
demonstrated in Table 1. The log of initial per capita GDP is in fact the only one amongst
26 regressors that is common to all three models.1 This variation does not appear to be
the consequence of any identifiable theoretical differences between authors. The choice of
variables is an empirical decision made by investigators drawing on a common corpus of
theory. Using a single data set (that of SW), we investigate whether any of these three
models can be rejected in favour of the others, and if not, which variables would be
included in an encompassing model that yields a better fit to the data than any of the
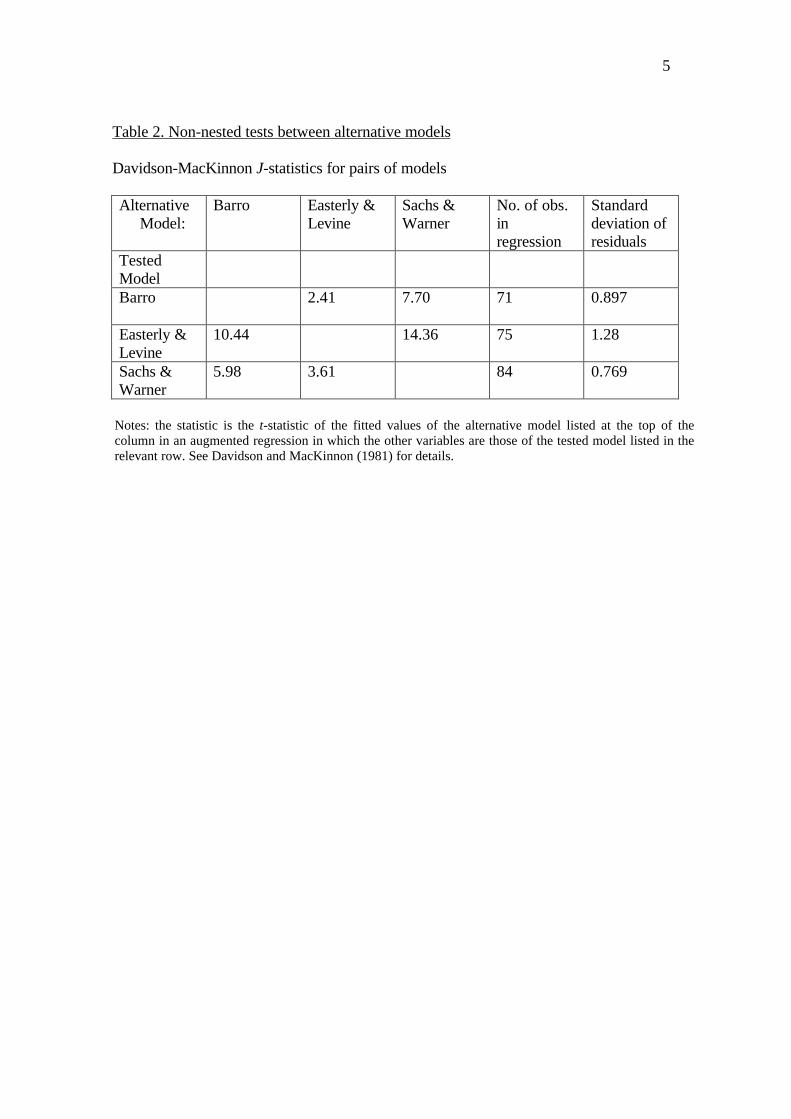
individual candidates. We begin by performing non-nested tests between each pair of
models. This results in six separate tests (see Table 2). The EL model performs
considerably less well than others, with a much higher standard error. Nevertheless it still
has statistically significant J-statistics (t-statistics of the fitted values) of 2.41 (p<0.02)
against the Barro model and 3.61 (p<0.01) against SW. Both of the other two models
have J-statistics of at least 5.98 in each test (p<0.001). This constitutes very strong
evidence that no single one of the candidate models unambiguously dominates the others.
The SW model performs best (not surprisingly, because the tests use their data set and
cross-section method), but the Barro model is not far behind, and the results imply that
each of these models can be significantly improved by adding at least some elements from
the other models. The EL model is clearly inferior to the others in terms of fit, but even
this model significantly improves each of the others.
1 Nevertheless some of the variables are closely related. For example the black market premium is a component
of SW’s measure of openness, and Barro’s rule of law index and SW’s measure of institutional quality are
drawn from the same source.
5
Table 2. Non-nested tests between alternative models
Davidson-MacKinnon J-statistics for pairs of models
Alternative Model:
Barro Easterly &Levine
Sachs &Warner
No. of obs.inregression
Standarddeviation ofresiduals
TestedModelBarro 2.41 7.70 71 0.897
Easterly &Levine
10.44 14.36 75 1.28
Sachs &Warner
5.98 3.61 84 0.769
Notes: the statistic is the t-statistic of the fitted values of the alternative model listed at the top of thecolumn in an augmented regression in which the other variables are those of the tested model listed in therelevant row. See Davidson and MacKinnon (1981) for details.
6
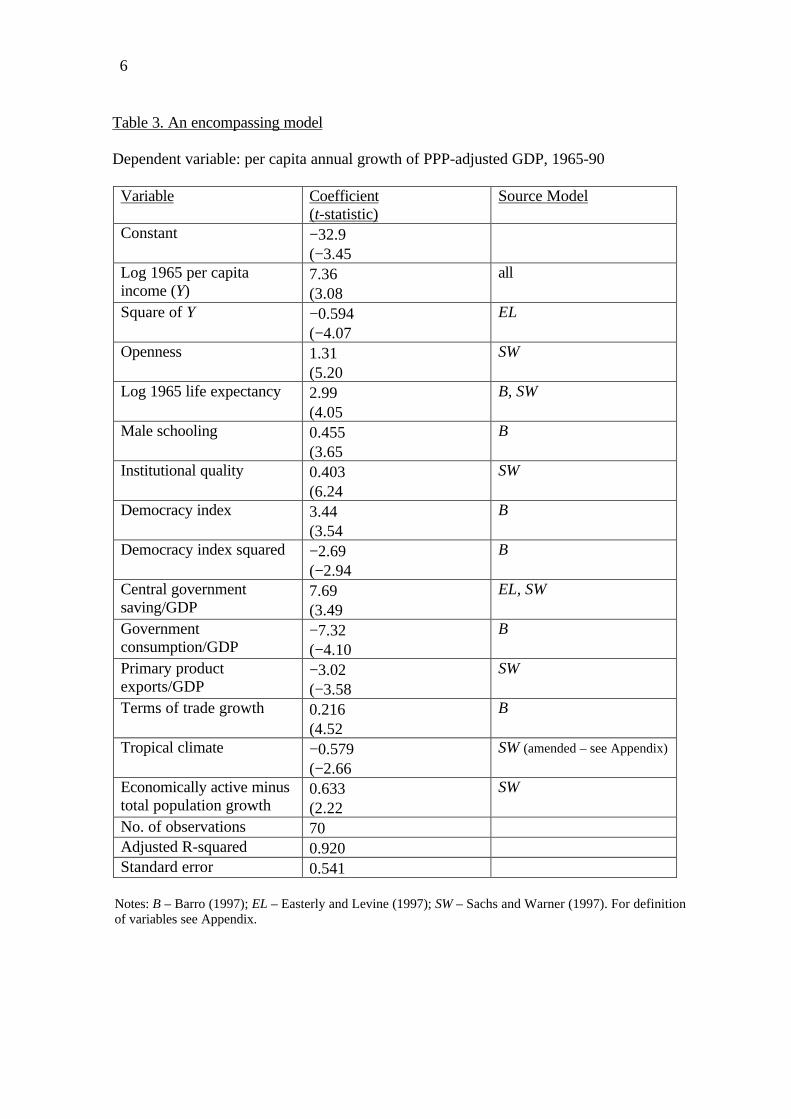
Table 3. An encompassing model
Dependent variable: per capita annual growth of PPP-adjusted GDP, 1965-90
Variable Coefficient(t-statistic)
Source Model
Constant −32.9(−3.45)
Log 1965 per capitaincome (Y)
7.36(3.08)
all
Square of Y −0.594(−4.07)
EL
Openness 1.31(5.20)
SW
Log 1965 life expectancy 2.99(4.05)
B, SW
Male schooling 0.455(3.65)
B
Institutional quality 0.403(6.24)
SW
Democracy index 3.44(3.54)
B
Democracy index squared −2.69(−2.94)
B
Central governmentsaving/GDP
7.69(3.49)
EL, SW
Governmentconsumption/GDP
−7.32(−4.10)
B
Primary productexports/GDP
−3.02(−3.58)
SW
Terms of trade growth 0.216(4.52)
B
Tropical climate −0.579(−2.66)
SW (amended – see Appendix)
Economically active minustotal population growth
0.633(2.22)
SW
No. of observations 70Adjusted R-squared 0.920Standard error 0.541
Notes: B – Barro (1997); EL – Easterly and Levine (1997); SW – Sachs and Warner (1997). For definitionof variables see Appendix.

7
Table 4. Effects of adding further regressors individually to the Table 3 regression
Dependent variable: per capita annual growth of PPP-adjusted GDP, 1965-90
Regressor No. of observationsin regression
t-statistic of addedvariable
Adjusted R-squared
Table 3 model 70 0.920Landlockedness 70 -0.59 0.919Square of lifeexpectancy
70 -0.66 0.919
Financial depth 69 0.03 0.916Ethnic diversity 69 -1.21 0.921Female schooling 70 -0.74 0.919Fertility 70 1.15 0.920Male schooling * Y 70 -1.35 0.921Openness * Y 70 -1.64 0.922Inflation rate 67 -0.37 0.918Neighbouringcountries’ growth
70 -0.82 0.919
Note: For fuller definition of variables see Appendix.
III AN ENCOMPASSING MODEL
The next stage is to estimate what improvements can be made by combining all the
regressors from the three candidate models in an encompassing model, and then eliminating
those regressors that are statistically insignificant. The model that results from this process
is shown in Table 3. This model omits landlockedness, the square of life expectancy, and
the interactive term between openness and income from the SW model, and includes the
square of initial per capita income (an EL variable) and also the following Barro variables:
male schooling, democracy and its square, terms of trade growth and government
consumption. The sample size is reduced to 70, but the adjusted R-squared rises to 0.920,
and the standard deviation of the residuals falls to 0.541 (compared with 0.847 and 0.769
respectively for SW, which is estimated on 84 observations).2 This is a considerable
improvement.
2 SW prefer to omit five countries (Botswana, Gabon, Madagascar, Guyana and Israel) as outliers, which
substantially improves the fit, yielding an adjusted R-squared of 0.890 and a standard error of 0.628. Their
technique for identifying outliers (that of Belsley et al., 1980) is however model-specific. In comparing
alternative models, it is therefore correct to include these five observations, which might not be identified
as outliers with a different model.
8
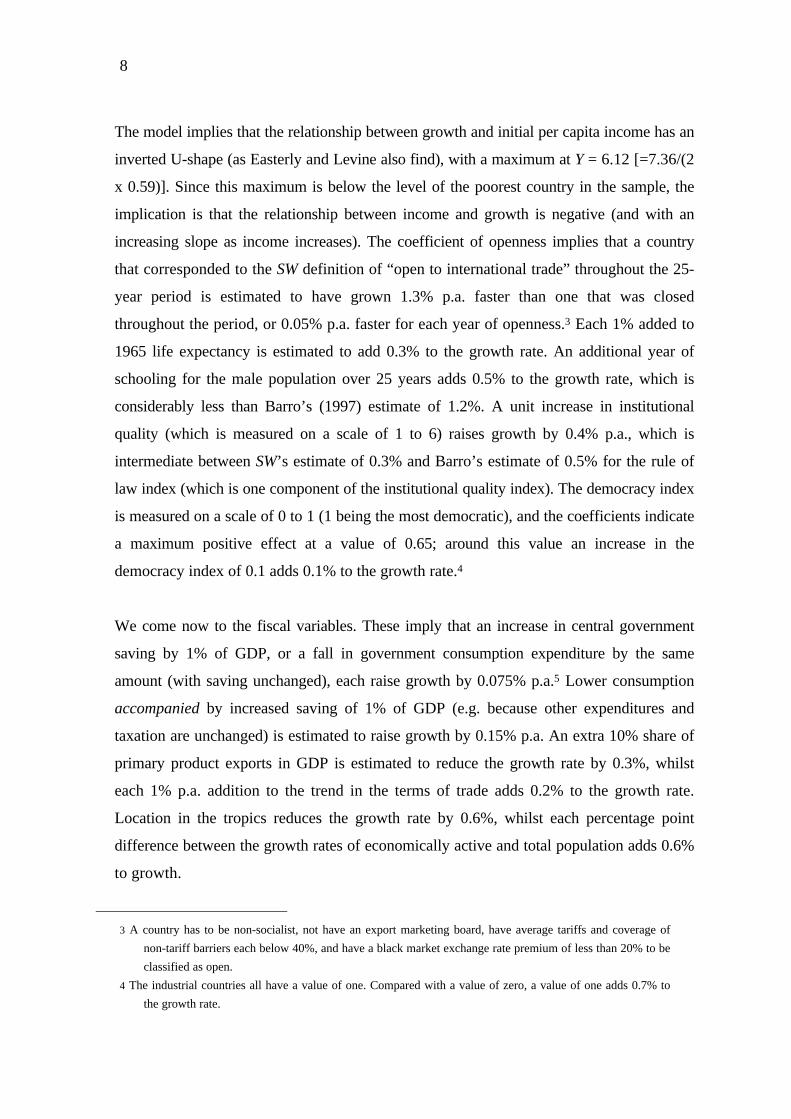
The model implies that the relationship between growth and initial per capita income has an
inverted U-shape (as Easterly and Levine also find), with a maximum at Y = 6.12 [=7.36/(2
x 0.59)]. Since this maximum is below the level of the poorest country in the sample, the
implication is that the relationship between income and growth is negative (and with an
increasing slope as income increases). The coefficient of openness implies that a country
that corresponded to the SW definition of “open to international trade” throughout the 25-
year period is estimated to have grown 1.3% p.a. faster than one that was closed
throughout the period, or 0.05% p.a. faster for each year of openness.3 Each 1% added to
1965 life expectancy is estimated to add 0.3% to the growth rate. An additional year of
schooling for the male population over 25 years adds 0.5% to the growth rate, which is
considerably less than Barro’s (1997) estimate of 1.2%. A unit increase in institutional
quality (which is measured on a scale of 1 to 6) raises growth by 0.4% p.a., which is
intermediate between SW’s estimate of 0.3% and Barro’s estimate of 0.5% for the rule of
law index (which is one component of the institutional quality index). The democracy index
is measured on a scale of 0 to 1 (1 being the most democratic), and the coefficients indicate
a maximum positive effect at a value of 0.65; around this value an increase in the
democracy index of 0.1 adds 0.1% to the growth rate.4
We come now to the fiscal variables. These imply that an increase in central government
saving by 1% of GDP, or a fall in government consumption expenditure by the same
amount (with saving unchanged), each raise growth by 0.075% p.a.5 Lower consumption
accompanied by increased saving of 1% of GDP (e.g. because other expenditures and
taxation are unchanged) is estimated to raise growth by 0.15% p.a. An extra 10% share of
primary product exports in GDP is estimated to reduce the growth rate by 0.3%, whilst
each 1% p.a. addition to the trend in the terms of trade adds 0.2% to the growth rate.
Location in the tropics reduces the growth rate by 0.6%, whilst each percentage point
difference between the growth rates of economically active and total population adds 0.6%
to growth.
3 A country has to be non-socialist, not have an export marketing board, have average tariffs and coverage of
non-tariff barriers each below 40%, and have a black market exchange rate premium of less than 20% to be
classified as open.
4 The industrial countries all have a value of one. Compared with a value of zero, a value of one adds 0.7% to
the growth rate.
9
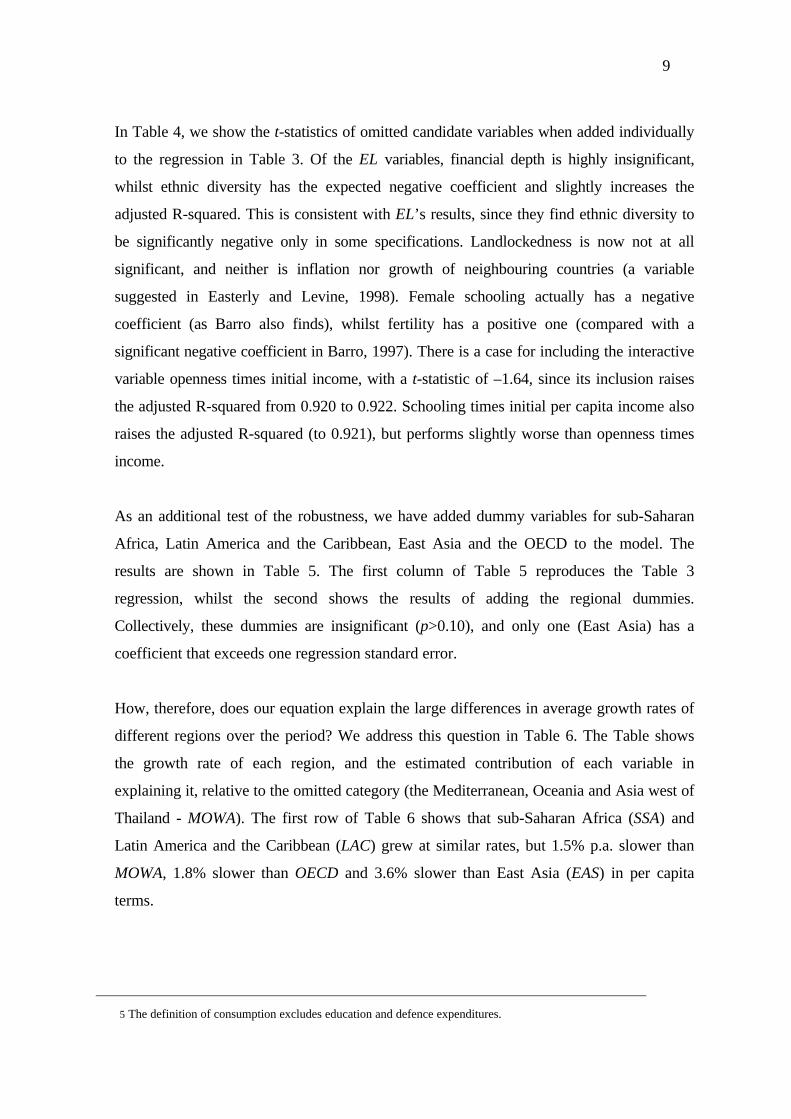
In Table 4, we show the t-statistics of omitted candidate variables when added individually
to the regression in Table 3. Of the EL variables, financial depth is highly insignificant,
whilst ethnic diversity has the expected negative coefficient and slightly increases the
adjusted R-squared. This is consistent with EL’s results, since they find ethnic diversity to
be significantly negative only in some specifications. Landlockedness is now not at all
significant, and neither is inflation nor growth of neighbouring countries (a variable
suggested in Easterly and Levine, 1998). Female schooling actually has a negative
coefficient (as Barro also finds), whilst fertility has a positive one (compared with a
significant negative coefficient in Barro, 1997). There is a case for including the interactive
variable openness times initial income, with a t-statistic of –1.64, since its inclusion raises
the adjusted R-squared from 0.920 to 0.922. Schooling times initial per capita income also
raises the adjusted R-squared (to 0.921), but performs slightly worse than openness times
income.
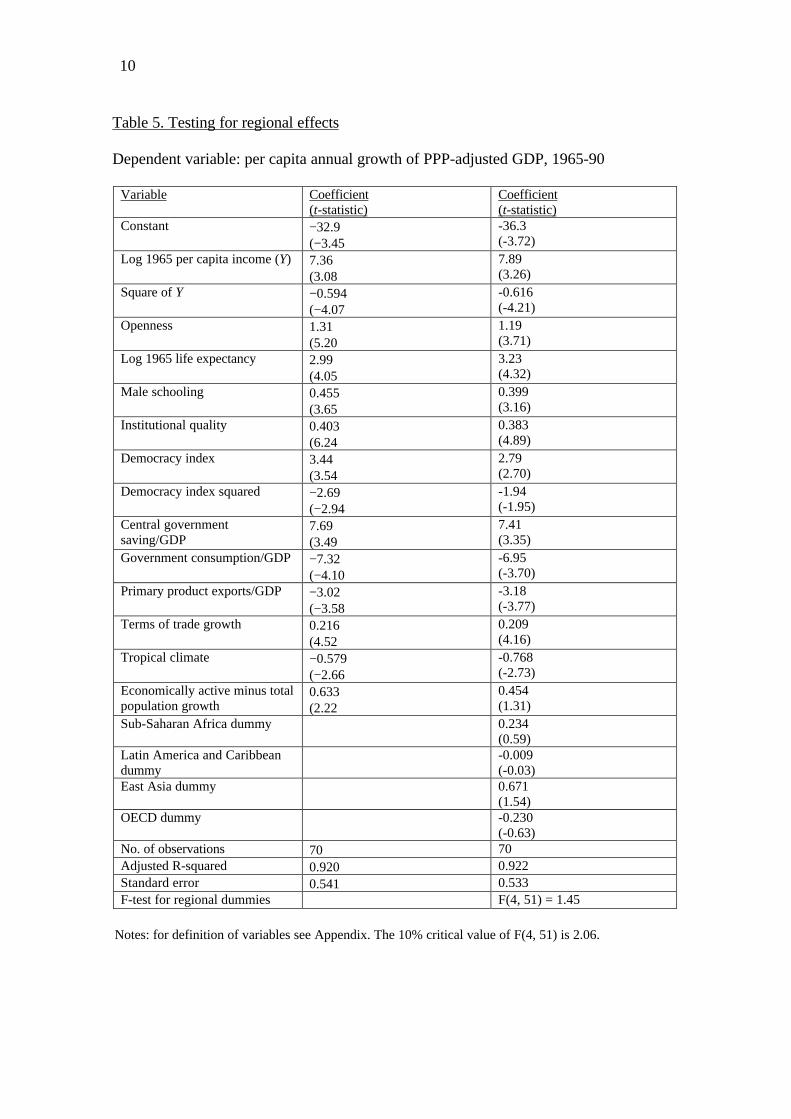
As an additional test of the robustness, we have added dummy variables for sub-Saharan
Africa, Latin America and the Caribbean, East Asia and the OECD to the model. The
results are shown in Table 5. The first column of Table 5 reproduces the Table 3
regression, whilst the second shows the results of adding the regional dummies.
Collectively, these dummies are insignificant (p>0.10), and only one (East Asia) has a
coefficient that exceeds one regression standard error.
How, therefore, does our equation explain the large differences in average growth rates of
different regions over the period? We address this question in Table 6. The Table shows
the growth rate of each region, and the estimated contribution of each variable in
explaining it, relative to the omitted category (the Mediterranean, Oceania and Asia west of
Thailand - MOWA). The first row of Table 6 shows that sub-Saharan Africa (SSA) and
Latin America and the Caribbean (LAC) grew at similar rates, but 1.5% p.a. slower than
MOWA, 1.8% slower than OECD and 3.6% slower than East Asia (EAS) in per capita
terms.
5 The definition of consumption excludes education and defence expenditures.
10
Table 5. Testing for regional effects
Dependent variable: per capita annual growth of PPP-adjusted GDP, 1965-90
Variable Coefficient(t-statistic)
Coefficient(t-statistic)
Constant −32.9(−3.45)
-36.3(-3.72)
Log 1965 per capita income (Y) 7.36(3.08)
7.89(3.26)
Square of Y −0.594(−4.07)
-0.616(-4.21)
Openness 1.31(5.20)
1.19(3.71)
Log 1965 life expectancy 2.99(4.05)
3.23(4.32)
Male schooling 0.455(3.65)
0.399(3.16)
Institutional quality 0.403(6.24)
0.383(4.89)
Democracy index 3.44(3.54)
2.79(2.70)
Democracy index squared −2.69(−2.94)
-1.94(-1.95)
Central governmentsaving/GDP
7.69(3.49)
7.41(3.35)
Government consumption/GDP −7.32(−4.10)
-6.95(-3.70)
Primary product exports/GDP −3.02(−3.58)
-3.18(-3.77)
Terms of trade growth 0.216(4.52)
0.209(4.16)
Tropical climate −0.579(−2.66)
-0.768(-2.73)
Economically active minus totalpopulation growth
0.633(2.22)
0.454(1.31)
Sub-Saharan Africa dummy 0.234(0.59)
Latin America and Caribbeandummy
-0.009(-0.03)
East Asia dummy 0.671(1.54)
OECD dummy -0.230(-0.63)
No. of observations 70 70Adjusted R-squared 0.920 0.922Standard error 0.541 0.533F-test for regional dummies F(4, 51) = 1.45
Notes: for definition of variables see Appendix. The 10% critical value of F(4, 51) is 2.06.

11
Table 6. Explaining regional differences in growth rates
Differences in growth rates between regions and in the estimated impact of each variable inthe Table 3 regression (% p.a.)
Sub-SaharanAfrica
Latin America& Caribbean
East Asia OECD
p.c. growth -1.52 -1.46 +2.16 +0.36IndependentvariablesPer capita income +2.32 −0.75 −0.07 −3.32Openness −0.09 +0.14 +0.51 +1.04Life expectancy −0.72 +0.18 +0.12 +0.78Male schooling −0.26 −0.07 +0.10 +0.35Institutionalquality
−0.05 −0.10 +0.63 +1.75
Democracy −0.16 +0.14 +0.21 +0.21Central gov’t saving
−0.07 −0.30 −0.09 −0.36
Governmentconsumption
−0.38 +0.07 +0.08 +0.35
Primary product exports/GDP
+0.19 +0.28 +0.47 +0.51
Terms of tradegrowth
−0.54 −0.53 −0.41 −0.79
Tropical climate −0.38 −0.35 −0.27 +0.14Growth rate ofecon. active pop.
−0.19 +0.14 +0.28 +0.01
Notes. All numbers are relative to the omitted region (Mediterranean, Oceania and Asia west of Thailand).Figures reflect the data for the full sample of countries (more than 100 for each variable), not just thoseused in the regression.

12
The rest of Table 6 indicates how this is explained by the individual variables in the Table 3
regression. Income effects are very large, highly favourable for SSA and highly
unfavourable for OECD. Most of the other variables offset this enormous income effect,
tending to be least favourable for SSA and most favourable for OECD. East Asia has fast
growth, according to this model, because it resembles OECD considerably more closely
than other developing countries whilst having a low initial per capita income. East Asia is
not in fact an exceptional region in any dimension (except the increase in the proportion of
the population which is economically active, whose impact is relatively minor) when the
full range of countries is considered, but for a developing region it has high levels of
openness, male schooling, institutional quality and measures of democracy and fiscal
rectitude. According to the model low initial per capita income should make SSA grow 3%
p.a. faster than LAC, other things being equal, but that is offset by inferior values of
practically every other variable, especially life expectancy, openness, democracy and the
trend in the economically active population.
In summary, our results suggest that most of the new variables that have been introduced
into growth regressions in the 1990s survive a rigorous test against alternative models. The
ones that do not (landlockedness, growth of neighbouring countries) are arguably those
with the weakest theoretical basis. Human capital, institutions, specialisation in primary
products, and terms of trade changes all seem to be important determinants of growth, and
there is considerable evidence of non-linearity in the relationship between income level and
growth.
IV CONCLUSIONS
In this paper we have compared the performance of alternative empirical growth models on
a common data set. The purpose of the exercise was not just to match these models against
one another, but also to establish a benchmark model that encapsulates the state of current
research. We found that the model which best fits the data includes elements from all three
of the candidate models considered. This encompassing model provides a framework
against which future innovations in empirical growth research may be judged: in
introducing previously untried variables, an investigator needs to show that these variables
improve the fit even in the presence of the full complement of regressors from our
encompassing regression. Otherwise, he or she will have failed to demonstrate that the new
variables genuinely outperform old ones.

13
14
REFERENCES
Barro, Robert J. 1991. Economic growth in a cross-section of countries, Quarterly
Journal of Economics 106, 2 (May), 407-33.
Barro, Robert J. 1997. Determinants of Economic Growth: A Cross-Country
Empirical Study, Cambridge, Mass.: MIT Press.
Belsley, David A., Edwin Kuh and Roy E. Welsch. 1980. Regression Diagnostics,
New York: John Wiley and sons.
Davidson, Russell, and MacKinnon, James G. 1981. Several tests for model
specification in the presence of alternative hypotheses, Econometrica 49, 3
(May), 781-93.
Easterly, William, and Levine, Ross. 1997. Africa’s growth tragedy: policies and
ethnic divisions, Quarterly Journal of Economics 112, 1203-50.
Easterly, William, and Levine, Ross. 1998. Troubles with the neighbours: Africa’s
problem, Africa’s opportunity, Journal of African Economies 7 (1), 120-42.
Levine, Ross, and Renelt, David. 1992. A sensitivity analysis of cross-country growth
regressions, American Economic Review 82 (4), 942-63.
Sachs, Jeffrey D., and Warner, Andrew. 1995. Economic reform and the process of
global integration, Brookings Papers on Economic Activity 1, 1-118.
Sachs, Jeffrey D., and Warner, Andrew. 1997. Sources of slow growth in African
economies, Journal of African Economies 6, 3 (October) 335-76.
Sala-i-Martin, Xavier. 1997. I just ran two million regressions, American Economic
Review 87, 2 (May), 178-83.

15
APPENDIX
The following table lists the data sources and the precise designation of the variable in thedata source. SW denotes Sachs and Warner (1997), and BL denotes Robert J. Barro andJong-Wha Lee, Data Set for a Panel of 138 Countries (1994). The non-nested tests arebased on the original SW model, but in estimating the encompassing model we made threeminor modifications. (1) We replaced 1970 life expectancy by 1965 life expectancy, toavoid any possible endogeneity problems. (2) We amended the landlockedness variable,defining Jordan and Zaire, which do in fact have access to the sea, as not landlocked. (3)We amended the tropical climate variable (whose meaning in SW is never entirely clear) sothat it more accurately represents the proportion of the country that falls between theTropics of Cancer and Capricorn. This involves some significant reclassifications includingHong Kong as 1 (not 0), Egypt as 0.2 (not 1) and Bangladesh as 0.5 (not 0.1), andrectifying some omissions in the SW data set for this variable. A full list of theseamendments is available from the authors on request.
Variable Data source Variable designation insource
Per capita growth 1965-90 SW G6590Per capita income in 1965(log)
SW LGDPEA65
Openness (dummy variable) SW OPEN6590Black market premiumaverage 1970-90
Sachs and Warner(1995)
BMP
Male schooling (secondaryplus higher) 1965
BL SYRM65 + HYRM65
Female schooling(secondary plus higher)1965
BL SYRF65 + HYRF65
Financial depth, ave. 1965-90
BL LLY
Inflation rate, average 1965-90
SW INFL6590
Fertility rate 1965 BL FERT65Central gov’t savings/GDP SW CGB7090Governmentconsumption/GDP
BL GVXDXE
Life expectancy in 1965(log)
SW LIFEE065
Institutional quality SW ICRGE80Assassinations per capita SW ASSASSPDemocracy Barro (1997) DEMOCRACY 1975Terms of trade growth 1965-90
Authors TOTGR (constructed fromWorld Bank data)
Primary product exports SW SXPTropical climate SW TROPICSTropical climate (amended) Authors CLIMATELandlockedness SW ACCESSLandlockedness (amended) Authors INLANDEconomically active minustotal population growth
SW GEAP-POP
Ethnic diversity SW ETHLING

16
Neighbour countries’growth
SW G7089N
CREDIT PAPERS
98/1 Norman Gemmell and Mark McGillivray, “Aid and Tax Instability and theGovernment Budget Constraint in Developing Countries”
98/2 Susana Franco-Rodriguez, Mark McGillivray and Oliver Morrissey, “Aidand the Public Sector in Pakistan: Evidence with Endogenous Aid”
98/3 Norman Gemmell, Tim Lloyd and Marina Mathew, “Dynamic SectoralLinkages and Structural Change in a Developing Economy”
98/4 Andrew McKay, Oliver Morrissey and Charlotte Vaillant, “AggregateExport and Food Crop Supply Response in Tanzania”
98/5 Louise Grenier, Andrew McKay and Oliver Morrissey, “Determinants ofExports and Investment of Manufacturing Firms in Tanzania”
98/6 P.J. Lloyd, “A Generalisation of the Stolper-Samuelson Theorem withDiversified Households: A Tale of Two Matrices”
98/7 P.J. Lloyd, “Globalisation, International Factor Movements and Market
98/8 Ramesh Durbarry, Norman Gemmell and David Greenaway, “NewEvidence on the Impact of Foreign Aid on Economic Growth”
98/9 Michael Bleaney and David Greenaway, “External Disturbances andMacroeconomic Performance in Sub-Saharan Africa”
98/10 Tim Lloyd, Mark McGillivray, Oliver Morrissey and Robert Osei,“Investigating the Relationship Between Aid and Trade Flows”
98/11 A.K.M. Azhar, R.J.R. Eliott and C.R. Milner, “Analysing Changes in TradePatterns: A New Geometric Approach”
98/12 Oliver Morrissey and Nicodemus Rudaheranwa, “Ugandan Trade Policyand Export Performance in the 1990s”
98/13 Chris Milner, Oliver Morrissey and Nicodemus Rudaheranwa,“Protection, Trade Policy and Transport Costs: Effective Taxation of UgandanExporters”
99/1 Ewen Cummins, “Hey and Orme go to Gara Godo: Household RiskPreferences”
99/2 Louise Grenier, Andrew McKay and Oliver Morrissey, “Competition andBusiness Confidence in Manufacturing Enterprises in Tanzania”
99/3 Robert Lensink and Oliver Morrissey, “Uncertainty of Aid Inflows and theAid-Growth Relationship”
99/4 Michael Bleaney and David Fielding, “Exchange Rate Regimes, Inflationand Output Volatility in Developing Countries”
99/5 Indraneel Dasgupta, “Women’s Employment, Intra-Household Bargainingand Distribution: A Two-Sector Analysis”
99/6 Robert Lensink and Howard White, “Is there an Aid Laffer Curve?”99/7 David Fielding, “Income Inequality and Economic Development: A Structural
99/8 Christophe Muller, “The Spatial Association of Price Indices and Living
99/9 Christophe Muller, “The Measurement of Poverty with Geographical andIntertemporal Price Dispersion”
99/10 Henrik Hansen and Finn Tarp, “Aid Effectiveness Disputed”99/11 Christophe Muller, “Censored Quantile Regressions of Poverty in 99/12 Michael Bleaney, Paul Mizen and Lesedi Senatla, “Portfolio Capital Flows
to Emerging Markets”99/13 Christophe Muller, “The Relative Prevalence of Diseases in a Population if Ill
00/1 Robert Lensink, “Does Financial Development Mitigate Negative Effects ofPolicy Uncertainty on Economic Growth?”
00/2 Oliver Morrissey, “Investment and Competition Policy in DevelopingCountries: Implications of and for the WTO”
00/3 Jo-Ann Crawford and Sam Laird, “Regional Trade Agreements and the
00/4 Sam Laird, “Multilateral Market Access Negotiations in Goods and Services”00/5 Sam Laird, “The WTO Agenda and the Developing Countries”00/6 Josaphat P. Kweka and Oliver Morrissey, “Government Spending and
Economic Growth in Tanzania, 1965-1996”00/7 Henrik Hansen and Fin Tarp, “Aid and Growth Regressions”00/8 Andrew McKay, Chris Milner and Oliver Morrissey, “The Trade and
Welfare Effects of a Regional Economic Partnership Agreement”00/9 Mark McGillivray and Oliver Morrissey, “Aid Illusion and Public Sector
Fiscal Behaviour”00/10 C.W. Morgan, “Commodity Futures Markets in LDCs: A Review and
Prospects”00/11 Michael Bleaney and Akira Nishiyama, “Explaining Growth: A Contest
between Models”

DEPARTMENT OF ECONOMICS DISCUSSION PAPERSIn addition to the CREDIT series of research papers the Department of Economicsproduces a discussion paper series dealing with more general aspects of economics.Below is a list of recent titles published in this series.
98/1 David Fielding, “Social and Economic Determinants of English Voter Choicein the 1997 General Election”
98/2 Darrin L. Baines, Nicola Cooper and David K. Whynes, “GeneralPractitioners’ Views on Current Changes in the UK Health Service”
98/3 Prasanta K. Pattanaik and Yongsheng Xu, “On Ranking Opportunity Setsin Economic Environments”
98/4 David Fielding and Paul Mizen, “Panel Data Evidence on the RelationshipBetween Relative Price Variability and Inflation in Europe”
98/5 John Creedy and Norman Gemmell, “The Built-In Flexibility of Taxation:Some Basic Analytics”
98/6 Walter Bossert, “Opportunity Sets and the Measurement of Information”98/7 Walter Bossert and Hans Peters, “Multi-Attribute Decision-Making in
Individual and Social Choice”98/8 Walter Bossert and Hans Peters, “Minimax Regret and Efficient Bargaining
under Uncertainty”98/9 Michael F. Bleaney and Stephen J. Leybourne, “Real Exchange Rate
Dynamics under the Current Float: A Re-Examination”98/10 Norman Gemmell, Oliver Morrissey and Abuzer Pinar, “Taxation, Fiscal
Illusion and the Demand for Government Expenditures in the UK: A Time-Series Analysis”
98/11 Matt Ayres, “Extensive Games of Imperfect Recall and Mind Perfection”98/12 Walter Bossert, Prasanta K. Pattanaik and Yongsheng Xu, “Choice Under
Complete Uncertainty: Axiomatic Characterizations of Some Decision Rules”98/13 T. A. Lloyd, C. W. Morgan and A. J. Rayner, “Policy Intervention and
Supply Response: the Potato Marketing Board in Retrospect”98/14 Richard Kneller, Michael Bleaney and Norman Gemmell, “Growth, Public
Policy and the Government Budget Constraint: Evidence from OECDCountries”
98/15 Charles Blackorby, Walter Bossert and David Donaldson, “The Value ofLimited Altruism”
98/16 Steven J. Humphrey, “The Common Consequence Effect: Testing a UnifiedExplanation of Recent Mixed Evidence”
98/17 Steven J. Humphrey, “Non-Transitive Choice: Event-Splitting Effects or
98/18 Richard Disney and Amanda Gosling, “Does It Pay to Work in the Public
98/19 Norman Gemmell, Oliver Morrissey and Abuzer Pinar, “Fiscal Illusion andthe Demand for Local Government Expenditures in England and Wales”
98/20 Richard Disney, “Crises in Public Pension Programmes in OECD: What Arethe Reform Options?”
98/21 Gwendolyn C. Morrison, “The Endowment Effect and Expected Utility”
98/22 G.C. Morrisson, A. Neilson and M. Malek, “Improving the Sensitivity of theTime Trade-Off Method: Results of an Experiment Using Chained TTOQuestions”
99/1 Indraneel Dasgupta, “Stochastic Production and the Law of Supply”99/2 Walter Bossert, “Intersection Quasi-Orderings: An Alternative Proof”99/3 Charles Blackorby, Walter Bossert and David Donaldson, “Rationalizable
Variable-Population Choice Functions”99/4 Charles Blackorby, Walter Bossert and David Donaldson, “Functional
Equations and Population Ethics”99/5 Christophe Muller, “A Global Concavity Condition for Decisions with
Several Constraints”99/6 Christophe Muller, “A Separability Condition for the Decentralisation of
Complex Behavioural Models”99/7 Zhihao Yu, “Environmental Protection and Free Trade: Indirect Competition
99/8 Zhihao Yu, “A Model of Substitution of Non-Tariff Barriers for Tariffs”99/9 Steven J. Humphrey, “Testing a Prescription for the Reduction of Non-
Transitive Choices”99/10 Richard Disney, Andrew Henley and Gary Stears, “Housing Costs, House
Price Shocks and Savings Behaviour Among Older Households in Britain”99/11 Yongsheng Xu, “Non-Discrimination and the Pareto Principle”99/12 Yongsheng Xu, “On Ranking Linear Budget Sets in Terms of Freedom of
99/13 Michael Bleaney, Stephen J. Leybourne and Paul Mizen, “Mean Reversionof Real Exchange Rates in High-Inflation Countries”
99/14 Chris Milner, Paul Mizen and Eric Pentecost, “A Cross-Country PanelAnalysis of Currency Substitution and Trade”
99/15 Steven J. Humphrey, “Are Event-splitting Effects Actually Boundary
99/16 Taradas Bandyopadhyay, Indraneel Dasgupta and Prasanta K.Pattanaik, “On the Equivalence of Some Properties of Stochastic Demand
99/17 Indraneel Dasgupta, Subodh Kumar and Prasanta K. Pattanaik,“Consistent Choice and Falsifiability of the Maximization Hypothesis”
99/18 David Fielding and Paul Mizen, “Relative Price Variability and Inflation in
99/19 Emmanuel Petrakis and Joanna Poyago-Theotoky, “Technology Policy inan Oligopoly with Spillovers and Pollution”
99/20 Indraneel Dasgupta, “Wage Subsidy, Cash Transfer and Individual Welfare ina Cournot Model of the Household”
99/21 Walter Bossert and Hans Peters, “Efficient Solutions to BargainingProblems with Uncertain Disagreement Points”
99/22 Yongsheng Xu, “Measuring the Standard of Living – An Axiomatic
99/23 Yongsheng Xu, “No-Envy and Equality of Economic Opportunity”
99/24 M. Conyon, S. Girma, S. Thompson and P. Wright, “The Impact ofMergers and Acquisitions on Profits and Employee Remuneration in the UnitedKingdom”
99/25 Robert Breunig and Indraneel Dasgupta, “Towards an Explanation of theCash-Out Puzzle in the US Food Stamps Program”
99/26 John Creedy and Norman Gemmell, “The Built-In Flexibility ofConsumption Taxes”
99/27 Richard Disney, “Declining Public Pensions in an Era of DemographicAgeing: Will Private Provision Fill the Gap?”
99/28 Indraneel Dasgupta, “Welfare Analysis in a Cournot Game with a Public
99/29 Taradas Bandyopadhyay, Indraneel Dasgupta and Prasanta K.Pattanaik, “A Stochastic Generalization of the Revealed Preference Approachto the Theory of Consumers’ Behavior”
99/30 Charles Blackorby, WalterBossert and David Donaldson, “Utilitarianismand the Theory of Justice”
99/31 Mariam Camarero and Javier Ordóñez, “Who is Ruling Europe? EmpiricalEvidence on the German Dominance Hypothesis”
99/32 Christophe Muller, “The Watts’ Poverty Index with Explicit PriceVariability”
99/33 Paul Newbold, Tony Rayner, Christine Ennew and Emanuela Marrocu,“Testing Seasonality and Efficiency in Commodity Futures Markets”
99/34 Paul Newbold, Tony Rayner, Christine Ennew and Emanuela Marrocu,“Futures Markets Efficiency: Evidence from Unevenly Spaced Contracts”
99/35 Ciaran O’Neill and Zoe Phillips, “An Application of the Hedonic PricingTechnique to Cigarettes in the United Kingdom”
99/36 Christophe Muller, “The Properties of the Watts’ Poverty Index Under
99/37 Tae-Hwan Kim, Stephen J. Leybourne and Paul Newbold, “SpuriousRejections by Perron Tests in the Presence of a Misplaced or Second BreakUnder the Null”
00/1 Tae-Hwan Kim and Christophe Muller, “Two-Stage Quantile Regression”00/2 Spiros Bougheas, Panicos O. Demetrides and Edgar L.W. Morgenroth,
“International Aspects of Public Infrastructure Investment”00/3 Michael Bleaney, “Inflation as Taxation: Theory and Evidence”00/4 Michael Bleaney, “Financial Fragility and Currency Crises”00/5 Sourafel Girma, “A Quasi-Differencing Approach to Dynamic Modelling
from a Time Series of Independent Cross Sections”00/6 Spiros Bougheas and Paul Downward, “The Economics of Professional
Sports Leagues: A Bargaining Approach”00/7 Marta Aloi, Hans Jørgen Jacobsen and Teresa Lloyd-Braga, “Endogenous
Business Cycles and Stabilization Policies”00/8 A. Ghoshray, T.A. Lloyd and A.J. Rayner, “EU Wheat Prices and its
Relation with Other Major Wheat Export Prices”00/9 Christophe Muller, “Transient-Seasonal and Chronic Poverty of Peasants:
Evidence from Rwanda”

00/10 Gwendolyn C. Morrison, “Embedding and Substitution in Willingness to
00/11 Claudio Zoli, “Inverse Sequential Stochastic Dominance: Rank-DependentWelfare, Deprivation and Poverty Measurement”
00/12 Tae-Hwan Kim, Stephen Leybourne and Paul Newbold, “Unit Root TestsWith a Break in Variance”
00/13 Tae-Hwan Kim, Stephen Leybourne and Paul Newbold, “AsymptoticMean Squared Forecast Error When an Autoregression With Linear Trend isFitted to Data Generated by an I(0) or I(1) Process”
00/14 Michelle Haynes and Steve Thompson, “The Productivity Impact of ITDeployment: An Empirical Evaluation of ATM Introduction”
00/15 Michelle Haynes, Steve Thompson and Mike Wright, “The Determinants ofCorporate Divestment in the UK”
Members of the Centre
Director
Oliver Morrissey - aid policy, trade and agriculture
Research Fellows (Internal)
Adam Blake – CGE models of low-income countriesMike Bleaney - growth, international macroeconomicsIndraneel Dasgupta – development theoryNorman Gemmell – growth and public sector issuesKen Ingersent - agricultural tradeTim Lloyd – agricultural commodity marketsAndrew McKay - poverty, peasant households, agricultureChris Milner - trade and developmentWyn Morgan - futures markets, commodity marketsChristophe Muller – poverty, household panel econometricsTony Rayner - agricultural policy and trade
Research Fellows (External)
V.N. Balasubramanyam (University of Lancaster) – foreign direct investment and multinationalsDavid Fielding (Leicester University) - investment, monetary and fiscal policyGöte Hansson (Lund University) – trade, Ethiopian developmentRobert Lensink (University of Groningen) – aid, investment, macroeconomicsScott McDonald (Sheffield University) – CGE modelling, agricultureMark McGillivray (RMIT University) - aid allocation, human developmentJay Menon (ADB, Manila) - trade and exchange ratesDoug Nelson (Tulane University) - political economy of tradeDavid Sapsford (University of Lancaster) - commodity pricesFinn Tarp (University of Copenhagen) – aid, CGE modellingHoward White (IDS) - aid, poverty