explaining international differences in entrepreneurship ...alusardi/papers/paper_june_2008.pdf ·...
TRANSCRIPT

Explaining International Differences inEntrepreneurship: The Role of IndividualCharacteristics and Regulatory Constraints
Silvia Ardagna and Annamaria Lusardi∗Harvard University; Dartmouth College, Harvard Business School and NBER
April 2008
Abstract
We use a micro dataset that collects information across individuals, coun-tries, and time to investigate the determinants of entrepreneurial activity inthirty-seven developed and developing nations. We focus both on individ-ual characteristics and on countries’ regulatory differences. We show thatindividual characteristics, such as gender, age, and status in the workforceare important determinants of entrepreneurship, and we also highlight therelevance of social networks, self-assessed skills, and attitudes toward risk.Moreover, we find that regulation plays a critical role, particularly for thoseindividuals who become entrepreneurs to pursue a business opportunity. Theindividual characteristics that are impacted most by regulation are those mea-suring working status, social network, business skills, and attitudes towardrisk.
1 Introduction
The regulatory and legal environment is commonly held to be an important factorin determining a country’s economic performance. Tight regulation of product andlabor markets is one of the most frequently cited reasons for slower growth and∗We would like to thank David Blanchflower, Boyan Jovanovic, Leora Klapper, Josh Lerner,
Norman Loyaza, Maria Luengo-Prado, Ramana Nanda, Ana Maria Oviedo, Paul Reynolds, FabioSchiantarelli, Antoinette Schoar, and Luis Serven for their comments and help with the data, andseminar participants at the NBER’s International Differences in Entrepreneurship Conference, theEuropean University Institute, the European Bank for Reconstruction and Development, and North-eastern University for their many suggestions. We also thank David Raines for his excellent researchassistance; any errors are our responsibility.
1

higher unemployment in Continental Europe than in the United States. Deregula-tion has been highly recommended to countries like Italy, France, and Germany, aswell as to developing nations, to improve their economies.
One way in which the regulatory and legal environment can impact growthand employment is its effect on the rate at which new businesses are created. Infact, as suggested by the Schumpeterian approach to economic growth (Aghionand Howitt 1997), new entrepreneurial activities play a vital part in the processof creative destruction that fosters innovation, employment, and growth. While aburgeoning empirical literature has studied the influence of regulation of productand labor markets on GDP growth, TFP, investment, and employment using macrodata,1 little is known about how a country’s regulatory and legal environment affectindividuals’ decisions to engage in new entrepreneurial activity.
In our paper, we tackle this question using micro data. We study the effect ofregulation on entrepreneurship in a broad sample of countries using a novel dataset: the Global Entrepreneurship Monitor (GEM). There are several advantagesin using data from GEM. First, we can rely on cross-national harmonized dataon entrepreneurship for about 150,000 individuals in thirty-seven developed anddeveloping nations. This is the only dataset that allows researchers to comparethe level of business creation and its determinants at the micro level across manycountries. Second, we can identify two different types of entrepreneurs: those whoenter entrepreneurship to pursue a business opportunity and those whose entrepre-neurial activity is simply remedial, i.e., they could not find a better alternative.This distinction is important in that it allows us to perform an economic analysisof entrepreneurship that has not been possible in previous work. Third, we haveinformation on a wide-ranging set of individual characteristics, including businessskills, fear of failure, and social networks. Thus, we can account for a good setof determinants of entrepreneurship across countries. To be able to examine theimpact of regulation on entrepreneurial activity, we merge data from GEM withdata on measures of regulation in the product markets, the labor markets, and thelegal system.
There are relatively few studies that investigate the factors affecting individualdecisions to engage in new entrepreneurial activity in a broad sample of countries;most of the literature uses micro data from one particular country, the United Statesin the majority of the cases. Also, with the exception of Djankov et al. (2005),(2006a), (2006b), and (2008), who investigate the role of a broad set of macroand micro variables on entrepreneurship in Russia, China, and Brazil, empirical
1A non-exhaustive list of papers includes: Alesina et al. (2005), Bassanini and Ernst (2002),Bayoumi et al. (2004), Blanchard and Wolfers (2000), Fiori et al. (2007), Loayza et al. (2004),Nicoletti and Scarpetta (2003).
2

research has focused on a limited number of individual characteristics.2 Moreover,while the literature has focused on tax policy and liquidity constraints (see, for ex-ample, the work by Djankov et al. (2007), Gentry and Hubbard (2000), Evans andJovanovic (1989), Guiso et al. (2004), Hurst and Lusardi (2004) and (2008)),3 ourpaper looks at other types of regulation, such as the regulation of product and labormarket and contract enforcement. In this respect, our paper relates to the workof Ciccone and Papaioannou (2006), Desai et al. (2003), Klapper et al. (2006),and Guiso and Schivardi (2006), who investigate the role of regulation in productmarkets on industries’ entry rates and on several other firms’ characteristics usingfirms’ level data from developed and transitional countries.
Views about regulation vary widely in economic theory. According to publicchoice theory, regulation is socially inefficient and exists either because industryincumbents are able to lobby government officials to pass laws that grant them rentsor because politicians use regulation to extract rents for their own benefit. Hence,regulation is a burden for new and existing firms. The public interest theory of reg-ulation proposes an opposing view: regulation exists to cure market failures; hence,heavier regulation should lead to socially superior outcomes.4 More generally, reg-ulation can foster or hinder entrepreneurial activity depending on the dimension ofregulation one considers. In our empirical work, we consider three broad areas ofregulation: regulation of entry, regulation of contract enforcement, and regulationof labor. For each area, we can envision channels through which regulation af-fects entrepreneurship in potentially opposite directions. For example, as Cicconeand Papaioannou (2006) show, entry regulation can delay the introduction of newproduct varieties in industries that experience expansionary global demand or tech-nology shocks. Hence, the rate at which firms enter these particular industries islower in countries that regulate entry more extensively. Second, credit constraintscan bind a larger fraction of would-be entrepreneurs in countries where it is moreexpensive to comply with entry regulation. As a result, individuals who would liketo start a new business are prevented from doing so by credit constraints. This ismore likely to occur in less financially developed countries.5 Finally, as Klapper etal. (2006) discuss, entry regulation that protects investors enhances access to credit
2See, for example, the papers by Blanchflower ((2000) and (2004)), Blanchflower, Oswald, andStutzer (2001), and Blanchflower and Oswald (1998), and the review in Hurst and Lusardi (2004)and (2008).
3See also Alfaro and Charlton (2007) for the effects of international financial integration on en-trepreneurship.
4See Djankov et al. (2002) for an extensive review of the theory of regulation.5See Banerjee and Newman (1994), and Desai et al. (2003) for the relation between entry costs,
financial constraints, and entrepreneurship. See also the work by Blanchflower and Oswald (1998),Evans and Jovanovic (1989), Guiso, Sapienza and Zingales (2004) and Hurst and Lusardi (2004) and(2008) for an overview of the importance and empirical relevance of liquidity constraints.
3
for would-be entrepreneurs. In this case, entry regulation increases entry ratesand facilitates entrepreneurship. Similarly, both contract enforcement regulation,which affects the efficiency and the functioning of the legal system, and the regula-tion of labor markets can have opposite effects on the individual decision to start anew business (see, for example, Djankov et al. (2003), Desai et al. (2003), La Portaet al. (1998) and (2000)). Thus, whether regulation has a beneficial or detrimentaleffect on entrepreneurship is ultimately an empirical question; the specific goal ofour empirical work is to understand whether entrepreneurship flourishes in moreor in less regulated environments.
Consistent with the public choice model, we find that regulation acts as a detri-ment to entrepreneurship, particularly for those individuals who become entrepre-neurs to pursue a business opportunity. In our empirical analysis, we estimatethe effect of regulation via its impact on individual characteristics. Regulationhas the greatest impact on the effects of social network, business skills, attitudestoward risk, and working status. Specifically, regulation attenuates the effect ofsocial networks, business skills, and working status on entrepreneurship while itstrengthens the impact of attitudes toward risk. We find also that several indi-vidual characteristics—gender, age, and education—are important determinants ofentrepreneurship, though their effects differ across types of entrepreneurship. Forexample, the estimates of education are positive and statistically significant for in-dividuals who become entrepreneurs to pursue a business opportunity, while theyare negative and statistically significant for those whose entrepreneurial activity issimply remedial. This finding further highlights the importance of being able todistinguish between types of entrepreneurs. Finally, we provide ample evidencethat our findings are robust to a variety of extensions and robustness checks. Inparticular, our results are virtually unchanged when we instrument countries’ reg-ulatory indicators with countries’ legal origins to account for the potential endo-geneity of regulation.
The GEM data can provide very useful information to policy-makers. In par-ticular, the data can speak to the determinants of entrepreneurship across countries.Most importantly, the data show there are different types of entrepreneurs and thesedifferences should be taken into account when evaluating the effects of policies to-ward entrepreneurship.
This paper is organized as follows. Section 2 describes our data and presentssome descriptive statistics. Section 3 discusses the empirical methodology and ourresults. The last section concludes.
4

2 Data
This section describes the data we employ in the empirical analysis. We begin bydiscussing the micro survey data. In section 2.2 we illustrate the institutional andregulatory data, and in section 2.3 we show descriptive statistics on the relationshipamong entrepreneurship, personal characteristics (such as age, sex, and education),and countries’ regulatory environments. We then perform an econometric analysisof the effect of regulation on different measures of entrepreneurship and severalrobustness checks.
2.1 GEM micro survey data
We use micro survey data collected by the Global Entrepreneurship Monitor (GEM),a research program started in 1998 that annually collects cross-national harmonizeddata on entrepreneurship. Each year the project surveys (i) either by phone or face-to-face interviews a sample of at least 2,000 randomly selected individuals in eachcountry (the Adult Population Survey), and (ii) an average of 35 national expertsin each country, using face-to-face interviews and self-administered questionnaires(Expert Questionnaire Data). A coordination team at London Business School su-pervises the contracts to survey vendors, receives the data, checks all data files forinconsistencies, harmonizes the entire dataset, and generates new variables.6
In this paper, we use data from the Adult Population Surveys of 2001 and2002. These are the most recent surveys available to researchers who are not di-rectly involved in the GEM project and include information both on individuals’decisions to engage in entrepreneurial activity and on individuals’ motivations tostart a new business. One advantage of using these data is also that the defini-tions of variables and the methodology used in collecting the data are consistentbetween the two years. Countries included in our sample are: Argentina, Aus-tralia, Belgium, Brazil, Canada, Chile, China, Croatia, Denmark, Finland, France,Germany, Hong Kong, Hungary, India, Ireland, Israel, Italy, Japan, Korea, Mex-ico, The Netherlands, New Zealand, Norway, Poland, Portugal, Russia, Singapore,Slovenia, South Africa, Spain, Sweden, Switzerland, Taiwan, Thailand, UnitedKingdom, and United States.7 We restrict our analysis to individuals of 18-64years of age and the total number of observations in our sample is 152,612.8
6See Reynolds et al. (2005) for more information on the GEM project and the data collectionprocess.
7Adult Population Surveys have been conducted also in Iceland in 2001 and 2002. We excludeIceland from our sample because regulatory variables for most of the indices we use are not availablefor this country. Including Iceland in the regressions in which we exclude the regulatory variablesdoes not change the main results.
8In our empirical work, we always use weights. However, the difference between weighted and
5

2.1.1 Measures of entrepreneurial activity and individual characteristics data
Our variable of interest is total entrepreneurial activity (T E A), which can be fur-ther split into total opportunity entrepreneurial activity (T E AO P P) and total re-medial entrepreneurial activity (T E AN EC). T E A is an indicator variable equalto one if individuals are starting a new business or are owners and managers of ayoung firm; it is equal to zero otherwise. T E AO P P is an indicator variable equalto one if individuals are starting a new business or are owners and managers ofa young firm to take advantage of a business opportunity; it is equal to zero oth-erwise (opportunity entrepreneurs hereafter). T E AN EC is an indicator variableequal to one if individuals are starting a new business or are owners and managersof a young firm because they could find no better economic work; it is equal tozero otherwise (remedial or necessity entrepreneurs hereafter).9
Individuals starting a new business are individuals who (i) alone or with othersare currently trying to start a new business, including any type of self-employment,or (ii) alone or with others are trying to start a new business or a new venture to-gether with their employer as an effort that is part of their normal work, and who(a) have been active in the past 12 months in trying to start the new business, (b)expect to own part of it, and (c) have not paid salaries and wages to anybody, in-cluding the owner/managers, for more than 3 months. Individuals who are ownersand managers of a young firm are individuals who, alone or with others, are theowners of a company they help manage, provided that the company has been pay-ing salaries and wages for no more than 42 months.10 Thus, our focus is on firmsat the initial planning or inception stage. Our data represents the potential supplyof entrepreneurs rather than the actual rate of entrepreneurship.11 This is a specificdefinition of entrepreneur that differs from what other papers have used so far (see,for example, Blanchflower (2004), Evans and Jovanovic (1989), Hurst and Lusardi(2004), Gentry and Hubbard (2000)), but, as explained below, it is appropriategiven the focus of this paper.
These data present several advantages. First, we can concentrate on the start-upphase and on the first few years of a new business, rather than on well-establishedfirms that have been active for many years and for which, for example, the regula-
unweighted statistics and weighted and unweighted empirical estimates is rather small. Results usingthe unweighted data are available upon request.
9We will use the terms remedial entrepreneurs and necessity entrepreneurs interchangeably.10Appendix II reports the survey questions that the GEM coordination team uses to generate the
variables T E A, T E AO P P , T E AN EC . The exact methodology is based on procedures previouslyused in the US Panel Study of Entrepreneurial Dynamics and it is described in detail in the 2001 and2002 Adult Population Surveys’ data documentation and in Reynolds et al. (2005).
11One reason to consider the nascent and the early-stage entrepreneurs together is that the size ofthese two groups can be quite small, particularly among European countries.
6

tory environment can have different effects. Second, we can distinguish betweendifferent types of entrepreneurs, i.e., those individuals involved in entrepreneur-ship to take advantage of a business opportunity as opposed to those individualsfor whom entrepreneurship is a remedial activity. This distinction is not availablein many previous studies on entrepreneurship, but it can be particularly useful instudying the impact of individual characteristics and countries’ institutional andregulatory differences on the creation of new businesses. Moreover, it is useful instudying the effects of policies toward entrepreneurship.
Table 1 reports the number of observations for each country in the sample(column 1); the mean and standard deviation of the variables T E A, T E AO P P ,T E AN EC (columns 2-7); and the ratio of the variables T E AN EC/T E AO P P(column 8) for all countries in our sample and for different groups of countries.We group countries by income groups and by geographic regions using the WorldBank classification, and by legal origins following the classification in Djankov etal. (2003). We also compute statistics for countries belonging to the EuropeanUnion.12 On average, in the entire sample, the percentage of individuals partic-ipating in entrepreneurial activity is 7.6%. Among them about 36% start a newbusiness or are managers/owners of a young firm because other employment op-tions are not available or not appealing, while the rest participate in entrepreneurialactivities to exploit a perceived business opportunity. The average entrepreneurshiprate is much higher in low- and middle-low income countries than in high-incomecountries; with rates of about 14% and 6.7% respectively. However, the type ofentrepreneurial activities undertaken in these countries is rather different: in poorcountries more than two thirds of individuals engage in remedial entrepreneurialactivities, while this type of entrepreneurship drops to 21.9% in high-income coun-tries (see also figure 1). Total entrepreneurial activity is highest in Latin America(14.10%), followed by countries in the East Asia and Pacific region (9.4%), whilecountries belonging to the European Union (EU) have the lowest rate of entrepre-neurial activity (5.68%). However, as shown in Figure 1, the ratio of remedialto opportunity entrepreneurial activity is much higher in Latin American than inthe Organisation for Economics Co-operation and Development (OECD) and EUcountries.
Entrepreneurial activity also varies with a nation’s legal origin. While in coun-12The World Bank classifies economies in income groups using the gross national income per
capita, calculated with the World Bank Atlas method. The most recent classification uses data for2005, (see www.worldbank.org /data/countryclass /classgroups.htm). The groups are: low income,$875 or less; lower middle-income, $876-3,465; upper middle-income $3,466-10,725; and high in-come, $10,726 or more. Low and middle income economies are also classified by geographicalregions. We augmented this classification by including in the various groups the high income coun-tries. See Appendix I for the exact classification of countries in each group.
7
tries with English (common law) legal origin and in countries with French (civillaw) legal origin, the percentage of individuals engaging in any type of entrepre-neurial activity is almost identical (8.24% and 8.36%, respectively), individual mo-tivation to start a new business or to be the manager/owner of a young firm varies.On average, 6.04% of people become entrepreneurs to take advantage of a businessopportunity in countries with English legal origin, while 5.27% do so in countrieswith French legal origin, and the respective ratio T E AN EC/T E AO P P goesfrom 28.8% to 50.3%.
Table 2 reports the mean and standard deviation of the regressors we use in theempirical analysis in all countries in the sample (column 1), in low-income (col-umn 2), middle-low-income (column 3), upper-middle-income (column 4), andhigh-income countries (column 5). We use a variety of demographic variables thatare also used in many other studies: age, gender, education, working status, andincome. Moreover, we use other less used, but potentially important variables toexplain entrepreneurship: self-assessed business skills, attitudes toward risk, andsocial networks.13 We measure self-assessed business skills (Skills) with a dummyvariable equal to 1 if an individual answers that he or she has the knowledge, skill,and experience to start a new business; the variable is equal to 0 otherwise. Fearof failure, a proxy for individual attitudes toward risk, is measured by the dummyvariable Fear f ail, which is equal to 1 for individuals who answer that fear of fail-ing prevents them from starting a new business; the variable is equal to 0 otherwise.Finally, we measure social networks with the dummy variable Knowent , which isequal to 1 if an individual knows someone who has started a business in the pasttwo years; the variable is equal to 0 otherwise. Although we are aware that thesevariables may not be truly exogenous with respect to the choice of starting a newbusiness, they can be critical indicators of the impediments or the stimulators ofbusiness creation and they can help explain the wide heterogeneity we see amongbusiness owners. In this paper, given our focus on regulation, we will not accountfor the potential endogeneity of these variables. Appendix I includes the precisedefinition of all the variables. There are substantial differences in these variablesamong the countries. For example, the proportion of individuals that are not work-ing is substantially higher in low income countries than in higher income countries.Similarly, the fraction of individuals with a college degree is much smaller in lowincome countries than in other countries. Moreover, both social networks and fearof failure are much lower in low income countries than in other countries. Thesestatistics already point to potentially different types of entrepreneurship amongcountries depending on the income level of each country.
13Other papers that have used these types of variables include de Melo, McKenzie and Woodruff(2008), and Djankov et al (2008).
8

2.1.2 Reliability of GEM data
GEM data have not been used extensively by academics yet and not much is knownabout these data. Therefore, before describing our empirical work, we provide anoverview of the quality of the data. First, we compare the GEM data with data fromother surveys and we review the comparisons of GEM data performed by otherresearchers (Reynolds et al. (2005) and Acs et al. (2007)). Second, throughoutthe paper we show that the descriptive statistics on entrepreneurship in many of thecountries covered by GEM are consistent with the results reported in other studieson entrepreneurship. Third, for both the descriptive statistics and the econometricanalysis, we check the robustness of our results across countries and/or groups ofcountries and across survey years.
One data set that reports information similar to GEM is the Flash Eurobarom-eter Survey on Entrepreneurship collected by the European Commission.14 Whilenot all countries covered in GEM are available in the Flash Eurobarometer, we cancompare data among the countries common to both data sets, given that questionsare rather similar between the two surveys. Table 3 shows results for individualsliving in countries that are surveyed both in GEM in 2001 and/or 2002 (column1) and in the Flash Eurobarometer Surveys in 2002, 2003, and/or 2004 (column2).15 For each variable, we report the mean, its standard error, and the number ofobservations. The percentage of individuals involved in entrepreneurial activity isvery similar in the two datasets (6.37% when we use GEM data and 6.53% whenwe use data from the Flash Eurobarometer Surveys on Entrepreneurship), regard-less of the significantly smaller sample surveyed by the European Commission,which is about one third the size of the GEM sample. The percentage of individ-uals pursuing a business opportunity is equal to 4.93% in column 1 and 4.12% incolumn 2, while the percentage of individuals for whom entrepreneurship is a re-medial activity is lower in the GEM dataset (1.06% in column 1) than in the FlashEurobarometer Survey data (1.35% in column 2). Note, however, that the samplesize shrinks further in column 2 because information on individual motivation toparticipate in entrepreneurship is available only in the 2004 data collected by theEuropean Commission.
We can also compare demographic characteristics, such as age, the percentageof males, the percentage of individuals who work, and the percentage of individu-als who think that fear of failing could prevent them from starting a new business.
14See Appendix III for a description of the variables computed using data from the Flash Euro-barometer Surveys.
15Countries surveyed in both databases are: Belgium, Denmark, Finland, France, Germany, Hun-gary, Ireland, Italy, the Netherlands, Norway, Poland, Portugal, Slovenia, Spain, Sweden, the UnitedKingdom, and the United States.
9

Results in Table 3 are very similar regardless of the dataset used for these variablesboth when we look at the entire sample and when we average the characteristicsamong individuals who participate in entrepreneurial activities and among thosewho do not. The only exception is the variable measuring the percentage of indi-viduals who think that fear of failing could prevent them from starting a new busi-ness. The average value is higher when we use data from the Flash EurobarometerSurveys (44.99%) than when we use GEM data (34.85%). However, the differencebetween the percentage of individuals who think that fear of failing could preventthem from starting a new business and are not entrepreneurs and those with thesame beliefs but who are involved in an entrepreneurial activity is much closer inthe two datasets: using GEM data, this difference is equal to 16.05% (35.89-19.84);using data from the Flash Eurobarometer Surveys it is equal to 11.2%.
Reynolds et al. (2005) compare GEM national annual new firms’ estimatesand new firms’ birth rates with data from the Official New Firm Census and datafrom the European Commission Report. They show that the T E A index and otherentrepreneurship indices computed using GEM data are reliable and capture thecreation of new firms on a scale comparable to that resulting from the use of othernational administrative datasets.
Finally, Acs et al. (2007) compare the GEM data with the World Bank GroupEntrepreneurship Survey (WBGES) dataset, which collected data on formal busi-ness registrations of limited liability corporations (LLCs) in 84 countries from 2003to 2005. Specifically, Acs et al. (2007) consider separately the two components ofthe T E A index defined above (i.e., they distinguish individuals who are starting anew business —nascent entrepreneurs—from individuals who are owners and man-agers of a young firm—baby entrepreneurs) and calculate the spread between thenascent and baby entrepreneurship rates in GEM (defined as the proportion of theadult population in each country who engages in nascent or baby entrepreneurship)and the percentage of individuals who have started a formal corporation. The au-thors report a number of differences in the two datasets: (i) GEM data show higherlevels of early-stage entrepreneurship in developing economies than WBGES data;(ii) WBGES business entry data tend to be higher than GEM data for developedcountries; (iii) a significantly negative relationship is found between administrativebarriers to starting a business and entrepreneurship when WBGES data are used butnot when GEM data are used. Several explanations are given for such differences,which, in our view, are very important in clarifying the differences among the twodatasets, but in no way suggest that one dataset is of better quality than the other.First, Acs et al. (2007) point out that, while WBGES only considers businessesthat legally registered as limited liability corporations, GEM data consider a largerset of entrepreneurial activities: from businesses that operate in the formal sectorbut opt for a different legal status than an LLC, to businesses that can be part of
10

the informal economy, to entrepreneurial initiatives that are at the very early stageand, hence, can potentially become businesses operating in the formal sector butdo not yet actually do so. Such a range of possibilities is likely to be more relevantfor developing than developed countries given the extent of the informal sector.Second, GEM measures the number of individual entrepreneurs, while WBGESconsiders the number of businesses. Hence, GEM can overlook the number ofindividuals who are involved in multiple new businesses. Third, the definition ofbaby entrepreneurs in GEM considers data for 42 months of activity, not for 12months, but when one estimates the annual rate for the United States they are ofcomparable magnitude of those recorded by the U.S. Census. Fourth, especiallyin developed countries, firms may register several limited liability corporations tolimit liability for different lines of businesses, helping to explain why for somecountries entrepreneurship rates computed using the World Bank data are higherthan rates computed with GEM data.
We would like to offer an additional explanation. GEM data allow a distinc-tion between remedial and opportunity entrepreneurship. As we have discussed insection 2.1.1, remedial entrepreneurship is more widespread in developing than indeveloped countries, and remedial entrepreneurs are less likely to register a busi-ness as an LLC. This can offer another reason for higher entrepreneurship ratesin developing countries when rates are computed using GEM rather than WBGESdata. Finally, relative to the existence of a negative relationship between entry bar-riers and entrepreneurship rates, results below show that a negative and statisticallysignificant relationship can be found when one uses data from GEM. However, itis important to consider opportunity and remedial entrepreneurship separately (seesection 2.3), and/or to estimate the effect of regulation on entrepreneurship usingmicro rather than macro data. This allows researchers to control for other pos-sible institutional and policy differences that exist among various developed anddeveloping countries (see section 3).
To further examine the quality of the data, we have estimated the probabilityof starting a business as a function of a set of demographic characteristics that areavailable in the data (age, gender, employment status, education, income, etc.),country by country. For the subset of countries for which we have data in both2001 and 2002, we also performed regressions by country and by year. For brevity,in Table 4 we report results for only six countries: the United States, two upper-income countries —Canada and Italy; two middle-low-income countries—Braziland China; and India, the only country in our sample classified in the low-incomegroup. Results for the other countries in our sample are not reported but are avail-able upon request. We have first compared the estimates using GEM data for theUnited States with estimates from other studies on entrepreneurship (see Lusardiand Hurst (2008)). Estimates are very similar for the United States, particularly re-
11

garding demographic variables such as gender and education. Estimates for othercountries are similar to results reported by Djankov et al. (2008) for Brazil andDjankov et al. (2006a) for China, particularly for variables such as social networksand attitudes toward risk. The importance of social networks in Italy is also high-lighted in the work by Guiso and Schivardi (2006). Among the countries whoseresults are not reported, three countries: Russia, Poland, and Slovenia, display re-sults that are different than other countries but, as reported in the robustness checkat the end of this paper, the inclusion or exclusion of these countries does not af-fect our main estimates. France also displays different estimates between 2001 and2002, although we cannot exclude the possibility that they are genuine changes dueto differences in macroeconomic conditions between the two years.
2.2 Regulatory data
To perform our empirical work, we merge the micro survey data described abovewith data on countries’ institutional and regulatory environments. We follow thework of Loayza et al. (2004), and construct indices on several aspects of marketregulation.16 In particular, we focus on entry regulatory indicators for the productmarkets, regulation of contract enforcement (indicators measuring the efficiency ofthe justice system in resolving legal disputes), and labor market regulation. Whilethese aspects of regulation do not cover all regulatory and economic policies (e.g.,taxes, tariff and non-tariff barriers, safety and environmental standards) that caninfluence individual entrepreneurial behavior, they include some of the most im-portant regulatory constraints across countries.
The data we use are from the following sources: Doing Business Database(the World Bank Group), Index of Economic Freedom (the Heritage Foundation),International Country Risk Guide (the PRS Group), and Djankov et al. (2004).Data from Doing Business refer to the year 2003; data from Djankov et al. (2004)refer to the year 1997; all other data are averages of all the available data pointsuntil the year 2000. Appendix I lists the exact source, time period, and definitionof each regulatory variable used in the empirical analysis.
Because our indices of regulation combine several different variables, we stan-dardize each variable available in the databases using the formula Xi−Xmin
Xmax−Xminwhen
higher values of the variable X indicate heavier regulation and the formula Xmax i−XiXmax−Xmin
when lower values of the variable X indicate heavier regulation. Hence, each stan-dardized regulatory variable is simply an index ranging from 0 to 1, increasing with
16We construct our own indices, rather than using the ones provided to us by Loayza et al. (2004),because regulatory variables for eleven countries included in our sample are not available in Loayzaet al. (2004).
12

the amount of regulation. For each area of regulation, we construct a synthetic in-dicator of the tightness of regulation. Each synthetic indicator is the average ofthe standardized indices measuring regulation of the relevant area. The indices aredescribed below.
Entry: The entry index measures the barriers and costs entrepreneurs facewhen they decide to create a new business. It is the average of the number ofprocedures that are officially required to start and operate a new business, the timeand cost needed to complete such procedures, and a composite index measuringnot only how easy/difficult it is to operate a business but also the degree of cor-ruption in the government and whether or not regulation is applied uniformly to allbusinesses.
Contract : The contract enforcement index is an indicator that measures theefficiency of the justice system in resolving commercial disputes. It is the averageof the number of procedures required to solve a dispute and of an index measuringthe ability of the government to operate without dramatic changes in policy orinterruptions of its services.
Labor : The labor index measures the difficulty for entrepreneurs of adjustingthe labor force. It is the average of indices measuring the difficulty in hiring andfiring workers, the rigidity of labor contracts, and the percentage of the workforceaffiliated with labor unions.
These indices are those used by Loyaza et al. (2004) although for a larger setof countries. Use of these indices allows us to compare our results to previousstudies and to capture many different aspects of regulation in the three areas weconsider. However, we also perform a set of regressions to examine the effect ofeach individual component. We report the results in section 3.6.
Table 5 reports the value of the synthetic indices of regulation for all countriesin the total sample and for groups of countries. Several features are worth noting.First, the level of regulation is negatively related to the countries’ income: coun-tries in the low- and middle-low-income groups exhibit levels of regulation thatare up to three times higher than the level of regulation in high-income countries.The ranking among groups of countries is quite similar for the entry and contractenforcement indices. The index measuring the regulation of labor shows that coun-tries in the East Asia and Pacific region have the lowest level of regulation, whilethe level of regulation in OECD countries, and, in particular, in countries belongingto the European Union, is very close to that of Latin America, Eastern Europe, andCentral Asia. Second, consistent with the results of several other papers,17 when
17A non-exhaustive list of papers relating countries’ legal origins and their regulatory environmentincludes Djankov et al. (2002), Djankov et al. (2003), Djankov et al. (2004), and Klapper et al.(2006).
13

we group countries by their legal origin, countries with English legal origin areamong those with the lowest levels of regulation, while countries with French andSocialist legal origin are among those with the highest levels of regulation.
Table 6 shows the correlation among the regulatory indices. There is a strongpositive correlation between the Entry and Contract indices, while the correla-tion of these two indices and the Labor index is lower. When we further look atthe correlation among the components of each synthetic index, in all areas but thelabor market, we find a positive correlation that ranges from a minimum of 38% toa maximum of 70%. However, for the labor market index, we observe a very lowcorrelation between indicators of hiring and firing costs and union density, and, inone case, the correlation is negative. Thus, regulation in the labor markets can havedifferent effects than regulation in other markets.
Finally, given that we have a different sample, we computed the correlation ofthe indices we constructed with the ones of Loyaza et al. (2004). The correlationis equal to 0.97 for the entry regulatory index, 0.80 for the contract enforcementregulation index, and 0.74 for the labor market regulation index. Hence, eventhough our sample of countries differs from that of Loyaza et al. (2004), our indicesare very similar.
2.3 Descriptive statistics
We start the empirical analysis with some descriptive statistics. We first discuss therelationship between entrepreneurship and personal characteristics (Table 7); wethen turn to the relationship between entrepreneurship and countries’ regulatoryenvironments.
In Table 7, columns 1-3, we compute average values of the individual char-acteristics described in Table 2 separately for individuals who engage in entrepre-neurial activity (T E A = 1) and for those who do not (T E A = 0). We also test forthe equality of means between entrepreneur types. Even though we only considerindividuals in pre-retirement years (ages 18-64), the average age of entrepreneursis lower by approximately 2 years than the average age of non-entrepreneurs (i.e.,individuals who are not operating a new or young firm) and the difference is sta-tistically significant at the 5% level. The percentage of males among entrepreneursis higher than among non-entrepreneurs as is the percentage of working individu-als (85% of nascent entrepreneurs are working at the time of the interview, whileonly 64.8% of non-entrepreneurs are working). As far as individual education isconcerned, the largest difference relates to the percentage of people holding a post-secondary degree—about 8% greater in the sample of entrepreneurs. Similarly, thepercentage of high-income people starting a new business is 9% greater than thatof people in the same income category who are not engaging in entrepreneurial
14
activity. Finally, the percentage of individuals who know someone who has starteda business in the recent past and the percentage of individuals who think that theyhave the knowledge, skills, and experience to start a new business is significantlyhigher among entrepreneurs than among non-entrepreneurs. The opposite occursfor the percentage of individuals who think that fear of failing could prevent themfrom starting a new business. Note that in all cases, we can reject the null hypoth-esis of the test on the equality of the means of the two groups of individuals at the5% level of significance.
We have conducted the same type of analysis comparing characteristics of dif-ferent types of entrepreneurs. Results are reported in Table 7, columns 4-6. Onaverage, opportunity entrepreneurs are slightly younger than remedial entrepre-neurs. Moreover, opportunity entrepreneurs are more likely to be male, to have ahigher level of education and income, and to have more confidence in their skillsand abilities and less fear of failure than remedial entrepreneurs. Consistent withthe test results in Table 7, columns 1-3, we can reject the null hypothesis of theequality of means in the two groups of individuals for almost all variables. For ex-ample, means are statistically different between the two groups for variables suchas the percentage of people who work, the percentage of people with more than acollege degree, and with low and high (but not middle) income.
Finally, we have repeated the analysis in Table 7, dividing countries by incomegroups and geographical areas. Results, not shown but available upon request, arequalitatively identical to those just discussed.
We now turn to a cross-country analysis of entrepreneurship and regulation. Wecompute the proportion of opportunity entrepreneurs (T E AO P P) and remedialentrepreneurs (T E AN EC) for each country in our sample and study the univari-ate relationship between the proportion of entrepreneurs in each country and thelevel of regulation, using the three indices we discussed in section 2.2. Figures 2and 3 show the results for the group of high-income countries and middle- and low-income countries respectively. We find a negative relationship between T E AO P Pand all measures of regulation. Thus, higher levels of regulation are associated withlower rates of activity to pursue a business opportunity. This is true both in thehigh-income country group and in the low and middle-income group, even thoughthe magnitude of the effects differs in the two groups of countries. Findings aredifferent for the other measure of entrepreneurial activity: T E AN EC . We finda positive correlation between the indices of entry regulation and of contract en-forcement regulation and T E AN EC , but a negative correlation between the levelof regulation of labor markets and T E AN EC . Thus, countries with more stringentregulation of entry, less efficient judicial systems, and less regulated labor marketsexhibit higher remedial entrepreneurship rates. However, due to the small numberof observations at the macro level (25 for the high-income group, and 12 for low,
15
middle-low and upper-middle-income countries), the coefficients of the univariateregressions are often not statistically significant. This analysis shows that it is criti-cally important to be able to differentiate between types of entrepreneurial activity.It also highlights that regulation may act as a detriment for the type of entrepre-neurial activity —opportunity entrepreneurs—that is more likely to be a drive foreconomic activity and growth.
3 Econometric analysis
3.1 Methodology
We now turn to a more formal analysis of the effect of individual characteristicsand regulation on entrepreneurship. For individual i , in country j , at time t , letus define the outcome of interest yi jt , where y is one of the three measures of en-trepreneurial activity: T E A, T E AO P P, T E AN EC . We estimate the followingequation for yi j t :
yi j t = α j + β1Xi jt + β2Xi jt R j + γ t + εi j t (1)
where α j is a vector of country dummies, X is a vector of variables measur-ing individual characteristics such as age, gender, employment status, education,income, the role of social networks, business skills, and fear of failure, R capturescountries’ regulatory and legal environment, and γ t is a time dummy variable.Since the dependent variable is binary, we use probit estimation and correct thestandard errors by clustering them at the country level.
Our sample includes many different countries whose macroeconomic and in-stitutional characteristics (level of economic development, growth rates, level oftaxation, and degree of openness, just to mention a few) can be correlated both withthe entrepreneurship indices and with the regulatory variables. While we cannotseparately account for each country’s macroeconomic and institutional variable,we can control for countries’ specific characteristics, including the level of the reg-ulatory environment, by adding country fixed effects to our regressions. Becauseregulatory variables are country and time invariant, once we include α j among ourregressors, we can only measure the differential effect that personal characteristicshave on the decision to engage in entrepreneurial activity because of cross-countrydifferences in the regulatory and legal environment. In other words, we can onlymeasure the effect of regulation via the interaction between countries’ regulationand individual characteristics.
16

3.2 Entrepreneurship and personal characteristics
In Table 8 we estimate the effect of individual characteristics on the indices ofentrepreneurial activity T E A, T E AO P P, T E AN EC . In columns 1-3, we ex-clude the variables measuring the income group to which the individual belongs.We include income dummies in columns 4-6. When we do so, the sample shrinkssignificantly because the income data is not available for many countries.
The variable that has the largest effect on the likelihood of an individual be-coming an entrepreneur is Skills, a proxy for individual degree of self-confidence(or self-assessed skills and abilities). Ceteris paribus, when Skills = 1, the prob-ability of engaging in entrepreneurship increases by more than 8.5% in column 1when considering T E A. The effects of Skills is large both for opportunity andremedial entrepreneurs, estimates are 5.9% in column 2 and 1.5% in column 3,respectively.
Fear of failure, a proxy for individual attitudes toward risk, is another impor-tant variable and negatively affects entrepreneurship. Note that fear of failure af-fects opportunity entrepreneurs and our total index of entrepreneurship, but it issignificant only at the 10% level for individuals for whom entrepreneurship is aremedial activity. Similarly, the effect of education on entrepreneurship dependson entrepreneurial type. The coefficients of the dummy variables Highschool andCollege18 are both positive and statistically significant when we estimate equa-tion (1) for T E AO P P , while both are negative and statistically significant forT E AN EC . This may explain why evidence of the effect of education on entrepre-neurship in the literature is rather mixed when using a measure of entrepreneurshipthat does not account for individual motivation to become an entrepreneur (see, forexample, Blanchflower (2004)). These findings again highlight the importance ofdistinguishing between types of entrepreneurial activity.19
Entrepreneurship is also affected by social networks. In all specifications, thecoefficient of this variable is positive and statistically significant at the 1% level.The probability of becoming involved in an entrepreneurial activity when knowingsomeone who has started a business increases by 3% for opportunity entrepreneursand by 0.5% for remedial entrepreneurs. Other authors have found evidence ofthe importance of social networks and social capital on entrepreneurship (see, for
18The dummy variable Highschool is equal to 1 if the individual has at least a high school degree(high school degree or more than high school but no college degree) and to 0 otherwise. The dummyvariable College is equal to 1 if the individual has at least a college degree (college degree and higherdegrees) and to 0 otherwise.
19As highlighted in Mondragon-Velez and Pena-Parga (2008) some forms of entrepreneurship aresimply a subsistence activity. Since there is little transition out of this type of business activityinto business-ownership, policy-makers should consider carefully policies that promote remedialentrepreneurship.
17
example, Djankov et al. (2005) and (2006), Guiso et al. (2004) and Nanda andSorensen (2007)). Our work adds to this literature by highlighting that networksare an important factor, particularly for specific entrepreneurial types.20
Turning to the effect of variables measuring individual status in the workforce,people who do not work, students, retired and disabled individuals are less likelyto become entrepreneurs than individuals who work. This is true both for remedialentrepreneurs and opportunity entrepreneurs. We also find evidence of a nonlineareffect for age: while the coefficient of the linear term is positive and statisticallysignificant, the coefficient of the square term is negative and statistically signifi-cant. The magnitude of the coefficients implies that the probability of starting anew entrepreneurial activity increases with age for individuals younger than 32 incolumn 1, younger than 29 in column 2, and younger than 40 in column 3, anddecreases with age afterwards. Finally, men are more likely than women to pursueentrepreneurial activity; this is true both for necessity and opportunity entrepre-neurs.
In columns 4-6, we control for the dummy variables Lowestinc, Middleinc,Upperinc. These indicators are equal to 1 if individuals’ income is in the lowest,middle, or upper third income percentile of their country’s income distribution,and equal to 0 otherwise. We find a non-linear relationship between the compos-ite index T E A and individual income. The probability of starting a new businessis higher for individuals in both the lowest and the upper income groups. Thisnon-linearity captures the different effect income has on entrepreneurial type. ForT E AO P P , the coefficient of the variable Lowestinc is not statistically signifi-cant, while that of Upperinc is positive and statistically significant. For T E AN EC ,the coefficient of the variable Lowestinc is positive and statistically significant,that of Upperinc is negative and not statistically significant. Thus, again it iscrucial to be able to distinguish between individual motivations to become entre-preneurs. Also, while income is an important control, the estimates of the othervariables do not change significantly when adding income dummies to the regres-sion.21 This provides further evidence of the robustness of our estimates since thesample reduces considerably when adding income dummies.
There are other potential determinants of entrepreneurship that previous studieshave considered such as wealth, family background, optimism, and other sociolog-ical and psychological characteristics (see, for example, Blanchflower (2004), de
20Estimating the impact of peer effect on entrepreneurship is complex and other studies were ableto take account of the endogeneity of peers (see Nanda and Sorensen (2007) and their discussionon the difficulty of estimating peer effects)). Since we only have a cross section of data, we cannotaddress this problem in our empirical analysis.
21The coefficient of the variables Age, Male, and Highschool in column 6 become insignificant.The coefficient of the variable Fear f ail becomes significant at the 5% level in column 6.
18

Melo, McKenzie, and Woodruff (2008), Djankov et al. (2008), Fairlie and Robb(2007), and Puri and Robinson (2006)). Unfortunately, we do not have informationabout these variables in this survey and cannot account for them in our empiricalwork.
3.3 Entrepreneurship and regulation
We now consider the effects of regulation by interacting the synthetic indices:Entry, Contract , and Labor with the vector of individual characteristics. Be-cause indices are highly correlated, we consider each regulatory index separately.Results are reported in Table 9; they refer to the specifications in which we excludeincome dummies. We discuss specifications which include income dummies insection 3.7.
Columns 1-3 report the results for the regulation of entry. The parameter ofinterest is β2. Negative values of β2 in equation (1) indicate that heavier regulationof entry reduces the effect of personal characteristics on the likelihood to engagein entrepreneurship when β1 in equation (1) is positive and reinforces the effect ofpersonal characteristics when β1 is negative. For example, while the probability ofengaging in entrepreneurship is higher for individuals who know someone who hasstarted a business recently (i.e., those for whom Knowent = 1), in countries whereentry is more heavily regulated, the effect of social network is much reduced. Toevaluate its magnitude, we calculate the marginal effect due to a change in the vari-able Knowent from 0 to 1 in two hypothetical countries: one in which the entryregulatory index is equal to 0 (the index minimum value) and one in which theindex is equal to 1 (the index maximum value). Using the estimates reported incolumn 1, we find that the probability of becoming an entrepreneur in these twodifferent countries changes from 6% to 1.8%. Thus, regulation substantially curbsthe positive effect of social networks on entrepreneurship. A similar effect also oc-curs when we distinguish opportunity entrepreneurs from necessity entrepreneurs.Consider first the former (see column 2). The probability to engage in entrepreneur-ship for individuals who know someone who has recently started a new business ishigher by 4 percentage points than for individuals who do not know entrepreneursif they live in a low-regulation country (a country in which Entry = 0). How-ever, individuals who know people who are entrepreneurs have only a 1.7% higherprobability to become entrepreneurs than individuals for whom Knowent = 0 ifthey live in a high-regulation country (a country in which Entry = 1). Hence,the positive effect of social capital on entrepreneurship is reduced by more thanhalf if Entry changes from 0 to 1. For necessity entrepreneurs (see column 3), themarginal effect due to a change in the variable Knowent from 0 to 1 is equal to0.8% when Entry = 0 and it is reduced to 0.2% when Entry = 1. Hence, the
19

positive effect of social networks on entrepreneurship is almost eliminated whengoing from low- to high-regulation countries (Entry changes from 0 to 1).
Regulation also diminishes the effect of Skills. Individuals who report havingbusiness skills (i.e., those for whom Skills = 1) are less likely to engage in newentrepreneurial activity when entry regulation is more stringent. This effect is en-tirely driven by individuals who engage in entrepreneurship to pursue a businessopportunity. In fact, the coefficient of the interaction term Entry ∗ Skills is notstatistically significant in column 3, but it is statistically significant at the 5% levelin column 2.
Tougher entry regulation also decreases the probability of starting new entre-preneurial activity for individuals who do not work and for students, a finding thathas important policy implications. Consider, for example, Italy and the UnitedStates, whose values of the entry regulation index are 0.38 and 0.14, respectively.An American who does not work faces a lower probability of engaging in entre-preneurship than an American who is employed; the estimate is -1.47% (-0.0058-(0.064*0.14)). The same figure is much higher for Italians who do not work; it is-3.01% (-0.0058 -(0.064*0.38)). Thus, individuals who do not work are two timesless likely to start a new business than individuals who do work if they live in Italyrather than in the United States. More generally, the average value in the sample ofthe index of entry regulation is equal to 0.32 and the standard deviation is equal to0.17. Thus, individuals who do not work are 2.6% less likely to become entrepre-neurs than individuals who work. A one standard deviation increase in the indexreduces this number to 3.7%. Finally, individuals who want to pursue a businessopportunity and do not have a job are less likely to engage in entrepreneurship thanindividuals who work by 1.7% in countries in which Entry = 0.32. This numberbecomes 2% if Entry increases by one standard deviation. For necessity entre-preneurs who do not have a job, the probability of starting a new business is notstatistically different than for those who work if there are no regulatory constraintson entry. However, if entry is constrained in their country these entrepreneurs findit more difficult to start a new business.
Our estimates are in line with the results in Klapper et al. (2006). They find thatrelative to the high entry industries in the United States, in highly regulated coun-tries a lower number of new firms enter these industries. Ciccone and Papaioannou(2006) also find slower entry in expanding industries in countries where it takeslonger to comply with procedures required to open a new firm.
Our other indices of regulation show similar results. When we interact per-sonal characteristics with the Contract index, which measures the efficiency ofthe judicial system in resolving commercial disputes, we find estimates similar tothose reported in column 1 (see columns 4-6). Thus, contract regulation can alsocurb the effects of skills, social network, and labor force status. A country’s legal
20
environment also plays an important role in individual decisions to engage in en-trepreneurship, and this is especially true for those individuals who wish to pursuea business opportunity. The economic magnitude is also relevant. For example,while the probability of engaging in entrepreneurship is higher for individuals whoknow someone who has started a business recently (i.e., those for whom Knowent= 1), in countries where the legal system is more regulated, the effect of socialnetworks is much reduced. We calculate again the marginal effect due to a changein the variable Knowent from 0 to 1 in two hypothetical countries: one in whichthe contract regulatory index is equal to 0 (the index minimum value) and one inwhich the index is equal to 1 (the index maximum value). Using the estimatesreported in column 4, we find that the probability of becoming an entrepreneurchanges by 3.1%. Thus, this different type of regulation also curbs the positive ef-fect of social networks on entrepreneurship. Using data from Eastern and WesternEuropean firms, Desai et al. (2003) also find that industries’ entry rates are higherin countries in which courts are fair and impartial, even though this result seemsto be driven by Eastern and Central European countries, not by Western Europeanones.
When we investigate the effect of labor market regulation on the determinantsof entrepreneurship (see columns 7-9), we find that, as for the other two indices,labor market regulation curbs the effects of social network. The effect is statisti-cally significant for opportunity entrepreneurs, a finding that can have importantimplications for public policy. Moreover, the interaction term Fear f ail ∗ Laboris statistically significant for every measure of entrepreneurship we use, while itwas not in the other two indices of regulation. Thus, ceteris paribus, in countriesthat heavily regulate the labor market individuals’ risktaking attitudes seem to playa more important role than in countries with less labor market regulation.22
3.4 Additional robustness checks
Our results are robust to a variety of additional specification changes. In whatfollows, we discuss several extensions of our models. For brevity, results are notreported but are available upon request.
First, we interact the components of each synthetic index of regulation withthe vector of individual characteristics. Our goal is to investigate whether a par-ticular aspect of regulation, in each of the areas we consider, is driving the resultsreported in Table 9. For all of the synthetic indicators, we find that the compo-nents of the indices generally have similar effects on entrepreneurship even though
22Our findings about the negative effects of regulation are consistent with the results by Mul-lainathan and Schnabl (2008). They examine regulation within one country and show that tighterregulation hinders entrepreneurship.
21

some components have a larger and more significant effect through some personalcharacteristics’ variables than through others.
Second, we include an income variable (aggregated in broad groups) among theregressors in Table 9. Our results are, overall, the same. In the regressions in whichwe interact the indices of entry and contract enforcement regulation with personalcharacteristics we find evidence that regulation also has an effect through the agevariable, but the coefficients of the interaction terms between all the regulatoryindices and Skills are not statistically significant.
Third, we estimate the specifications in Table 9 separately for 2001 and 2002data for the sample of countries for which we have data for both years.23 We findno evidence of relevant changes between regressions for 2001 and 2002 and resultsin Table 9.
Fourth, we check that our results do not hinge on data for a particular country.We exclude one country at a time and reestimate the specification used in Table9. Results are qualitatively the same, even when excluding Russia, Poland, andSlovenia, whose data may be of poorer quality, as discussed above.
Finally, we estimate equation (1) for subgroups of countries. Specifically, weconsider the specifications in Table 9 for high-income countries and the other coun-tries (i.e., countries with low, middle-low and upper- middle income countries). Wefind a stronger effect of labor regulation in the wealthier countries than in the oth-ers, but in general, results do not change substantially.
3.5 Instrumental variables estimation
A potential problem of the estimates reported above is that the underlying variablesthat may be driving entrepreneurship in a country (e.g., an educational system thatencourages individual responsibility or an extensive welfare system that insulatesagainst unemployment and health risks) may also be driving the regulatory systemin that country. Thus, the relationship between entrepreneurship and regulationmay simply be the result of these omitted variables. Alternatively, it could be thatthe desire to achieve a certain level of entrepreneurship in a country shapes regu-lation in that country. In other words, the causality may go from entrepreneurshipto regulation rather than the other way around. This problem may be less rele-vant in our empirical work since we only look at the interaction of regulation withindividual characteristics rather than simply looking at the effect of regulation onentrepreneurship. In this section, we tackle these problems by using instrumentalvariables (IV) estimation.
23Data for Portugal are not available in 2002. Data for Switzerland, Chile, Thailand, China, Tai-wan, Hong Kong, Croatia, and Slovenia are not available in 2001.
22

Our instruments need to be correlated with regulation but uncorrelated withthe error term. We use countries’ legal origins as instruments. Several papershave shown that the current regulatory environments correlate with each country’slegal tradition; for example, countries with English legal origin are among thosewith the lowest level of regulation, while countries with French and Socialist le-gal origin are more heavily regulated. Because countries’ legal origins have beentransplanted through conquest and colonization that occurred centuries ago, legalorigin is unlikely to be correlated with omitted variables that influence individuals’decisions to begin a new entrepreneurial activity in 2001 or 2002.
We follow the existing literature and group countries with English (commonlaw), French (civil law), Socialist, German and Scandinavian legal origins. Weestimate equation (1) instrumenting the variable R with the indicator variables thatmeasure countries’ legal origins. Results are reported in Table 10. Note that co-efficient estimates are included in Table 10, while marginal effects are reported inall the other tables of the paper; hence, the numbers in the tables are not directlycomparable. The estimates continue to confirm the results reported in Table 9.Both entry and labor market regulation curbs the effects of social networks. Con-tract regulation also curbs the effects of social network, primarily for opportunityentrepreneurs. Moreover, entry and contract regulation strengthens the effects ofrisk aversion, thus discouraging entrepreneurship and, in particular, remedial en-trepreneurship. Finally, note that for the specifications for T E A and T E AO P P ,the p-value of a Wald test on the exogeneity of the regressors does not reject ex-ogeneity. Thus, our estimates in Table 9 do not seem to be biased due a potentialendogeneity problem.
4 Conclusions
In this paper, we use GEM data from thirty-seven countries to estimate the dif-ferential effect that individual characteristics, such as work status, education, andattitudes toward risk, have on entrepreneurship because of cross-country differ-ences in regulatory constraints. Using our data set, we can distinguish betweendifferent types of entrepreneurs, i.e., those who enter entrepreneurship to pursue abusiness opportunity versus those who enter entrepreneurship because they couldnot find better work. We also use different measures of regulation, from measuresof regulation in the product markets to regulation in the labor markets and the legalsystem.
We find evidence that regulation plays a critical role in the individual decisionto start a new business, particularly for individuals who engage in an entrepreneur-ial activity to pursue a business opportunity. The variables through which regu-
23

lation affects entrepreneurship are social network, working status, business skills,and attitudes toward risk. Specifically, regulation curbs the effects of social net-works and business skills while strengthens the effects of risk aversion. Moreover,those who do not work are less likely to become entrepreneurs in countries withhigh levels of regulation. Our results are robust to a variety of robustness checks.
This is one of the few studies that perform a micro analysis of the determinantsof entrepreneurship and the effect of regulation in a large cross section of countries.While our approach does not allow us to measure the total effect of regulation,we can measure the effect of regulation on individual characteristics, which hasimportant implications for public policy.
24

References
[1] Acs Z., S. Desai, Klapper L., (2007), “What Does "Entrepreneurship" DataReally Show? A Comparison of the Global Entrepreneurship Monitor andWorld Bank Group Datasets,” mimeo.
[2] Aghion P., P. Howitt, (1997), “Endogenous Growth Theory,” Cambridge,MA, MIT Press, 1997.
[3] Alesina A., S. Ardagna, G. Nicoletti, and F. Schiantarelli, (2005), “Regulationand Investment,” Journal of the European Economic Association, 3(4),pp. 791-825.
[4] Alfaro L., A. Charlton, (2007), “International Financial Integration and En-trepreneurial Firm Dynamics,” Harvard Business School Working Paper, n.07-012
[5] Banerjee A., A. Newman, (1994), “Poverty, Incentives, and Development,”American Economic Review Papers and Proceedings, vol. 84, pp. 211-215.
[6] Bassanini, A. and E. Ernst (2002). “Labor Market Institutions, Product Mar-ket Regulations and Innovation: Cross Country Evidence,” OECD EconomicsDepartment Working Papers, No. 316.
[7] Bayoumi T., D. Laxton, P. Pesenti, (2004), “Benefits and Spillovers of GreaterCompetition in Europe: a Macroeconomic Assessment,” Federal ReserveBank of New York Staff Report 182.
[8] Bertrand, M. and F. Kramarz (2002). “Does Entry Regulation Hinder JobCreation? Evidence From The French Retail Industry,” Quarterly Journal ofEconomics, pp. 1369-1413.
[9] Blanchflower D., (2004), “Self-Employment: More May Not Be Better,”Swedish Economic Policy Review, vol 11(2), pp. 15-74.
[10] Blanchflower D., (2000), “Self-Employment in OECD Countries,” LabourEconomics, 7, pp. 471-505.
[11] Blanchflower D., A. Oswald, and A.Stutzer, (2001), “Latent EntrepreneurshipAcross Nations,” European Economic Review, 45(4-6), pp. 680-691.
[12] Blanchflower D., A. Oswald, (1998), “What Makes an Entrepreneur?,” Jour-nal of Labor Economics, 16(1), pp. 26-60, 1998.
25
[13] Blanchard, O. J. and J. Wolfers (2000). “The Role of Shocks and Institu-tions in the Rise of European Unemployment: The Aggregate Evidence,”Economic Journal, 110, pp. 1-33.
[14] Ciccone A. and E. Papaioannou, (2006), “Red tape and Delayed Entry,”CEPR Discussion Paper n 5996.
[15] de Melo S, D. McKenzie, and C. Woodruff (2008), "Who Are the Microenter-prise Owners? Evidence from Sri Lanka on Tokman v. de Soto, forthcomingin J. Lerner and A. Schoar (eds.), "International Differences in Entrepreneur-ship."
[16] Desai, M., P. Gompers and J. Lerner, (2003), “Institutions, Capital Con-straints and Entrepreneurial Firm Dynamics: Evidence from Europe,” NBERWorking Paper No. 10165.
[17] Djankov S., Y. Qian, G. Roland, and E. Zhuravskaya, (2008), “What Makesan Entrepreneur?,” mimeo.
[18] Djankov S., T. Ganser, C. McLiesh, R. Ramalho, A. Shleifer, (2007), TheEffect of Corporate Taxes on Investment adn Entrepreneurship,” mimeo.
[19] Djankov S., Y. Qian, G. Roland, and E. Zhuravskaya, (2006a), “Who areChina’s Entrepreneurs?”, American Economic Review, Papers and Proceed-ings, vol. 96, pp. 348-352.
[20] Djankov S., Y. Qian, G. Roland, and E. Zhuravskaya, (2006b), “Entrepre-neurship in China and Russia Compared,”Journal of the European EconomicAssociation, vol. 4, n. 2-3, pp. 352-365.
[21] Djankov S., Y. Qian, G. Roland, and E. Zhuravskaya, (2005), “Who are Rus-sia’s Entrepreneurs?,” Journal of the European Economic Association, vol. 3,n. 2-3, pp. 1-11.
[22] Djankov S., R. La Porta, Lopez-De-Silanes F., Shleifer A., (2004), “The Reg-ulation of Labor,” Quarterly Journal of Economics, pp. 1339-1381.
[23] Djankov S., R. La Porta, Lopez-De-Silanes F., Shleifer A., (2003), “Courts,”Quarterly Journal of Economics, pp. 453-517.
[24] Djankov S., R. La Porta, Lopez-De-Silanes F., Shleifer A., (2002), “The Reg-ulation of Entry,” Quarterly Journal of Economics, pp. 1-37.
26

[25] Evans D., B. Jovanovic, (1989), “An Estimated Model of EntrepreneurialChoice Under Liquidity Constraints,” Journal of Political Economy, vol. 97,no. 4, pp. 808-827.
[26] Fairlie R., A. Robb, (2007), “Why Are Black-Owned Businesses Less Suc-cessful than White-Owned Businesses? The Role of Families, Inheritances,and Business Human Capital,” Journal of Labor Economics, 25(2), pp. 289-323.
[27] Fiori G.,G. Nicoletti, S. Scarpetta, and F. Schiantarelli, (2007), “EmploymentOutcomes and the Interaction Between Product and Labor Market Deregu-lation: Are They Substitutes or Complements?,” Boston College WorkingPapers in Economics 663.
[28] Gentry W., R. G. Hubbard, (2000), “Tax Policy and Entrepreneurial Entry,”American Economic Review Papers and Proceedings, vol. 90, no. 2, pp. 283-287.
[29] Guiso L., F. Schivardi, (2006),“What Determines Entrepreneurial Clusters?,”mimeo.
[30] Guiso L., P. Sapienza, L. Zingales, (2004), “Does Local Financial Develop-ment Matter?,” Quarterly Journal of Economics, pp. 929-969.
[31] Hurst E., A. Lusardi, (2004), “Liquidity Constraints, Household Wealth, andEntrepreneurship,” Journal of Political Economy, vol. 112(2), pp. 319-347.
[32] Hurst E., A. Lusardi, (2008), “Liquidity Constraints and Entrepreneurship.Household Wealth, Parental Wealth, and the Transition In and Out of En-trepreneurship”, in "Overcoming Barriers to Entrepreneurship," LexingtonBooks, MD: Lanham, pp. 47-68.
[33] Klapper L., L. Laeven, and R. Rajan, (2006) ,“Entry Regulation as a Barrierto Entrepreneurship,” Journal of Financial Economics (forthcoming).
[34] La Porta R., F. Lopez-de-Silanes, A. Shleifer, R. W. Vishny, (2000), “InvestorProtection and Corporate Governance,” Journal of Financial Economics, vol.58, pp. 1-25.
[35] La Porta R., F. Lopez-de-Silanes, A. Shleifer, R. W. Vishny, (1998), “Lawand Finance,” Journal of Political Economy, vol. 106, pp. 1113-1155.
[36] Loayza N., A. Oviedo, Serven L., (2004), “Regulation and MacroeconomicPerformance,” World Bank Policy Research Working Papers n. 3469.
27
[37] Mondragon-Velez, C. and X. Pena-Parga, (2008), "Business Ownership andSelf-Employment in Developing Economies: The Colombian Case," forth-coming in J. Lerner and A. Schoar (eds), "International Differences in Entre-preneurship."
[38] Mullainathan, S. and P. Schnabl (2008), "Business Simplification in Peru,"forthcoming in J. Lerner and A. Schoar (eds), "International Differences inEntrepreneurship."
[39] Nanda R., and J. B. Sorensen, (2007), “Peer Effects and Entrepreneurship,”Harvard Business School Working Paper n. 08-051.
[40] Nicoletti, G., and S. Scarpetta (2003), “Regulation, Productivity, and Growth:OECD Evidence,” Economic Policy, vol. 18, no. 36, pp.11-72.
[41] Puri M., D. T. Robinson, (2006), “Who Are Entrepreneurs and Why Do TheyBehave That Way,” Working Paper Duke University.
[42] Reynonds P., N. Bosma, E. Autio, S. Hunt, N. De Bono, I. Servais, P. Lopez-Garcia, N. Chin, (2005), “Gobal Entrepreneurship Monitor: Data CollectionDesign and Implementation 1998-2003,” Small Business Economics, vol. 24,pp. 205-231.
28

Appendix I: Variables used in the empirical analysis
Entrepreneurship indices - source: Global Entrepreneurship Monitor (GEM)
• T E A = 1 if individuals are starting a new business or are owners and man-agers of a young firm, 0 otherwise.
• T E AO P P = 1 if individuals are starting a new business or are owners andmanagers of a young firm to take advantage of a business opportunity, 0otherwise.
• T E AN EC = 1 if individuals are starting a new business or are owners andmanagers of a young firm because they could find no better economic work,0 otherwise.
Individuals’ characteristics - source: Global Entrepreneurship Monitor (GEM)
• AGE = age of the individual at the time of the interview.
• M AL E = 1 if male, 0 otherwise.
• W O RK I NG = 1 if individual works at the time of the interview, 0 other-wise.
• STU DE NT S = 1 if individual is a student at the time of the interview, 0otherwise.
• RET I RE D DI S ABLES = 1 if individual is retired or disabled at the timeof the interview, 0 otherwise.
• N OT W O RK I NG = 1 if individual does not work (and he/she is not astudent, nor a retired or disabled individual) at the time of the interview, 0otherwise.
• H I GH SC H OOL = 1 if individual has a high school degree, 0 otherwise.
• C OLL EGE = 1 if individual has at least a college degree, 0 otherwise.
• K N OW E NT = 1 if the person knows someone who has started a businessin the recent past, 0 otherwise.
• SK I LLS = 1 if the person thinks she has the knowledge, skills, and experi-ence to start a new business, 0 otherwise.
29

• FE ARF AI L = 1 if the person’s fear of failing can prevent him or her fromstarting a new business, 0 otherwise.
• LOW EST I NC = 1 if individuals’ income is in the lowest 33rd incomepercentile of their country’s income distribution, 0 otherwise.
• U P P E RI NC = 1 if individuals’ income is in the upper 33rd income per-centile of their country’s income distribution, 0 otherwise.
Regulatory Indices - various sources
• E NT RY measures the barriers and costs entrepreneurs face when they de-cide to create a new business; E NT RY = (procedures + time + cost + regu-lation (IEF))/4.
• P ROC E DU RES = number of procedures that are officially required tostart and operate a new business. Source: Doing Business Database (TheWorld Bank Group), 2003.
• T I M E = time in calendar days needed to complete procedures that are offi-cially required to start and operate a new business. Source: Doing BusinessDatabase (The World Bank Group), 2003.
• C OST = cost (measured as a percentage of the country’s income per capita)needed to complete procedures that are officially required to start and operatea new business. Source: Doing Business Database (The World Bank Group),2003.
• REGU L AT I O N (I E F) = composite index measuring not only how easy/difficultit is to operate a business but also examining the degree of corruption in thegovernment and whether or not regulation is applied uniformly to all busi-nesses. Source: Index of Economic Freedom (The Heritage Foundation),variable name in IEF database: regulation, average 1995-2000.
• C O NT R ACT measures the efficiency of the justice system in resolvingcommercial disputes; C O NT R ACT = (procedures + quality of bureau-cracy)/2.
• P ROC E DU RES = number of procedures required to solve a dispute. Source:Doing Business Database (The World Bank Group), 2003.
• QU AL I T Y O F BU RE AUC R ACY = index measuring the ability of thegovernment to operate without dramatic changes in policy or interruptionsof its services. Source: International Country Risk Guide (The PRS Group);variable name in ICRG database: bureaucracy, average 1984-2000.
30

• L ABO R measures the difficulty for entrepreneurs of adjusting the laborforce. L ABO R = (hiring index + firing index + firing costs + rigidity oflabor contracts + union density)/5.
• H I RI NG I N DE X = index measuring the availability of term contracts fortemporary/permanent task, the maximum cumulative duration of term con-tracts, and the ratio of the minimum wage for a trainee or first time employeeto the average value added per worker. Source: Doing Business Database(The World Bank Group), 2003.
• F I RI NG I N DE X = index measuring whether redundancy is disallowedas a basis to fire a worker, the need for the employer to notify a third partyand/or to get approval from a third party when firing one redundant workerand/or a group of more than 20 redundant workers, whether the law requiresthe employer to consider retraining or reassignment before firing a redundantworker, whether priority rules apply for redundancies and reemployment.Source: Doing Business Database (The World Bank Group), 2003.
• F I RI NG C OST = index measuring the cost in weekly wages of advancenotice requirements, severance payments adn penalties due when terminat-ing a redundant worker. Source: Doing Business Database (The World BankGroup), 2003.
• RI GI DI T Y L ABO R C O NT R ACT S = index measuring whether nightand/or weekend work is unrestricted, whether the workweek can consist of5.5 days and/or can be extended to 50 hours or more (including overtime) for2 months a year, whether paid annual vacation is 21 working days or fewer.Source: Doing Business Database (The World Bank Group), 2003.
• U N I ON DE N SI T Y percentage of total workforce affiliated to labor unionsin 1997. Source: Djankov et al. (2004).
Countries’ groups
• LOW I NC OM E includes India. Source: World Bank’s classification, seewww.worldbank.org /data/countryclass /classgroups.htm.
• M I DDL E LOW I NC includes Brazil, China, Thailand. Source: WorldBank’s classification, see www.worldbank.org /data/countryclass /classgroups.htm.
• U P P E R M I DDL E I NC includes Argentina, Chile, Croatia, Hungary,Mexico, Poland, Russia, South Africa. Source: World Bank’s classification,see www.worldbank.org /data/countryclass /classgroups.htm.
31

• H I GH I NC O M E includes Australia, Belgium, Canada, Denmark, Fin-land, France, Germany, Hong Kong, Ireland, Israel, Italy, Japan, The Nether-lands, Norway, New Zealand, Portugal, Singapore, Slovenia, Spain, SouthKorea, Sweden, Switzerland, Taiwan, United Kingdom, United States. Source:World Bank’s classification, see www.worldbank.org /data/countryclass /class-groups.htm.
• O EC D includes Australia, Belgium, Canada, Denmark, Finland, France,Germany, Ireland, Italy, Japan, The Netherlands, Norway, New Zealand,Portugal, Spain, Sweden, Switzerland, United Kingdom, United States.
• EU includes Belgium, Denmark, Finland, France, Germany, Ireland, Italy,The Netherlands, Portugal, Spain, Sweden, United Kingdom;
• EC A includes Croatia, Hungary, Poland, Russia, Slovenia.
• E AP includes China, Hong Kong, Singapore, South Korea, Taiwan, Thai-land.
• L AT I N AM E RIC A includes Argentina, Brazil, Chile, Mexico.
• Legal Origin :
• E NGL I SH includes Australia, Canada, Hong Kong, India, Ireland, Israel,New Zealand, South Africa, Singapore, Thailand, United Kingdom, UnitedStates. Source: Djankov et al. (2003).
• SOC I AL I ST includes China, Croatia, Hungary, Poland, Russia, Slovenia.Source: Djankov et al. (2003).
• F RE NC H includes Argentina, Belgium, Brazil, Chile, France, Italy, Mex-ico, The Netherlands, Portugal, Spain. Source: Djankov et al. (2003)
• GE RM AN includes Germany, Japan, Switzerland, South Korea, Taiwan.Source: Djankov et al. (2003).
• SC AN DI N AV I AN includes Denmark, Finland, Norway, Sweden. Source:Djankov et al. (2003).
32

Appendix II: GEM questionnaires’ questions
The following are the questionnaires’ questions that the GEM coordinationteam uses to generate the variables T E A, T E AO P P , T E AN EC . Questions arefrom the 2002 data documentation manual. Questions asked in 2001 were exactlythe same, even though the numbering of the questions changes. The methodologyfollowed to construct the indices is based on procedures previously used in the USPanel Study of Entrepreneurial Dynamics and it is described in detail in the 2001and 2002 Adult Population Surveys’ data documentation and in Reynolds et al.(2005).
• 1. Which of the following would apply to you? (Possible answers: Yes, No,Don’t Know, Refused)
• 1a. You are, alone or with others, currently trying to start a new business,including any self-employment or selling any goods or services to others.
• 1b. You are, alone or with others, currently trying to start a new business ora new venture for your employer– an effort that is part of your normal work.
• 1c. You are, alone or with others, currently the owner of a company you helpmanage, self-employed, or selling any goods or services to others.
• If "Yes", Or “Don’t Know” To Qu. 1a or Qu. 1b, Ask Qu 2a. If “Yes”, Or“Don’t Know” To Qu. 1c, Ask Qu. 3a.
• 2a. Over the past twelve months have you done anything to help start a newbusiness, such as looking for equipment or a location, organizing a start-upteam, working on a business plan, beginning to save money, or any otheractivity that would help launch a business?
• 2b. Will you personally own all, part, or none of this business?
• 2d. Has the new business paid any salaries, wages, or payments in kind,including your own, for more than three months?
• 2d1. What was the first year the owners received wages, profits, or paymentsin kind?
• 2g. Are you involved in this start-up to take advantage of a business oppor-tunity or because you have no better choices for work?
• 3a. Do you personally own all, part, or none of this business?
33
• 3c. What was the first year the owners received wages, profits, or paymentsin kind? Payments in kind refers to goods or services provided as paymentsfor work rather than cash.24
• 3g. Are you involved in this firm to take advantage of a business opportunityor because you have no better choices for work.
The following are the questionnaires’ questions used to define the variablesKnowent , Skills, and Fear f ail, respectively. Questions are from the 2002 datadocumentation manual. Questions asked in 2001 were exactly the same eventhough the numbering of the questions changes.
• 1. Which of the following would apply to you? (Possible answers: Yes, No,Don’t Know, Refused)
• 1g. You know someone personally who started a business in the past 2 years
• 1i. You have the knowledge, skill and experience required to start a newbusiness
• 1j. Fear of failure would prevent you from starting a business
24From this question, researchers can identify owners who have received wages, profits, or pay-ments in kind for no more than 42 months.
34
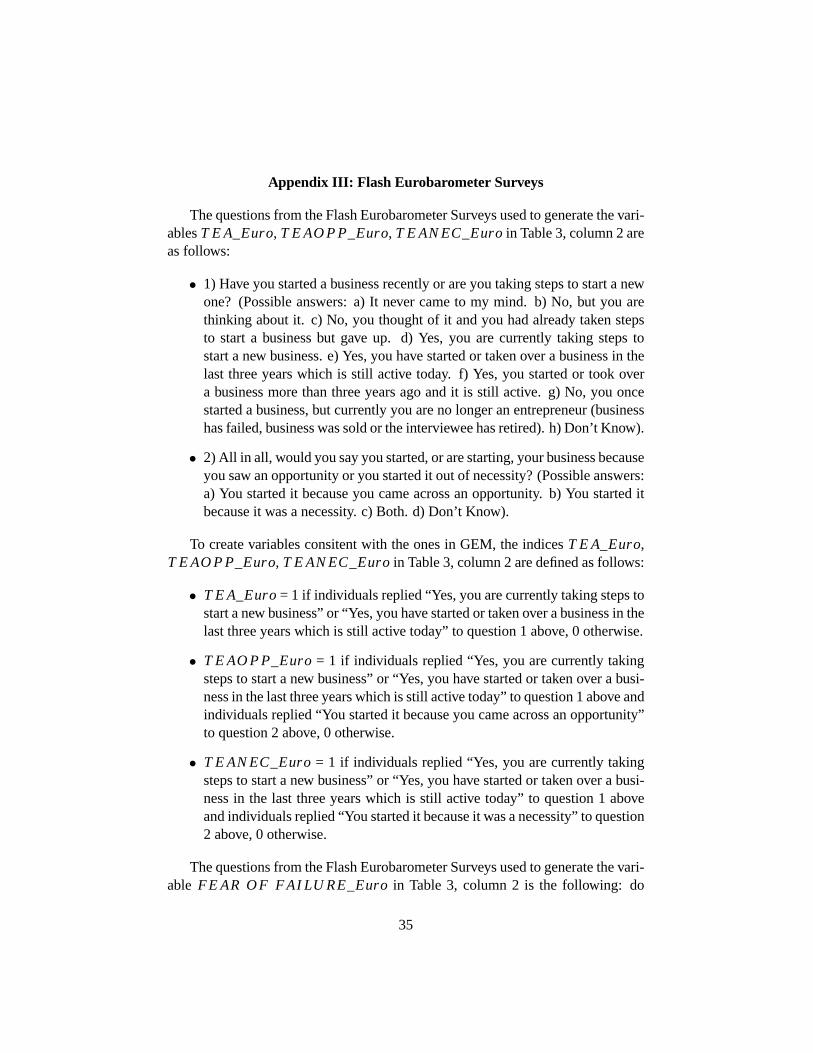
Appendix III: Flash Eurobarometer Surveys
The questions from the Flash Eurobarometer Surveys used to generate the vari-ables T E A_Euro, T E AO P P_Euro, T E AN EC_Euro in Table 3, column 2 areas follows:
• 1) Have you started a business recently or are you taking steps to start a newone? (Possible answers: a) It never came to my mind. b) No, but you arethinking about it. c) No, you thought of it and you had already taken stepsto start a business but gave up. d) Yes, you are currently taking steps tostart a new business. e) Yes, you have started or taken over a business in thelast three years which is still active today. f) Yes, you started or took overa business more than three years ago and it is still active. g) No, you oncestarted a business, but currently you are no longer an entrepreneur (businesshas failed, business was sold or the interviewee has retired). h) Don’t Know).
• 2) All in all, would you say you started, or are starting, your business becauseyou saw an opportunity or you started it out of necessity? (Possible answers:a) You started it because you came across an opportunity. b) You started itbecause it was a necessity. c) Both. d) Don’t Know).
To create variables consitent with the ones in GEM, the indices T E A_Euro,T E AO P P_Euro, T E AN EC_Euro in Table 3, column 2 are defined as follows:
• T E A_Euro = 1 if individuals replied “Yes, you are currently taking steps tostart a new business” or “Yes, you have started or taken over a business in thelast three years which is still active today” to question 1 above, 0 otherwise.
• T E AO P P_Euro = 1 if individuals replied “Yes, you are currently takingsteps to start a new business” or “Yes, you have started or taken over a busi-ness in the last three years which is still active today” to question 1 above andindividuals replied “You started it because you came across an opportunity”to question 2 above, 0 otherwise.
• T E AN EC_Euro = 1 if individuals replied “Yes, you are currently takingsteps to start a new business” or “Yes, you have started or taken over a busi-ness in the last three years which is still active today” to question 1 aboveand individuals replied “You started it because it was a necessity” to question2 above, 0 otherwise.
The questions from the Flash Eurobarometer Surveys used to generate the vari-able FE AR O F F AI LU RE_Euro in Table 3, column 2 is the following: do
35

you strongly agree, agree, disagree, or strongly disagree with the following opin-ion? One should not start a business if there is a risk it might fails. FE AR O FF AI LU RE_Euro measures the percentage of people who strongly agree or agreewith this opinion.
36
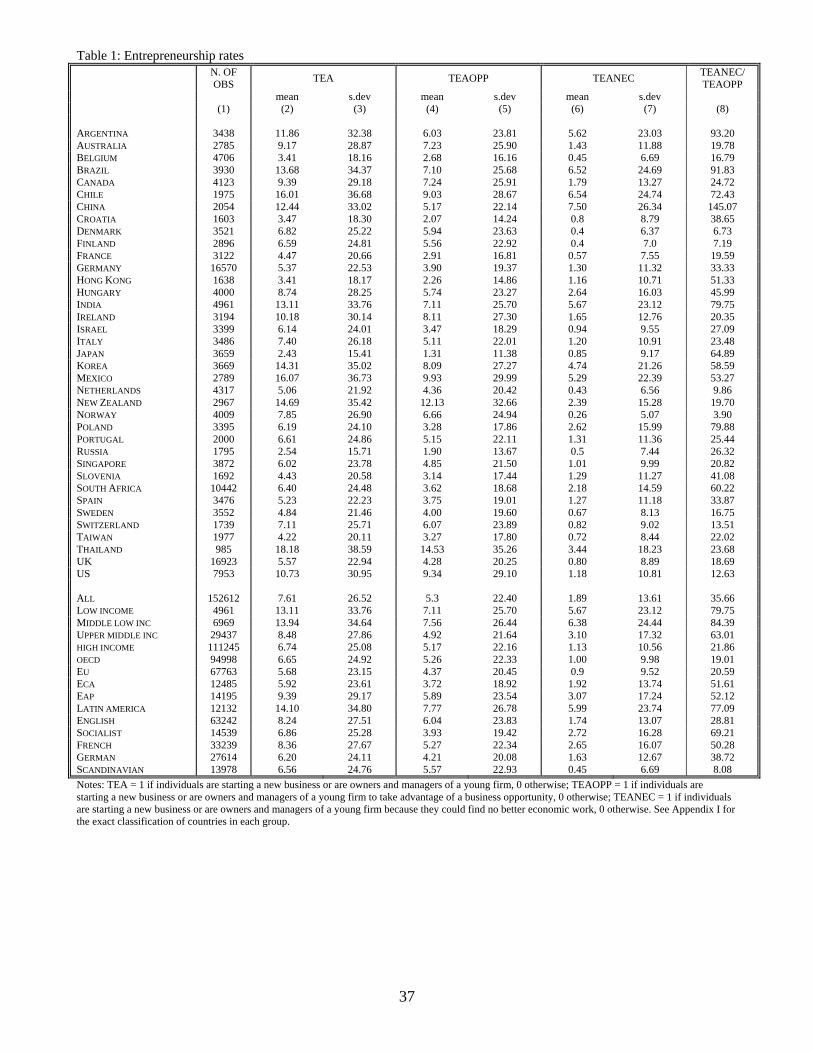
37
Table 1: Entrepreneurship rates
N. OF OBS TEA TEAOPP TEANEC TEANEC/
TEAOPP mean s.dev mean s.dev mean s.dev (1) (2) (3) (4) (5) (6) (7) (8) ARGENTINA 3438 11.86 32.38 6.03 23.81 5.62 23.03 93.20 AUSTRALIA 2785 9.17 28.87 7.23 25.90 1.43 11.88 19.78 BELGIUM 4706 3.41 18.16 2.68 16.16 0.45 6.69 16.79 BRAZIL 3930 13.68 34.37 7.10 25.68 6.52 24.69 91.83 CANADA 4123 9.39 29.18 7.24 25.91 1.79 13.27 24.72 CHILE 1975 16.01 36.68 9.03 28.67 6.54 24.74 72.43 CHINA 2054 12.44 33.02 5.17 22.14 7.50 26.34 145.07 CROATIA 1603 3.47 18.30 2.07 14.24 0.8 8.79 38.65 DENMARK 3521 6.82 25.22 5.94 23.63 0.4 6.37 6.73 FINLAND 2896 6.59 24.81 5.56 22.92 0.4 7.0 7.19 FRANCE 3122 4.47 20.66 2.91 16.81 0.57 7.55 19.59 GERMANY 16570 5.37 22.53 3.90 19.37 1.30 11.32 33.33 HONG KONG 1638 3.41 18.17 2.26 14.86 1.16 10.71 51.33 HUNGARY 4000 8.74 28.25 5.74 23.27 2.64 16.03 45.99 INDIA 4961 13.11 33.76 7.11 25.70 5.67 23.12 79.75 IRELAND 3194 10.18 30.14 8.11 27.30 1.65 12.76 20.35 ISRAEL 3399 6.14 24.01 3.47 18.29 0.94 9.55 27.09 ITALY 3486 7.40 26.18 5.11 22.01 1.20 10.91 23.48 JAPAN 3659 2.43 15.41 1.31 11.38 0.85 9.17 64.89 KOREA 3669 14.31 35.02 8.09 27.27 4.74 21.26 58.59 MEXICO 2789 16.07 36.73 9.93 29.99 5.29 22.39 53.27 NETHERLANDS 4317 5.06 21.92 4.36 20.42 0.43 6.56 9.86 NEW ZEALAND 2967 14.69 35.42 12.13 32.66 2.39 15.28 19.70 NORWAY 4009 7.85 26.90 6.66 24.94 0.26 5.07 3.90 POLAND 3395 6.19 24.10 3.28 17.86 2.62 15.99 79.88 PORTUGAL 2000 6.61 24.86 5.15 22.11 1.31 11.36 25.44 RUSSIA 1795 2.54 15.71 1.90 13.67 0.5 7.44 26.32 SINGAPORE 3872 6.02 23.78 4.85 21.50 1.01 9.99 20.82 SLOVENIA 1692 4.43 20.58 3.14 17.44 1.29 11.27 41.08 SOUTH AFRICA 10442 6.40 24.48 3.62 18.68 2.18 14.59 60.22 SPAIN 3476 5.23 22.23 3.75 19.01 1.27 11.18 33.87 SWEDEN 3552 4.84 21.46 4.00 19.60 0.67 8.13 16.75 SWITZERLAND 1739 7.11 25.71 6.07 23.89 0.82 9.02 13.51 TAIWAN 1977 4.22 20.11 3.27 17.80 0.72 8.44 22.02 THAILAND 985 18.18 38.59 14.53 35.26 3.44 18.23 23.68 UK 16923 5.57 22.94 4.28 20.25 0.80 8.89 18.69 US 7953 10.73 30.95 9.34 29.10 1.18 10.81 12.63 ALL 152612 7.61 26.52 5.3 22.40 1.89 13.61 35.66 LOW INCOME 4961 13.11 33.76 7.11 25.70 5.67 23.12 79.75 MIDDLE LOW INC 6969 13.94 34.64 7.56 26.44 6.38 24.44 84.39 UPPER MIDDLE INC 29437 8.48 27.86 4.92 21.64 3.10 17.32 63.01 HIGH INCOME 111245 6.74 25.08 5.17 22.16 1.13 10.56 21.86 OECD 94998 6.65 24.92 5.26 22.33 1.00 9.98 19.01 EU 67763 5.68 23.15 4.37 20.45 0.9 9.52 20.59 ECA 12485 5.92 23.61 3.72 18.92 1.92 13.74 51.61 EAP 14195 9.39 29.17 5.89 23.54 3.07 17.24 52.12 LATIN AMERICA 12132 14.10 34.80 7.77 26.78 5.99 23.74 77.09 ENGLISH 63242 8.24 27.51 6.04 23.83 1.74 13.07 28.81 SOCIALIST 14539 6.86 25.28 3.93 19.42 2.72 16.28 69.21 FRENCH 33239 8.36 27.67 5.27 22.34 2.65 16.07 50.28 GERMAN 27614 6.20 24.11 4.21 20.08 1.63 12.67 38.72 SCANDINAVIAN 13978 6.56 24.76 5.57 22.93 0.45 6.69 8.08 Notes: TEA = 1 if individuals are starting a new business or are owners and managers of a young firm, 0 otherwise; TEAOPP = 1 if individuals are starting a new business or are owners and managers of a young firm to take advantage of a business opportunity, 0 otherwise; TEANEC = 1 if individuals are starting a new business or are owners and managers of a young firm because they could find no better economic work, 0 otherwise. See Appendix I for the exact classification of countries in each group.

38
Table 2: Individual characteristics
ALL LOW INCOME MIDDLE LOW INC
UPPER MIDDLE INC HIGH INCOME
(1) (2) (3) (4) (5) AGE 39.35 38.56 36.32 37.36 40.09 (12.87) (10.93) (12.29) (13.14) (12.84) % MALE 49.35 53.20 52.12 48.22 49.30 (50.00) (49.90) (49.96) (49.97) (50.00) % WORKING 66.31 58.72 68.76 51.82 69.79 (47.27) (49.25) (46.35) (49.97) (45.92) % STUDENTS 4.77 3.35 3.64 7.48 4.21 (21.32) (17.99) (18.73) (26.30) (20.08) % RETIRED AND DISABLES 6.60 0.67 9.66 9.50 5.87 (24.82) (8.15) (29.54) (29.32) (23.50) % NOT WORKING 22.33 37.26 17.94 31.20 20.14 (41.64) (48.36) (38.37) (46.33) (40.10) %HIGH SCHOOL 38.30 15.47 11.41 39.77 40.30 (48.61) (36.16) (31.80) (48.94) (49.05) %COLLEGE 30.32 11.75 11.36 19.00 34.52 (45.97) (32.21) (31.74) (39.23) (47.54) % LOW INCOME 27.90 58.69 55.61 30.14 25.33 (44.85) (49.25) (49.69) (45.89) (43.49) % MIDDLE INCOME 40.15 33.37 30.52 38.83 41.12 (49.02) (47.16) (46.06) (48.74) (49.20) % UPPER INCOME 31.94 7.94 13.86 31.03 33.56 (46.63) (27.04) (34.56) (46.26) (47.22) % KNOWS ENTREPR 34.70 18.53 44.40 32.13 35.46 (47.60) (38.85) (49.69) (46.70) (47.84) % HAS SKILLS 40.57 40.39 46.88 40.49 40.20 (49.10) (49.07) (49.91) (49.09) (49.03) % FEAR OF FAILURE 33.74 26.63 37.11 29.92 34.78 (47.28) (44.20) (48.31) (45.79) (47.63) N. OF OBSERVATIONS 152612 4961 6969 29437 111245 Notes: Standard deviation in parenthesis. AGE = age of the individual at the time of the interview; WORKING = individuals who work at the time of the interview; STUDENTS individuals who are students at the time of the interview; RETIRED AND DISABLES = individuals who are retired or disable at the time of the interview; NOT WORKING = individuals who do not work and are not students, retired, or disable at the time of the interview; HIGH SCHOOL = individuals with a high school degree; COLLEGE = individuals with at least a college degree; LOW INCOME = individuals with income in the lowest 33rd income percentile of their country's income distribution; MIDDLE INCOME = individuals with income in the middle 33rd income percentile of their country's income distribution; UPPER INCOME = individuals with income in the upper 33rd income percentile of their country's income distribution; KNOWS ENTREPR = individuals who know someone who has started a business in the recent past; HAS SKILLS individuals who think they have the knowledge, skills and experience to start a new business; FEAR OF FAILURE = individuals who answer that fear of failing can prevent them to start a new business. See also Appendix I.

39
Table 3: Comparisons between GEM data and Flash Eurobarometer data
SAMPLE OF COUNTRIES SURVEYED IN GEM ALSO SURVEYD IN FLASH EUROBAROMETER
(1)
SAMPLE OF COUNTRIES SURVEYED IN FLASH EUROBAROMETER ALSO SURVEYED IN GEM
(2)
6.37 (0.08)
[88812] 4.93
(0.07) [88812]
1.06 (0.03)
[88812]
6.53 (0.16)
[24526] 4.12
(0.19) [11161]
1.35 (0.11)
[11161]
TEA (total entrepreneurial activity) TEAOPP (total opportunity entrepreneurial activity) TEANEC (total remedial entrepreneurial activity)
ALL ENTREPR NON ENTREPR. ALL ENTREPR NON ENTREPR.
AGE 40.30 37.91 40.46 40.99 37.86 41.21 (0.04) (0.15) (0.04) (0.08) (0.27) (0.08) [88812] [5586] [83226] [24526] [1603] [22923] % MALE 49.32 65.59 48.20 47.50 62.38 46.46 (0.17) (0.64) (0.17) (0.32) (1.21) (0.33) [88812] [5586] [83226] [24526] [1603] [22923] % WORKING 69.60 85.94 68.49 69.07 84.98 67.96 (0.16) (0.48) (0.17) (0.29) (0.89) (0.30) [82465] [5140] [77325] [24385] [1598] [22787] % FEAR OF FAILURE 34.85 19.84 35.89 44.99 34.51 45.73 (0.16) (0.54) (0.17) (0.32) (1.19) (0.33) [85721] [5477] [80244] [24020] [1579] [22441] Notes: Standard errors of the mean in (). Number of observations in []. See aAppendix I and Appendix III for variables’ definitions.

40
Table 4: Entrepreneurship and individual characteristics in selected countries US CANADA ITALY TEA TEAOPP TEANEC TEA TEAOPP TEANEC TEA TEAOPP TEANEC (1) (2) (3) (4) (5) (6) (7) (8) (9) AGE 0.0019 0.0016 0.0004 -0.0013 -0.0013 0.0004 -0.0043 -0.0027 0.0022 (0.99) (0.89) (0.61) (-0.55) (-0.71) (0.47) (-1.64)* (-1.36) (2.06)** AGE SQUARE -0.00003 -0.00003 -0.000006 0.000007 0.000007 -0.000005 0.000038 0.000024 -0.000028 (-1.48) (-1.39) (-0.77) (0.22) (0.31) (-0.50) (1.18) (0.98) (-2.07)** MALE 0.0112 0.0071 0.0019 0.0219 0.0169 0.0012 -0.0086 0.0007 -0.0036 (1.64)* (1.14) (0.84) (2.51)** (2.54)** (0.36) (-1.00) (0.11) (-0.92) NOT WORKING 0.0076 -0.0044 0.0102 0.0072 -0.0220 0.0278 -0.0319 -0.029 0.0024 (0.73) (-0.46) (3.01)*** (0.42) (-1.75)* (3.24)*** (-3.38)*** (-4.13)*** (0.56) STUDENTS -0.0209 -0.0164 -0.0012 -0.0292 -0.0291 0.0121 -0.0536 -0.0328 -0.0004 (-1.49) (-1.31) (-0.23) (-1.32) (-2.06)** (1.09) (-4.55)*** (-3.70)*** (-0.05) RETIRED DISABLES -0.0286 -0.0145 -0.0076 -0.0512 -0.0299 (-1.93)* (-1.21) (-1.56) (-2.97)*** (-2.38)** HIGHSCHOOL 0.0283 0.0423 -0.0039 -0.0097 -0.0124 0.0037 -0.0092 -0.0016 -0.0114 (1.98)** (2.86)*** (-1.36) (-0.66) (-1.09) (0.67) (-0.78) (-0.17) (-2.57)** COLLEGE 0.0266 0.0376 -0.0072 0.0039 0.0075 -0.0055 -0.0221 -0.0118 -0.0113 (2.09)** (3.03)*** (-2.31)** (0.29) (0.72) (-1.05) (-1.63) (-1.09) (-2.56)** KNOWENT 0.0811 0.0703 0.0075 0.0892 0.0683 0.0128 0.0175 0.0105 0.0042 (10.65)*** (10.06)*** (2.99)*** (8.88)*** (8.35)*** (3.47)*** (2.03)** (1.63) (1.10) SKILLS 0.1196 0.1045 0.0115 0.0957 0.0746 0.0141 0.0846 0.0575 0.0091 (14.91)*** (13.63)*** (4.91)*** (9.26)*** (8.59)*** (3.47)*** (8.57)*** (7.38)*** (2.30)** FEARFAIL -0.0064 -0.0100 0.0040 -0.0247 -0.0208 0.0023 -0.0253 -0.0185 -0.0036 (-0.74) (-1.24) (1.55) (-2.58)** (-2.84)*** (0.61) (-2.89)*** (-2.69)*** (-1.04) OBSERVATIONS 7673 7673 7673 3840 3840 3840 2815 2815 2582 BRAZIL CHINA INDIA TEA TEAOPP TEANEC TEA TEAOPP TEANEC TEA TEAOPP TEANEC (1) (2) (3) (4) (5) (6) (7) (8) (9) AGE 0.0094 0.0060 0.0031 -0.0094 -0.0058 -0.0015 -0.0045 0.0019 -0.0061 (2.44)** (2.19)** (1.19) (-1.31) (-1.32) (-0.27) (-0.96) (1.37) (-1.49) AGE SQUARE -0.00011 -0.00007 -0.00004 0.00012 0.00007 0.00003 0.00002 -0.00002 0.00005 (-2.45)** (-2.16)** (-1.19) (1.35) (1.37) (0.37) (0.39) (-1.32) (0.84) MALE -0.0129 -0.0020 -0.0091 -0.0268 0.0134 -0.0477 0.0106 0.0161 -0.0118 (-0.70) (-0.15) (-0.77) (-0.90) (1.15) (-1.76)* (0.43) (1.71)* (-0.64) NOT WORKING -0.0888 -0.0470 -0.0358 -0.1001 -0.0296 -0.0763 -0.0557 0.0106 -0.0623 (-3.87)*** (-2.82)*** (-2.30)** (-3.90)*** (-1.93)* (-3.77)*** (-2.08)** (0.96) (-3.00)*** STUDENTS -0.0890 -0.0559 -0.0246 -0.0712 -0.0157 -0.0642 0.0080 -0.0501 (-2.59)*** (-2.40)** (-0.98) (-1.39) (-0.58) (-2.00)** (0.37) (-2.61)*** RETIRED DISABLES -0.0784 -0.0475 -0.0259 -0.1138 -0.0347 (-4.27)*** (-3.51)*** (-2.06)** (-4.67)*** (-2.47)** HIGHSCHOOL -0.0790 -0.0416 -0.0346 -0.0217 0.0016 -0.0210 0.0982 0.0419 0.0375 (-1.77)* (-1.24) (-1.32) (-0.71) (0.13) (-0.80) (3.65)*** (3.41)*** (1.87)* COLLEGE 0.0122 0.0097 0.0005 -0.0624 0.0035 -0.0730 0.0881 0.0213 0.0610 (0.36) (0.40) (0.02) (-2.56)** (0.25) (-3.94)*** (2.91)*** (2.10)** (2.36)** KNOWENT 0.0734 0.0512 0.0192 0.0808 0.0270 0.0502 0.0108 0.0289 -0.0265 (4.40)*** (4.26)*** (1.74)* (2.87)*** (1.97)** (2.06)** (0.48) (3.23)*** (-1.69)* SKILLS 0.0911 0.0411 0.0474 0.1105 0.0697 0.0464 0.0973 0.0238 0.0583 (5.50)*** (3.36)*** (4.31)*** (3.36)*** (4.62)*** (1.60) (4.53)*** (2.90)*** (3.21)*** FEARFAIL -0.0414 -0.0414 0.0025 -0.0085 0.0004 -0.0045 -0.0470 -0.0129 -0.0282 (-2.57)** (-3.51)*** (0.24) (-0.29) (0.03) (-0.19) (-2.58)*** (-2.42)** (-1.91)* OBSERVATIONS 1854 1854 1854 1782 1782 1475 1771 1771 1771 Notes: Probit regressions including country fixed effects and a time dummy for 2001. Standard errors are clustered at the country level. Marginal effects (not coefficients) and t-stat. are shown in the tables. ***, **, * coefficients statistically significant at 1%, 5%, and 10% level, respectively. TEA = 1 if individuals are starting a new business or are owners and managers of a young firm, 0 otherwise; TEAOPP = 1 if individuals are starting a new business or are owners and managers of a young firm to take advantage of a business opportunity, 0 otherwise; TEANEC = 1 if individuals are starting a new business or are owners and managers of a young firm because they could find no better economic work, 0 otherwise. See Notes to Table 2 and Appendix I for the exact definition of the variables.
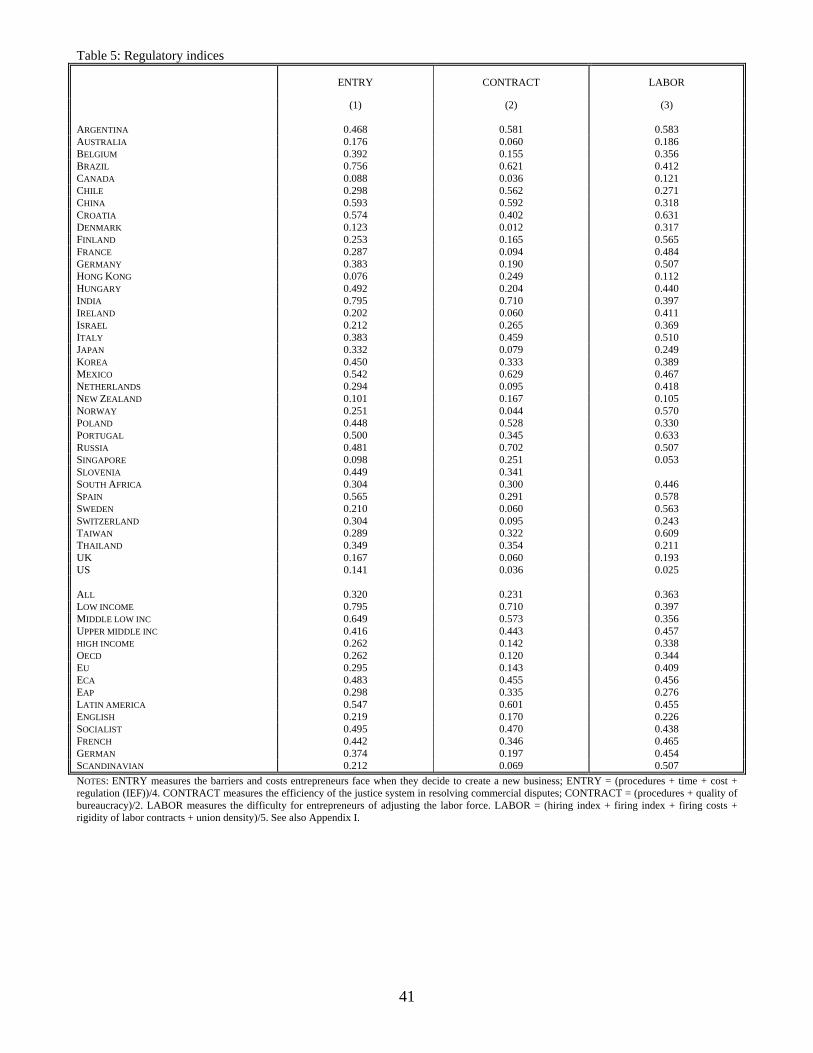
41
Table 5: Regulatory indices
ENTRY CONTRACT LABOR
(1) (2) (3) ARGENTINA 0.468 0.581 0.583 AUSTRALIA 0.176 0.060 0.186 BELGIUM 0.392 0.155 0.356 BRAZIL 0.756 0.621 0.412 CANADA 0.088 0.036 0.121 CHILE 0.298 0.562 0.271 CHINA 0.593 0.592 0.318 CROATIA 0.574 0.402 0.631 DENMARK 0.123 0.012 0.317 FINLAND 0.253 0.165 0.565 FRANCE 0.287 0.094 0.484 GERMANY 0.383 0.190 0.507 HONG KONG 0.076 0.249 0.112 HUNGARY 0.492 0.204 0.440 INDIA 0.795 0.710 0.397 IRELAND 0.202 0.060 0.411 ISRAEL 0.212 0.265 0.369 ITALY 0.383 0.459 0.510 JAPAN 0.332 0.079 0.249 KOREA 0.450 0.333 0.389 MEXICO 0.542 0.629 0.467 NETHERLANDS 0.294 0.095 0.418 NEW ZEALAND 0.101 0.167 0.105 NORWAY 0.251 0.044 0.570 POLAND 0.448 0.528 0.330 PORTUGAL 0.500 0.345 0.633 RUSSIA 0.481 0.702 0.507 SINGAPORE 0.098 0.251 0.053 SLOVENIA 0.449 0.341 SOUTH AFRICA 0.304 0.300 0.446 SPAIN 0.565 0.291 0.578 SWEDEN 0.210 0.060 0.563 SWITZERLAND 0.304 0.095 0.243 TAIWAN 0.289 0.322 0.609 THAILAND 0.349 0.354 0.211 UK 0.167 0.060 0.193 US 0.141 0.036 0.025 ALL 0.320 0.231 0.363 LOW INCOME 0.795 0.710 0.397 MIDDLE LOW INC 0.649 0.573 0.356 UPPER MIDDLE INC 0.416 0.443 0.457 HIGH INCOME 0.262 0.142 0.338 OECD 0.262 0.120 0.344 EU 0.295 0.143 0.409 ECA 0.483 0.455 0.456 EAP 0.298 0.335 0.276 LATIN AMERICA 0.547 0.601 0.455 ENGLISH 0.219 0.170 0.226 SOCIALIST 0.495 0.470 0.438 FRENCH 0.442 0.346 0.465 GERMAN 0.374 0.197 0.454 SCANDINAVIAN 0.212 0.069 0.507 NOTES: ENTRY measures the barriers and costs entrepreneurs face when they decide to create a new business; ENTRY = (procedures + time + cost + regulation (IEF))/4. CONTRACT measures the efficiency of the justice system in resolving commercial disputes; CONTRACT = (procedures + quality of bureaucracy)/2. LABOR measures the difficulty for entrepreneurs of adjusting the labor force. LABOR = (hiring index + firing index + firing costs + rigidity of labor contracts + union density)/5. See also Appendix I.

42
Table 6: Correlation among regulatory indices the components of the indices
REGULATION
ENTRY CONTRACT LABOR ENTRY 1 CONTRACT 0.75 1 LABOR 0.50 0.27 1 ENTRY REGULATION
PROCEDURES TIME COST REGUL. (IEF) PROCEDURES 1 TIME 0.70 1 COST 0.46 0.49 1 REGULATION (IEF) 0.38 0.47 0.52 1 CONTRACT ENFORCEMENT REG.
PROCEDURES QUALITY OF BUREAUCRACY
PROCEDURES 1 QUALITY OF BUREAUCRACY 0.50 1 LABOR MARKET REG.
HIRING INDEX FIRING INDEX FIRING COST RIGIDITY LABOR CONTRACTS UNION DENSITY
HIRING INDEX 1 FIRING INDEX 0.47 1 FIRING COST 0.28 0.23 1 RIGIDITY LABOR CONTRACTS 0.39 0.33 0.18 1 UNION DENSITY 0.01 0.11 -0.16 0.38 1 Notes: ENTRY measures the barriers and costs entrepreneurs face when they decide to create a new business; ENTRY = (procedures + time + cost + regulation (IEF))/4. CONTRACT measures the efficiency of the justice system in resolving commercial disputes; CONTRACT = (procedures + quality of bureaucracy)/2. LABOR measures the difficulty for entrepreneurs of adjusting the labor force. LABOR = (hiring index + firing index + firing costs + rigidity of labor contracts + union density)/5. See also Appendix I.

43
Table 7: Entrepreneurship and personal characteristics
TEA=1 TEA=0 ST. ERR. OF DIFF TEAOPP=1 TEANEC=1 ST. ERR. OF
DIFF
(1) (2) (3) (4) (5) (6) AGE 37.50 39.50 0.12** 37.07 38.24 0.24** % MALE 64.84 48.08 0.48** 66.37 60.98 1.04** % WORKING 84.75 64.83 0.49** 86.46 80.24 0.86** % STUDENTS 2.12 4.99 0.22** 2.23 1.69 0.34 % RETIRED AND DISABLED 2.01 6.96 0.26** 1.92 2.18 0.32 % NOT WORKING 11.13 23.22 0.43** 9.39 15.89 0.75** %HIGH SCHOOL 35.59 38.51 0.50** 35.43 34.75 1.12 % COLLEGE 37.39 29.76 0.48** 42.30 22.79 1.13** % LOW INCOME 24.20 28.20 0.54** 19.76 37.33 1.14** % MIDDLE INCOME 35.56 40.52 0.59** 34.79 37.78 1.31** % UPPER INCOME 40.24 31.28 0.55** 45.46 24.89 1.31** % KNOWS ENTREPR 62.67 32.38 0.45** 66.54 53.13 1.04** % HAS SKILLS 81.52 37.14 0.46** 84.59 74.22 0.84** % FEAR OF FAILURE 21.87 34.74 0.46** 19.12 29.60 0.90** Notes: Difference in mean statistically different from zero at 5% (**) / 10% (*). TEA = 1 if individuals are starting a new business or are owners and managers of a young firm, 0 otherwise; TEAOPP = 1 if individuals are starting a new business or are owners and managers of a young firm to take advantage of a business opportunity, 0 otherwise; TEANEC = 1 if individuals are starting a new business or are owners and managers of a young firm because they could find no better economic work, 0 otherwise. See Notes to Table 2 and Appendix I for the exact definition of the variables.

44
Table 8: Entrepreneurship and individual characteristics TEA TEAOPP TEANEC TEA TEAOPP TEANEC (1) (2) (3) (4) (5) (6) AGE 0.0020 0.0012 0.0006 0.0019 0.0012 0.0005 (3.20)*** (3.03)*** (2.32)** (2.38)** (2.42)** (1.39) AGE SQUARE -0.00003 -0.00002 -0.000008 -0.00003 -0.00002 -0.000006 (-4.10)*** (-3.91)*** (-2.66)*** (-3.19)*** (-3.26)*** (-1.65)* MALE 0.0112 0.0082 0.0017 0.0116 0.0082 0.0017 (5.67)*** (6.28)*** (1.97)** (5.36)*** (5.51)*** (1.50) NOT WORKING -0.0235 -0.0150 -0.0045 -0.0231 -0.0134 -0.0055 (-6.20)*** (-7.22)*** (-2.96)*** (-5.00)*** (-5.49)*** (-3.00)*** STUDENTS -0.0295 -0.0169 -0.0071 -0.0280 -0.0146 -0.0080 (-7.68)*** (-7.63)*** (-3.88)*** (-5.08)*** (-4.21)*** (-3.86)*** RETIRED DISABLES -0.0287 -0.0167 -0.0067 -0.0270 -0.0147 -0.0070 (-5.70)*** (-4.08)*** (-4.44)*** (-3.91)*** (-2.86)*** (-2.86)*** HIGHSCHOOL 0.0029 0.0062 -0.0020 0.0034 0.0058 -0.0013 (1.13) (3.42)*** (-1.69)* (1.05) (2.70)*** (-0.83) COLLEGE 0.0028 0.0102 -0.0058 0.0010 0.0071 -0.0051 (0.88) (5.83)*** (-4.34)*** (0.27) (3.38)*** (-2.62)*** KNOWENT 0.0429 0.0304 0.0056 0.0435 0.0293 0.0068 (14.63)*** (15.95)*** (5.43)*** (14.33)*** (15.70)*** (5.03)*** SKILLS 0.0848 0.0591 0.0148 0.0867 0.0604 0.0160 (29.02)*** (25.58)*** (16.14)*** (25.54)*** (24.09)*** (15.54)*** FEARFAIL -0.0200 -0.0152 -0.0012 -0.0201 -0.0147 -0.0016 (-9.19)*** (-9.07)*** (-1.64)* (-7.30)*** (-7.32)*** (-2.14)** LOWESTINC 0.0066 0.0004 0.0038 (1.71)* (0.16) (2.12)** UPPERINC 0.0069 0.0065 -0.0022 (2.01)** (2.38)** (-1.62) OBSERVATIONS 118525 118525 118525 83397 83397 83397 Notes: Probit regressions including country fixed effects and a time dummy for 2001. Standard errors are clustered at the country level. Marginal effects (not coefficients) and t-stat. are shown in the tables. ***, **, * coefficients statistically significant at 1%, 5%, and 10% level, respectively. TEA = 1 if individuals are starting a new business or are owners and managers of a young firm, 0 otherwise; TEAOPP = 1 if individuals are starting a new business or are owners and managers of a young firm to take advantage of a business opportunity, 0 otherwise; TEANEC = 1 if individuals are starting a new business or are owners and managers of a young firm because they could find no better economic work, 0 otherwise. See Notes to Table 2 and Appendix I for the exact definition of the variables.

45
Table 9: Entrepreneurship and regulation R =
ENTRY R =
ENTRY R =
ENTRY R =
CONTRACT R =
CONTRACT R =
CONTRACT R =
LABOR R =
LABOR R =
LABOR TEA TEAOPP TEANEC TEA TEAOPP TEANEC TEA TEAOPP TEANEC (1) (2) (3) (4) (5) (6) (7) (8) (9) AGE 0.0022 0.0013 0.0007 0.0021 0.0012 0.0007 0.0025 0.0015 0.0007 (3.78)*** (3.37)*** (3.64)*** (3.39)*** (2.96)*** (3.48)*** (3.64)*** (3.54)*** (2.77)*** AGE SQUARE -0.00003 -0.00002 -0.000008 -0.00003 -0.00002 -0.000009 -0.00003 -0.00002 -0.000008 (-4.11)*** (-3.95)*** (-3.05)*** (-4.11)*** (-3.82)*** (-3.25)*** (-4.24)*** (-4.15)*** (-2.6)*** MALE 0.0164 0.0076 0.0056 0.0141 0.0076 0.0046 0.0125 0.0066 0.0038 (4.31)*** (2.77)*** (3.92)*** (5.44)*** (3.94)*** (4.30)*** (3.01)*** (2.46)** (2.35)** NOT WORKING -0.0058 -0.0091 0.0043 -0.0125 -0.0107 0.0007 -0.0100 -0.0068 -0.0015 (-0.78) (-1.72)* (1.41) (-2.44)** (-3.41)*** (0.29) (-1.17) (-1.73)* (-0.31) STUDENTS -0.0148 -0.0112 0.0009 -0.0218 -0.0145 -0.0034 -0.0201 -0.0155 0.0055 (-1.60) (-1.86)* (0.15) (-3.79)*** (-3.98)*** (-1.07) (-1.51) (-2.14)** (0.96) RET. DIS. -0.0259 -0.0153 -0.0059 -0.0240 -0.0144 -0.0051 -0.0285 -0.0162 -0.0067 (-2.74)*** (-1.95)* (-2.48)** (-3.53)*** (-2.77)*** (-2.31)** (-2.48)** (-1.91)* (-2.7)*** HIGHSCHOOL -0.0036 0.0024 -0.0056 0.0016 0.0037 -0.0033 -0.0002 0.0053 -0.0038 (-0.48) (0.49) (-2.52)** (0.38) (1.17) (-2.07)** (-0.03) (1.16) (-2.6)*** COLLEGE 0.0011 0.0072 -0.0084 0.0038 0.0082 -0.0067 0.0034 0.0103 -0.0074 (0.14) (1.61) (-3.43)*** (0.84) (2.68)*** (-4.19)*** (0.61) (2.54)** (-5.7)*** KNOWENT 0.0601 0.0399 0.0082 0.0537 0.0356 0.0088 0.0616 0.0426 0.0082 (12.73)*** (11.09)*** (4.32)*** (15.99)*** (14.43)*** (6.59)*** (12.34)*** (12.01)*** (5.11)*** SKILLS 0.0972 0.0701 0.0144 0.0938 0.0672 0.0145 0.0864 0.0609 0.0130 (24.95)*** (21.95)*** (11.52)*** (27.58)*** (24.19)*** (12.45)*** (15.83)*** (19.49)*** (7.24)*** FEARFAIL -0.0151 -0.0117 0.0021 -0.0170 -0.0137 0.0017 -0.0104 -0.0090 0.0030 (-3.83)*** (-3.94)*** (1.55) (-5.13)*** (-5.36)*** (1.85)* (-3.04)*** (-3.53)*** (2.64)*** R*AGE -0.0009 -0.0005 -0.0003 -0.0005 -0.0001 -0.0002 -0.0013 -0.0009 -0.0002 (-1.22) (-0.88) (-0.85) (-1.00) (-0.56) (-1.01) (-1.46) (-1.46) (-1.22) R*MALE -0.0184 0.0016 -0.0114 -0.0153 0.0018 -0.0104 -0.0043 0.0044 -0.0058 (-1.75)* (0.21) (-2.85)*** (-1.78)* (0.29) (-3.04)*** (-0.44) (0.62) (-1.74)* R*NOT WORK. -0.0639 -0.0237 -0.0245 -0.0519 -0.0227 -0.0186 -0.0466 -0.0299 -0.0095 (-3.07)*** (-1.45) (-3.47)*** (-3.35)*** (-1.94)* (-2.98)*** (-2.26)** (-2.68)*** (-0.87) R*STUDENTS -0.0801 -0.0342 -0.0332 -0.0553 -0.0194 -0.0217 -0.0519 -0.0100 -0.0434 (-2.73)*** (-1.57) (-2.49)** (-2.90)*** (-1.34) (-2.48)** (-1.14) (-0.37) (-3.4)*** R* RET. DIS -0.0166 -0.0095 -0.0039 -0.0386 -0.0213 -0.0100 0.0006 -0.0010 0.0012 (-0.61) (-0.44) (-0.51) (-2.08)** (-1.81)* (-1.13) (0.02) (-0.04) (0.11) R*HIGHSCHOOL 0.0205 0.0114 0.0104 0.0070 0.0104 0.0045 0.0076 0.0019 0.0047 (0.82) (0.71) (1.64)* (0.34) (0.84) (0.82) (0.59) (0.17) (1.22) R*COLLEGE 0.0034 0.0080 0.0095 -0.0048 0.0071 0.0039 -0.0036 -0.0012 0.0054 (0.13) (0.65) (1.01) (-0.24) (0.75) (0.53) (-0.27) (-0.13) (1.35) R*KNOWENT -0.0421 -0.0228 -0.0061 -0.0373 -0.0184 -0.0092 -0.0406 -0.0258 -0.0059 (-3.85)*** (-2.78)*** (-1.27) (-4.09)*** (-2.78)*** (-2.42)** (-3.41)*** (-3.60)*** (-1.24) R*SKILLS -0.0273 -0.0227 0.0004 -0.0270 -0.0235 0.0003 -0.0027 -0.0032 0.0032 (-2.68)*** (-2.35)** (0.15) (-2.54)** (-2.58)*** (0.12) (-0.21) (-0.37) (0.87) R*FEARFAIL -0.0170 -0.0130 -0.0089 -0.0125 -0.0066 -0.0095 -0.0306 -0.0205 -0.0110 (-1.45) (-1.42) (-2.55)** (-1.26) (-0.86) (-3.90)*** (-3.08)*** (-2.57)** (-4.1)*** OBSERVATIONS 118525 118525 118525 118525 118525 118525 116978 116978 116978 Notes: Probit regressions including country fixed effects and a time dummy for 2001. Standard errors are clustered at the country level. Marginal effects (not coefficients) and t-stat. are shown in the tables. ***, **, * coefficients statistically significant at 1%, 5%, and 10% level, respectively. TEA = 1 if individuals are starting a new business or are owners and managers of a young firm, 0 otherwise; TEAOPP = 1 if individuals are starting a new business or are owners and managers of a young firm to take advantage of a business opportunity, 0 otherwise; TEANEC = 1 if individuals are starting a new business or are owners and managers of a young firm because they could find no better economic work, 0 otherwise; ENTRY measures the barriers and costs entrepreneurs face when they decide to create a new business; ENTRY = (procedures + time + cost + regulation (IEF))/4. CONTRACT measures the efficiency of the justice system in resolving commercial disputes; CONTRACT = (procedures + quality of bureaucracy)/2. LABOR measures the difficulty for entrepreneurs of adjusting the labor force. LABOR = (hiring index + firing index + firing costs + rigidity of labor contracts + union density)/5. See Notes to Table 2 and Appendix I for the exact definition of the variables.

46
Table 10: Entrepreneurship and regulation – Instrumental variables estimation (weighted data) R =
ENTRY R =
ENTRY R =
ENTRY R =
CONTRACT R =
CONTRACT R =
CONTRACT R =
LABOR R =
LABOR R =
LABOR TEA TEAOPP TEANEC TEA TEAOPP TEANEC TEA TEAOPP TEANEC (1) (2) (3) (4) (5) (6) (7) (8) (9) AGE 0.0020 0.0014 0.0004 0.0019 0.0012 0.0006 0.0022 0.0016 0.0004 (2.20)** (2.39)** (0.80) (1.91)* (1.94)* (1.08) (2.47)** (2.79)*** (0.88) AGE SQUARE -0.0000 -0.0000 -0.0000 -0.0000 -0.0000 -0.0000 -0.0000 -0.0000 -0.0000 (2.64)** (2.88)*** (1.62) (2.69)** (2.82)*** (1.70)* (3.10)*** (3.37)*** (1.91)* MALE 0.0254 0.0158 0.0079 0.0207 0.0127 0.0074 0.0241 0.0145 0.0064 (4.03)*** (3.19)*** (2.04)** (3.94)*** (2.93)*** (2.32)** (3.53)*** (2.60)** (2.16)** NOT WORKING -0.0071 -0.0098 0.0038 -0.0149 -0.0106 -0.0029 -0.0165 -0.0134 -0.0014 (0.51) (1.15) (0.45) (1.22) (1.53) (0.38) (1.03) (1.40) (0.15) STUDENTS -0.0212 -0.0187 -0.0006 -0.0291 -0.0233 -0.0034 -0.0286 -0.0231 -0.0027 (1.64) (1.81)* (0.07) (2.40)** (2.48)** (0.51) (1.44) (1.73)* (0.19) RET. DIS -0.0318 -0.0288 0.0037 -0.0322 -0.0265 0.0003 -0.0373 -0.0316 0.0001 (1.81)* (1.85)* (0.71) (2.17)** (1.91)* (0.09) (1.76)* (1.67) (0.02) HIGHSCHOOL 0.0153 0.0177 -0.0022 0.0110 0.0114 0.0001 0.0063 0.0153 -0.0089 (1.21) (2.26)** (0.26) (1.35) (1.93)* (0.01) (0.52) (1.96)* (0.91) COLLEGE 0.0134 0.0148 -0.0027 0.0098 0.0115 -0.0023 0.0054 0.0169 -0.0144 (0.96) (1.90)* (0.27) (1.10) (2.04)** (0.33) (0.39) (2.22)** (1.43) KNOWENT 0.0915 0.0838 0.0009 0.0764 0.0680 0.0034 0.1074 0.0948 0.0052 (7.84)*** (7.82)*** (0.18) (7.48)*** (7.37)*** (0.89) (10.81)*** (11.42)*** (1.06) SKILLS 0.1029 0.0865 0.0099 0.1042 0.0871 0.0109 0.1039 0.0779 0.0207 (5.90)*** (5.94)*** (1.44) (7.70)*** (7.46)*** (2.57)** (5.19)*** (4.93)*** (2.10)** FEARFAIL -0.0191 -0.0236 0.0061 -0.0205 -0.0241 0.0049 -0.0220 -0.0220 0.0022 (2.78)*** (3.95)*** (2.98)*** (3.82)*** (5.15)*** (2.89)*** (3.07)*** (3.72)*** (0.74) R*AGE -0.0009 -0.0010 0.0007 -0.0004 -0.0003 0.0006 -0.0008 -0.0009 0.0007 (0.66) (0.89) (1.08) (0.34) (0.38) (0.95) (0.58) (0.87) (0.98) R*MALE -0.0373 -0.0132 -0.0187 -0.0321 -0.0056 -0.0242 -0.0272 -0.0070 -0.0115 (1.80)* (0.87) (1.27) (1.35) (0.33) (1.36) (1.50) (0.46) (1.32) R*NOT WORK. -0.0760 -0.0326 -0.0409 -0.0727 -0.0417 -0.0285 -0.0402 -0.0178 -0.0221 (1.60) (1.25) (1.37) (1.59) (1.74)* (0.86) (0.83) (0.66) (0.86) R*STUDENTS -0.0970 -0.0525 -0.0409 -0.0930 -0.0510 -0.0390 -0.0647 -0.0332 -0.0304 (1.96)* (1.60) (1.41) (1.81)* (1.46) (1.31) (1.02) (0.85) (0.73) R* RET. DIS -0.0121 0.0250 -0.0492 -0.0158 0.0224 -0.0515 0.0078 0.0342 -0.0341 (0.25) (0.63) (2.41)** (0.33) (0.54) (2.70)** (0.14) (0.76) (1.56) R*HIGHSCHOOL -0.0427 -0.0405 -0.0036 -0.0420 -0.0304 -0.0150 -0.0124 -0.0282 0.0152 (1.29) (1.93)* (0.15) (1.42) (1.50) (0.73) (0.46) (1.53) (0.73) R*COLLEGE -0.0390 -0.0076 -0.0264 -0.0373 0.0042 -0.0385 -0.0120 -0.0137 0.0110 (0.94) (0.31) (0.84) (0.97) (0.17) (1.32) (0.37) (0.68) (0.48) R*KNOWENT -0.1004 -0.1116 0.0251 -0.0735 -0.0865 0.0247 -0.1292 -0.1255 0.0098 (3.01)*** (3.69)*** (1.75)* (1.86)* (2.54)** (1.72)* (5.13)*** (6.04)*** (0.78) R*SKILLS -0.0112 -0.0401 0.0344 -0.0215 -0.0600 0.0454 -0.0121 -0.0096 -0.0011 (0.24) (1.07) (1.64) (0.43) (1.44) (2.40)** (0.26) (0.26) (0.05) R*FEARFAIL -0.0325 -0.0052 -0.0269 -0.0381 -0.0027 -0.0340 -0.0215 -0.0102 -0.0124 (1.49) (0.30) (3.32)*** (1.52) (0.13) (4.26)*** (1.14) (0.68) (1.51) OBSERVATIONS 118525 118525 118525 118525 118525 118525 116978 116978 116978 Notes: IV regressions including country fixed effects and a time dummy for 2001. Standard errors are clustered at the country level. Instruments for the regulatory variable R are dummy variables measuring English (common law), French (civil law), Socialist, German and Scandinavian legal origin. Coefficients and t-stat. are shown in the tables. ***, **, * coefficients statistically significant at 1%, 5%, and 10% level, respectively. TEA = 1 if individuals are starting a new business or are owners and managers of a young firm, 0 otherwise; TEAOPP = 1 if individuals are starting a new business or are owners and managers of a young firm to take advantage of a business opportunity, 0 otherwise; TEANEC = 1 if individuals are starting a new business or are owners and managers of a young firm because they could find no better economic work, 0 otherwise. See Notes to Table 2 and Appendix I for the exact definition of the variables.

47
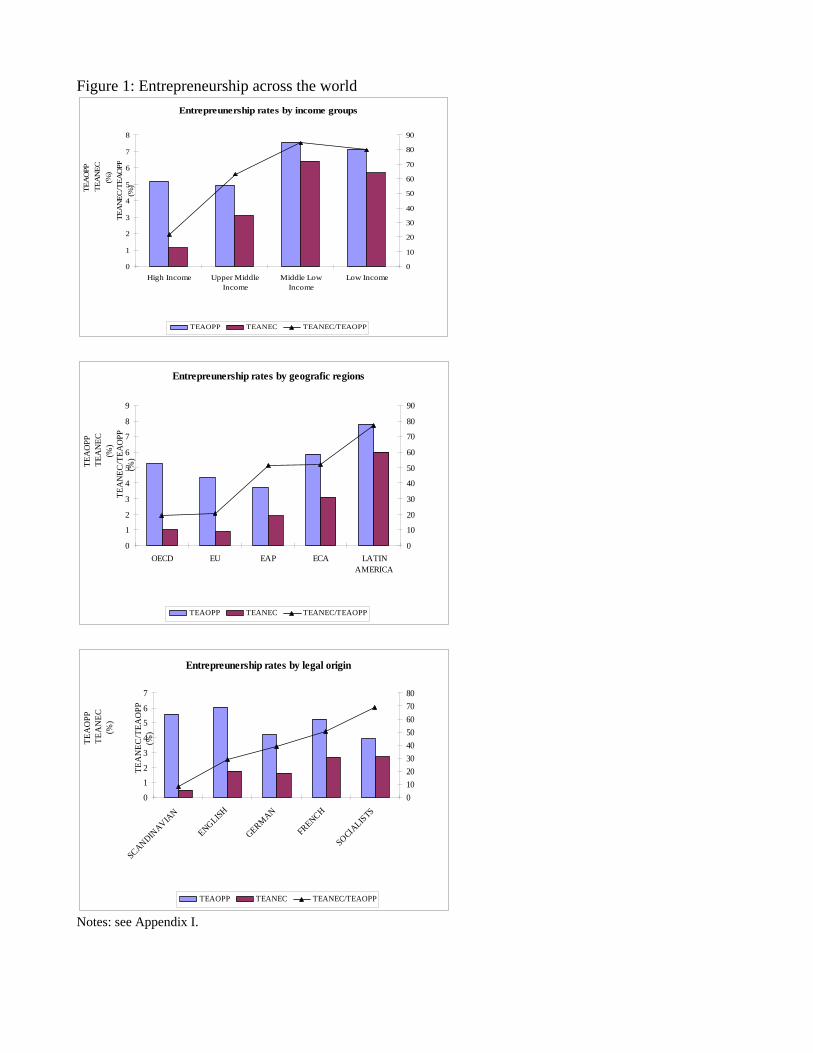
Figure 1: Entrepreneurship across the world Entrepreunership rates by income groups
0
1
2
3
4
5
6
7
8
High Income Upper MiddleIncome
Middle LowIncome
Low Income
TEA
OPP
TEA
NEC
(%)
0
10
20
30
40
50
60
70
80
90
TEA
NEC
/TEA
OPP
(%)
TEAOPP TEANEC TEANEC/TEAOPP
Entrepreunership rates by geografic regions
0
1
2
3
4
5
6
7
8
9
OECD EU EAP ECA LATINAMERICA
TEA
OPP
TEA
NEC
(%)
0
10
20
30
40
50
60
70
80
90
TEA
NEC
/TEA
OPP
(%)
TEAOPP TEANEC TEANEC/TEAOPP
Entrepreunership rates by legal origin
0
12
3
4
56
7
SCANDINAVIA
N
ENGLISH
GERMAN
FRENCH
SOCIALISTS
TEA
OPP
TEA
NEC
(%)
01020304050607080
TEA
NEC
/TEA
OPP
(%)
TEAOPP TEANEC TEANEC/TEAOPP
Notes: see Appendix I.
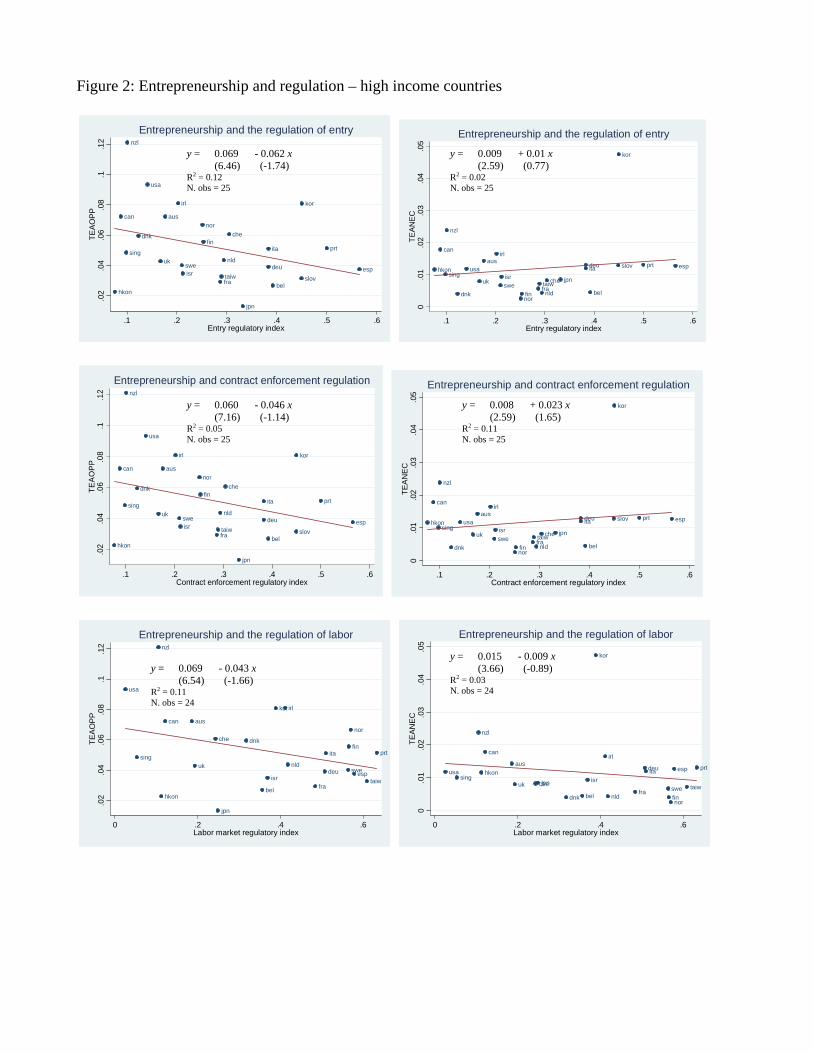
Figure 2: Entrepreneurship and regulation – high income countries
usa
nld
belfra
esp
ita
che
uk
dnk
swe
nor
deu
aus
nzl
sing
jpn
kor
can
prt
irl
fin
slov
hkon
taiwisr
.02
.04
.06
.08
.1.1
2TE
AOPP
.1 .2 .3 .4 .5 .6Entry regulatory index
Entrepreneurship and the regulation of entry
usa
nld belfra
espita
cheuk
dnkswe
nor
deuaus
nzl
singjpn
kor
can
prt
irl
fin
slovhkon
taiwisr
0.0
1.0
2.0
3.0
4.0
5TE
AN
EC
.1 .2 .3 .4 .5 .6Entry regulatory index
Entrepreneurship and the regulation of entry
usa
nld
belfra
esp
ita
che
uk
dnk
swe
nor
deu
aus
nzl
sing
jpn
kor
can
prt
irl
fin
slov
hkon
taiwisr
.02
.04
.06
.08
.1.1
2TE
AO
PP
.1 .2 .3 .4 .5 .6Contract enforcement regulatory index
Entrepreneurship and contract enforcement regulation
usa
nld belfra
espita
cheuk
dnkswe
nor
deuaus
nzl
singjpn
kor
can
prt
irl
fin
slovhkon
taiwisr
0.0
1.0
2.0
3.0
4.0
5TE
AN
EC
.1 .2 .3 .4 .5 .6Contract enforcement regulatory index
Entrepreneurship and contract enforcement regulation
usa
nld
bel fra
esp
ita
che
uk
dnk
swe
nor
deu
aus
nzl
sing
jpn
kor
can
prt
irl
fin
hkon
taiwisr
.02
.04
.06
.08
.1.1
2TE
AO
PP
0 .2 .4 .6Labor market regulatory index
Entrepreneurship and the regulation of labor
usa
nldbel fra
espita
cheuk
dnkswe
nor
deuaus
nzl
singjpn
kor
can
prt
irl
fin
hkon
taiwisr
0.0
1.0
2.0
3.0
4.0
5TE
ANE
C
0 .2 .4 .6Labor market regulatory index
Entrepreneurship and the regulation of labor
y = 0.069 - 0.062 x (6.46) (-1.74) R2 = 0.12 N. obs = 25
y = 0.060 - 0.046 x (7.16) (-1.14) R2 = 0.05 N. obs = 25
y = 0.069 - 0.043 x (6.54) (-1.66) R2 = 0.11 N. obs = 24
y = 0.015 - 0.009 x (3.66) (-0.89) R2 = 0.03 N. obs = 24
y = 0.008 + 0.023 x (2.59) (1.65) R2 = 0.11 N. obs = 25
y = 0.009 + 0.01 x (2.59) (0.77) R2 = 0.02 N. obs = 25

Figure 3: Entrepreneurship and regulation – middle and low income countries
rus
safr
hung
pol
mex
arg
braz
chl
tha
chin
ind
croa
0.0
5.1
.15
TEA
OP
P
.3 .4 .5 .6 .7 .8Entry regulatory index
Entrepreneurship and the regulation of entry
rus
safrhungpol
mexarg
brazchl
tha
chin
ind
croa
0.0
2.0
4.0
6.0
8TE
ANEC
.3 .4 .5 .6 .7 .8Entry regulatory index
Entrepreneurship and the regulation of entry
rus
safr
hung
pol
mex
arg
braz
chl
tha
chin
ind
croa
0.0
5.1
.15
TEA
OP
P
.3 .4 .5 .6 .7 .8Contract enforcement regulatory index
Entrepreneurship and contract enforcement regulation
rus
safrhungpol
mexarg
brazchl
tha
chin
ind
croa
0.0
2.0
4.0
6.0
8TE
ANE
C
.3 .4 .5 .6 .7 .8Contract enforcement regulatory index
Entrepreneurship and contract enforcement regulation
rus
safr
hung
pol
mex
arg
braz
chl
tha
chin
ind
croa
0.0
5.1
.15
TEA
OP
P
.2 .3 .4 .5 .6Labor market regulatory index
Entrepreneurship and the regulation of labor
rus
safrhungpol
mexarg
brazchl
tha
chin
ind
croa
0.0
2.0
4.0
6.0
8TE
ANE
C
.2 .3 .4 .5 .6Labor market regulatory index
Entrepreneurship and the regulation of labor
y = 0.068 - 0.01x (1.79) (-0.14) R2 = 0.01 N. obs = 12
y = 0.078 - 0.031x (2.05) (-0.42) R2 = 0.02 N. obs = 12
y = 0.017 + 0.05x (0.71) (1.05) R2 = 0.10 N. obs = 12
y = 0.009 + 0.063x (0.39) (1.51) R2 = 0.19 N. obs = 12
y = 0.138 - 0.179x (4.30) (-2.43) R2 = 0.37 N. obs = 12
y = 0.074 - 0.077x (3.02) (-1.37) R2 = 0.16 N. obs = 12