explanation and exploration visualizing the topology of web information systems
TRANSCRIPT

Int. J. Human-Computer Studies (2001) 55, 239}258doi:10.1006/ijhc.2001.0491Available online at http://www.idealibrary.com on
Explanation and explorationVisualizing the topology of web information systems
ARNO SCHARL
School of Electronic Commerce, University of Notre Dame Australia,GPO Box 1225, Fremantle, WA 6959, Australia.emails: scharl@web¸yzard.com; [email protected]
(Received 10 January 2000, accepted in revised form 3 May 2001)
Innovation substantially reduces the practical value of traditional communication mod-els. This paper examines the role of conceptual, user-centric modelling of web informa-tion systems as a primary means of standardized visual communication between andwithin organizations. It presents the development and potential of the extended WorldWide Web Design Technique as a visual, consistent, and semantically rich language toshare knowledge about content and structure of both planned and deployed systems(&&Explanation''). As web information systems represent semantic networks in themselves,it is only natural to leverage their semantics to provide analytical tools and intuitive userinterfaces. Visual frameworks based on the extended World Wide Web Design Techniqueenable interactive visualization of the users' access patterns. Limited, statisticallyoriented representations of commercially available web-tracking software are enhancedby a map-like view based on the system's unique topology. When integrated into the userinterface via multiple, tightly coupled views, such automatically generated site maps helpusers to explore the available navigation space (&&Exploration'').
( 2001 Academic Press
KEYWORDS: information visualization; hypertext; web development; navigational design; datamodeling; clickstream analysis; interface representation.
1. Introduction
Representing a sub-category of perceptualization, visualization is an advanced form ofhigh-bandwidth communication that transcends domain-speci"c and technologicalboundaries (De Fanti, Brown & McCormick 1989). It can be de"ned as the mappingfrom some base data set into a representation suitable for visual analysis and commun-ication with the user (Chi, Pitkow, Mackinlay, Pirolli, Gossweiler & Card, 1998).Historically, the progress of human civilization is closely linked to the production andconsumption of visual artefacts such as writing, mathematics, maps, printing, diagrams,and visual computing (Card, Mackinlay & Shneiderman, 1999). Originally, the power ofvisualization techniques was applied to science and physical spaces in rather diversedisciplines such as molecular modelling, medical imaging, mathematics, meteorology,astrophysics, #uid dynamics and so forth (scienti,c visualization). These disciplinesgenerate data that are inherently graphical in nature, characterized by implicit spatial
1071-5819/01/090239#20 $35.00/0 ( 2001 Academic Press

240 ARNO SCHARL
relationships (Leung and Apperley, 1994). More general approaches that do not necessar-ily rely on physical properties to provide an organizing structure are referred to asinformation visualization (Robertson, Mackinlay & Card, 1991). Information visualizationmaps non-spatial abstractions from diverse areas such as business, education or informa-tion technology.
Concerning information technology, web information systems (WIS) are receivingincreased attention, and represent the main focus of this paper. They contain organizedcollections of functionally heterogeneous documents that are publicly available via theWorld Wide Web. WIS by de"nition are meant for a wider user base than traditionalapplications, whether within an organization (Intranet), across a number of organiza-tions (Extranet) or globally over the Internet. Not surprisingly, the changed environmentleads to a number of concerns about the quality and reliability of such applications(Deshpande, Hansen & Murugesan, 1999) and necessitates modi"cations of the underly-ing communication model. Section 2 summarizes how conceptual modelling languagessupport this process.
Innovations in information technologies and, more speci"cally, in the World WideWeb have begun to make the barriers between di!erent forms of communication morepermeable by functionally melding elements of mass, organizational, and interpersonalcommunication (Rogers, 1995; O'Sullivan, 1999). Mass-media channels are essential todisseminate initial information about an innovation. Organizational channels and theirsubstantial economic value ensure a continuous supply of resources for establishing thebasic infrastructure. Most importantly, personal channels are essential to ensure thelong-term acceptance of an innovation. Web applications provide the unique advantageof simultaneously supporting all three types of channels.
The current state of designing such systems from a methodological perspective issummarized in Section 3, and it is followed by a detailed description of the extended WorldWide Web Design Technique (eW3DT) and the object types it comprises. In Section 4,eW3DT is applied to visualize the millions of potential routes that users of complex WIStake.=ebMapper, a prototypical, platform-independent Java implementation of eW3DTdirectly maps these routes onto the system's hypertext topology. It enhances the limited,statistically oriented representations of commercially available web-tracking software witha map-like view similar to customer tracking in traditional retailing outlets.
2. Improving inter- and intraorganizational communication
The ability to successfully assimilate and exploit advanced WIS technologies requiresa set of both technical and managerial skills. As many employees lack hybrid competen-cies and specialize in one of these areas, they often fail to understand each other'sobjectives and processes (Jutla, Bodorik, Hajnal & Davis, 1999). For this reason, eW3DThas been developed as an alternative to technical modelling languages of little descriptivepower. Many researchers in web development and visualization have recognized the splitbetween explanatory (e.g. documenting information system; see Section 3.1) and explora-tory goals such as providing e$cient user interfaces (see Section 4.3; Munzner, 1998).eW3DT proves equally relevant for both types of goals. It represents a context-providingelectronic design space as de"ned by Rheinfrank et al., a conceptual meeting ground fordistributing and sharing knowledge (Rheinfrank, Evenson & Wul!, 1994).

FIGURE 1. Content production, web site management, and interface design with eW3DT.
VISUALIZING THE TOPOLOGY OF WEB INFORMATION SYSTEMS 241
In this way, eW3DT supports the central activities associated with bringing inno-vative web applications to life. Focusing on consumer-to-business transactions, thedocument-oriented modelling framework is intended to remove communication barriersbetween academic research, information systems departments, and the management asdepicted in Figure 1.
eW3DT represents a possible answer to the limitation of human information process-ing in short-term memory, which requires diagrams to be kept simple, multiple displaysto be consolidated, and motion frequency to be reduced (Bucy, Lang, Shneiderman,1997b; Potter & Grabe, 1999). To serve as an e$cient interface to users with heterogen-eous knowledge and expectations, visual representations of hypertext architecturesintended for the general public have to include the essential information in an illustrativeand comprehensible way. Optimally, the same visual language should be used for contentproduction, web site management, and interface design. In this way, the required trainingtime allotted for codes, mnemonics, and sequences of actions can be reduced (Shneider-man, 1997b; Bucy et al., 1999).
One of the main challenges of modelling and developing hypertext applications derivesfrom the strong interdependency between presentation (user interface) and representa-tion (explicit structuring) of published information. Many meta-models and designmethodologies for WIS lack the necessary object types for modelling this interdepen-dency and are only suited for highly structured segments. But hypertext is more, not less,hierarchical than most paper-based texts, and enables advanced users to easily move upand down the hierarchy (Aarseth, 1998). A hierarchical description format, therefore, isone of the prerequisites for analysing WIS and for the formulation of conceptual designguidelines. By providing an agreed semantics for the conceptual data and navigationalmodel, hierarchical modelling languages such as eW3DT reduce the communication gapbetween domain experts and system professionals (Hemingway, 1999). They serve as aninterpretative guideline for people with heterogeneous technical expertise andprofessional responsibilities. WIS modelling with eW3DT facilitates the exchange and

242 ARNO SCHARL
dissemination of information in two ways.
f WIS designers have to envision new concepts and embody those concepts as textual orvisual artefacts. As the concepts become increasingly de"ned, more formal descriptionformats are required (Rheinfrank et al., 1994). &&One of the major issues facing designersof communication systems concerns helping one person or group understand othersand create and maintain common ground'' (Gay & Lentini, 1995). The eW3DT meta-model provides such a common ground. It serves as a common symbolic language thatis clearly understandable for the management and easy to handle for technical expertsand authors of WIS models.
f More than any other form of text, hypertext is &&irreducibly plural, suggested in itsetymology (from the Latin texere, &&to weave&&), which points to its entwined (textile), orcombinatory state, the interlacing of its materials'' (Sutherland, 1997, p. 4). Visualmodelling languages support this plurality and the cooperation between academicinstitutions, business partners and departments within a company.
3. Developing web information systems
Being familiar and generally trusted, the generic term engineering is frequently andoptimistically used to signify an orderly development in a new "eld (e.g. softwareengineering, knowledge engineering or document engineering). In the context of theWorld Wide Web, it denotes a systematic application of scienti"c knowledge to develop-ment, deployment, operation, and maintenance of complex WIS (Deshpande et al., 1999;IEEE, 1999; Murugesan, Deshpande, Hansen & Ginige, 1999). In line with this de"ni-tion, this section describes and compares methods and tools for WIS analysis and design.Guiding innovative design on a conceptual or technical level is far from being a straight-forward task. On the contrary, it includes attempts to create novel technologicalsolutions &&based on an analytical perspective with a speci"c orientation towards theexisting detail of practical action'' (Button & Dourish, 1996).
Popular approaches focusing on the World Wide Web include the widely acceptedRelationship Management Methodology (RMM), the=eb Site Design Method (=SDM),the Object-Oriented Hypermedia Design Model (OOHDM), Araneus- and ¸ife=eb(Balasubramanian, Ma & Yoo, 1995; Isakowitz, Stohr & Balasubramanian, 1995;Schwabe & Rossi 1995; Schwabe, Rossi & Barbosa, 1996; De Troyer & Leune, 1998;Gnaho & Larcher, 1999; Mecca, Merialdo, Atzeni & Crescenzi, 1999; Nguyen& Schmidt, 1999; Sommer & Zoller, 1999). These approaches are especially suited forhighly structured, database-driven information domains. In most cases, they succeedtraditional hypermedia design techniques such as the Hypertext Design Model (HDM,HDM2), which themselves are under constant development (Garzotto, Paolini& Schwabe, 1993; Garzotto, Mainetti & Paolini, 1995, 1996). Semantic data modelsbased on either entity relations or object-oriented approaches are extended by additionalcomponents for hypertext structure, navigation and presentation. Additionally, thesemethodologies usually specify a number of design steps for clustering entities and
-http://www.dia.uniroma3.it/Araneus/

FIGURE 2. Standard symbolic elements.
VISUALIZING THE TOPOLOGY OF WEB INFORMATION SYSTEMS 243
attributes, developing consistent navigational structures, and de"ning layout features ofthe user interface (Sommer & Zoller, 1999).
Due to the limitations found in many existing design concepts, Bichler and Nusserdeveloped the =orld =ide =eb Design ¹echnique (=3D¹) together with a workingprototype called =ebDesigner,- which supports the graphical, interactive design ofcomplex WIS from a user's perspective (Bichler & Nusser, 1996). Comparable academicor commercial modeling tools such as the =ebArchitect (Schwabe & Rossi, 1995),?Schema¹ext,A or MS FrontPage,E to name a few, provide similar &&authoring-in-the-large'' (Freisler & Kesseler, 1997) functionalities, but lack the semantic richness of(e)W3DT. Most available products, however, do not address responsibilities for contentproduction, system implementation, or regular maintenance. In contrast to the database-oriented concepts mentioned above, W3DT was built from scratch to support therequirements of unstructured, hierarchical WIS and to visualize them from a recipient'sperspective. Utilizing practical experiences in developing WIS, the graphical notation ofthe design tool was further re"ned and used to analyse a number of deployed applica-tions. With special regard to reference modelling of commercial WIS, the Extended=orld=ide=eb Design ¹echnique (eW3DT) was developed (Scharl, 1997, 1999). As far asdatabase-centric hypermedia applications are concerned, however, there is no adequatesubstitute for entity-relationship or object-oriented approaches. In this sense, eW3DT isnot intended to replace modelling techniques like RMM, but to act as a complementary,visual and hierarchically structured communication tool between researchers, systemanalysts, and the management responsible for the decision to implement WIS.
3.1. EXTENDED WORLD WIDE WEB DESIGN TECHNIQUE
The availability of distinct document object types makes it easier for content-providers totalk about their work in terms that developers can understand. Developers can use eW3DTobjects to rapidly and cost-e!ectively generate and visualize ideas for further evaluation.Diagrams relying on eW3DT are a user-centric combination of structural and processdiagrams (Lohse, Biolsi, Walker & Rueter, 1994), which requires an explicit explanation ofsymbols. This explanation (" notation) will be presented in the following paragraphs.
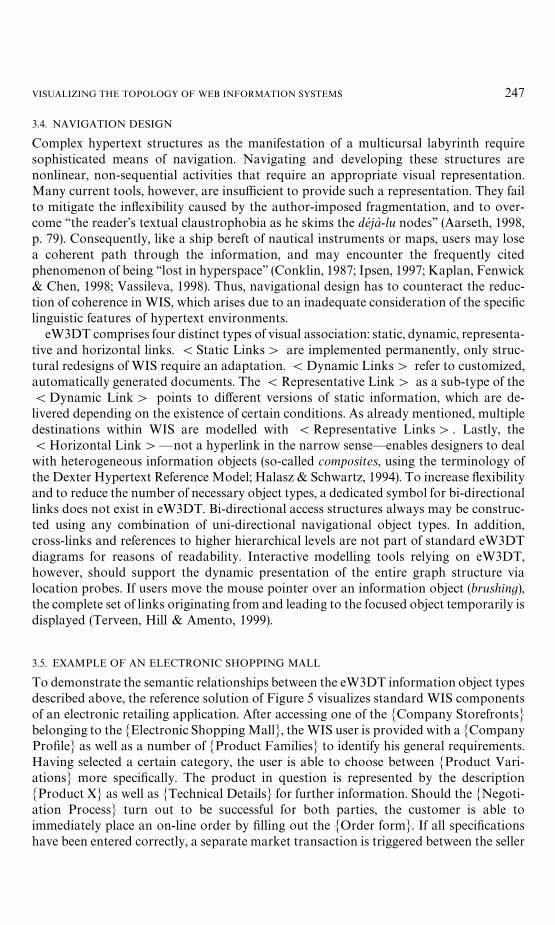
Every eW3DT data object type represents a special variation of a standard symbolicelement depicted in Figure 2, and is equivalent to an atomistic unit of the Dexter
-http://wwwi/w3dt/?http://www.nttlabs.com/&kt/WebArchitect/Ahttp://www.schema.de/Chapter/SchemaText.htmEhttp://www.microsoft.com/frontpage/

244 ARNO SCHARL
Hypertext Reference Model (Halasz & Schwartz, 1994). Together with an (optional)di!erentiation by colour, the sub-symbol (S) on the right-hand side of the object namesignals the type of the information object. The hierarchical level where the documentusually can be found is speci"ed in the bottom left "eld (x). The second digit (y) describesoptional sub-components. An interaction that is implemented as part of the homepage,for example, would receive the value 1.1. The hierarchical structure of most WISresembles a directed acyclic graph (i.e., a tree with additional cross-references betweensome of its nodes; Mladenic, 1998), which may pose some di$cult visualization prob-lems. Card et al., for example, suggest &¬ to try it at all, but rather to transform thegeneralized graph into a tree and mark it in some way to indicate discrepancies'' (Cardet al., 1999, p. 189). Breadth-"rst traversal of the graph is an e$cient way to convert itinto a tree. When several paths lead to a certain node, the shortest one is chosen todetermine (x). The means for marking the &&discrepancies'' (additional cross-references)are introduced in Section 3.3.
eW3DT distinguishes between technical and content-speci"c responsibilities for de-signing, implementing and maintaining WIS. Two abbreviations next to the hierarchicallevel refer to functional units responsible for content (CT) and technical implementation(TI). In the bottom right "eld, one to three &&q''-symbols represent the maintenanceintensity of information objects. Initial e!orts to implement documents are not con-sidered. In the following discussion, the data object types will be referred to as informa-tion object types, the objects themselves as information objects or documents. Tovisualize this distinction, the names of information object types are marked with(2', those of information objects with M2N.
Independent of iconic similarity and real equivalence to a given object (hypertextcompound document), every information object type de"nes a general pro"le for describ-ing the characteristic attributes of this object. Each of these pro"les corresponds to a setof abstractions commonly found in WIS. The attributes assign information on structuralposition, maintenance intensity, and organizational integration to the modelling con-structs. Figure 3 categorizes the object types of eW3DT into the three functionalsegments information, navigation and structure. With the help of these elements, which aredescribed in Sections 3.2}3.4, hierarchical information spaces of variable complexity canbe visualized.
3.2. INFORMATION OBJECT TYPES
For each information object type with the exception of (DBase', there are static anddynamically generated documents. In the case of (DBase', internal and external datastructures are distinguished since the content structure itself is inherently dynamic*afact which does not require explicit visualization. Structural variability is the relevantcharacteristic to separate static from dynamic information objects. If the structure ischanging, the dynamic process becomes part of the architecture, independent of technicalrealization. Even if it is automatically generated from database queries, the inherentcharacter of information objects might be of static nature.
(Page' objects are used to model various multimedia compound documents. Theyusually represent the logical end of a hierarchical tree. As already mentioned, the internalstructure of a (Page' is not supported by the eW3DT meta-model. Alternative
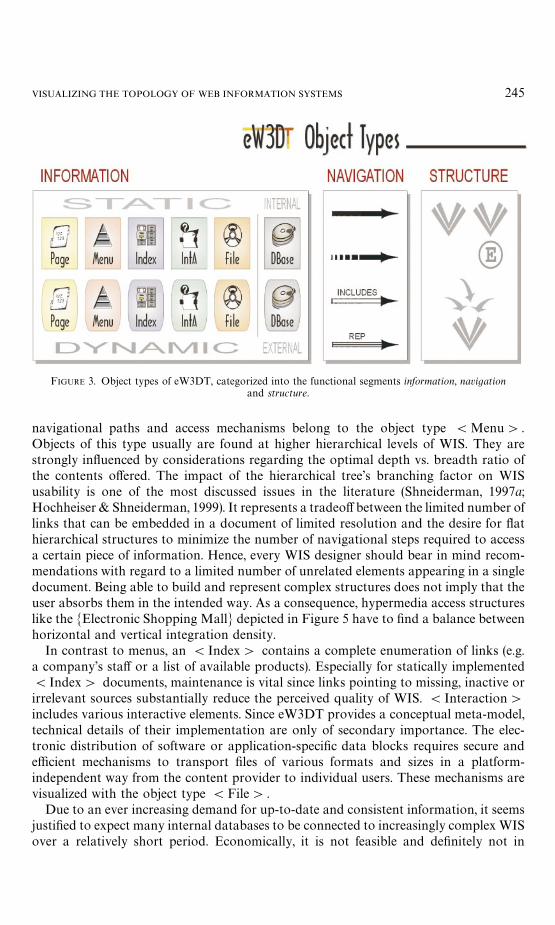
FIGURE 3. Object types of eW3DT, categorized into the functional segments information, navigationand structure.
VISUALIZING THE TOPOLOGY OF WEB INFORMATION SYSTEMS 245
navigational paths and access mechanisms belong to the object type (Menu'.Objects of this type usually are found at higher hierarchical levels of WIS. They arestrongly in#uenced by considerations regarding the optimal depth vs. breadth ratio ofthe contents o!ered. The impact of the hierarchical tree's branching factor on WISusability is one of the most discussed issues in the literature (Shneiderman, 1997a;Hochheiser & Shneiderman, 1999). It represents a tradeo! between the limited number oflinks that can be embedded in a document of limited resolution and the desire for #athierarchical structures to minimize the number of navigational steps required to accessa certain piece of information. Hence, every WIS designer should bear in mind recom-mendations with regard to a limited number of unrelated elements appearing in a singledocument. Being able to build and represent complex structures does not imply that theuser absorbs them in the intended way. As a consequence, hypermedia access structureslike the MElectronic Shopping MallN depicted in Figure 5 have to "nd a balance betweenhorizontal and vertical integration density.
In contrast to menus, an (Index' contains a complete enumeration of links (e.g.a company's sta! or a list of available products). Especially for statically implemented(Index' documents, maintenance is vital since links pointing to missing, inactive orirrelevant sources substantially reduce the perceived quality of WIS. (Interaction'includes various interactive elements. Since eW3DT provides a conceptual meta-model,technical details of their implementation are only of secondary importance. The elec-tronic distribution of software or application-speci"c data blocks requires secure ande$cient mechanisms to transport "les of various formats and sizes in a platform-independent way from the content provider to individual users. These mechanisms arevisualized with the object type (File'.
Due to an ever increasing demand for up-to-date and consistent information, it seemsjusti"ed to expect many internal databases to be connected to increasingly complex WISover a relatively short period. Economically, it is not feasible and de"nitely not in
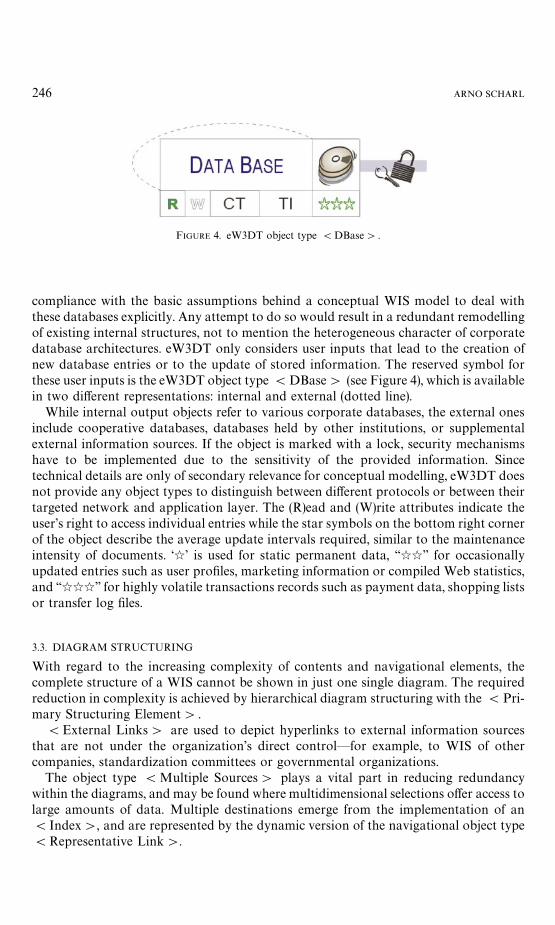
FIGURE 4. eW3DT object type (DBase'.
246 ARNO SCHARL
compliance with the basic assumptions behind a conceptual WIS model to deal withthese databases explicitly. Any attempt to do so would result in a redundant remodellingof existing internal structures, not to mention the heterogeneous character of corporatedatabase architectures. eW3DT only considers user inputs that lead to the creation ofnew database entries or to the update of stored information. The reserved symbol forthese user inputs is the eW3DT object type (DBase' (see Figure 4), which is availablein two di!erent representations: internal and external (dotted line).
While internal output objects refer to various corporate databases, the external onesinclude cooperative databases, databases held by other institutions, or supplementalexternal information sources. If the object is marked with a lock, security mechanismshave to be implemented due to the sensitivity of the provided information. Sincetechnical details are only of secondary relevance for conceptual modelling, eW3DT doesnot provide any object types to distinguish between di!erent protocols or between theirtargeted network and application layer. The (R)ead and (W)rite attributes indicate theuser's right to access individual entries while the star symbols on the bottom right cornerof the object describe the average update intervals required, similar to the maintenanceintensity of documents. &q' is used for static permanent data, &&qq'' for occasionallyupdated entries such as user pro"les, marketing information or compiled Web statistics,and &&qqq'' for highly volatile transactions records such as payment data, shopping listsor transfer log "les.
3.3. DIAGRAM STRUCTURING
With regard to the increasing complexity of contents and navigational elements, thecomplete structure of a WIS cannot be shown in just one single diagram. The requiredreduction in complexity is achieved by hierarchical diagram structuring with the (Pri-mary Structuring Element'.
(External Links' are used to depict hyperlinks to external information sourcesthat are not under the organization's direct control*for example, to WIS of othercompanies, standardization committees or governmental organizations.
The object type (Multiple Sources' plays a vital part in reducing redundancywithin the diagrams, and may be found where multidimensional selections o!er access tolarge amounts of data. Multiple destinations emerge from the implementation of an(Index', and are represented by the dynamic version of the navigational object type(Representative Link'.
VISUALIZING THE TOPOLOGY OF WEB INFORMATION SYSTEMS 247
3.4. NAVIGATION DESIGN
Complex hypertext structures as the manifestation of a multicursal labyrinth requiresophisticated means of navigation. Navigating and developing these structures arenonlinear, non-sequential activities that require an appropriate visual representation.Many current tools, however, are insu$cient to provide such a representation. They failto mitigate the in#exibility caused by the author-imposed fragmentation, and to over-come &&the reader's textual claustrophobia as he skims the de& ja% -lu nodes'' (Aarseth, 1998,p. 79). Consequently, like a ship bereft of nautical instruments or maps, users may losea coherent path through the information, and may encounter the frequently citedphenomenon of being &&lost in hyperspace'' (Conklin, 1987; Ipsen, 1997; Kaplan, Fenwick& Chen, 1998; Vassileva, 1998). Thus, navigational design has to counteract the reduc-tion of coherence in WIS, which arises due to an inadequate consideration of the speci"clinguistic features of hypertext environments.
eW3DT comprises four distinct types of visual association: static, dynamic, representa-tive and horizontal links. (Static Links' are implemented permanently, only struc-tural redesigns of WIS require an adaptation. (Dynamic Links' refer to customized,automatically generated documents. The (Representative Link' as a sub-type of the(Dynamic Link' points to di!erent versions of static information, which are de-livered depending on the existence of certain conditions. As already mentioned, multipledestinations within WIS are modelled with (Representative Links'. Lastly, the(Horizontal Link'*not a hyperlink in the narrow sense*enables designers to dealwith heterogeneous information objects (so-called composites, using the terminology ofthe Dexter Hypertext Reference Model; Halasz & Schwartz, 1994). To increase #exibilityand to reduce the number of necessary object types, a dedicated symbol for bi-directionallinks does not exist in eW3DT. Bi-directional access structures always may be construc-ted using any combination of uni-directional navigational object types. In addition,cross-links and references to higher hierarchical levels are not part of standard eW3DTdiagrams for reasons of readability. Interactive modelling tools relying on eW3DT,however, should support the dynamic presentation of the entire graph structure vialocation probes. If users move the mouse pointer over an information object (brushing),the complete set of links originating from and leading to the focused object temporarily isdisplayed (Terveen, Hill & Amento, 1999).
3.5. EXAMPLE OF AN ELECTRONIC SHOPPING MALL
To demonstrate the semantic relationships between the eW3DT information object typesdescribed above, the reference solution of Figure 5 visualizes standard WIS componentsof an electronic retailing application. After accessing one of the MCompany StorefrontsNbelonging to the MElectronic Shopping MallN, the WIS user is provided with a MCompanyPro"leN as well as a number of MProduct FamiliesN to identify his general requirements.Having selected a certain category, the user is able to choose between MProduct Vari-ationsN more speci"cally. The product in question is represented by the descriptionMProduct XN as well as MTechnical DetailsN for further information. Should the MNegoti-ation ProcessN turn out to be successful for both parties, the customer is able toimmediately place an on-line order by "lling out the MOrder formN. If all speci"cationshave been entered correctly, a separate market transaction is triggered between the seller
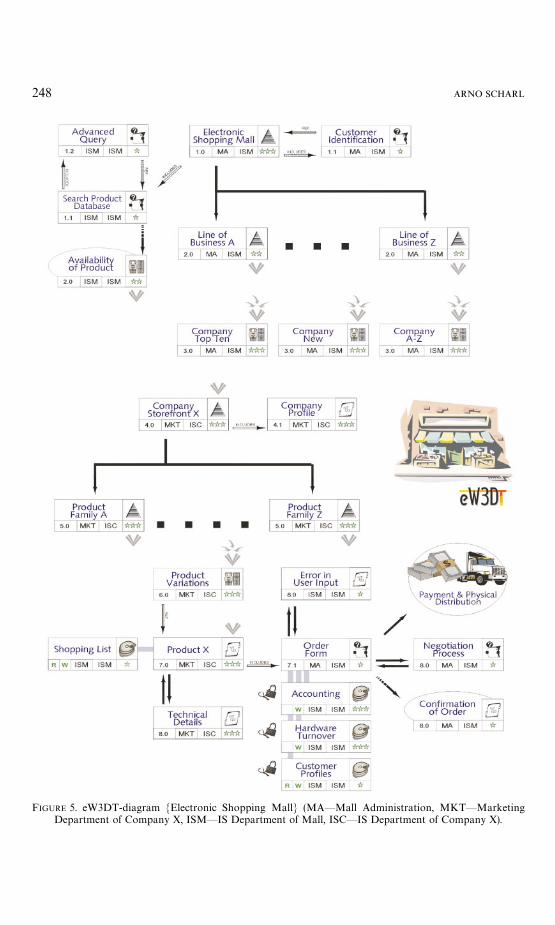
FIGURE 5. eW3DT-diagram MElectronic Shopping MallN (MA*Mall Administration, MKT*MarketingDepartment of Company X, ISM*IS Department of Mall, ISC*IS Department of Company X).
248 ARNO SCHARL
VISUALIZING THE TOPOLOGY OF WEB INFORMATION SYSTEMS 249
of the PC and a "nancial clearing institution. As soon as a form of payment is agreedupon and veri"ed by the seller, the database entries MAccountingN, MHardware Turn-overN, and MCustomer Pro"lesN are updated and a MCon"rmation of OrderN can be sentimmediately either by email or directly via a dynamic document.
The whole transaction is completed with the physical distribution of the product. Incase of immaterial goods, the actual delivery of the product is executed without delay;a customized (File' sent to the buyer eliminates the need for physical distribution.
4. Visualizing system topology and access patterns
There are millions of potential routes that users of complex WIS can (and do) take. Thus,reporting their individual and aggregated paths is far from trivial. Without propervisualization, the isolated statistical correlations lack the kind of relationship structure todeduce useful history (Wexelblat, 1999). The customer-oriented regular gathering ofstimulus}response data, and their integration with stored information for creatingdynamic user models in conformity with observable real-world patterns, help theinformation provider map and classify the customer's behaviour, describe its geographicand temporal distribution, and accurately predict future behaviour (Link & Hildebrand,1995; Jaspersen, 1997). Although many user models can function adequately with onlya behavioural impression of the user, it is impossible to anticipate the form and contentof her behaviour in particular domains (Ramscar, Pain & Lee, 1997), especially in thosethat emphasize con"gurative and textonic user functions.
4.1. UNITS OF ANALYSIS
In addition to the transfer (or access) log and the error log, two additional logs arecommon, although they are not necessarily widely used: the referrer log and the useragent log. Basic transfer logs usually are generated according to the Common ¸ogFormat.- In most cases, however, a combined, or extended, log format is chosen thatintegrates the information provided by the referrer and user agent log into the transferlog (Stout, 1997). In such combined log "les, the following parameters commonly arerecorded: User's IP address, computing platform, and the name and version number ofthe browser used to make the request (user agent); HTTP request type and protocolversion, URLs of the requested "le and of the referring document, status code describingthe success or failure of the transaction, transfer volume and exact date and time ofaccess.
Derived from the IP address, the domain name, organizational a$liation and approx-imate geographical location can be determined directly via the Internet Domain NameService (DNS) or indirectly with utilities similar to the UNIX command &&whois'', whichthemselves query DNS servers to provide additional information. Even if the user's IPaddress is assigned dynamically using the Dynamic Host Con"guration Protocol(DHCP), multiple sessions can be linked by retrieving persistent client state HTTPcookies of prior visits (Stout, 1997; Netscape, 1998).
-http://www.w3.org/Daemon/User/Con"g/Logging.html.

250 ARNO SCHARL
Hits have been widely criticized, as their weakness as a valid measure of WIS tra$c isquite evident. Since hits include all units of content such as images, text, sound "les orexecutables sent by an HTTP server when a particular document is accessed, they arenon-comparable across WIS (Novak & Ho!man, 1997). <isits can be identi"ed bysummarizing a certain number of raw hits on the transfer log such as a set of requesteddocuments, objects included in these documents and so forth. The ability to clearly de"nea visit as a series of consecutive requests from a single user depends upon whether thisuser can be uniquely identi"ed. If identi"cation via cookies or registered user names isnot possible, heuristics such as the popular 30min timeout must be used to de"ne a visit.
The identi"cation of visits is required to derive some of the most informative andinteresting variables. Unfortunately, multiuser systems or irregular access patterns (e.g.users that perform other activities in the meantime) reduce the validity of visits asmeasurement parameter. Several additional limitations have to be kept in mind. Theimplementation of proxy servers is the most severe one in that they limit the interpreta-bility of log "les in two ways. (a) If users access documents of a WIS that are alreadystored on intermediary proxy servers, no entries in the log "le of the actual server will becreated and (b) if a substantial number of hits originate from a proxy server, it isimpossible to determine if they represent one interested user or multiple individuals whojust &&hit and run'' (Sullivan, 1997). Due to client-side caching, backtracking cannot bemeasured as well. Thus, only unique navigational events are recorded. On the otherhand, it is rather di$cult to state if long visits comprising many entries for a given visitorrepresent a deeply satis"ed or a confused and hopelessly lost user (Sullivan, 1997;Hochheiser & Shneiderman, 1999). Existing entries in the log "le also do not necessarilyguarantee that the user has comprehended or even read the transferred information.Only a more detailed analysis of the clickstream can increase the validity of theobservation. If time-based metrics are available and valid, information providers cancompare the actual viewing time with the average viewing time or the minimal amount oftime usually necessary for comprehending the information. However, the validity oftime-based metrics is often limited, as o%ine browsers and similar automated user agentscan e!ectively mask reader interaction.
4.2. AVAILABLE METHODS AND TOOLS
Operating systems like UNIX provide basic mechanisms to manually analyse userbehaviour. The grep command, for instance, processes a "le and prints out only thoselines of the "le that have a certain interesting property for the user. Similarly, numerousfreeware and public domain tools for various platforms are available.- Almost allsubstantial projects, however, will install commercially available software packages forthe vital task of monitoring and analysing user behaviour based on HTTP log "le data(Busch, 1997; Malchow & Thomsen, 1997; Stout, 1997). In most cases, these tools onlyprovide descriptive statistics and static representations embedded in various reports(including tables, histograms, pie charts, etc.) without interactive facilities and without
-http://columba.its.uu.se/Software/Analyzers/; http://dir.yahoo.com/2/2/2/2/ Servers/Log}Analysis}Tools/; http://serverwatch.internet.com/dtanalysis.html; http:// www.mela.de/Unix/log.html; http://www.nisto.com/mac/tool/logs.html; http://www.stars.com/Vlib/Software/Statistics.html.

VISUALIZING THE TOPOLOGY OF WEB INFORMATION SYSTEMS 251
consideration of additional information embedded in the WIS topology. The reportsusually are generated either directly in HTML, or in a "le format compatible withpopular word processing software. In contrast, the WebMapper tool, which will beintroduced in the following section, provides a graphical overview based on eW3DTanalogous to traditional customer tracking, which is quite common for real-worldretailing outlets (Becker, 1973). Such an interactive usage map provides an interestingcomplement by showing sequences at a higher level, and by exposing the kinds ofexperiences that users can gain from WIS. Wexelblat denotes two main application areasfor such an overview (Wexelblat, 1999): Guidance of new users via explorative interfacesthat enable the semantics and assumptions of the underlying data model to be readilyinferred (Hemingway, 1999), and =IS design, where the user's actual experience iscompared with the designer's model(s) of how the WIS would be experienced.
4.3. MONITORING AND MAPPING HUMAN BEHAVIOUR
As WIS represent semantic networks in themselves, it is only natural to leverage thesemantics that already exist in such networks for their visualization (Kaplan et al., 1998).A very intuitive way to tap the potential of such &&hidden'' semantics is the use of sitemaps, sometimes also referred to as map windows. In contrast to hand-crafted representa-tions of WIS, automatically generated site maps are composed on-the-#y by the underly-ing system according to the system's topology and a set of pre-supplied layout rules(Andrews, 1995). Explicit graphical representations of the node and link structuresigni"cantly improve user performance and are indispensable for helping users to get anin-depth understanding of the navigation space. These positive e!ects are further ampli-"ed by the interactivity of these visual representations (Beard & Walker, 1990; Cardet al., 1999; Nielsen, 1999).
From a theoretical perspective based on the level of abstraction, site maps can beregarded as a merged set of trails (Wexelblat, 1999). Similar to Michel de Certau's=andersmaK nner, on-line customers represent a collective and virtual presence hoveringabove a hypertext's topology. &&It is true that the operation of walking on can be tracedon city maps in such a way as to transcribe their paths (here well-trodden, there veryfaint) and their trajectories (going this way and not that). But these 2curves only refer,like words, to the absence of what has passed by. Surveys of routes miss what was: the actitself of passing by'' (De Certeau, 1983, p. 97; Rosello, 1994, p. 136). Nonetheless,observing real-world human behaviour is a common activity. Figure 6 comprises twoexamples of cumulative visualizations. The diagram on the left-hand side representsobservational customer tracking typical for traditional retailing outlets (Becker, 1973).The diagram on the right-hand side displays real-time monitoring of the tra$c situationin the urban area of Los Angeles. It is colour-coded according to the current averagespeed of vehicles with green at 35miles/h and above, yellow at 20}35 miles/h, red at lessthan 20 miles, and white for no data available.-
Similarly, individual and aggregated access patterns are of increasing interest to WISanalysts. Attention usually centres around the type of items requested, the frequency of
-http://tra$c.maxwell.com/la/

FIGURE 6. Monitoring and cumulative visualization of real-world human behaviour.
FIGURE 7. eW3DT diagram (left) and cumulative visualization of user access patterns within the same WIScomponent (right).
252 ARNO SCHARL
requests, and the hyperlink topology (Chi et al., 1998). A modi"ed version of the eW3DTmeta-model accommodates this interest by providing a visual framework for analysingaccess patterns of WIS customers. =ebMapper, a prototypical, platform-independentJava implementation of eW3DT, provides a visual framework for analysing accesspatterns of WIS customers. It enhances the limited, statistically oriented representationsof commercially available web-tracking software with a map-like view similar to cus-tomer tracking in traditional retailing outlets (Figure 7, right diagram). In its early stages,this &&clickstream'' application exclusively focuses on the processing of HTTP log "les.The structure of the site's hierarchical document tree automatically is generated from the

VISUALIZING THE TOPOLOGY OF WEB INFORMATION SYSTEMS 253
hyperlink information found within existing HTML documents. WebMapper will helporganizations running commercial WIS in their e!orts to map and classify individual aswell as aggregated customer behaviour. It will enable them to predict future trends, toadvertise more e!ectively, and to maximize the customer-delivered value of electronictransactions.
As already mentioned in the preceding sections, every information object type ofeW3DT de"nes a general pro"le for describing the characteristic attributes of WISdocuments. With regard to the application domain of the WebMapper, however, therectangular symbols representing di!erent types of hypertext compound documentsincorporate a di!erent set of attributes in comparison with the eW3DT design meta-model (Figure 2). Both colour and line-width coding are employed to convey additionalinformation. While the colour and the shading of objects represent their actual numberof HTTP requests during a certain period (N}Hits), the width and style of connectinglinks between the documents represent the frequency with which these links werefollowed by customers. Although default values are recommended by the system, the userhas full control over both parameters by specifying threshold values. In addition to thevisual cues, the average viewing time of WIS documents in seconds is displayed in the"eld (Avg}VTime). Via the (Info) button, detailed information about the object inquestion is accessible (e.g. host names of the most important visitors, aggregated numberof entries and exits in a particular time interval and so forth). Being part of the userinterface, the two arrow symbols in the bottom right corner do not represent an attributeof the object, but provide the analyst with the option to move between lower- andupper-level diagrams.
4.4. TIGHTLY COUPLED INTERFACE REPRESENTATIONS
The multiple views of the interface representation introduced in the following facilitatethe synchronous access to hypertext documents, site maps, and visualizations of userbehaviour. The context-providing &&overview'' reduces search, allows the detection ofglobal patterns, and aids the user in choosing the next node to visit. The &&detailed view''displays a magni"ed focus for the local neighbourhood surrounding the user's currentlocation. To aid users in remembering their location, interface designers should providesome sort of &&you are here'' indicator as part of the overview. This meta-navigation maybe realized in the form of control widgets to pan the detailed view. Similarly, scrolling thedetailed view updates the position of the indicator in the overview. Hence, both views aresaid to be tightly coupled. Such tightly coupled views, also referred to as &&multiplecoordinated views'' or &&linked views'', provide rapid access and are simple to implementand understand. They are frequently complemented by additional zoom facilities toadjust the level of detail.
Figure 8 shows such a tightly coupled interface representation that uses eW3DT as thedetailed view in the upper right corner, together with three types of overview diagrams:a disk tree, a three-dimensional cone tree, and a tree map (Chi et al., 1998; Munzner& Buchard, 1995).- Comparable circular layouts for conveying structural hypertext
-http://www.smartmoney.com/marketmap/

FIGURE 8. Tightly coupled interface representation showing the hypertext document, an eW3DT diagram asthe detailed view, and three distinct overviews.
254 ARNO SCHARL
features are the information slices of Andrews, the CyberGeo maps of Holmquist et al., orWexelblat's hyperbolic maps (Andrews, 1998; Holmquist, Fagrell & Busso, 1998; Wexel-blat, 1999; Skog & Holmquist, 2000). These layouts depict the hierarchical levels assuccessive circles of increasing radius with a common centre at the root of the tree.Independent of the chosen method, every user should be able to select the arrangement ofpreferred display techniques.
5. Conclusion
It has been demonstrated in this paper that many methods and tools for WIS analysisand design still have a number of shortcomings regarding their support of inter- andintraorganizational communication. Integrating explanative and explorative functional-ity via multiple, tightly coupled views is essential to further improve the quality of WISmodels and navigational aids. For that purpose, the extended World Wide Web DesignTechnique (eW3DT) as a conceptual, user-centric modelling language for describing,analysing and designing Web information systems has been introduced.
Both real-world and virtual examples of monitoring and mapping human behaviourhave been presented. Semantically rich visualization of WIS customers' access patternswere used to enhance the limited, statistically oriented representations of commerciallyavailable web-tracking software. These visualizations are more than convenient mecha-nisms to analyse a virtual space. When integrated into the user interface, they becomecrucial textual elements themselves, replete with their own interpretive assumptions,

VISUALIZING THE TOPOLOGY OF WEB INFORMATION SYSTEMS 255
emphases, and omissions (Burbules & Callister, 1996). It is obvious that a single layoutalgorithm cannot always produce the best results. In order to extend the approachpresented in this paper, further research will focus on representational adaptivity, onadditional meta-information conveyed by semantic markup languages such as XML(eXtensible Markup Language), and on multiple simultaneous foci within interactiveoverview diagrams. A variety of adaptive presentation techniques is suitable to cus-tomize overview maps: highlighting, hiding, direct guidance or annotation. Instead ofconsidering all existing links, for example, links originating from a particular documentthat are particularly relevant to a user's current goals can be derived from the user model.Besides adaptivity, the application of visual operators in user interface design representsanother promising alternative to explore. Such visual operators can be employed tovisualize longitudinal data (e.g. comparing current with past access frequencies), toannotate interactive site maps (e.g. indicating a site's most dynamic segments) orto emphasize di!erences in the behaviour of certain target groups (e.g. comparing themost popular documents among di!erent age groups).
References
AARSETH, E. (1998). Cybertext: Perspectives on Ergodic ¸iterature. Baltimore: Johns HopkinsUniversity Press.
ANDREWS, K. (1995). Visualizing cyberspace: information visualization in the harmony internetbrowser. 1st IEEE Symposium on Information <isualization (InfoVis-95), pp. 90}96. SilverSpring, MD: IEEE Computer Society.
ANDREWS, K. (1998). Visualizing rich, structured hypermedia. IEEE Computer Graphics andApplications, 18, 40}42.
BALASUBRAMANIAN, V., MA, B. M. & YOO, Y. (1995). A systematic approach to designing a WWWapplication. Communications of the ACM, 38, 47}48.
BEARD, D. V. & WALKER, J. Q. (1990). Navigational techniques to improve the display of largetwo-dimensional spaces. Behavior and Information ¹echnology, 9, 451}466.
BECKER, W., Ed. (1973). Beobachtungsverfahren in der demoskopischen Marktforschung. Stuttgart:Ulmer.
BICHLER, M. & NUSSER, S. (1996). Modular design of complex web-applications with=3DT. Paperpresented at the 5th Workshops on Enabling Technologies: Infrastructure for CollaborativeEnterprises (WETICE-96), Stanford, USA.
BUCY, E. P., LANG, A., POTTER, R. F. & GRABE, M. E. (1999). Formal features of cyberspace:relationships between web page complexity and site tra.c. Paper presented at the 49th AnnualConference of the International Communication Association (ICA-99), San Francisco, USA.
BURBULES, N. C. & CALLISTER, T. A. (1996). Knowledge at the crossroads: some alternative futuresof hypertext learning environments. Educational ¹heory, 46, 23}50.
BUSCH, D. D. (1997). Count your blessings. Internet=orld, 8, 75}83.BUTTON, G. & DOURISH, P. (1996). ¹echnomethodology: Paradoxes and Possibilities. Paper pre-
sented at the ACM Conference on Human Factors in Computing Systems (CHI-96), Van-couver, Canada.
CARD, S. K., MACKINLAY, J. D. & SHNEIDERMAN, B. (1999). Readings in Information<isualization:;sing <ision to ¹hink. San Francisco: Morgan Kaufmann.
CHI, E. H., PITKOW, J., MACKINLAY, J., PIROLLI, P., GOSSWEILER, R. & CARD, S. K. (1998).<isualizing the evolution of web ecologies. Paper presented at the Conference on HumanFactors in Computing Systems (CHI-98), Los Angeles, USA.
CONKLIN, J. (1987). Hypertext: an introduction and survey. IEEE Computer, 20, 17}41.DE CERTEAU, M. (1983). ¹he Practice of Everyday ¸ife (Randall, Steven, Trans.). Berkeley:
University of California Press.

256 ARNO SCHARL
DE FANTI, T. A., BROWN, M. D. & MCCORMICK, B. H. (1989). Visualization*expanding scienti"cand engineering research opportunities. IEEE Computer, 22, 15}25.
DE TROYER, O. & LEUNE, K. (1998).=SDM: a user-centered design method for web sites. Paperpresented at the 7th International World Wide Web Conference (WWW7), Brisbane,Australia.
DESHPANDE, Y., HANSEN, S. & MURUGESAN, S. (1999).=eb engineering: beyond CS, IS and SE2anevolutionary and non-engineering perspective. Paper presented at the First ICSE Workshop onWeb Engineering (WebE-99), Los Angeles, USA.
FREISLER, S. & KESSELER, M. (1997). Document Engineering. http://www.schema.de/SCHEMA-Publikationen/Vortrag/doenghtm.htm. Available: http://www.schema.de/html-deu/schemapub/vortrag/document.htm.
GARZOTTO, F., MAINETTI, L. & PAOLINI, P. (1995). Hypermedia design, analysis, and evaluationissues. Communications of the ACM, 38, 74}86.
GARZOTTO, F., MAINETTI, L. & PAOLINI, P. (1996). Navigation in hypermedia applications:modeling and semantics. Journal of Organizational Computing and Electronic Commerce, 6,211}237.
GARZOTTO, F., PAOLINI, P. & SCHWABE, D. (1993). HDM: a model-based approach to hypertextapplication design. ACM ¹ransactions on Information Systems, 11, 1}26.
GAY, G., & LENTINI, M. (1995). Use of communication resources in a networked collaborativedesign environment. Journal of Computer Mediated Communication, 1(1). http://www.ascusc.org/jcmc/.
GNAHO, C. & LARCHER, F. (1999). A user centered methodology for complex and customizable webapplications engineering. Paper presented at the First ICSE Workshop on Web Engineering(WebE-99), Los Angeles, USA.
HALASZ, F. & SCHWARTZ, M. (1994). The Dexter hypertext reference model. Communications of theACM, 37, 30}39.
HEMINGWAY, C. J. (1999). ¹oward a socio-cognitive theory of information systems: an analysis of keyphilosophical and conceptual issues. Paper presented at the IFIP WG 8.2 and 8.6 JointWorking Conference on Information Systems: Current Issues and Future Changes, Helsinki,Finland.
HOCHHEISER, H. S. & SHNEIDERMAN, B. (1999). ;nderstanding patterns of user visits to web sites:interactive star,eld visualizations of=== log data. Technical Report CS-TR-3989. Depart-ment of Computer Science, University of Maryland, College Park.
HOLMQUIST, L. E., FAGRELL, H. & BUSSO, R. (1998). Navigating cyberspace with cybergeo maps.Paper presented at the 21st Conference of the Information Systems Research in ScandinaviaAssociation (IRIS-21), Saeby, Denmark.
IEEE. (1999).<olume 1: Customer and ¹erminology Standards. Piscataway: IEEE Computer SocietyPress.
IPSEN, G. (1997). Linguistic orientation in computational space. In W. NoK th, Ed. Semiotics of the Media:State of the Art, Projects, and Perspectives, Vol. 127, pp. 559}573. Berlin: Mouton de Gruyter.
ISAKOWITZ, T., STOHR, E. A. & BALASUBRAMANIAN, P. (1995). RMM: a methodology for struc-tured hypermedia design. Communications of the ACM, 38, 34}44.
JASPERSEN, T. (1997). Computergestu( tztes Marketing: Controllingorientierte D<-<erfahren fuK r Ab-satz und <ertrieb, 2nd edn. Munich: Oldenbourg.
JUTLA, D., BODORIK, P., HAJNAL, C. & DAVIS, C. (1999). Making business sense of electroniccommerce. Computer, 32, 67}75.
KAPLAN, C., FENWICK, J. & CHEN, J. (1998). Adaptive hypertext navigation based on user goalsand context. In P. Brusilovsky, A. Kobsa & J. Vassileva, Eds. Adaptive Hypertext andHypermedia, pp. 45}69. Dordrecht: Kluwer Academic Publishers.
LEUNG, Y. K. & APPERLEY, M. D. (1994). A review and taxonomy of distortion-oriented presentation techniques. ACM ¹ransactions on Computer-Human Interaction, 1,126}160.
LINK, J. & HILDEBRAND, V. G. (1995). Wettbewerbsvorteile durch kundenorientierte Informa-tionssysteme: konzeptionelle grundlagen und empirische ergebnisse. Journal fuK r Betriebswir-tschaft, 45, 46}62.

VISUALIZING THE TOPOLOGY OF WEB INFORMATION SYSTEMS 257
LOHSE, G. L., BIOLSI, K., WALKER, N. & RUETER, H. H. (1994). A classi"cation of visualrepresentation. Communications of the ACM, 37, 36}49.
MALCHOW, R. & THOMSEN, K. (1997). Web-tracking. Screen Multimedia, September, 4, 57}61.MECCA, G., MERIALDO, P., ATZENI, P. & CRESCENZI, V. (1999). ¹he Araneus guide to web-site
development. Working AWR-1-99, University of Rome, Rome Italy.MLADENIC, D. (1998). Machine learning on non-homogeneous, distributed text data. Unpublished
Doctoral, University of Ljubljana, Ljubljana.MUNZNER, T. (1998). Exploring large graphs in 3D hyperbolic space. IEEE Computer Graphics and
Applications, 18, 18}23.MUNZNER, T. & BUCHARD, P. (1995). <isualizing the structure of the world wide web in 3D
hyperbolic space. Paper presented at the 1st Annual Symposium on Virtual Reality Modeling(VRML-95), San Diego, USA.
MURUGESAN, S., DESHPANDE, Y., HANSEN, S. & GINIGE, A. (1999). =eb engineering: a newdiscipline for development of web-based systems. Paper presented at the First ICSE Workshopon Web Engineering (WebE-99), Los Angeles, USA.
NETSCAPE. (1998). Persistent client state H¹¹P cookies: preliminary speci,cation [WWW docu-ment]. Netscape Communications Corporation. Available: http://home.netscape.com/news-ref/std/cookie}spec.html [1998, 18/12/1998].
NGUYEN, T.-L. & SCHMIDT, H. (1999). Creating and managing documents with lifeweb. Paperpresented at the 5th Australian World Wide Web Conference (AusWeb-99), Ballina, Australia.
NIELSEN, J. (1999). User interface directions for the web. Communications of the ACM, 42, 65}72.NOVAK, T. P. & HOFFMAN, D. L. (1997). New metrics for new media: toward the development of
web measurement standards.=orld =ide =eb Journal, 2, 213}246.O'SULLIVAN, P. B. (1999). Personal broadcasting: theoretical implications of the web. Paper present-
ed at the 49th Annual Conference of the International Communication Association (ICA-99),San Francisco, USA.
RAMSCAR, M., PAIN, H. & LEE, J. (1997). Do we know what the user knows, and does it matter? ¹heepistemics of user modeling. Paper presented at the 6th International Conference on UserModeling (UM-97), Chia Laguna, Italy.
RHEINFRANK, J., EVENSON, S. & WULFF, W. (1994). Design as common ground. In M. J. Tauber,D. E. Mahling & F. Are", Eds. Cognitive Aspects of <isual ¸anguages and <isual Interfaces,pp. 77}102. Amsterdam: North-Holland.
ROBERTSON, G. G., MACKINLAY, J. D., & CARD, S. K. (1991). Cone trees: animated 3D visualiz-ations of hierarchical information. Paper presented at the Conference on Human Factors inComputing Systems (CHI-91), New Orleans, USA.
ROGERS, E. M. (1995). Di+usion of Innovations, 4th edn. New York: The Free Press.ROSELLO, M. (1994). The screener's maps: Michel de Certeau's &&WandersmaK nner'' and Paul
Auster's hypertextual detective. In G. P. LANDOW, Ed. Hyper/¹ext/¹heory, pp. 121}158.Baltimore: Johns Hopkins University Press.
SCHARL, A. (1997). Referenzmodellierung kommerzieller Masseninformationssysteme: IdealtypischeGestaltung von Informationsangeboten im=orld=ide=eb am Beispiel der Branche Informa-tionstechnik (Reference Modeling of Commercial Mass Information Systems: Referential Designof Applications for the =orld =ide =eb with Special Regard to the Information Industry).Frankfurt: Peter Lang.
SCHARL, A. (1999). Reference modeling as the missing link between academic research and industrypractice. Journal of Scienti,c and Industrial Research, 58, 211}220.
SCHWABE, D. & ROSSI, G. (1995). The Object-oriented hypermedia design model. Communicationsof the ACM, 38, 45}46.
SCHWABE, D., ROSSI, G. & BARBOSA, S. (1996). Systematic hypermedia application design withOOHDM. Paper presented at the 7th ACM Conference on Hypertext, Washington, USA.pp. 118}128.
SHNEIDERMAN, B. (1997a). Designing information-abundant web sites: issues and recommenda-tions. International Journal of Human-Computer Studies, 47, 5}29.
SHNEIDERMAN, B. (1997b). Designing the ;ser Interface: Strategies for E+ective Human}ComputerInteraction. Berkeley: Addison-Wesley.

258 ARNO SCHARL
SKOG, T. & HOLMQUIST, L. E. (2000). =ebAware: continuous visualization of web site tra.c ina public place. Student Poster presented at the Conference on Human Factors in ComputingSystems (CHI-2000), The Hague, Netherlands.
SOMMER, U. & ZOLLER, P. (1999). =ebCon: design and modeling of database driven hypertextapplications. Paper presented at the 32nd Hawaii International Conference on SystemSciences (HICSS-32), HI, USA.
STOUT, R. (1997). =eb Site Stats: ¹racking Hits and Analyzing ¹ra.c. Berkeley: Osborne/McGraw-Hill.
SULLIVAN, T. (1997). Reading reader reaction: a proposal for inferential analysis of web server log,les. Paper presented at the 3rd Conference on Human Factors & the Web, Denver, USA.
SUTHERLAND, K. (1997). Introduction. In K. Sutherland, Ed. Electronic ¹ext: Investigations inMethod and ¹heory, pp. 1}18. Oxford: Clarendon Press.
TERVEEN, L. G., HILL, W. C. & AMENTO, B. (1999). Constructing, organizing, and visualizingcollections of topically related web resources. ACM ¹ransactions on Computer-Human Inter-action, 6, 67}94.
VASSILEVA, J. (1998). A task-centered approach for user modeling in a hypermedia o$ce documen-tation system. In P. Brusilovsky, A. Kobsa & J. Vassileva, Eds. Adaptive Hypertext andHypermedia, pp. 209}247. Dordrecht: Kluwer Academic Publishers.
WEXELBLAT, A. (1999). History-based ¹ools for Navigation. Paper presented at the 32nd HawaiiInternational Conference on System Sciences (HICSS-32), Hawaii, USA.
Paper accepted for publication by Associate Editor, Dr A. Dillon