explanatory memorandum to the division of revenue budget/2016/review/annexure... · 1 w1...
TRANSCRIPT

1
W1
Explanatory memorandum to the division of revenue
Background
Section 214(1) of the Constitution requires that every year a Division of Revenue Act determine the
equitable division of nationally raised revenue between national government, the nine provinces and
257 municipalities (278 municipalities prior to the 2016 local government elections). The tabled
allocations are published with the new municipal demarcations even though the elections will be held later
in the year.
The division of revenue takes into account the powers and functions assigned to each sphere of
government. The process fosters transparency and is at the heart of constitutional cooperative governance.
The Intergovernmental Fiscal Relations Act (1997) prescribes the process for determining the equitable
sharing and allocation of nationally raised revenue. Sections 9 and 10(4) of the act set out the consultation
process to be followed with the Financial and Fiscal Commission (FFC), including considering the
commission’s recommendations regarding the division of revenue.
This explanatory memorandum to the 2016 Division of Revenue Bill fulfils the requirement set out in
section 10(5) of the Intergovernmental Fiscal Relations Act that the bill be accompanied by an explanation
of how it takes account of the matters listed in sections 214(2)(a) to (j) of the Constitution, government’s
response to the FFC’s recommendations, and any assumptions and formulas used in arriving at the
respective divisions among provinces and municipalities. This explanatory memorandum has six sections:
Part 1 lists the factors that inform the division of resources between national, provincial and local
government.
Part 2 describes the 2016 division of revenue.
Part 3 sets out how the FFC’s recommendations on the 2016 division of revenue have been taken into
account.
2016 BUDGET REVIEW
2
Part 4 explains the formula and criteria for the division of the provincial equitable share and conditional
grants among provinces.
Part 5 sets out the formula and criteria for the division of the local government equitable share and
conditional grants among municipalities.
Part 6 summarises issues that will form part of subsequent reviews of provincial and local government
fiscal frameworks.
The Division of Revenue Bill and its underlying allocations are the result of extensive consultation
between national, provincial and local government. The Budget Council deliberated on the matters
discussed in this memorandum at several meetings during the year. The approach to local government
allocations was discussed with organised local government at technical meetings with the South African
Local Government Association (SALGA), culminating in meetings of the Budget Forum (the Budget
Council and SALGA). An extended Cabinet meeting involving ministers, provincial premiers and the
SALGA chairperson was held in October 2015. The division of revenue, and the government priorities that
underpin it, was agreed for the next three years.
Part 1: Constitutional considerations
The annual Division of Revenue Act is enacted after factors in sections 214(2)(a) to (j) of the Constitution
are taken into account. These include national interest, debt provision, the needs of national government,
flexibility in responding to emergencies, resource allocation for basic services and developmental needs,
the fiscal capacity and efficiency of provincial and local government, the reduction of economic
disparities, and the promotion of stability and predictability. The constitutional principles taken into
account in deciding on the division of revenue are briefly noted below.
National interest and the division of resources
The national interest is encapsulated by governance goals that benefit the nation as a whole. The National
Development Plan, endorsed by Cabinet in November 2012, sets out a long-term vision for the country’s
development. This is complemented by the strategic integrated projects overseen by the Presidential
Infrastructure Coordinating Council and the 14 priority outcomes adopted by Cabinet in 2014 for the
2014–2019 medium-term strategic framework. In the 2015 Medium Term Budget Policy Statement, the
Minister of Finance outlined how the resources available to government over the 2016 medium-term
expenditure framework (MTEF) would be allocated to help achieve these goals. Chapter 4 of the
2015 Medium Term Budget Policy Statement and Chapters 5 and 6 of the 2016 Budget Review discuss how
funds have been allocated across government based on these priorities. The frameworks for each
conditional grant allocated as part of the division of revenue also note how the grant is linked to the
14 priority outcomes.
Provision for debt costs
The resources shared between national, provincial and local government include proceeds from national
government borrowing used to fund public spending. National government provides for the resulting debt
costs to protect the country’s integrity and credit reputation. A more detailed discussion can be found in
Chapter 7 of the 2016 Budget Review.
National government’s needs and interests
The Constitution assigns exclusive and concurrent powers and functions to each sphere of government.
National government is exclusively responsible for functions that serve the national interest and are best
centralised. National and provincial government have concurrent responsibility for a range of functions.
Provincial and local government receive equitable shares and conditional grants to enable them to provide
basic services and perform their functions. Functions may shift between spheres of government to better
meet its needs. The division of revenue responds to this by modifying the funding arrangements.
ANNEXURE W1: EXPLANATORY MEMORANDUM TO THE DIVISION OF REVENUE
3
Changes continue to be made to various national transfers to provincial and local government to improve
their efficiency, effectiveness and alignment with national strategic objectives.
Provincial and local government basic services
Provinces and municipalities are assigned service delivery functions such as education, health, social
development, housing, roads, provision of electricity and water, and municipal infrastructure. They have
significant autonomy to allocate resources to meet basic needs and respond to provincial and local
priorities, while giving effect to national objectives. The division of revenue provides equitable shares to
provinces and local government, together with conditional grants for basic service delivery.
Strong growth in allocations to provincial and local government reflects government’s emphasis on
priority services such as health, education and basic services, as well as the rising costs of these services
due to higher wages, and bulk electricity and water costs. Transfers to local government have grown
significantly in recent years, providing municipalities with greater resources to deliver basic services. This
is in addition to local government’s substantial revenue-raising powers.
The 2016 division of revenue has prioritised the rollout of water and sanitation infrastructure. In addition, a
grant to municipalities affected by the 2016 boundary changes will help minimise any negative effects that
the transition may have on service delivery. The division of revenue also gives expression to the National
Development Plan’s prioritisation of early childhood development.
Fiscal capacity and efficiency
National government has primary revenue-raising powers. Provinces have limited revenue-raising capacity
and the resources required to deliver provincial functions do not lend themselves to self-funding or cost
recovery. Due to their limited revenue-raising potential and their responsibility to implement government
priorities, provinces receive a larger share of nationally raised revenue than local government.
Municipalities finance most of their expenditure through property rates, user charges and fees. However,
compared to large urban and metropolitan municipalities, rural municipalities raise significantly less
revenue.
Local government’s share of nationally raised revenue has increased from 3 per cent in 2000/01 to
9.1 per cent over the 2016 MTEF period. A review of the local government equitable share was completed
in 2012 and a new formula is being phased in from 2013/14 to 2017/18. The new formula incorporates a
revenue adjustment factor that considers the fiscal capacity of the recipient municipality (full details of the
formula are provided in part 5 of this annexure). The mechanisms for allocating funds to provinces and
municipalities are continuously reviewed to improve their efficiency. A new approach to the funding of
provincial infrastructure is being introduced to promote better planning and implementation, and to
improve efficiency in the delivery of health and education infrastructure. To maximise the effect of
allocations, many provincial and local government conditional grants use criteria that consider the
recipient’s efficient use of previous allocations.
Developmental needs
Developmental needs are accounted for at two levels. First, in the determination of the division of revenue,
which explains the continued commitment to grow the provincial and local government shares of
nationally raised revenue; and second, in the determination of the division within each sphere through the
formulas used to divide national transfers among municipalities and provinces. Developmental needs are
encapsulated in the equitable share formulas for provincial and local government and in specific
conditional grants, such as the municipal infrastructure grant, which allocates funds according to the
number of households in a municipality without access to basic services. Various infrastructure grants and
growing capital budgets aim to boost the economic and social development of provinces and
municipalities.
2016 BUDGET REVIEW
4
Economic disparities
The equitable share and infrastructure grant formulas are redistributive towards poorer provinces and
municipalities. Through the division of revenue, government continues to invest in economic infrastructure
(such as roads) and social infrastructure (such as schools, hospitals and clinics) to stimulate economic
development, create jobs, and address economic and social disparities.
Obligations in terms of national legislation
The Constitution confers autonomy on provincial governments and municipalities to determine priorities
and allocate budgets. National government is responsible for policy development, national mandates,
setting national norms and standards for provincial and municipal functions, and monitoring
implementation for concurrent functions. The 2016 MTEF and division of revenue provide additional
funding for municipalities affected by significant boundary changes due to take effect after the 2016 local
government elections. To support the newly amalgamated municipalities and ensure a smooth transition,
the municipal demarcation transition grant was established in 2015/16 for a period of three years
(to 2017/18). National government will also ensure that baseline reductions do not affect important
obligations that are already funded through existing provincial and local government allocations.
Predictability and stability
Provincial and local government equitable share allocations are based on estimates of nationally raised
revenue. If this revenue falls short of the estimates within a given year, the equitable shares of provinces
and local government will not be adjusted downwards. Allocations are assured (voted, legislated and
guaranteed) for the first year and are transferred according to a payment schedule. To contribute to longer-
term predictability and stability, estimates for a further two years are published with the annual proposal
for appropriations. Adjusted estimates as a result of changes to data underpinning the equitable share
formulas and revisions to the formulas are phased in to ensure minimal disruption.
Flexibility in responding to emergencies
Government has a contingency reserve that provides a cushion for emergencies and unforeseeable events.
In addition, two conditional grants for disasters allow for the swift allocation and transfer of funds to
affected provinces and municipalities in the immediate aftermath of a declared disaster. Sections 16 and 25
of the Public Finance Management Act (1999) make specific provision for the allocation of funds to deal
with emergency situations. Section 30(2) deals with adjustment allocations for unforeseeable and
unavoidable expenditure. Section 29 of the Municipal Finance Management Act (2003) allows a municipal
mayor to authorise unforeseeable and unavoidable expenditure in an emergency. Section 20(6) of the 2016
Division of Revenue Bill also allows conditional grant funds to be reprioritised to respond to a disaster.
Part 2: The 2016 division of revenue
Government’s central fiscal objective over the MTEF period is to stabilise the growth of debt as a share of
GDP and strictly adhere to the planned expenditure ceiling (see Chapters 1, 3 and 5 of the Budget Review).
The most important public spending programmes that help poor South Africans, contribute to growth and
generate employment have been protected from major reductions. The 2016 division of revenue
reprioritises existing funds to ensure these objectives are met despite the lower expenditure ceiling. Parts 4
and 5 of this annexure set out in more detail how the baseline reductions have been applied to provincial
and local government transfers.
Excluding debt-service costs and the contingency reserve, allocated expenditure shared between the three
spheres amounts to R1.165 trillion, R1.250 trillion and R1.347 trillion over each of the MTEF years. These
allocations take into account government’s spending priorities, each sphere’s revenue-raising capacity and
responsibilities, and input from various intergovernmental forums and the FFC. The provincial and local
ANNEXURE W1: EXPLANATORY MEMORANDUM TO THE DIVISION OF REVENUE
5
equitable share formulas are designed to ensure fair, stable and predictable revenue shares, and to address
economic and fiscal disparities.
Government’s policy priorities for the 2016 MTEF period
Following the reductions to the baseline, existing budgets need to be reprioritised to meet government’s
policy priorities outlined in the medium-term strategic framework. Priorities over the 2016 MTEF period
that are funded through reprioritisations in the division of revenue include:
Introducing appropriate incentives to upgrade and maintain provincial and municipal infrastructure.
Extending HIV/AIDS intervention spending to include tuberculosis.
Completing the eradication of bucket sanitation systems in formal residential areas.
Extending access to early childhood development centres through a new grant.
The fiscal framework
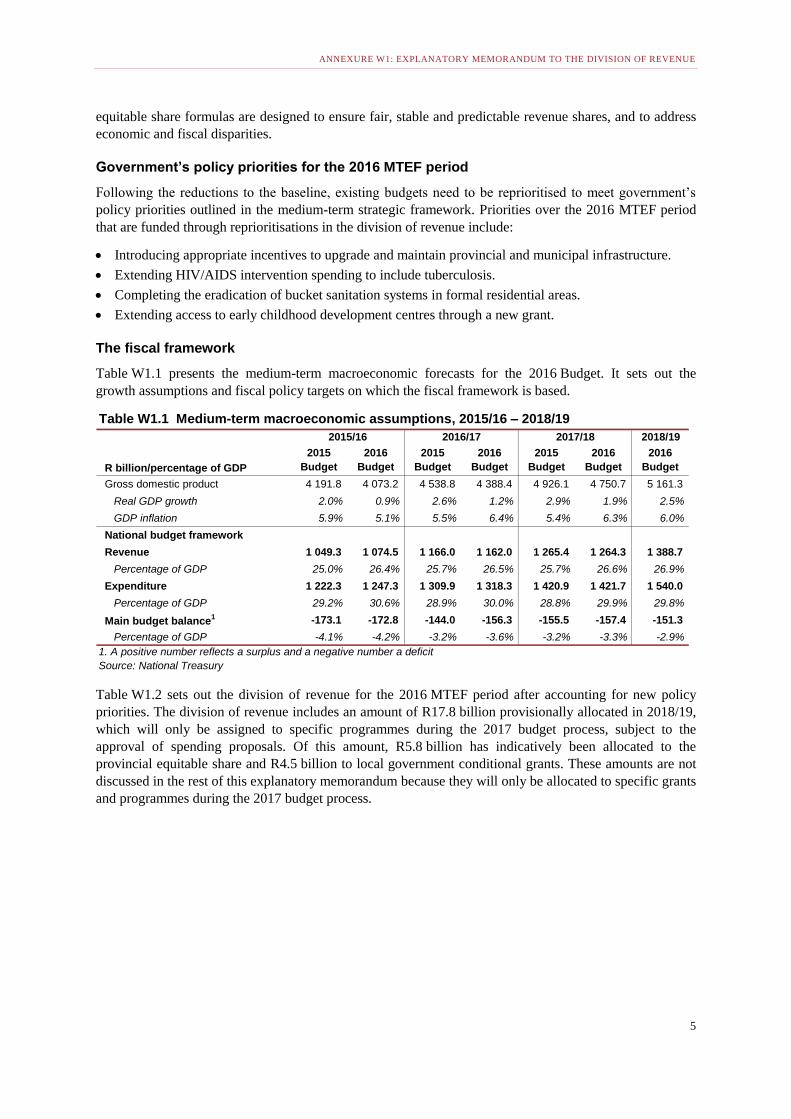
Table W1.1 presents the medium-term macroeconomic forecasts for the 2016 Budget. It sets out the
growth assumptions and fiscal policy targets on which the fiscal framework is based.
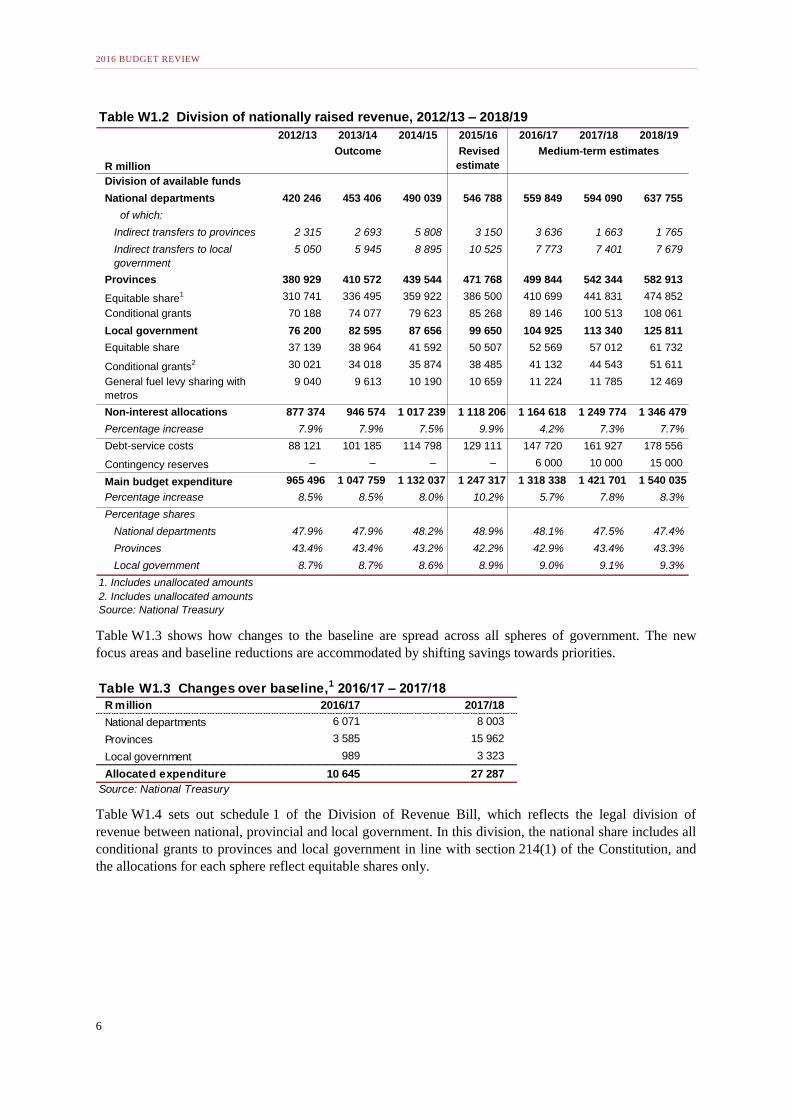
Table W1.2 sets out the division of revenue for the 2016 MTEF period after accounting for new policy
priorities. The division of revenue includes an amount of R17.8 billion provisionally allocated in 2018/19,
which will only be assigned to specific programmes during the 2017 budget process, subject to the
approval of spending proposals. Of this amount, R5.8 billion has indicatively been allocated to the
provincial equitable share and R4.5 billion to local government conditional grants. These amounts are not
discussed in the rest of this explanatory memorandum because they will only be allocated to specific grants
and programmes during the 2017 budget process.
Table W1.1 Medium-term macroeconomic assumptions, 2015/16 – 2018/19
2015/16 2016/17 2017/18 2018/19
R billion/percentage of GDP
2015
Budget
2016
Budget
2015
Budget
2016
Budget
2015
Budget
2016
Budget
2016
Budget
Gross domestic product 4 191.8 4 073.2 4 538.8 4 388.4 4 926.1 4 750.7 5 161.3
Real GDP growth 2.0% 0.9% 2.6% 1.2% 2.9% 1.9% 2.5%
GDP inflation 5.9% 5.1% 5.5% 6.4% 5.4% 6.3% 6.0%
National budget framework
Revenue 1 049.3 1 074.5 1 166.0 1 162.0 1 265.4 1 264.3 1 388.7
Percentage of GDP 25.0% 26.4% 25.7% 26.5% 25.7% 26.6% 26.9%
Expenditure 1 222.3 1 247.3 1 309.9 1 318.3 1 420.9 1 421.7 1 540.0
Percentage of GDP 29.2% 30.6% 28.9% 30.0% 28.8% 29.9% 29.8%
Main budget balance1 -173.1 -172.8 -144.0 -156.3 -155.5 -157.4 -151.3
Percentage of GDP -4.1% -4.2% -3.2% -3.6% -3.2% -3.3% -2.9%
1. A positive number reflects a surplus and a negative number a deficit
Source: National Treasury
2016 BUDGET REVIEW
6
Table W1.3 shows how changes to the baseline are spread across all spheres of government. The new
focus areas and baseline reductions are accommodated by shifting savings towards priorities.
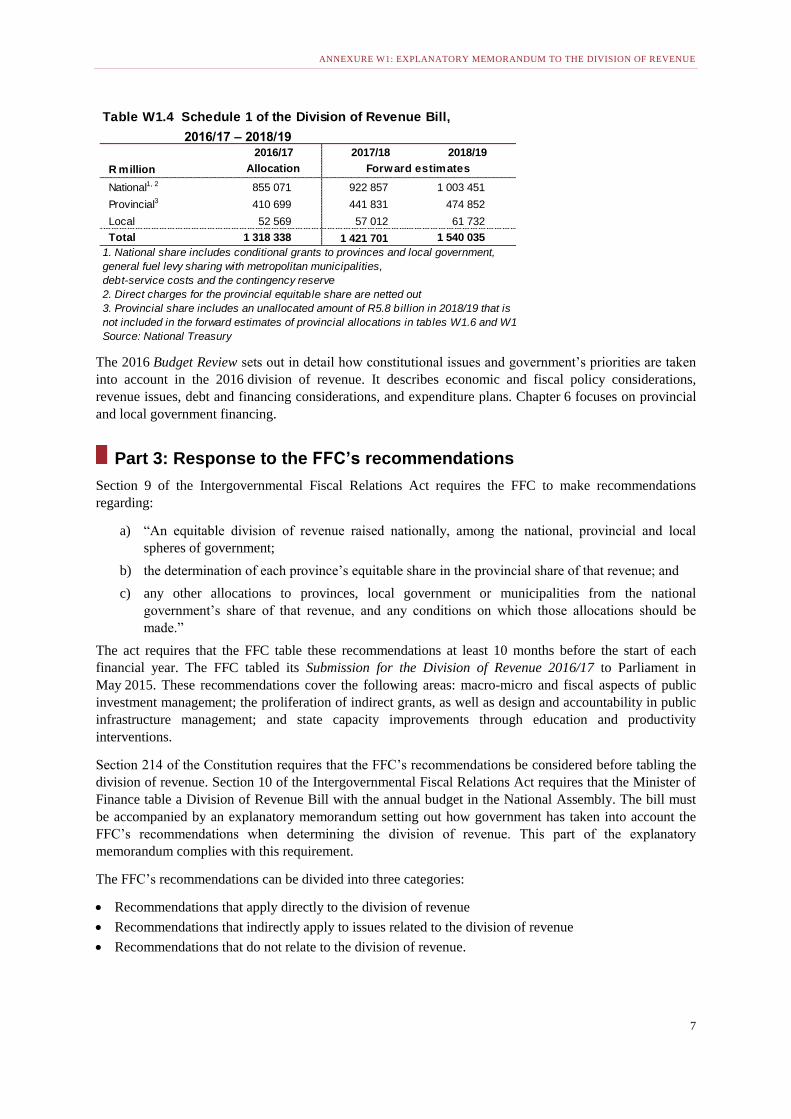
Table W1.4 sets out schedule 1 of the Division of Revenue Bill, which reflects the legal division of
revenue between national, provincial and local government. In this division, the national share includes all
conditional grants to provinces and local government in line with section 214(1) of the Constitution, and
the allocations for each sphere reflect equitable shares only.
Table W1.2 Division of nationally raised revenue, 2012/13 – 2018/19
2012/13 2013/14 2014/15 2015/16 2016/17 2017/18 2018/19
R million
Outcome Revised
estimate
Medium-term estimates
Division of available funds
National departments 420 246 453 406 490 039 546 788 559 849 594 090 637 755
of which:
Indirect transfers to provinces 2 315 2 693 5 808 3 150 3 636 1 663 1 765
Indirect transfers to local
government
5 050 5 945 8 895 10 525 7 773 7 401 7 679
Provinces 380 929 410 572 439 544 471 768 499 844 542 344 582 913
Equitable share1 310 741 336 495 359 922 386 500 410 699 441 831 474 852
Conditional grants 70 188 74 077 79 623 85 268 89 146 100 513 108 061
Local government 76 200 82 595 87 656 99 650 104 925 113 340 125 811
Equitable share 37 139 38 964 41 592 50 507 52 569 57 012 61 732
Conditional grants2 30 021 34 018 35 874 38 485 41 132 44 543 51 611
General fuel levy sharing with
metros
9 040 9 613 10 190 10 659 11 224 11 785 12 469
Non-interest allocations 877 374 946 574 1 017 239 1 118 206 1 164 618 1 249 774 1 346 479
Percentage increase 7.9% 7.9% 7.5% 9.9% 4.2% 7.3% 7.7%
Debt-service costs 88 121 101 185 114 798 129 111 147 720 161 927 178 556
Contingency reserves – – – – 6 000 10 000 15 000
Main budget expenditure 965 496 1 047 759 1 132 037 1 247 317 1 318 338 1 421 701 1 540 035
Percentage increase 8.5% 8.5% 8.0% 10.2% 5.7% 7.8% 8.3%
Percentage shares
National departments 47.9% 47.9% 48.2% 48.9% 48.1% 47.5% 47.4%
Provinces 43.4% 43.4% 43.2% 42.2% 42.9% 43.4% 43.3%
Local government 8.7% 8.7% 8.6% 8.9% 9.0% 9.1% 9.3%
1. Includes unallocated amounts
2. Includes unallocated amounts
Source: National Treasury
Table W1.3 Changes over baseline,1 2016/17 – 2017/18
R million 2016/17 2017/18
National departments 6 071 8 003
Provinces 3 585 15 962
Local government 989 3 323
Allocated expenditure 10 645 27 287
Source: National Treasury
ANNEXURE W1: EXPLANATORY MEMORANDUM TO THE DIVISION OF REVENUE
7
The 2016 Budget Review sets out in detail how constitutional issues and government’s priorities are taken
into account in the 2016 division of revenue. It describes economic and fiscal policy considerations,
revenue issues, debt and financing considerations, and expenditure plans. Chapter 6 focuses on provincial
and local government financing.
Part 3: Response to the FFC’s recommendations
Section 9 of the Intergovernmental Fiscal Relations Act requires the FFC to make recommendations
regarding:
a) “An equitable division of revenue raised nationally, among the national, provincial and local
spheres of government;
b) the determination of each province’s equitable share in the provincial share of that revenue; and
c) any other allocations to provinces, local government or municipalities from the national
government’s share of that revenue, and any conditions on which those allocations should be
made.”
The act requires that the FFC table these recommendations at least 10 months before the start of each
financial year. The FFC tabled its Submission for the Division of Revenue 2016/17 to Parliament in
May 2015. These recommendations cover the following areas: macro-micro and fiscal aspects of public
investment management; the proliferation of indirect grants, as well as design and accountability in public
infrastructure management; and state capacity improvements through education and productivity
interventions.
Section 214 of the Constitution requires that the FFC’s recommendations be considered before tabling the
division of revenue. Section 10 of the Intergovernmental Fiscal Relations Act requires that the Minister of
Finance table a Division of Revenue Bill with the annual budget in the National Assembly. The bill must
be accompanied by an explanatory memorandum setting out how government has taken into account the
FFC’s recommendations when determining the division of revenue. This part of the explanatory
memorandum complies with this requirement.
The FFC’s recommendations can be divided into three categories:
Recommendations that apply directly to the division of revenue
Recommendations that indirectly apply to issues related to the division of revenue
Recommendations that do not relate to the division of revenue.
Table W1.4 Schedule 1 of the Division of Revenue Bill,
2016/17 – 2018/192016/17 2017/18 2018/19
R million Allocation Forward estimates
National1, 2 855 071 922 857 1 003 451
Provincial3 410 699 441 831 474 852
Local 52 569 57 012 61 732
Total 1 318 338 1 421 701 1 540 035
1. National share includes conditional grants to provinces and local government,
general fuel levy sharing with metropolitan municipalities,
debt-service costs and the contingency reserve
2. Direct charges for the provincial equitable share are netted out
3. Provincial share includes an unallocated amount of R5.8 billion in 2018/19 that is
not included in the forward estimates of provincial allocations in tables W1.6 and W1.10
Source: National Treasury

2016 BUDGET REVIEW
8
Government’s responses to the first and second categories are provided below. The relevant national
departments are considering the recommendations that do not relate to the division of revenue, and they
will respond directly to the FFC.
Recommendations that apply directly and indirectly to the division of revenue
Chapter 1: Responding to South Africa’s infrastructure challenges
Infrastructure-led growth that provides the conditions for the future prosperity of all South
Africans
The FFC recommends that government “redesigns capital conditional grants by:
(a) Allowing for payment of infrastructure upstream costs of provinces and municipalities;
(b) Making capital grants pledgeable where a long-term capital strategy is in place; and
(c) Extending the existing incentive/support for long-term capital planning.”
Government response
Government continuously evaluates conditional grants to both provincial and local government. Its
responses to the three points raised are detailed below.
Several grants allow for upstream costs (for example, transport planning or project management capacity).
However, government is cautious of diverting excessive funds away from capital investment, which is why
the need for upstream costs is evaluated on a grant-by-grant and differentiated basis.
The Division of Revenue Act does allow for pledging of municipal grants when a long-term capital
strategy is in place. However, because borrowing should largely fund infrastructure that contributes to
future revenues, municipal own revenues should be used to borrow against more than grants.
Given that provinces invest in capital projects that serve as public goods, and they have limited revenue-
raising potential, borrowing is not encouraged, but is approved under special circumstances.
Several provincial infrastructure grants (including grants for health, education and roads) are allocated
based on the submission of plans two years in advance to encourage longer-term planning.
The built environment performance plans required by the integrated city development grant already
incentivise cities to engage in long-term planning. The review of local government infrastructure grants
will introduce a number of reforms to enhance longer-term planning. Government will work with the FFC
to implement the proposed solutions.
Efficiency and alignment of infrastructure procurement and management
The FFC recommends that government “enhance efficiency by ensuring alignment between infrastructure
procurement planning, contract awards and management and other elements of infrastructure
management.”
Government response
Government agrees that conditional grants can and should incentivise improved practices beyond the
transfer of funds.
Each province has to develop an approved framework to implement the infrastructure delivery
management system, and several provincial grants make funding provisions to capacitate infrastructure
units.
In local government, an incentive grant to metropolitan municipalities encourages integration across
infrastructure management. In addition, the review of local government infrastructure grants has
introduced reforms to improve asset management practices under the municipal infrastructure grant.
ANNEXURE W1: EXPLANATORY MEMORANDUM TO THE DIVISION OF REVENUE
9
But building capacity and improving infrastructure management practices takes time, and grants are just
one way to achieve these goals. There are many other interventions that aim to strengthen institutions and
enhance capacity across government, including the Office of the Chief Procurement Officer and the
Municipal Infrastructure Support Agent.
Chapter 2: Economic growth effects of municipal capital spending
Improving economic growth effects of municipal capital expenditure
The FFC recommends that, “Grant allocations for infrastructure investment reflect the prioritisation (or
weighting) of growth-enhancing infrastructure programmes, to enable municipalities to play their
(envisaged critical) role in promoting economic development and growth.”
Government response
Conditional grants are primarily allocated to subsidise capital costs on behalf of the poor, who cannot
afford to pay rates and tariffs. Economic infrastructure should largely be funded from own revenues
through the use of cost-reflective tariffs and debt-financing.
Government does acknowledge the substantial growth-enhancing effects of infrastructure investments and
has emphasised the importance of economic growth in recent reforms to urban grants and the municipal
infrastructure grant. Government is also working with municipalities to increase their ability to access
long-term financing so they can increase their own funding of infrastructure investments.
Long-term sustainability of infrastructure for local economic growth
The FFC recommends that “Government establishes either an incentive grant or a reserve fund for asset
management, to ensure the long-term sustainability of critical socioeconomic infrastructure and enhance
local economic growth.”
Government response
Government agrees that improved municipal asset management is necessary to continue the gains made in
service delivery in recent years. The local government equitable share includes a 10 per cent maintenance
allocation on behalf of indigent households, while all other consumers are expected to pay fully cost-
reflective tariffs to cover the capital, operations, maintenance and depreciation costs of infrastructure. This
means that additional maintenance funding would be double-funding. Government is therefore proposing
to incentivise better prioritisation of existing maintenance funds.
Grants, however, are increasingly shifting towards investment in both new and existing infrastructure. A
more appropriate mix of capital funding will help address the difficulties experienced in asset management
and ensure the long-term sustainability of infrastructure.
Transitional capacity-building grant
The FFC recommends that government “establish a transitional capacity-building grant to fund technical
assistance to enable municipalities to prepare and implement credible infrastructure asset management
plans.”
Government response
Government agrees that technical assistance is often required to develop these plans and while there are
municipalities that may need this support, many have already developed appropriate asset management
strategies and should not be disincentivised. The Municipal Infrastructure Support Agent, the Department
of Cooperative Governance and the local government infrastructure grant review are developing changes
to the 2016 municipal infrastructure grant framework that will promote better use of the technical
assistance and project management funding available in the grant.

2016 BUDGET REVIEW
10
Assistance need not be financial. Government has many initiatives to improve municipal asset
management practices. For example, the Municipal Infrastructure Support Agent not only assigns
engineers to municipalities to improve these systems, but it has also developed a municipal infrastructure
performance management information system, rolled out the infrastructure delivery management system
and will introduce a municipal standard chart of accounts from 1 July 2017.
Chapter 3: A review of direct and indirect conditional grants – the case of selected conditional
grants
Management of direct and indirect grants
The FFC recommends that, “National Treasury and line departments consider the use of indirect grants as
a measure of last resort while continuing to build capacity in provinces and municipalities.”
Government response
Government agrees that indirect grants are not always a sustainable or effective way of improving service
delivery. They must be seen as a last resort and transitional in nature. In recent years, direct grant spending
has proven to be higher than indirect grant spending in several cases, leading to a number of provincial and
local government grants shifting from indirect to direct grants.
Criteria to guide scheduling of grants
The FFC recommends that, “Clear criteria that will guide scheduling of conditional grants should be
developed and must take into account (a) the historical financial performance, (b) non-financial
performance and (c) the time period before converting a direct grant to an indirect grant.”
Government response
Government agrees that criteria to guide the appropriate scheduling of conditional grants would be a useful
tool. Historical performance and non-financial data would be needed to determine scheduling, while a time
period for the conversion of a grant from direct to indirect would ensure stability. Government supports a
differentiated approach, which has led to increasing splits in grants and shifts between direct and indirect
grants in recent years. In collaboration with the FFC, government aims to develop clear guidelines on the
appropriate scheduling of grants from inception.
Chapter 4: Accountability in infrastructure delivery – the case of the local government sphere
Accountability in local government infrastructure delivery
The FFC recommends that, “National Treasury and the Department of Cooperative Governance develop an
accountability framework for indirect infrastructure grants to identify accountability lines, accountability
mechanisms, accountability enforcement mechanisms, and spell out the consequences for undermining the
accountability arrangements.”
Government response
Government welcomes this recommendation and is seeking to establish such a framework. Although clear
guidance on budget preparation, allocation and evaluation for both direct and indirect grants exists,
accountability lines are not as explicit for indirect grants as they are for direct grants. Ensuring that
appropriate monitoring and evaluation systems and a legal framework to manage indirect grants are in
place is a priority.

ANNEXURE W1: EXPLANATORY MEMORANDUM TO THE DIVISION OF REVENUE
11
Chapter 5: Fiscal arrangements for financing early childhood development infrastructure
Capital subsidy for constructing and upgrading early childhood development facilities
The FFC recommends that, “Government provides a full or partial capital subsidy for constructing and/or
upgrading community- and non-profit-organisation-based early childhood development facilities, through
the municipal infrastructure grant. The funding will facilitate compliance with the required infrastructure
norms and standards, ensure that capital expenditure for early childhood development is carried out
through municipalities and minimise inequities in quality standards and service levels.”
Government response
The research and recommendations on this vital, complex sector are well received. However, the absence
of clarity around the functional arrangements and the law regarding spending on non-state assets limits
government’s options in providing an effective capital subsidy for early childhood development facilities.
Government has indicatively allocated funds from 2017/18 for a new provincial conditional grant to
support improved early childhood development services, including improved infrastructure. Government
also supports the potential use of the community services component of the municipal infrastructure grant
to fund the provision of facilities for early childhood development. Further work is needed to guide
municipalities on how best to invest in early childhood development facilities.
Chapter 6: Public-sector productivity – the case of secondary education
Improving public-sector productivity
The FFC recommends that, “The Division of Revenue Act implements the finalised framework on
measuring productivity. This may require the implementing agent of a conditional grant to report on the
attainment of both quantitative and qualitative indicators of an output, including productivity indicators
that track improvements of the service over time.”
Government response
Government agrees that improvements in productivity are necessary to deliver value for money and
enhanced service delivery. Reporting requirements for conditional grants can be useful sources of
information on productivity. Once a productivity framework, as proposed in another FFC recommendation,
is finalised, government will review how it can best be applied to the Division of Revenue Act’s clauses
and grant frameworks.
Part 4: Provincial allocations
Sections 214 and 227 of the Constitution require that an equitable share of nationally raised revenue be
allocated to provincial government to enable it to provide basic services and perform its allocated
functions.
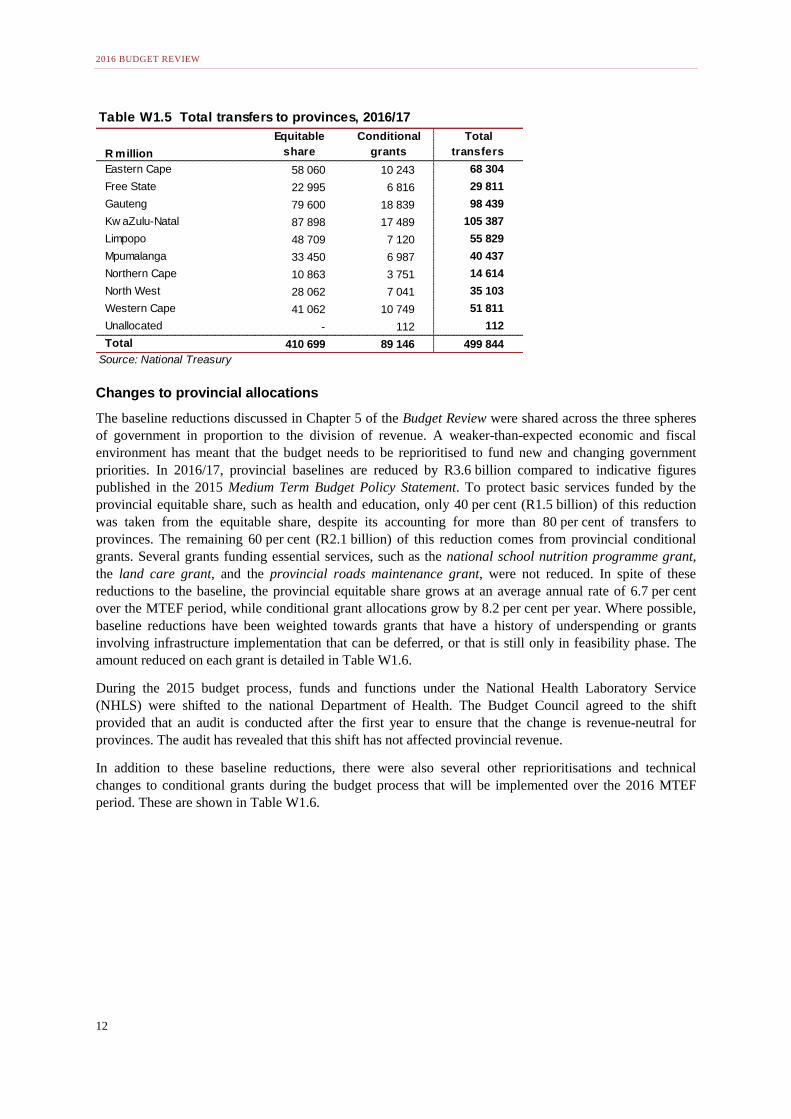
National transfers to provinces increase from R471.8 billion in 2015/16 to R499.8 billion in 2016/17. Over
the MTEF period, provincial transfers will grow at an average annual rate of 6.9 per cent to R577.1 billion
in 2018/19. Table W1.5 sets out the total transfers to provinces for 2016/17. A total of R410.7 billion is
allocated to the provincial equitable share and R89.1 billion to conditional grants, which includes an
unallocated R111.5 million for the provincial disaster grant.
2016 BUDGET REVIEW
12
Changes to provincial allocations
The baseline reductions discussed in Chapter 5 of the Budget Review were shared across the three spheres
of government in proportion to the division of revenue. A weaker-than-expected economic and fiscal
environment has meant that the budget needs to be reprioritised to fund new and changing government
priorities. In 2016/17, provincial baselines are reduced by R3.6 billion compared to indicative figures
published in the 2015 Medium Term Budget Policy Statement. To protect basic services funded by the
provincial equitable share, such as health and education, only 40 per cent (R1.5 billion) of this reduction
was taken from the equitable share, despite its accounting for more than 80 per cent of transfers to
provinces. The remaining 60 per cent (R2.1 billion) of this reduction comes from provincial conditional
grants. Several grants funding essential services, such as the national school nutrition programme grant,
the land care grant, and the provincial roads maintenance grant, were not reduced. In spite of these
reductions to the baseline, the provincial equitable share grows at an average annual rate of 6.7 per cent
over the MTEF period, while conditional grant allocations grow by 8.2 per cent per year. Where possible,
baseline reductions have been weighted towards grants that have a history of underspending or grants
involving infrastructure implementation that can be deferred, or that is still only in feasibility phase. The
amount reduced on each grant is detailed in Table W1.6.
During the 2015 budget process, funds and functions under the National Health Laboratory Service
(NHLS) were shifted to the national Department of Health. The Budget Council agreed to the shift
provided that an audit is conducted after the first year to ensure that the change is revenue-neutral for
provinces. The audit has revealed that this shift has not affected provincial revenue.
In addition to these baseline reductions, there were also several other reprioritisations and technical
changes to conditional grants during the budget process that will be implemented over the 2016 MTEF
period. These are shown in Table W1.6.
Table W1.5 Total transfers to provinces, 2016/17
R million
Equitable
share
Conditional
grants
Total
transfers
Eastern Cape 58 060 10 243 68 304
Free State 22 995 6 816 29 811
Gauteng 79 600 18 839 98 439
Kw aZulu-Natal 87 898 17 489 105 387
Limpopo 48 709 7 120 55 829
Mpumalanga 33 450 6 987 40 437
Northern Cape 10 863 3 751 14 614
North West 28 062 7 041 35 103
Western Cape 41 062 10 749 51 811
Unallocated - 112 112
Total 410 699 89 146 499 844
Source: National Treasury
ANNEXURE W1: EXPLANATORY MEMORANDUM TO THE DIVISION OF REVENUE
13
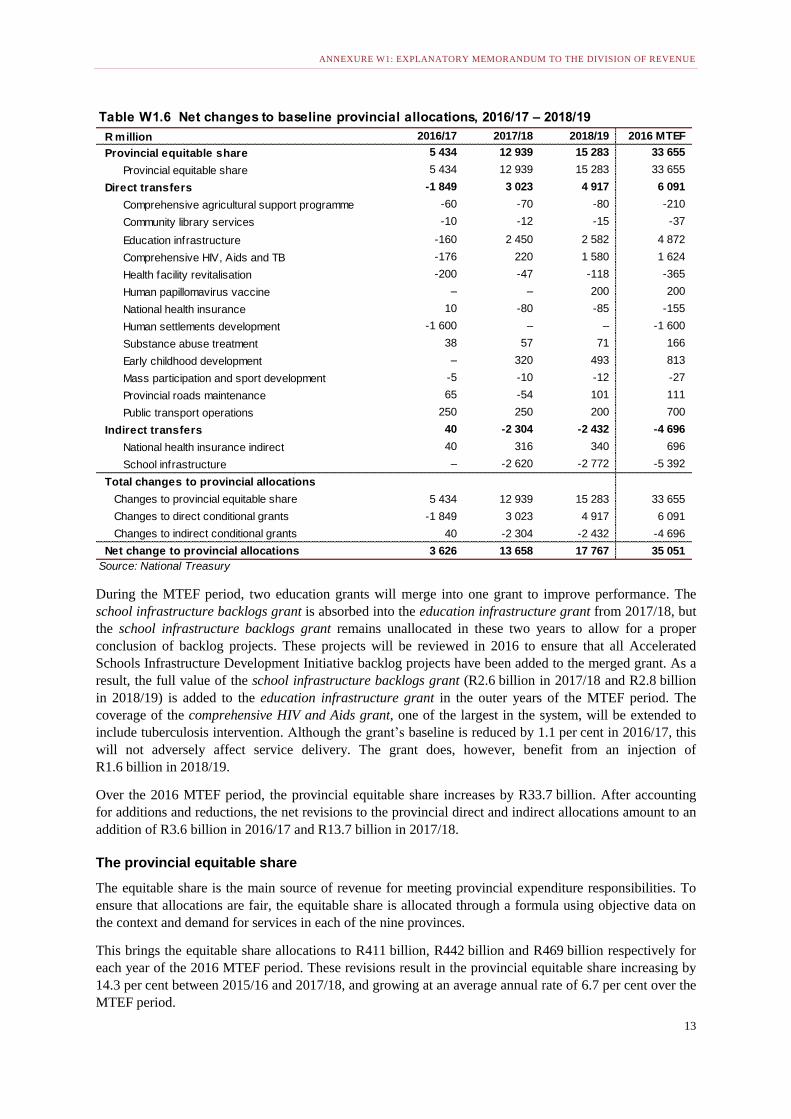
During the MTEF period, two education grants will merge into one grant to improve performance. The
school infrastructure backlogs grant is absorbed into the education infrastructure grant from 2017/18, but
the school infrastructure backlogs grant remains unallocated in these two years to allow for a proper
conclusion of backlog projects. These projects will be reviewed in 2016 to ensure that all Accelerated
Schools Infrastructure Development Initiative backlog projects have been added to the merged grant. As a
result, the full value of the school infrastructure backlogs grant (R2.6 billion in 2017/18 and R2.8 billion
in 2018/19) is added to the education infrastructure grant in the outer years of the MTEF period. The
coverage of the comprehensive HIV and Aids grant, one of the largest in the system, will be extended to
include tuberculosis intervention. Although the grant’s baseline is reduced by 1.1 per cent in 2016/17, this
will not adversely affect service delivery. The grant does, however, benefit from an injection of
R1.6 billion in 2018/19.
Over the 2016 MTEF period, the provincial equitable share increases by R33.7 billion. After accounting
for additions and reductions, the net revisions to the provincial direct and indirect allocations amount to an
addition of R3.6 billion in 2016/17 and R13.7 billion in 2017/18.
The provincial equitable share
The equitable share is the main source of revenue for meeting provincial expenditure responsibilities. To
ensure that allocations are fair, the equitable share is allocated through a formula using objective data on
the context and demand for services in each of the nine provinces.
This brings the equitable share allocations to R411 billion, R442 billion and R469 billion respectively for
each year of the 2016 MTEF period. These revisions result in the provincial equitable share increasing by
14.3 per cent between 2015/16 and 2017/18, and growing at an average annual rate of 6.7 per cent over the
MTEF period.
Table W1.6 Net changes to baseline provincial allocations, 2016/17 – 2018/19
R million 2016/17 2017/18 2018/19 2016 MTEF
Provincial equitable share 5 434 12 939 15 283 33 655
Provincial equitable share 5 434 12 939 15 283 33 655
Direct transfers -1 849 3 023 4 917 6 091
Comprehensive agricultural support programme -60 -70 -80 -210
Community library services -10 -12 -15 -37
Education infrastructure -160 2 450 2 582 4 872
Comprehensive HIV, Aids and TB -176 220 1 580 1 624
Health facility revitalisation -200 -47 -118 -365
Human papillomavirus vaccine – – 200 200
National health insurance 10 -80 -85 -155
Human settlements development -1 600 – – -1 600
Substance abuse treatment 38 57 71 166
Early childhood development – 320 493 813
Mass participation and sport development -5 -10 -12 -27
Provincial roads maintenance 65 -54 101 111
Public transport operations 250 250 200 700
Indirect transfers 40 -2 304 -2 432 -4 696
National health insurance indirect 40 316 340 696
School infrastructure – -2 620 -2 772 -5 392
Total changes to provincial allocations
Changes to provincial equitable share 5 434 12 939 15 283 33 655
Changes to direct conditional grants -1 849 3 023 4 917 6 091
Changes to indirect conditional grants 40 -2 304 -2 432 -4 696
Net change to provincial allocations 3 626 13 658 17 767 35 051
Source: National Treasury
2016 BUDGET REVIEW
14
Allocations calculated outside the equitable share formula
The equitable share includes an amount of R2.3 billion in 2016/17 that was previously part of the
devolution of property rate funds grant. This grant, which funded provinces’ municipal charges on
provincial properties that were previously administered by national government, has been transferred as
part of the provincial equitable share since 2013/14. These funds will be fully phased-in during 2016/17
and will be allocated using the provincial equitable share formula.
Over the 2016 MTEF period, funds from the provincial equitable share will be used to extend the human
papillomavirus component of the national health insurance indirect grant and ensure the programme
continues.
The equitable share formula
The provincial equitable share formula is reviewed and updated with new data annually. For the
2016 MTEF, the formula has been updated with data from the 2015 mid-year population estimates
published by Statistics South Africa; the Department of Basic Education’s preliminary 2015 data on school
enrolment; data from the 2014 General Household Survey for medical aid coverage; and data from the
health sector and the Risk Equalisation Fund for the risk-adjusted capitation index. Because the formula is
largely population-driven, the allocations capture shifts in population across provinces, which results in
changes in the relative demand for public services across these areas. The effect of these updates on the
provincial equitable share is phased in over three years (2016/17 to 2018/19).
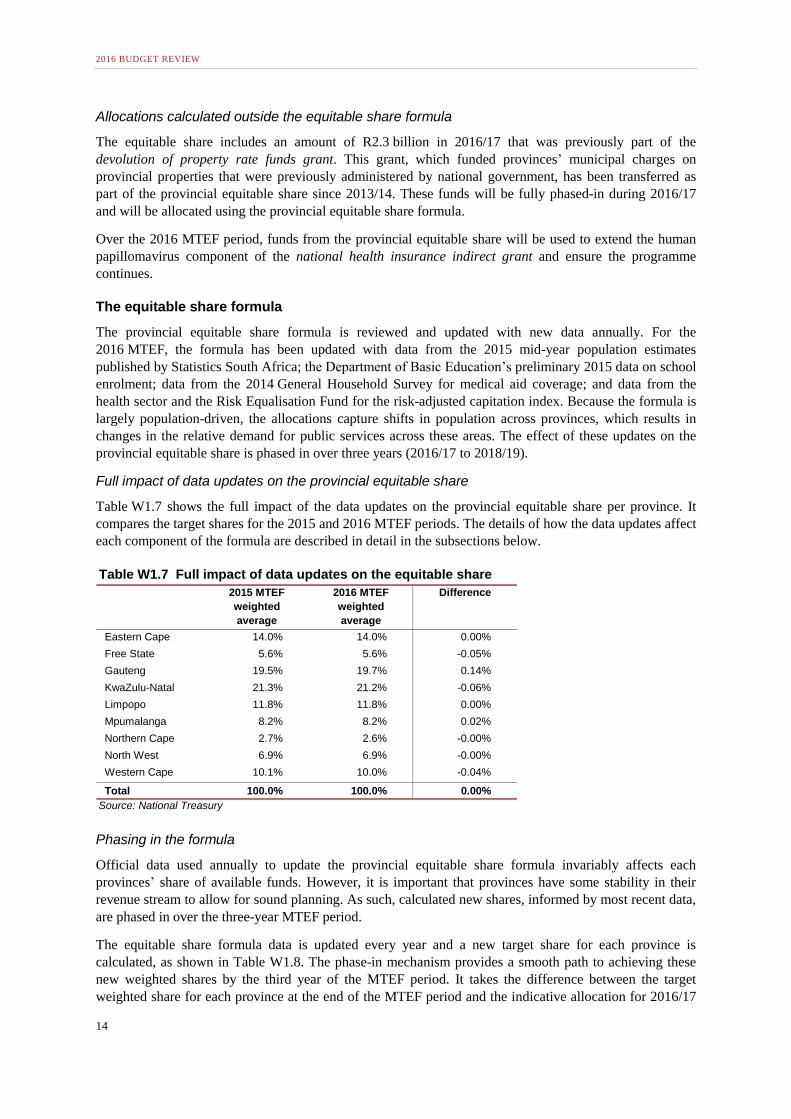
Full impact of data updates on the provincial equitable share
Table W1.7 shows the full impact of the data updates on the provincial equitable share per province. It
compares the target shares for the 2015 and 2016 MTEF periods. The details of how the data updates affect
each component of the formula are described in detail in the subsections below.
Phasing in the formula
Official data used annually to update the provincial equitable share formula invariably affects each
provinces’ share of available funds. However, it is important that provinces have some stability in their
revenue stream to allow for sound planning. As such, calculated new shares, informed by most recent data,
are phased in over the three-year MTEF period.
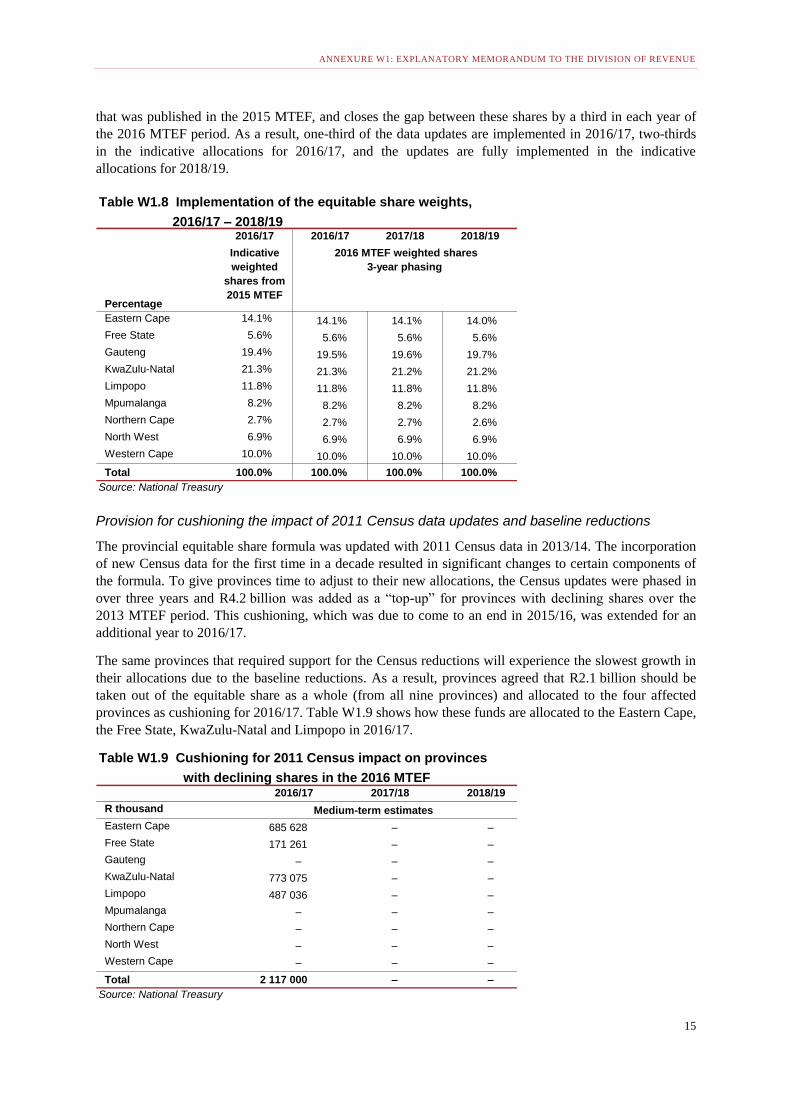
The equitable share formula data is updated every year and a new target share for each province is
calculated, as shown in Table W1.8. The phase-in mechanism provides a smooth path to achieving these
new weighted shares by the third year of the MTEF period. It takes the difference between the target
weighted share for each province at the end of the MTEF period and the indicative allocation for 2016/17
Table W1.7 Full impact of data updates on the equitable share
2015 MTEF
weighted
average
2016 MTEF
weighted
average
Difference
Eastern Cape 14.0% 14.0% 0.00%
Free State 5.6% 5.6% -0.05%
Gauteng 19.5% 19.7% 0.14%
KwaZulu-Natal 21.3% 21.2% -0.06%
Limpopo 11.8% 11.8% 0.00%
Mpumalanga 8.2% 8.2% 0.02%
Northern Cape 2.7% 2.6% -0.00%
North West 6.9% 6.9% -0.00%
Western Cape 10.1% 10.0% -0.04%
Total 100.0% 100.0% 0.00%
Source: National Treasury
ANNEXURE W1: EXPLANATORY MEMORANDUM TO THE DIVISION OF REVENUE
15
that was published in the 2015 MTEF, and closes the gap between these shares by a third in each year of
the 2016 MTEF period. As a result, one-third of the data updates are implemented in 2016/17, two-thirds
in the indicative allocations for 2016/17, and the updates are fully implemented in the indicative
allocations for 2018/19.
Provision for cushioning the impact of 2011 Census data updates and baseline reductions
The provincial equitable share formula was updated with 2011 Census data in 2013/14. The incorporation
of new Census data for the first time in a decade resulted in significant changes to certain components of
the formula. To give provinces time to adjust to their new allocations, the Census updates were phased in
over three years and R4.2 billion was added as a “top-up” for provinces with declining shares over the
2013 MTEF period. This cushioning, which was due to come to an end in 2015/16, was extended for an
additional year to 2016/17.
The same provinces that required support for the Census reductions will experience the slowest growth in
their allocations due to the baseline reductions. As a result, provinces agreed that R2.1 billion should be
taken out of the equitable share as a whole (from all nine provinces) and allocated to the four affected
provinces as cushioning for 2016/17. Table W1.9 shows how these funds are allocated to the Eastern Cape,
the Free State, KwaZulu-Natal and Limpopo in 2016/17.
Table W1.8 Implementation of the equitable share weights,
2016/17 – 2018/192016/17 2016/17 2017/18 2018/19
Percentage
Eastern Cape 14.1% 14.1% 14.1% 14.0%
Free State 5.6% 5.6% 5.6% 5.6%
Gauteng 19.4% 19.5% 19.6% 19.7%
KwaZulu-Natal 21.3% 21.3% 21.2% 21.2%
Limpopo 11.8% 11.8% 11.8% 11.8%
Mpumalanga 8.2% 8.2% 8.2% 8.2%
Northern Cape 2.7% 2.7% 2.7% 2.6%
North West 6.9% 6.9% 6.9% 6.9%
Western Cape 10.0% 10.0% 10.0% 10.0%
Total 100.0% 100.0% 100.0% 100.0%
Source: National Treasury
Indicative
weighted
shares from
2015 MTEF
2016 MTEF weighted shares
3-year phasing
Table W1.9 Cushioning for 2011 Census impact on provinces
with declining shares in the 2016 MTEF2016/17 2017/18 2018/19
R thousand Medium-term estimates
Eastern Cape 685 628 – –
Free State 171 261 – –
Gauteng – – –
KwaZulu-Natal 773 075 – –
Limpopo 487 036 – –
Mpumalanga – – –
Northern Cape – – –
North West – – –
Western Cape – – –
Total 2 117 000 – –
Source: National Treasury
2016 BUDGET REVIEW
16
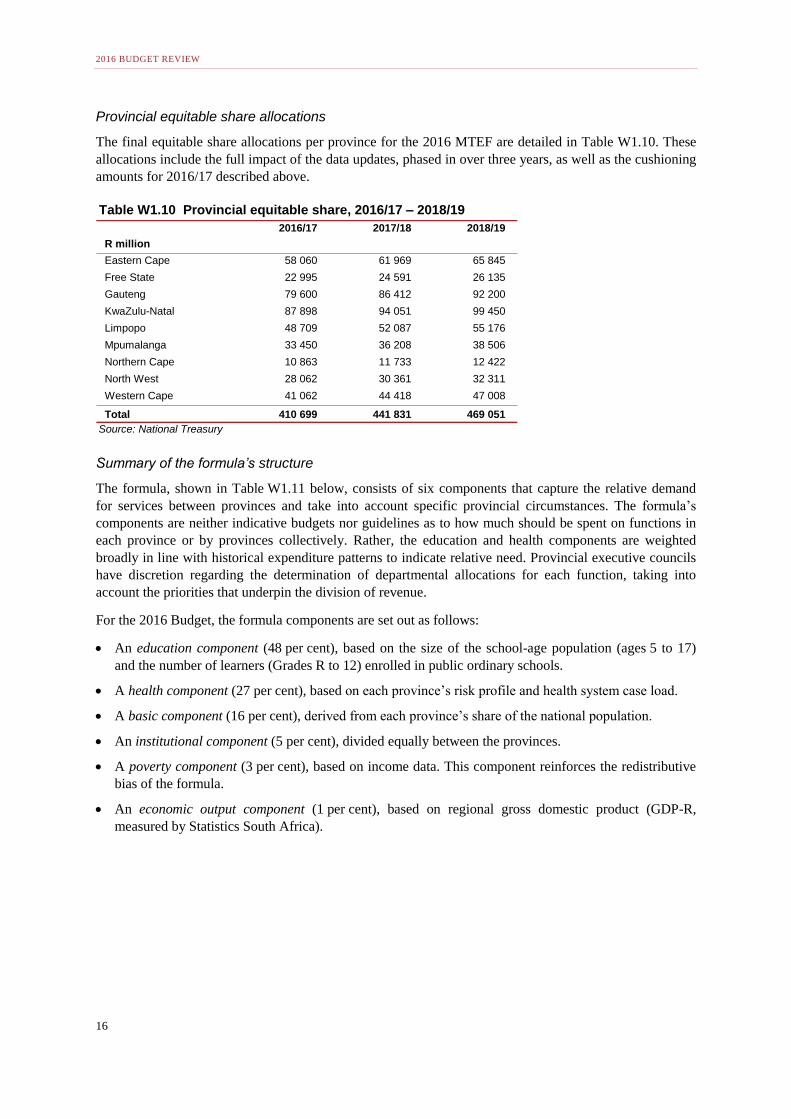
Provincial equitable share allocations
The final equitable share allocations per province for the 2016 MTEF are detailed in Table W1.10. These
allocations include the full impact of the data updates, phased in over three years, as well as the cushioning
amounts for 2016/17 described above.
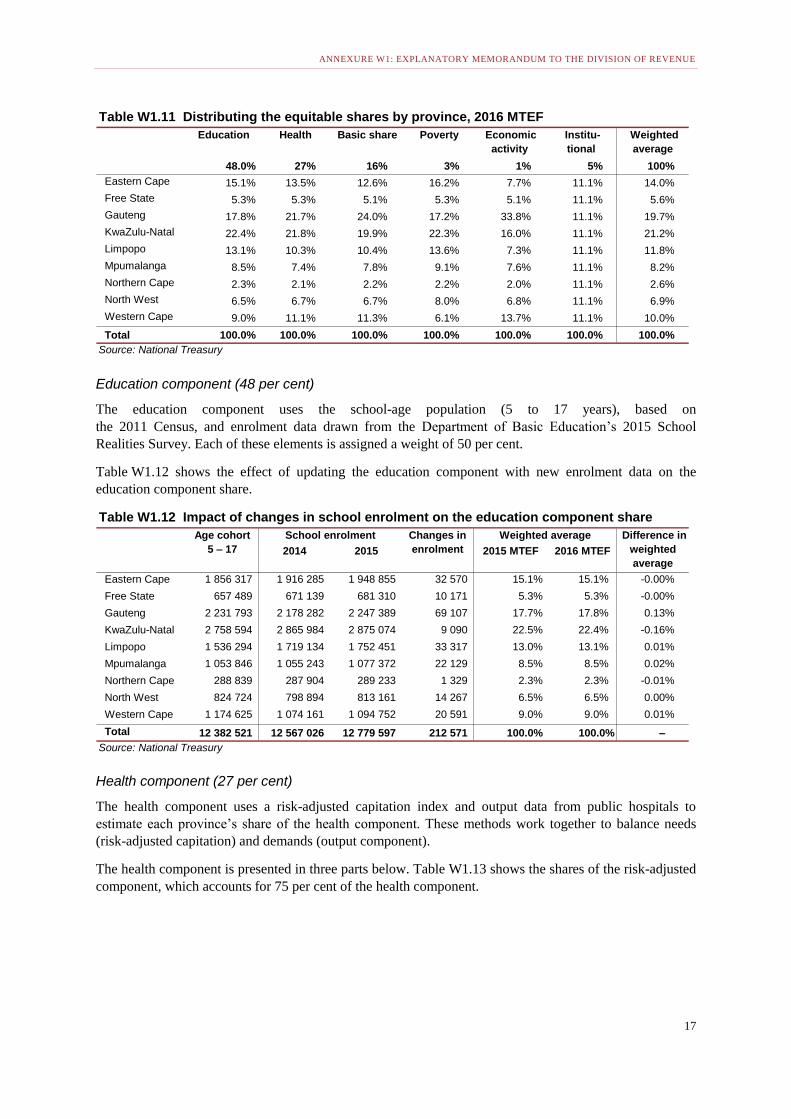
Summary of the formula’s structure
The formula, shown in Table W1.11 below, consists of six components that capture the relative demand
for services between provinces and take into account specific provincial circumstances. The formula’s
components are neither indicative budgets nor guidelines as to how much should be spent on functions in
each province or by provinces collectively. Rather, the education and health components are weighted
broadly in line with historical expenditure patterns to indicate relative need. Provincial executive councils
have discretion regarding the determination of departmental allocations for each function, taking into
account the priorities that underpin the division of revenue.
For the 2016 Budget, the formula components are set out as follows:
An education component (48 per cent), based on the size of the school-age population (ages 5 to 17)
and the number of learners (Grades R to 12) enrolled in public ordinary schools.
A health component (27 per cent), based on each province’s risk profile and health system case load.
A basic component (16 per cent), derived from each province’s share of the national population.
An institutional component (5 per cent), divided equally between the provinces.
A poverty component (3 per cent), based on income data. This component reinforces the redistributive
bias of the formula.
An economic output component (1 per cent), based on regional gross domestic product (GDP-R,
measured by Statistics South Africa).
Table W1.10 Provincial equitable share, 2016/17 – 2018/19
2016/17 2017/18 2018/19
R million
Eastern Cape 58 060 61 969 65 845
Free State 22 995 24 591 26 135
Gauteng 79 600 86 412 92 200
KwaZulu-Natal 87 898 94 051 99 450
Limpopo 48 709 52 087 55 176
Mpumalanga 33 450 36 208 38 506
Northern Cape 10 863 11 733 12 422
North West 28 062 30 361 32 311
Western Cape 41 062 44 418 47 008
Total 410 699 441 831 469 051
Source: National Treasury
ANNEXURE W1: EXPLANATORY MEMORANDUM TO THE DIVISION OF REVENUE
17
Education component (48 per cent)
The education component uses the school-age population (5 to 17 years), based on
the 2011 Census, and enrolment data drawn from the Department of Basic Education’s 2015 School
Realities Survey. Each of these elements is assigned a weight of 50 per cent.
Table W1.12 shows the effect of updating the education component with new enrolment data on the
education component share.
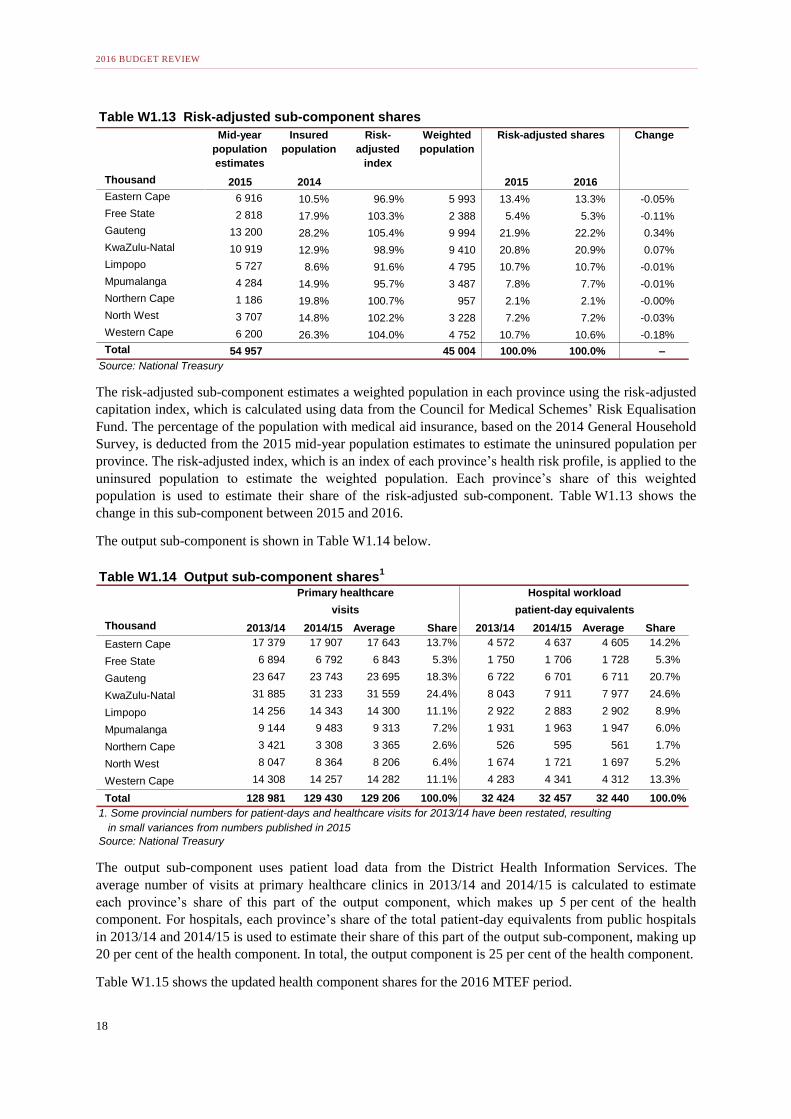
Health component (27 per cent)
The health component uses a risk-adjusted capitation index and output data from public hospitals to
estimate each province’s share of the health component. These methods work together to balance needs
(risk-adjusted capitation) and demands (output component).
The health component is presented in three parts below. Table W1.13 shows the shares of the risk-adjusted
component, which accounts for 75 per cent of the health component.
Table W1.11 Distributing the equitable shares by province, 2016 MTEF
Education Health Basic share Poverty Economic
activity
Institu-
tional
Weighted
average
48.0% 27% 16% 3% 1% 5% 100%
Eastern Cape 15.1% 13.5% 12.6% 16.2% 7.7% 11.1% 14.0%
Free State 5.3% 5.3% 5.1% 5.3% 5.1% 11.1% 5.6%
Gauteng 17.8% 21.7% 24.0% 17.2% 33.8% 11.1% 19.7%
KwaZulu-Natal 22.4% 21.8% 19.9% 22.3% 16.0% 11.1% 21.2%
Limpopo 13.1% 10.3% 10.4% 13.6% 7.3% 11.1% 11.8%
Mpumalanga 8.5% 7.4% 7.8% 9.1% 7.6% 11.1% 8.2%
Northern Cape 2.3% 2.1% 2.2% 2.2% 2.0% 11.1% 2.6%
North West 6.5% 6.7% 6.7% 8.0% 6.8% 11.1% 6.9%
Western Cape 9.0% 11.1% 11.3% 6.1% 13.7% 11.1% 10.0%
Total 100.0% 100.0% 100.0% 100.0% 100.0% 100.0% 100.0%
Source: National Treasury
Table W1.12 Impact of changes in school enrolment on the education component share
2014 2015 2015 MTEF 2016 MTEF
Eastern Cape 1 856 317 1 916 285 1 948 855 32 570 15.1% 15.1% -0.00%
Free State 657 489 671 139 681 310 10 171 5.3% 5.3% -0.00%
Gauteng 2 231 793 2 178 282 2 247 389 69 107 17.7% 17.8% 0.13%
KwaZulu-Natal 2 758 594 2 865 984 2 875 074 9 090 22.5% 22.4% -0.16%
Limpopo 1 536 294 1 719 134 1 752 451 33 317 13.0% 13.1% 0.01%
Mpumalanga 1 053 846 1 055 243 1 077 372 22 129 8.5% 8.5% 0.02%
Northern Cape 288 839 287 904 289 233 1 329 2.3% 2.3% -0.01%
North West 824 724 798 894 813 161 14 267 6.5% 6.5% 0.00%
Western Cape 1 174 625 1 074 161 1 094 752 20 591 9.0% 9.0% 0.01%
Total 12 382 521 12 567 026 12 779 597 212 571 100.0% 100.0% –
Source: National Treasury
Age cohort
5 – 17
School enrolment Changes in
enrolment
Weighted average Difference in
weighted
average
2016 BUDGET REVIEW
18
The risk-adjusted sub-component estimates a weighted population in each province using the risk-adjusted
capitation index, which is calculated using data from the Council for Medical Schemes’ Risk Equalisation
Fund. The percentage of the population with medical aid insurance, based on the 2014 General Household
Survey, is deducted from the 2015 mid-year population estimates to estimate the uninsured population per
province. The risk-adjusted index, which is an index of each province’s health risk profile, is applied to the
uninsured population to estimate the weighted population. Each province’s share of this weighted
population is used to estimate their share of the risk-adjusted sub-component. Table W1.13 shows the
change in this sub-component between 2015 and 2016.
The output sub-component is shown in Table W1.14 below.
The output sub-component uses patient load data from the District Health Information Services. The
average number of visits at primary healthcare clinics in 2013/14 and 2014/15 is calculated to estimate
each province’s share of this part of the output component, which makes up 5 per cent of the health
component. For hospitals, each province’s share of the total patient-day equivalents from public hospitals
in 2013/14 and 2014/15 is used to estimate their share of this part of the output sub-component, making up
20 per cent of the health component. In total, the output component is 25 per cent of the health component.
Table W1.15 shows the updated health component shares for the 2016 MTEF period.
Table W1.13 Risk-adjusted sub-component shares
Mid-year
population
estimates
Insured
population
Risk-
adjusted
index
Weighted
population
Risk-adjusted shares Change
Thousand 2015 2014 2015 2016
Eastern Cape 6 916 10.5% 96.9% 5 993 13.4% 13.3% -0.05%
Free State 2 818 17.9% 103.3% 2 388 5.4% 5.3% -0.11%
Gauteng 13 200 28.2% 105.4% 9 994 21.9% 22.2% 0.34%
KwaZulu-Natal 10 919 12.9% 98.9% 9 410 20.8% 20.9% 0.07%
Limpopo 5 727 8.6% 91.6% 4 795 10.7% 10.7% -0.01%
Mpumalanga 4 284 14.9% 95.7% 3 487 7.8% 7.7% -0.01%
Northern Cape 1 186 19.8% 100.7% 957 2.1% 2.1% -0.00%
North West 3 707 14.8% 102.2% 3 228 7.2% 7.2% -0.03%
Western Cape 6 200 26.3% 104.0% 4 752 10.7% 10.6% -0.18%
Total 54 957 45 004 100.0% 100.0% –
Source: National Treasury
Table W1.14 Output sub-component shares1
Primary healthcare Hospital workload
visits patient-day equivalents
Thousand 2013/14 2014/15 Average Share 2013/14 2014/15 Average Share
Eastern Cape 17 379 17 907 17 643 13.7% 4 572 4 637 4 605 14.2%
Free State 6 894 6 792 6 843 5.3% 1 750 1 706 1 728 5.3%
Gauteng 23 647 23 743 23 695 18.3% 6 722 6 701 6 711 20.7%
KwaZulu-Natal 31 885 31 233 31 559 24.4% 8 043 7 911 7 977 24.6%
Limpopo 14 256 14 343 14 300 11.1% 2 922 2 883 2 902 8.9%
Mpumalanga 9 144 9 483 9 313 7.2% 1 931 1 963 1 947 6.0%
Northern Cape 3 421 3 308 3 365 2.6% 526 595 561 1.7%
North West 8 047 8 364 8 206 6.4% 1 674 1 721 1 697 5.2%
Western Cape 14 308 14 257 14 282 11.1% 4 283 4 341 4 312 13.3%
Total 128 981 129 430 129 206 100.0% 32 424 32 457 32 440 100.0%
1. Some provincial numbers for patient-days and healthcare visits for 2013/14 have been restated, resulting
in small variances from numbers published in 2015
Source: National Treasury

ANNEXURE W1: EXPLANATORY MEMORANDUM TO THE DIVISION OF REVENUE
19
Basic component (16 per cent)
The basic component is derived from the proportion of each province’s share of the national population.
This component constitutes 16 per cent of the total equitable share. For the 2016 MTEF, population data is
drawn from the 2015 mid-year population estimates produced by Statistics South Africa. Table W1.16
shows the impact on the basic component’s revised weighted shares.
Institutional component (5 per cent)
The institutional component recognises that some costs associated with running a provincial government
and providing services are not directly related to the size of a province’s population or the other factors
included in other components. It is therefore distributed equally between provinces, constituting 5 per cent
of the total equitable share, of which each province receives 11.1 per cent. This benefits provinces with
smaller populations, especially the Northern Cape, the Free State and the North West, because the
allocation per person for these provinces is much higher in this component.
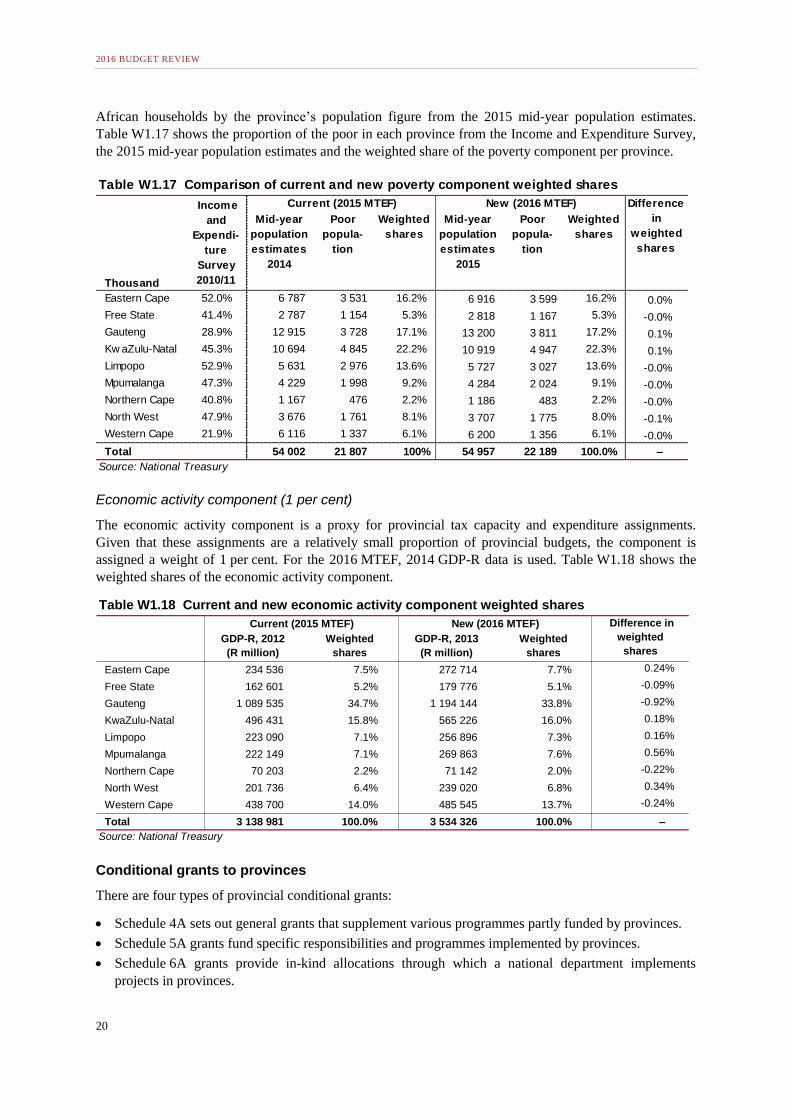
Poverty component (3 per cent)
The poverty component introduces a redistributive element to the formula and is assigned a weight of
3 per cent. The poor population includes people who fall in the lowest 40 per cent of household incomes in
the 2010/11 Income and Expenditure Survey. The estimated size of the poor population in each province is
calculated by multiplying the proportion in that province that fall into the poorest 40 per cent of South
Table W1.15 Health component weighted shares
Risk-
adjusted
Primary
healthcare
Hospital
component
Weighted shares Change
Weight 75.0% 5.0% 20.0% 2015 2016
Eastern Cape 13.3% 13.7% 14.2% 13.5% 13.5% -0.02%
Free State 5.3% 5.3% 5.3% 5.4% 5.3% -0.14%
Gauteng 22.2% 18.3% 20.7% 21.4% 21.7% 0.26%
Kw aZulu-Natal 20.9% 24.4% 24.6% 21.8% 21.8% -0.03%
Limpopo 10.7% 11.1% 8.9% 10.4% 10.3% -0.03%
Mpumalanga 7.7% 7.2% 6.0% 7.3% 7.4% 0.03%
Northern Cape 2.1% 2.6% 1.7% 2.1% 2.1% 0.02%
North West 7.2% 6.4% 5.2% 6.7% 6.7% 0.02%
Western Cape 10.6% 11.1% 13.3% 11.3% 11.1% -0.12%
Total 100.0% 100.0% 100.0% 100.0% 100.0% –
Source: National Treasury
Table W1.16 Impact of the changes in population on the basic component shares
Mid-year
population
estimates
Mid-year
population
estimates
Population
change
%
population
change
Change
Thousand 2014 2015 2015 MTEF 2016 MTEF
Eastern Cape 6 787 6 916 129 1.9% 12.6% 12.6% 0.02%
Free State 2 787 2 818 31 1.1% 5.2% 5.1% -0.03%
Gauteng 12 915 13 200 286 2.2% 23.9% 24.0% 0.10%
KwaZulu-Natal 10 694 10 919 225 2.1% 19.8% 19.9% 0.06%
Limpopo 5 631 5 727 96 1.7% 10.4% 10.4% -0.01%
Mpumalanga 4 229 4 284 55 1.3% 7.8% 7.8% -0.04%
Northern Cape 1 167 1 186 19 1.6% 2.2% 2.2% -0.00%
North West 3 676 3 707 31 0.8% 6.8% 6.7% -0.06%
Western Cape 6 116 6 200 84 1.4% 11.3% 11.3% -0.04%
Total 54 002 54 957 955 1.8% 100.0% 100.0% –
Source: National Treasury
Basic component
shares
2016 BUDGET REVIEW
20
African households by the province’s population figure from the 2015 mid-year population estimates.
Table W1.17 shows the proportion of the poor in each province from the Income and Expenditure Survey,
the 2015 mid-year population estimates and the weighted share of the poverty component per province.
Economic activity component (1 per cent)
The economic activity component is a proxy for provincial tax capacity and expenditure assignments.
Given that these assignments are a relatively small proportion of provincial budgets, the component is
assigned a weight of 1 per cent. For the 2016 MTEF, 2014 GDP-R data is used. Table W1.18 shows the
weighted shares of the economic activity component.
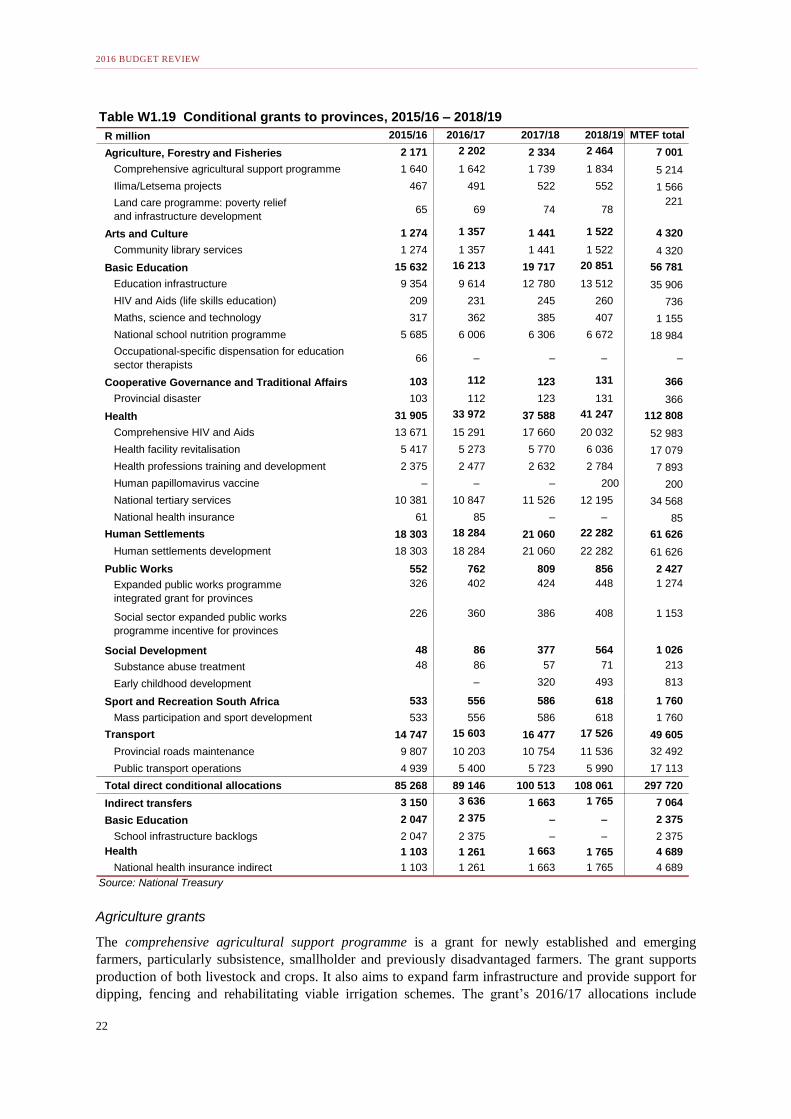
Conditional grants to provinces
There are four types of provincial conditional grants:
Schedule 4A sets out general grants that supplement various programmes partly funded by provinces.
Schedule 5A grants fund specific responsibilities and programmes implemented by provinces.
Schedule 6A grants provide in-kind allocations through which a national department implements
projects in provinces.
Table W1.17 Comparison of current and new poverty component weighted shares
Current (2015 MTEF)
Thousand
Mid-year
population
estimates
2014
Poor
popula-
tion
Weighted
shares
Mid-year
population
estimates
2015
Poor
popula-
tion
Weighted
shares
Eastern Cape 52.0% 6 787 3 531 16.2% 6 916 3 599 16.2% 0.0%
Free State 41.4% 2 787 1 154 5.3% 2 818 1 167 5.3% -0.0%
Gauteng 28.9% 12 915 3 728 17.1% 13 200 3 811 17.2% 0.1%
Kw aZulu-Natal 45.3% 10 694 4 845 22.2% 10 919 4 947 22.3% 0.1%
Limpopo 52.9% 5 631 2 976 13.6% 5 727 3 027 13.6% -0.0%
Mpumalanga 47.3% 4 229 1 998 9.2% 4 284 2 024 9.1% -0.0%
Northern Cape 40.8% 1 167 476 2.2% 1 186 483 2.2% -0.0%
North West 47.9% 3 676 1 761 8.1% 3 707 1 775 8.0% -0.1%
Western Cape 21.9% 6 116 1 337 6.1% 6 200 1 356 6.1% -0.0%
Total 54 002 21 807 100% 54 957 22 189 100.0% –
Source: National Treasury
Income
and
Expendi-
ture
Survey
2010/11
New (2016 MTEF) Difference
in
weighted
shares
Table W1.18 Current and new economic activity component weighted shares
Current (2015 MTEF) New (2016 MTEF)
GDP-R, 2012
(R million)
Weighted
shares
GDP-R, 2013
(R million)
Weighted
shares
Eastern Cape 234 536 7.5% 272 714 7.7% 0.24%
Free State 162 601 5.2% 179 776 5.1% -0.09%
Gauteng 1 089 535 34.7% 1 194 144 33.8% -0.92%
KwaZulu-Natal 496 431 15.8% 565 226 16.0% 0.18%
Limpopo 223 090 7.1% 256 896 7.3% 0.16%
Mpumalanga 222 149 7.1% 269 863 7.6% 0.56%
Northern Cape 70 203 2.2% 71 142 2.0% -0.22%
North West 201 736 6.4% 239 020 6.8% 0.34%
Western Cape 438 700 14.0% 485 545 13.7% -0.24%
Total 3 138 981 100.0% 3 534 326 100.0% –
Source: National Treasury
Difference in
weighted
shares

ANNEXURE W1: EXPLANATORY MEMORANDUM TO THE DIVISION OF REVENUE
21
Schedule 7A grants provide for the swift allocation and transfer of funds to a province to help it deal
with a disaster.
Changes to conditional grants
Despite the baseline reductions, overall growth in direct conditional transfers to provinces is strong,
averaging 8.2 per cent over the MTEF period. Direct conditional grant baselines total R89.1 billion in
2016/17, R100.5 billion in 2017/18 and R108.1 billion in 2018/19. Indirect conditional grants amount to
R3.6 billion, R1.7 billion and R1.8 billion respectively for each year of the same period.
Table W1.19 provides a summary of conditional grants by sector for the 2016 MTEF period. More detailed
information, including the framework and allocation criteria for each grant, is provided in Annexure W2 of
the 2016 Division of Revenue Bill. The frameworks provide the conditions for each grant, the outputs
expected, the allocation criteria used for dividing each grant between provinces, and a summary of the
grant’s audited outcomes for 2014/15.
2016 BUDGET REVIEW
22
Agriculture grants
The comprehensive agricultural support programme is a grant for newly established and emerging
farmers, particularly subsistence, smallholder and previously disadvantaged farmers. The grant supports
production of both livestock and crops. It also aims to expand farm infrastructure and provide support for
dipping, fencing and rehabilitating viable irrigation schemes. The grant’s 2016/17 allocations include
Table W1.19 Conditional grants to provinces, 2015/16 – 2018/19
R million 2015/16 2016/17 2017/18 2018/19 MTEF total
Agriculture, Forestry and Fisheries 2 171 2 202 2 334 2 464 7 001
Comprehensive agricultural support programme 1 640 1 642 1 739 1 834 5 214
Ilima/Letsema projects 467 491 522 552 1 566
Land care programme: poverty relief
and infrastructure development65 69 74 78
221
Arts and Culture 1 274 1 357 1 441 1 522 4 320
Community library services 1 274 1 357 1 441 1 522 4 320
Basic Education 15 632 16 213 19 717 20 851 56 781
Education infrastructure 9 354 9 614 12 780 13 512 35 906
HIV and Aids (life skills education) 209 231 245 260 736
Maths, science and technology 317 362 385 407 1 155
National school nutrition programme 5 685 6 006 6 306 6 672 18 984
Occupational-specific dispensation for education
sector therapists66 – – – –
Cooperative Governance and Traditional Affairs 103 112 123 131 366
Provincial disaster 103 112 123 131 366
Health 31 905 33 972 37 588 41 247 112 808
Comprehensive HIV and Aids 13 671 15 291 17 660 20 032 52 983
Health facility revitalisation 5 417 5 273 5 770 6 036 17 079
Health professions training and development 2 375 2 477 2 632 2 784 7 893
Human papillomavirus vaccine – – – 200 200
National tertiary services 10 381 10 847 11 526 12 195 34 568
National health insurance 61 85 – – 85
Human Settlements 18 303 18 284 21 060 22 282 61 626
Human settlements development 18 303 18 284 21 060 22 282 61 626
Public Works 552 762 809 856 2 427
Expanded public works programme
integrated grant for provinces
326 402 424 448 1 274
Social sector expanded public works
programme incentive for provinces
226 360 386 408 1 153
Social Development 48 86 377 564 1 026
Substance abuse treatment 48 86 57 71 213
Early childhood development – 320 493 813
Sport and Recreation South Africa 533 556 586 618 1 760
Mass participation and sport development 533 556 586 618 1 760
Transport 14 747 15 603 16 477 17 526 49 605
Provincial roads maintenance 9 807 10 203 10 754 11 536 32 492
Public transport operations 4 939 5 400 5 723 5 990 17 113
Total direct conditional allocations 85 268 89 146 100 513 108 061 297 720
Indirect transfers 3 150 3 636 1 663 1 765 7 064
Basic Education 2 047 2 375 – – 2 375
School infrastructure backlogs 2 047 2 375 – – 2 375
Health 1 103 1 261 1 663 1 765 4 689
National health insurance indirect 1 103 1 261 1 663 1 765 4 689
Source: National Treasury
ANNEXURE W1: EXPLANATORY MEMORANDUM TO THE DIVISION OF REVENUE
23
R76.7 million to repair flood-damaged agricultural infrastructure. The baseline reduction in 2016/17 is
R60 million. The grant is allocated R5.2 billion over the medium term.
The land care programme grant: poverty relief and infrastructure development aims to improve
productivity and the sustainable use of natural resources. Provinces are also encouraged to use this grant to
create jobs through the Expanded Public Works Programme. Over the medium term, R220.7 million is
allocated to this grant.
The Ilima/Letsema projects grant aims to boost food production by helping previously disadvantaged
farming communities. The Department of Agriculture, Forestry and Fisheries is still testing the new
approach, following which it will subject the grant to the standard operating procedure for farmer support.
The grant’s baseline is protected, with a R491.4 million allocation for 2016/17. It is allocated R1.6 billion
over the MTEF period.
Arts and culture grant
The community library services grant, administered by the Department of Arts and Culture, aims to help
South Africans access knowledge and information to improve their socioeconomic situation. The grant is
allocated to the relevant provincial department and administered by that department or through a service-
level agreement with municipalities. In collaboration with provincial departments of basic education, the
grant also funds libraries that serve both schools and the general public. Funds from this grant may also be
used to shift the libraries function between provinces and municipalities. The baseline reduction on this
grant in 2016/17 is R10 million. The grant is allocated R4.3 billion over the next three years.
Basic education grants
Provinces use the education infrastructure grant to construct, maintain and refurbish education
infrastructure and schools. The baseline reduction on this grant in 2016/17 is R160 million. The reduction
to the baseline over the MTEF amounts to R520 million. The grant totals R35.9 billion over the MTEF
period, which includes a ring-fenced amount of R112.9 million in 2016/17 to repair school infrastructure
damaged by natural disasters.
The school infrastructure backlogs grant is an indirect grant to provinces that was introduced in 2011 as a
temporary, high-impact grant. The Department of Basic Education uses this grant to build and upgrade
schools on behalf of provinces to address inappropriate structures and access to basic services. To address
the grant’s disappointing performance, it will be merged with the education infrastructure grant from
2017/18. However, the baseline allocation under this grant will remain unallocated in 2017/18 and
2018/19, subject to a review of pipeline projects in 2016. In 2016/17, the last year of its current form, the
grant is allocated R2.4 billion. The baseline of the education infrastructure grant is R9.6 billion in
2016/17, R12.8 billion in 2017/18 and R13.5 billion in 2018/19. Over the MTEF period, R3.6 billion in
2017/18 and R3.8 billion in 2018/19 will remain unallocated.
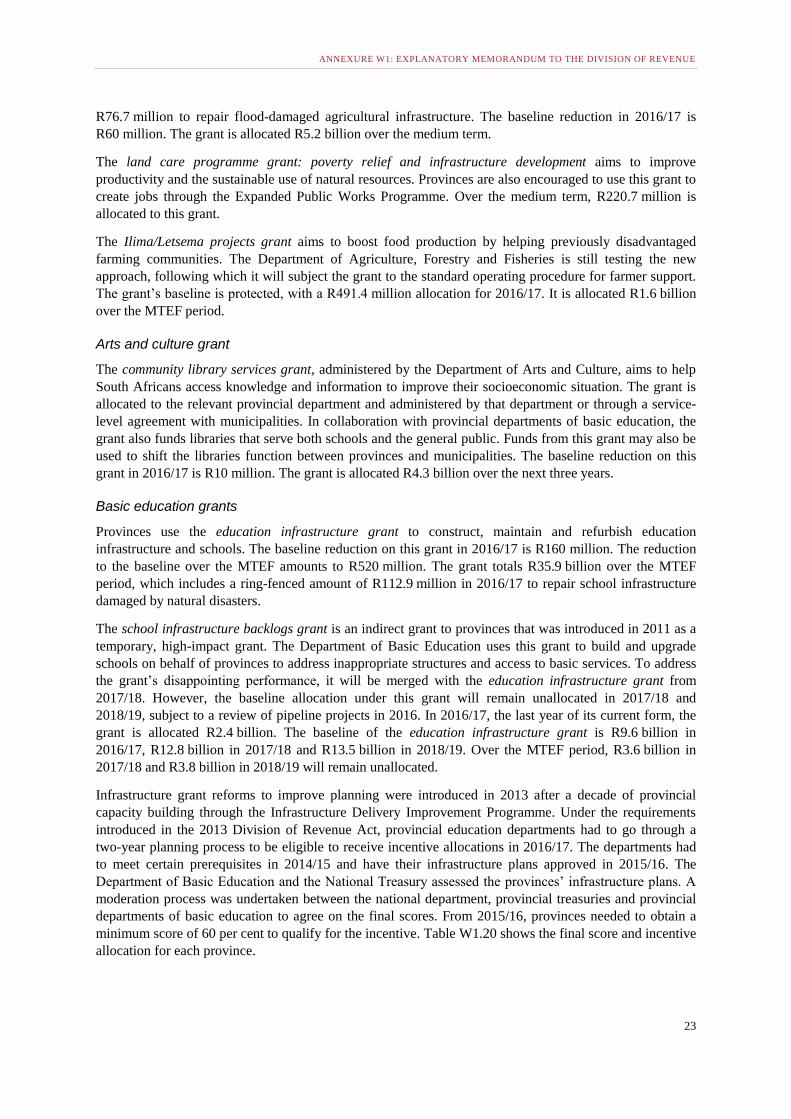
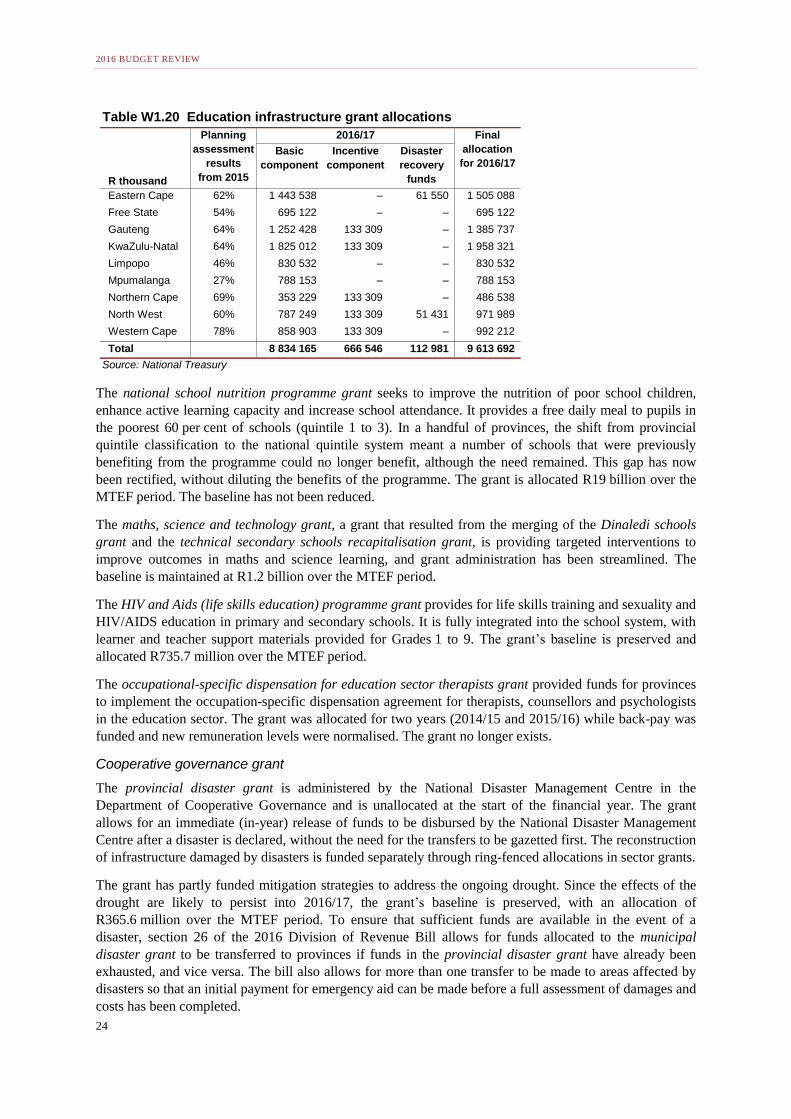
Infrastructure grant reforms to improve planning were introduced in 2013 after a decade of provincial
capacity building through the Infrastructure Delivery Improvement Programme. Under the requirements
introduced in the 2013 Division of Revenue Act, provincial education departments had to go through a
two-year planning process to be eligible to receive incentive allocations in 2016/17. The departments had
to meet certain prerequisites in 2014/15 and have their infrastructure plans approved in 2015/16. The
Department of Basic Education and the National Treasury assessed the provinces’ infrastructure plans. A
moderation process was undertaken between the national department, provincial treasuries and provincial
departments of basic education to agree on the final scores. From 2015/16, provinces needed to obtain a
minimum score of 60 per cent to qualify for the incentive. Table W1.20 shows the final score and incentive
allocation for each province.
2016 BUDGET REVIEW
24
The national school nutrition programme grant seeks to improve the nutrition of poor school children,
enhance active learning capacity and increase school attendance. It provides a free daily meal to pupils in
the poorest 60 per cent of schools (quintile 1 to 3). In a handful of provinces, the shift from provincial
quintile classification to the national quintile system meant a number of schools that were previously
benefiting from the programme could no longer benefit, although the need remained. This gap has now
been rectified, without diluting the benefits of the programme. The grant is allocated R19 billion over the
MTEF period. The baseline has not been reduced.
The maths, science and technology grant, a grant that resulted from the merging of the Dinaledi schools
grant and the technical secondary schools recapitalisation grant, is providing targeted interventions to
improve outcomes in maths and science learning, and grant administration has been streamlined. The
baseline is maintained at R1.2 billion over the MTEF period.
The HIV and Aids (life skills education) programme grant provides for life skills training and sexuality and
HIV/AIDS education in primary and secondary schools. It is fully integrated into the school system, with
learner and teacher support materials provided for Grades 1 to 9. The grant’s baseline is preserved and
allocated R735.7 million over the MTEF period.
The occupational-specific dispensation for education sector therapists grant provided funds for provinces
to implement the occupation-specific dispensation agreement for therapists, counsellors and psychologists
in the education sector. The grant was allocated for two years (2014/15 and 2015/16) while back-pay was
funded and new remuneration levels were normalised. The grant no longer exists.
Cooperative governance grant
The provincial disaster grant is administered by the National Disaster Management Centre in the
Department of Cooperative Governance and is unallocated at the start of the financial year. The grant
allows for an immediate (in-year) release of funds to be disbursed by the National Disaster Management
Centre after a disaster is declared, without the need for the transfers to be gazetted first. The reconstruction
of infrastructure damaged by disasters is funded separately through ring-fenced allocations in sector grants.
The grant has partly funded mitigation strategies to address the ongoing drought. Since the effects of the
drought are likely to persist into 2016/17, the grant’s baseline is preserved, with an allocation of
R365.6 million over the MTEF period. To ensure that sufficient funds are available in the event of a
disaster, section 26 of the 2016 Division of Revenue Bill allows for funds allocated to the municipal
disaster grant to be transferred to provinces if funds in the provincial disaster grant have already been
exhausted, and vice versa. The bill also allows for more than one transfer to be made to areas affected by
disasters so that an initial payment for emergency aid can be made before a full assessment of damages and
costs has been completed.
Table W1.20 Education infrastructure grant allocations
R thousand
Basic
component
Incentive
component
Disaster
recovery
funds
Eastern Cape 62% 1 443 538 – 61 550 1 505 088
Free State 54% 695 122 – – 695 122
Gauteng 64% 1 252 428 133 309 – 1 385 737
KwaZulu-Natal 64% 1 825 012 133 309 – 1 958 321
Limpopo 46% 830 532 – – 830 532
Mpumalanga 27% 788 153 – – 788 153
Northern Cape 69% 353 229 133 309 – 486 538
North West 60% 787 249 133 309 51 431 971 989
Western Cape 78% 858 903 133 309 – 992 212
Total 8 834 165 666 546 112 981 9 613 692
Source: National Treasury
Planning
assessment
results
from 2015
2016/17 Final
allocation
for 2016/17
ANNEXURE W1: EXPLANATORY MEMORANDUM TO THE DIVISION OF REVENUE
25
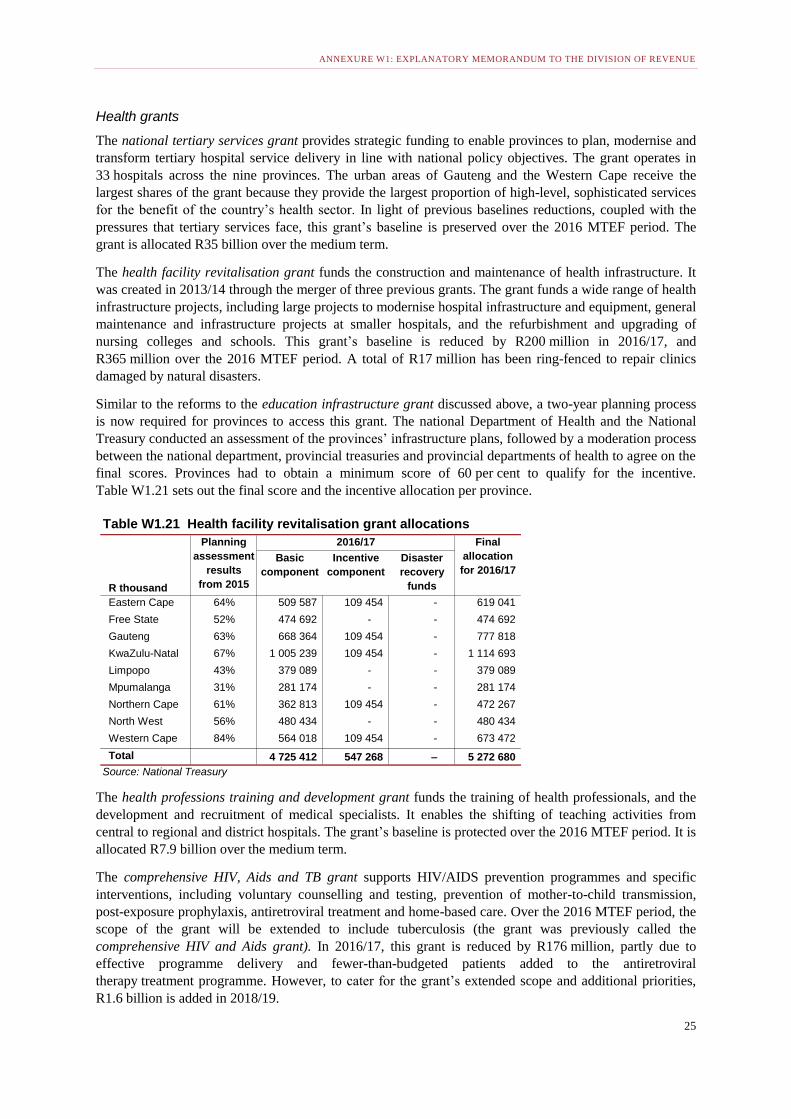
Health grants
The national tertiary services grant provides strategic funding to enable provinces to plan, modernise and
transform tertiary hospital service delivery in line with national policy objectives. The grant operates in
33 hospitals across the nine provinces. The urban areas of Gauteng and the Western Cape receive the
largest shares of the grant because they provide the largest proportion of high-level, sophisticated services
for the benefit of the country’s health sector. In light of previous baselines reductions, coupled with the
pressures that tertiary services face, this grant’s baseline is preserved over the 2016 MTEF period. The
grant is allocated R35 billion over the medium term.
The health facility revitalisation grant funds the construction and maintenance of health infrastructure. It
was created in 2013/14 through the merger of three previous grants. The grant funds a wide range of health
infrastructure projects, including large projects to modernise hospital infrastructure and equipment, general
maintenance and infrastructure projects at smaller hospitals, and the refurbishment and upgrading of
nursing colleges and schools. This grant’s baseline is reduced by R200 million in 2016/17, and
R365 million over the 2016 MTEF period. A total of R17 million has been ring-fenced to repair clinics
damaged by natural disasters.
Similar to the reforms to the education infrastructure grant discussed above, a two-year planning process
is now required for provinces to access this grant. The national Department of Health and the National
Treasury conducted an assessment of the provinces’ infrastructure plans, followed by a moderation process
between the national department, provincial treasuries and provincial departments of health to agree on the
final scores. Provinces had to obtain a minimum score of 60 per cent to qualify for the incentive.
Table W1.21 sets out the final score and the incentive allocation per province.
The health professions training and development grant funds the training of health professionals, and the
development and recruitment of medical specialists. It enables the shifting of teaching activities from
central to regional and district hospitals. The grant’s baseline is protected over the 2016 MTEF period. It is
allocated R7.9 billion over the medium term.
The comprehensive HIV, Aids and TB grant supports HIV/AIDS prevention programmes and specific
interventions, including voluntary counselling and testing, prevention of mother-to-child transmission,
post-exposure prophylaxis, antiretroviral treatment and home-based care. Over the 2016 MTEF period, the
scope of the grant will be extended to include tuberculosis (the grant was previously called the
comprehensive HIV and Aids grant). In 2016/17, this grant is reduced by R176 million, partly due to
effective programme delivery and fewer-than-budgeted patients added to the antiretroviral
therapy treatment programme. However, to cater for the grant’s extended scope and additional priorities,
R1.6 billion is added in 2018/19.
Table W1.21 Health facility revitalisation grant allocations
R thousand
Basic
component
Incentive
component
Disaster
recovery
funds
Eastern Cape 64% 509 587 109 454 - 619 041
Free State 52% 474 692 - - 474 692
Gauteng 63% 668 364 109 454 - 777 818
KwaZulu-Natal 67% 1 005 239 109 454 - 1 114 693
Limpopo 43% 379 089 - - 379 089
Mpumalanga 31% 281 174 - - 281 174
Northern Cape 61% 362 813 109 454 - 472 267
North West 56% 480 434 - - 480 434
Western Cape 84% 564 018 109 454 - 673 472
Total 4 725 412 547 268 – 5 272 680
Source: National Treasury
Planning
assessment
results
from 2015
2016/17 Final
allocation
for 2016/17
2016 BUDGET REVIEW
26
The national health insurance grant funds the national health insurance pilots introduced in 2012/13,
which aim to strengthen primary healthcare for the implementation of national health insurance.
Ten districts were selected as pilot sites to test interventions that aim to strengthen health systems and
improve performance. However, this grant has performed poorly, with little evidence of impact. As such,
2016/17 is the final year for this grant, after which a close-out report will review the reasons for its
conclusion. In 2016/17, the baseline allocation for this grant is R85 million. However, the vision that
underpinned this grant will continue through the the national health insurance indirect grant. This grant
will use targeted programmes to prepare the health sector for the rollout of national health insurance.
The national health insurance indirect grant, introduced in 2013/14, is spent by the Department of Health
on behalf of provinces. The grant has five components, which target national health insurance scheme pilot
sites in preparation for the eventual rollout of national health insurance in the country. The components of
the grant are: health facility revitalisation, health professionals contracting, human papillomavirus vaccine,
ideal clinics, and information systems (this component will come into effect in 2017/18).
Under this grant, the health facility revitalisation component will be used to accelerate construction,
maintenance, upgrades and rehabilitation for new and existing health infrastructure, while the health
professionals contracting component will pilot the contracting of general practitioners from the private
sector for national health insurance sites. It will also support hospitals to strengthen their patient
information systems and develop and pilot alternative hospital reimbursement tools. The human
papillomavirus vaccine component is allocated for three additional years, and will be used to support
provincial health departments with the vaccine’s rollout. In the last year of the 2016 MTEF period, this
component will become a direct grant to provinces. The national health insurance indirect grant is
allocated R4.7 billion over the MTEF period.
Human settlements grant
The human settlements development grant seeks to establish habitable, stable and sustainable human
settlements in which all citizens have access to social and economic amenities. This grant is allocated
using a formula with three components:
The first component shares 70 per cent of the total allocation between provinces in proportion to their
share of the total number of households living in inadequate housing. Data from the 2011 Census is
used for the number of households in each province living in informal settlements, shacks in backyards
and traditional dwellings. Not all traditional dwellings are inadequate, which is why information on the
proportion of traditional dwellings per province with damaged roofs and walls from the 2010 General
Household Survey is used to adjust these totals so that only traditional dwellings that provide
inadequate shelter are counted in the formula.
The second component determines 20 per cent of the total allocation based on the share of poor
households in each province. The number of households with an income of less than R1 500 per month
is used to determine 80 per cent of the component and the share of households with an income of
between R1 500 and R3 500 per month is used to determine the remaining 20 per cent. Data used in this
component comes from the 2011 Census.
The third component, which determines 10 per cent of the total allocation, is shared in proportion to the
number of people in each province, as measured in the 2011 Census.
In addition to the allocations determined through the formula, a total of R3.6 billion is ring-fenced over the
2016 MTEF period to upgrade human settlements in mining towns in six provinces. These allocations
respond to areas with significant informal settlement challenges, with a high proportion of economic
activity based on the natural resources sector. A total of R329.3 million is also ring-fenced over the
medium term to repair infrastructure damaged by natural disasters.
The grant’s baseline is reduced by R1.6 billion in 2016/17, but it is protected for the remainder of the
MTEF period. The grant’s allocation totals R61.6 billion over the medium term.
ANNEXURE W1: EXPLANATORY MEMORANDUM TO THE DIVISION OF REVENUE
27
Public works grants
The expanded public works programme integrated grant for provinces incentivises provincial departments
to use labour-intensive methods in infrastructure, environmental and other projects. Grant allocations are
determined upfront based on the performance of provincial departments in meeting job targets in the
preceding financial year. It is allocated R1.3 billion over the MTEF period.
The social sector expanded public works programme incentive grant for provinces rewards provinces for
creating jobs in the preceding financial year in the areas of home-based care, early childhood development,
adult literacy and numeracy, community safety and security, and sports programmes. The grant’s
allocation model incentivises provincial departments to participate in the Expanded Public Works
Programme and measures the performance of each province relative to its peers, providing additional
incentives to those that perform well. The grant is allocated R1.2 billion over the MTEF period.
Social development grant
The substance abuse treatment grant aims to build public substance abuse treatment facilities in the four
provinces that do not already have such facilities: the Eastern Cape, the Free State, the Northern Cape and
the North West. The grant, which is administered by the Department of Social Development, funds the
construction of treatment centres. After 2016/17, however, it will no longer operate in its current form. For
the remainder of the 2016 MTEF period, allocations to this grant will supplement the operationalisation of
these treatment centres. The grant’s baseline has not been reduced. It has been allocated R213.3 million
over the MTEF period.
From 2017/18, the new early childhood development grant will be introduced to the provincial fiscal
framework. The grant will play a part in government’s prioritisation of early childhood development, as
envisioned in the National Development Plan. Over the MTEF period, the grant baseline totals
R812.9 million.
Sport and recreation South Africa grant
The mass participation and sport development grant aims to increase and sustain mass participation in
sport and recreational activities in the provinces, with greater emphasis on provincial and district
academies. The baseline reduction on this grant in 2016/17 is R10 million. It is allocated R1.8 billion over
the MTEF period.
Transport grants
The public transport operations grant subsidises commuter bus services. It supports provinces to ensure
that contractual obligations are met and services are efficiently provided. The public transport contracting
and regulatory functions may be assigned to certain metropolitan municipalities during 2016/17. If this
takes place, grant funds will be transferred directly to the assigned municipality. Given the pressures this
sector faces, R700 million is added to the grant’s baseline over the medium term. The grant is allocated
R5.4 billion in 2016/17, R5.7 billion in 2017/18 and R6 billion in 2018/19.
The provincial roads maintenance grant consists of three components. The largest component enables
provinces to expand their maintenance activities. The other components allow provinces to repair roads
damaged by floods and rehabilitate roads that are heavily used in support of electricity production. Grant
allocations are determined using a formula based on provincial road networks, road traffic and weather
conditions. These factors reflect the different costs of maintaining road networks in each province. The
grant requires provinces to follow best practices for planning and to use and regularly update roads asset
management systems.
In preparation for the grant’s performance-based allocation, the model’s indicators – vehicle operating
costs and remaining asset lifespan – have been finalised and the performance component will inform future
grant allocations. An amount of R10 million has been reprioritised within this grant for 2016/17 to fund
2016 BUDGET REVIEW
28
preparations for the incentive measure. The total allocation for the MTEF period is R32.5 billion, including
a ring-fenced allocation of R298 million in 2016/17 for the repair of infrastructure damaged by floods.
Part 5: Local government fiscal framework and allocations
The local government fiscal framework responds to the constitutional assignment of powers and functions
to this sphere of government. The framework – including all transfers and own revenues – is structured to
support the achievement of the National Development Plan’s goals.
The framework refers to all resources available to municipalities to meet their expenditure responsibilities.
National transfers account for a relatively small proportion of the local government fiscal framework, with
the majority of local government revenues being raised by municipalities themselves through their
substantial revenue-raising powers, including property rates and service charges. However, the proportion
of revenue from transfers and own revenues varies dramatically across municipalities, with poor rural
municipalities receiving most of their revenue from transfers, while urban municipalities raise the majority
of their own revenues. This differentiation in the way municipalities are funded will continue in the period
ahead.
The 2016 division of revenue includes several important changes that will affect municipalities, including
changes to accommodate the effect of a series of major boundary changes that will come into effect
following the 2016 local government elections, and changes as a result of the review of local government
infrastructure grants.
Boundary changes will see the total number of municipalities in the country reduced from 278 to 257.
Allocations published in the 2016 Division of Revenue Bill are based on the new municipal boundaries
because these new demarcations will be in effect for the majority of the 2016/17 municipal financial year.
In addition, the infrastructure grant review will reduce the number of grants to municipalities, helping to
decrease the burden of reporting on municipalities and make the grant system more efficient.
This section outlines the transfers made to local government and how these funds are distributed between
municipalities. Funds raised by national government are transferred to municipalities through conditional
and unconditional grants. National transfers to municipalities are published to enable them to plan fully for
their 2016/17 budgets, and to promote better accountability and transparency by ensuring that all national
allocations are included in municipal budgets.
Transfers to local government
Over the 2016 MTEF period, R339.6 billion will be transferred directly to local government and a further
R22.9 billion has been allocated to indirect grants. Direct transfers to local government over the 2016
MTEF period account for 9.1 per cent of national government’s non-interest expenditure. When indirect
transfers are added to this, total spending on local government increases to 9.8 per cent of national non-
interest expenditure.
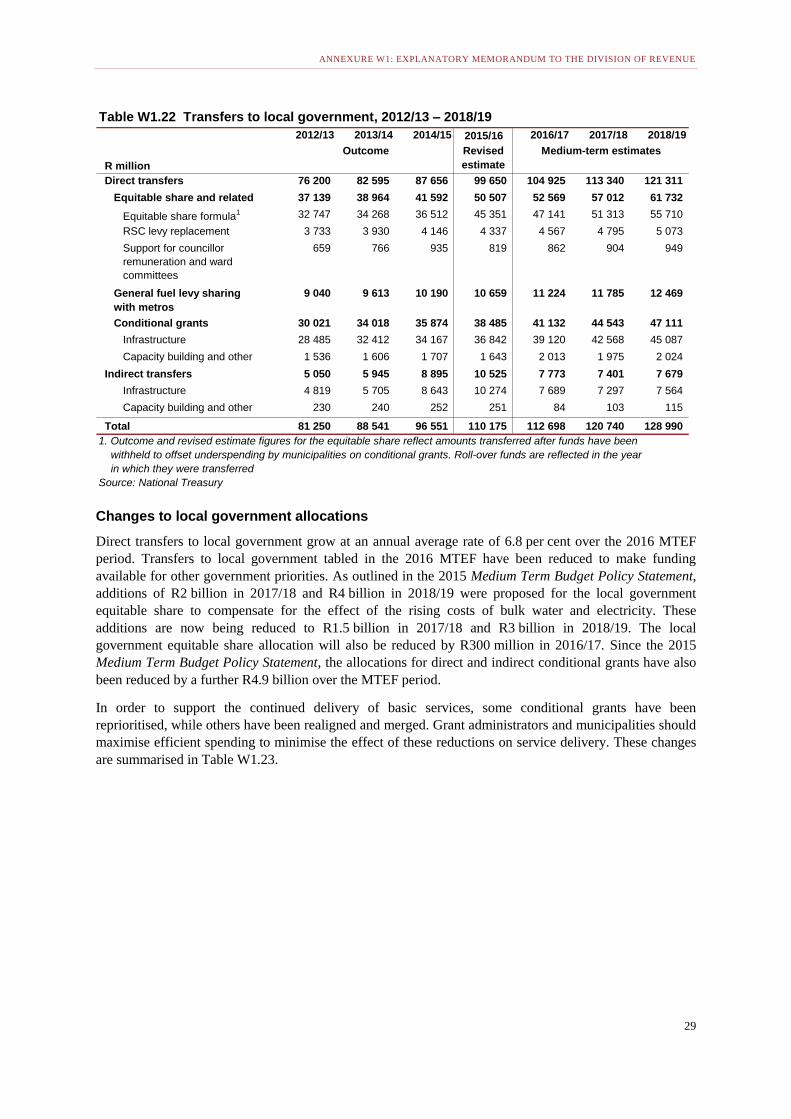
ANNEXURE W1: EXPLANATORY MEMORANDUM TO THE DIVISION OF REVENUE
29
Changes to local government allocations
Direct transfers to local government grow at an annual average rate of 6.8 per cent over the 2016 MTEF
period. Transfers to local government tabled in the 2016 MTEF have been reduced to make funding
available for other government priorities. As outlined in the 2015 Medium Term Budget Policy Statement,
additions of R2 billion in 2017/18 and R4 billion in 2018/19 were proposed for the local government
equitable share to compensate for the effect of the rising costs of bulk water and electricity. These
additions are now being reduced to R1.5 billion in 2017/18 and R3 billion in 2018/19. The local
government equitable share allocation will also be reduced by R300 million in 2016/17. Since the 2015
Medium Term Budget Policy Statement, the allocations for direct and indirect conditional grants have also
been reduced by a further R4.9 billion over the MTEF period.
In order to support the continued delivery of basic services, some conditional grants have been
reprioritised, while others have been realigned and merged. Grant administrators and municipalities should
maximise efficient spending to minimise the effect of these reductions on service delivery. These changes
are summarised in Table W1.23.
Table W1.22 Transfers to local government, 2012/13 – 2018/19
2012/13 2013/14 2014/15 2015/16 2016/17 2017/18 2018/19
R million
Revised
estimate
Direct transfers 76 200 82 595 87 656 99 650 104 925 113 340 121 311
Equitable share and related 37 139 38 964 41 592 50 507 52 569 57 012 61 732
Equitable share formula1 32 747 34 268 36 512 45 351 47 141 51 313 55 710
RSC levy replacement 3 733 3 930 4 146 4 337 4 567 4 795 5 073
Support for councillor
remuneration and ward
committees
659 766 935 819 862 904 949
General fuel levy sharing
with metros
9 040 9 613 10 190 10 659 11 224 11 785 12 469
Conditional grants 30 021 34 018 35 874 38 485 41 132 44 543 47 111
Infrastructure 28 485 32 412 34 167 36 842 39 120 42 568 45 087
Capacity building and other 1 536 1 606 1 707 1 643 2 013 1 975 2 024
Indirect transfers 5 050 5 945 8 895 10 525 7 773 7 401 7 679
Infrastructure 4 819 5 705 8 643 10 274 7 689 7 297 7 564
Capacity building and other 230 240 252 251 84 103 115
Total 81 250 88 541 96 551 110 175 112 698 120 740 128 990
1. Outcome and revised estimate figures for the equitable share reflect amounts transferred after funds have been
withheld to offset underspending by municipalities on conditional grants. Roll-over funds are reflected in the year
in which they were transferred
Source: National Treasury
Outcome Medium-term estimates
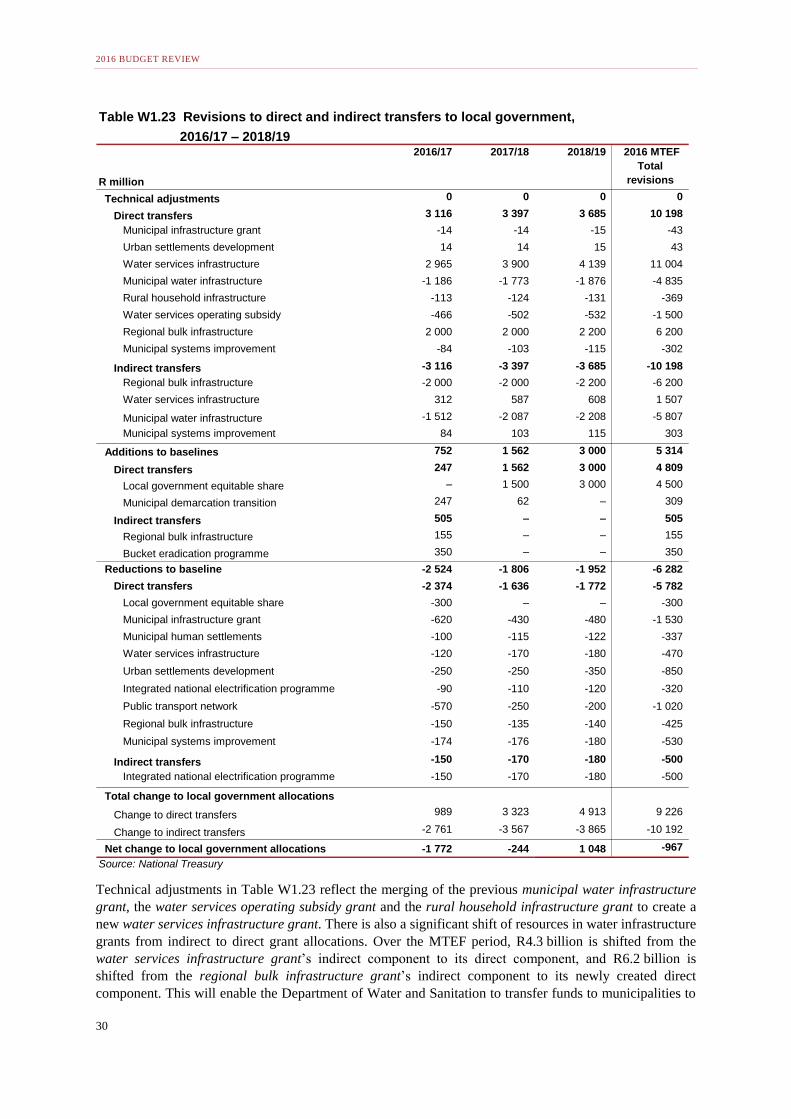
2016 BUDGET REVIEW
30
Technical adjustments in Table W1.23 reflect the merging of the previous municipal water infrastructure
grant, the water services operating subsidy grant and the rural household infrastructure grant to create a
new water services infrastructure grant. There is also a significant shift of resources in water infrastructure
grants from indirect to direct grant allocations. Over the MTEF period, R4.3 billion is shifted from the
water services infrastructure grant’s indirect component to its direct component, and R6.2 billion is
shifted from the regional bulk infrastructure grant’s indirect component to its newly created direct
component. This will enable the Department of Water and Sanitation to transfer funds to municipalities to
Table W1.23 Revisions to direct and indirect transfers to local government,
2016/17 – 2018/19
R million
2016/17 2017/18 2018/19 2016 MTEF
Total
revisions
Technical adjustments 0 0 0 0
Direct transfers 3 116 3 397 3 685 10 198
Municipal infrastructure grant -14 -14 -15 -43
Urban settlements development 14 14 15 43
Water services infrastructure 2 965 3 900 4 139 11 004
Municipal water infrastructure -1 186 -1 773 -1 876 -4 835
Rural household infrastructure -113 -124 -131 -369
Water services operating subsidy -466 -502 -532 -1 500
Regional bulk infrastructure 2 000 2 000 2 200 6 200
Municipal systems improvement -84 -103 -115 -302
Indirect transfers -3 116 -3 397 -3 685 -10 198
Regional bulk infrastructure -2 000 -2 000 -2 200 -6 200
Water services infrastructure 312 587 608 1 507
Municipal water infrastructure -1 512 -2 087 -2 208 -5 807
Municipal systems improvement 84 103 115 303
Additions to baselines 752 1 562 3 000 5 314
Direct transfers 247 1 562 3 000 4 809
Local government equitable share – 1 500 3 000 4 500
Municipal demarcation transition 247 62 – 309
Indirect transfers 505 – – 505
Regional bulk infrastructure 155 – – 155
Bucket eradication programme 350 – – 350
Reductions to baseline -2 524 -1 806 -1 952 -6 282
Direct transfers -2 374 -1 636 -1 772 -5 782
Local government equitable share -300 – – -300
Municipal infrastructure grant -620 -430 -480 -1 530
Municipal human settlements -100 -115 -122 -337
Water services infrastructure -120 -170 -180 -470
Urban settlements development -250 -250 -350 -850
Integrated national electrification programme -90 -110 -120 -320
Public transport network -570 -250 -200 -1 020
Regional bulk infrastructure -150 -135 -140 -425
Municipal systems improvement -174 -176 -180 -530
Indirect transfers -150 -170 -180 -500
Integrated national electrification programme -150 -170 -180 -500
Total change to local government allocations
Change to direct transfers 989 3 323 4 913 9 226
Change to indirect transfers -2 761 -3 567 -3 865 -10 192
Net change to local government allocations -1 772 -244 1 048 -967
Source: National Treasury
ANNEXURE W1: EXPLANATORY MEMORANDUM TO THE DIVISION OF REVENUE
31
build and refurbish their own infrastructure. The remaining allocation for the municipal systems
improvement grant will become an indirect grant, which will enable the Department of Cooperative
Governance to implement capacity-building initiatives in a targeted group of municipalities. There is also a
small shift of funds from the municipal infrastructure grant to the urban settlements development grant to
account for the absorption of Naledi Local Municipality (which receives the municipal infrastructure
grant) into Mangaung Metropolitan Municipality (which receives the urban settlements development
grant).
A total of R5.3 billion is added to local government allocations over the MTEF period. Of this,
R4.5 billion is added to the local government equitable share to assist municipalities with the rising costs
of providing free basic services to their residents. To support the implementation of the Municipal
Demarcation Board’s major boundary changes, the municipal demarcation transition grant will be
increased by R247.4 million in 2016/17 and R61.9 million in 2017/18 to subsidise the additional
institutional and administrative costs arising from municipal mergers. A total of R350 million is added to
the bucket eradication programme grant in 2016/17 to complete the eradication of bucket sanitation
systems in formal residential areas. The urban settlements development grant, the human settlements
development grant and the municipal infrastructure grant will continue to fund the upgrade of sanitation in
informal settlements through various projects focused on improving these areas. An amount of
R155 million is also reprioritised into the regional bulk infrastructure grant.
Reductions to transfers total R6.2 billion over the MTEF period, including reductions of 3.1 per cent of the
municipal infrastructure grant, 2.4 per cent of the urban settlements development grant, 5.2 per cent of the
public transport network grant, 4.3 per cent of the direct water services infrastructure grant, 6.9 per cent
of the direct regional bulk infrastructure grant, 4.9 per cent of the direct integrated national electrification
programme grant and 4.2 per cent of the indirect integrated national electrification programme grant.
There is also a reduction of R485 million over the MTEF period from the municipal systems improvement
grant and R530 million from the municipal human settlements capacity grant. The remainder of the
municipal systems improvement grant will become an indirect grant to support the objectives of the Back
to Basics strategy, while the municipal human settlements capacity grant will be discontinued. In future,
the urban settlements development grant will fund built environment capacity building.
After accounting for all reductions and additions, direct transfers to local government increase by
R9.2 billion over the MTEF period. This is primarily due to the shifting of indirect transfers to direct
transfers in the water sector and the additions to the local government equitable share over the MTEF
period. Indirect transfers to local government (allocations spent by national departments on behalf of
municipalities) decrease by R10.1 billion over the medium term. Total allocations to local government
(including direct and indirect transfers) decrease by R1.8 billion in 2016/17 and R244 million in 2017/18,
followed by an increase of R1 billion in 2018/19. Over the MTEF period, local government allocations
decrease by R967 million. Despite these reductions, total allocations to local government still grow at an
annual average rate of 6.7 per cent over the MTEF period.
Demarcation effects
The Municipal Demarcation Board has announced several major boundary changes that will come into
effect on the date of the 2016 local government elections, reducing the total number of municipalities in
the country from 278 to 257. This is the most wide-ranging re-demarcation since the current system of
wall-to-wall municipalities was introduced in 2000. It will have significant implications on allocations to
municipalities in the Division of Revenue Act.
All formula-based allocations, including for the local government equitable share and the municipal
infrastructure grant, have been updated with data that reflects the new municipal boundaries. Grant
administrators for all project-based grants have assessed the location and needs of re-demarcated
municipalities and taken this into account in determining their allocations for the 2016 MTEF period, so

2016 BUDGET REVIEW
32
that funds are allocated to municipalities where projects will be implemented. Support to re-demarcated
municipalities is provided through the municipal demarcation transition grant.
The date of the 2016 local government elections has not yet been declared, which means that it is also not
yet known when the new demarcations will come into effect. The re-demarcation could take place before
or after the start of the 2016/17 municipal financial year, which begins on 1 July 2016.
Allocations published in the 2016 Division of Revenue Bill are based on the new municipal boundaries
because these new demarcations will be in effect for the majority of the 2016/17 municipal financial year.
In terms of the guidance provided in the Municipal Financial Management Act (2003) Circular 78, if the
elections are held before 1 July 2016, municipalities will be expected to complete the remaining weeks of
the financial year on their existing budget structures (and existing demarcations). The allocations published
in the 2016 Division of Revenue Bill will then be transferred to the re-demarcated municipalities from
1 July 2016.
However, additional clauses have been added to section 36 of the 2016 Division of Revenue Bill to enable
the National Treasury to gazette revised allocations if the elections take place after 1 July 2016. These
revised allocations will allow funds to be transferred to the current 278 municipalities for the period
between 1 July 2016 and the date of the elections (when the re-demarcated municipal boundaries will come
into effect). The remaining allocations will be transferred to the re-demarcated municipalities after the
elections.
The local government equitable share
In terms of section 227 of the Constitution, local government is entitled to an equitable share of nationally
raised revenue to enable it to provide basic services and perform its allocated functions. The local
government equitable share is an unconditional transfer that supplements the revenue that municipalities
can raise themselves (including property rates and service charges). The equitable share provides funding
for municipalities to deliver free basic services to poor households and subsidises the cost of
administration and other core services for those municipalities that have the least potential to cover these
costs from their own revenues.
Over the 2016 MTEF period, the local government equitable share, including the RSC/JSB levies
replacement grant and special support for councillor remuneration and ward committees, amounts to
R171.3 billion – R52.6 billion in 2016/17, R57 billion in 2017/18 and R61.7 billion in 2018/19.
To help compensate for the rising costs of free basic service provision in municipalities, amounts of
R1.5 billion in 2017/18 and R3 billion in 2018/19 will be added to the local government equitable share.
However, in 2016/17 the local government equitable share is reduced by R300 million due to the need to
reprioritise funds to urgent government priorities while reducing the expenditure ceiling. This reduction
amounts to only 0.6 per cent of the value of the local government equitable share in 2016/17.
Formula for allocating the local government equitable share
The share of national revenue allocated to local government through the equitable share is determined in
the national budget process and endorsed by Cabinet (the vertical division). Local government’s equitable
share is divided among the country’s 257 municipalities, using a formula (the horizontal division) to
ensure objectivity.
A new formula for the local government equitable share was introduced in 2013/14, following a review of
the previous formula by the National Treasury, the Department of Cooperative Governance and SALGA,
in partnership with the FFC and Statistics South Africa. The new formula is based on data from the 2011
Census. Statistics South Africa has updated the data from the 2011 Census to align with the geography of
the new municipal boundaries, which resulted in small changes to some allocations. The local government
equitable share formula’s principles and objectives were set out in detail in the Explanatory Memorandum
to the 2013 Division of Revenue.

ANNEXURE W1: EXPLANATORY MEMORANDUM TO THE DIVISION OF REVENUE
33
Structure of the local government equitable share formula
The formula uses demographic and other data to determine each municipality’s share of the local
government equitable share. It has three parts, made up of five components:
The first part of the formula consists of the basic services component, which provides for the cost of
free basic services for poor households.
The second part enables municipalities with limited resources to afford basic administrative and
governance capacity, and perform core municipal functions. It does this through three components:
The institutional component provides a subsidy for basic municipal administrative costs.
The community services component provides funds for other core municipal services not included
under basic services.
The revenue adjustment factor ensures that funds from this part of the formula are only provided to
municipalities with limited potential to raise their own revenue. Municipalities that are least able to
fund these costs from their own revenues should receive the most funding.
The third part of the formula provides predictability and stability through the correction and
stabilisation factor, which ensures that all of the formula’s guarantees can be met.
Each of these components is described in detail in the subsections that follow. The formula’s structure is
summarised in the box.
Structure of the local government equitable share formula
LGES = BS + (I + CS)xRA ± C
where
LGES is the local government equitable share
BS is the basic services component
I is the institutional component
CS is the community services component
RA is the revenue adjustment factor
C is the correction and stabilisation factor
The basic services component
This component helps municipalities provide free basic water, sanitation, electricity and refuse removal
services to households that fall below an affordability threshold. Following municipal consultation, the
formula’s affordability measure (used to determine how many households need free basic services) is
based on the level of two state old age pensions. When the 2011 Census was conducted, the state old age
pension was worth R1 140 per month, which means that two old age pensions were worth
R2 280 per month. A monthly household income of R2 300 per month (in 2011) has therefore been used to
define the formula’s affordability threshold. Statistics South Africa has calculated that 59 per cent of all
households in South Africa fall below this income threshold. The threshold is not an official poverty line
or a required level to be used by municipalities in their own indigence policies – if municipalities choose to
provide fewer households with free basic services than they are funded for through the local government
equitable share, then their budget documentation should clearly set out why they have made this choice
and how they have consulted with their community during the budget process.
The number of households per municipality, and the number below the poverty threshold, is updated
annually based on the growth experienced in the period between the 2001 and 2011 Censuses. Provincial
growth rates are then rebalanced to match the average annual provincial growth reported between 2002 and
2014 in the annual General Household Survey. Statistics South Africa has advised the National Treasury
that, in the absence of official municipal household estimates, this is a credible method of estimating the
household numbers per municipality needed for the formula. Statistics South Africa is researching methods
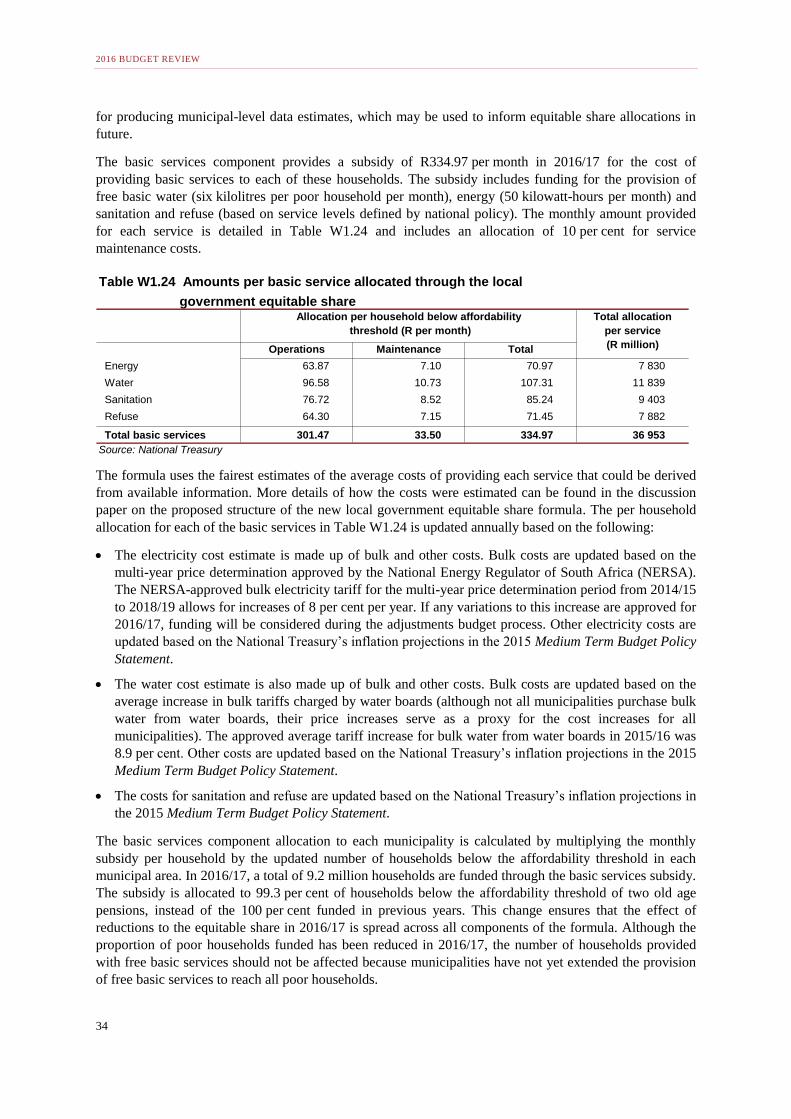
2016 BUDGET REVIEW
34
for producing municipal-level data estimates, which may be used to inform equitable share allocations in
future.
The basic services component provides a subsidy of R334.97 per month in 2016/17 for the cost of
providing basic services to each of these households. The subsidy includes funding for the provision of
free basic water (six kilolitres per poor household per month), energy (50 kilowatt-hours per month) and
sanitation and refuse (based on service levels defined by national policy). The monthly amount provided
for each service is detailed in Table W1.24 and includes an allocation of 10 per cent for service
maintenance costs.
The formula uses the fairest estimates of the average costs of providing each service that could be derived
from available information. More details of how the costs were estimated can be found in the discussion
paper on the proposed structure of the new local government equitable share formula. The per household
allocation for each of the basic services in Table W1.24 is updated annually based on the following:
The electricity cost estimate is made up of bulk and other costs. Bulk costs are updated based on the
multi-year price determination approved by the National Energy Regulator of South Africa (NERSA).
The NERSA-approved bulk electricity tariff for the multi-year price determination period from 2014/15
to 2018/19 allows for increases of 8 per cent per year. If any variations to this increase are approved for
2016/17, funding will be considered during the adjustments budget process. Other electricity costs are
updated based on the National Treasury’s inflation projections in the 2015 Medium Term Budget Policy
Statement.
The water cost estimate is also made up of bulk and other costs. Bulk costs are updated based on the
average increase in bulk tariffs charged by water boards (although not all municipalities purchase bulk
water from water boards, their price increases serve as a proxy for the cost increases for all
municipalities). The approved average tariff increase for bulk water from water boards in 2015/16 was
8.9 per cent. Other costs are updated based on the National Treasury’s inflation projections in the 2015
Medium Term Budget Policy Statement.
The costs for sanitation and refuse are updated based on the National Treasury’s inflation projections in
the 2015 Medium Term Budget Policy Statement.
The basic services component allocation to each municipality is calculated by multiplying the monthly
subsidy per household by the updated number of households below the affordability threshold in each
municipal area. In 2016/17, a total of 9.2 million households are funded through the basic services subsidy.
The subsidy is allocated to 99.3 per cent of households below the affordability threshold of two old age
pensions, instead of the 100 per cent funded in previous years. This change ensures that the effect of
reductions to the equitable share in 2016/17 is spread across all components of the formula. Although the
proportion of poor households funded has been reduced in 2016/17, the number of households provided
with free basic services should not be affected because municipalities have not yet extended the provision
of free basic services to reach all poor households.
Table W1.24 Amounts per basic service allocated through the local
government equitable share
Operations Maintenance Total
Energy 63.87 7.10 70.97 7 830
Water 96.58 10.73 107.31 11 839
Sanitation 76.72 8.52 85.24 9 403
Refuse 64.30 7.15 71.45 7 882
Total basic services 301.47 33.50 334.97 36 953
Source: National Treasury
Allocation per household below affordability
threshold (R per month)
Total allocation
per service
(R million)

ANNEXURE W1: EXPLANATORY MEMORANDUM TO THE DIVISION OF REVENUE
35
Funding for each basic service is allocated to the municipality (metro, district or local) that is authorised to
provide that service. If another municipality provides a service on behalf of the authorised municipality, it
must transfer funds to the provider in terms of section 29 of the Division of Revenue Act. The basic
services component is worth R37 billion in 2016/17 and accounts for 78.4 per cent of the value of the local
government equitable share.
The institutional component
To provide basic services to households, municipalities need to be able to run a basic administration. Most
municipalities should be able to fund the majority of their administration costs with their own revenue.
But, because poor households are not able to contribute in full, the equitable share includes an institutional
support component to help meet some of these costs. To ensure that this component supports
municipalities with limited revenue-raising abilities, a revenue adjustment factor is applied so that a larger
proportion of the allocation is received by municipalities with less potential to raise their own revenue. The
revenue adjustment factor is described in more detail later in this annexure.
This component consists of a base allocation of R5.9 million, which goes to every municipality, and an
additional amount that is based on the number of council seats in each municipality. This reflects the
relative size of a municipality’s administration and is not intended to fund the costs of councillors only (the
number of seats recognised for the formula is determined by the Minister of Cooperative Governance and
Traditional Affairs). The base component acknowledges that there are some fixed costs that all
municipalities face.
The institutional component
I = base allocation + [allocation per councillor * number of council seats]
The institutional component accounts for 8.6 per cent of the equitable share formula and is worth
R4.1 billion in 2016/17. This component is also complemented by special support for councillor
remuneration in poor municipalities, which is not part of the equitable share formula (described in more
detail later).
The community services component
This component funds services that benefit communities rather than individual households (which are
provided for in the basic services component). It includes funding for municipal health services, fire
services, municipal roads, cemeteries, planning, storm water management, street lighting and parks. To
ensure this component assists municipalities with limited revenue-raising abilities, a revenue adjustment
factor is applied so that these municipalities receive a larger proportion of the allocation.
The allocation for this component is split between district and local municipalities, because both provide
community services. In 2016/17, the allocation to district and metropolitan municipalities for municipal
health and related services is R8.28 per household per month. The component’s remaining funds are
allocated to local and metropolitan municipalities based on the number of households in each municipality.
The community services component
CS = [municipal health and related services allocation x number of households] + [other services allocation x number of households]
The basic services component
BS = basic services subsidy x number of poor households
2016 BUDGET REVIEW
36
The community services component accounts for 13 per cent of the equitable share formula and is worth
R6.1 billion in 2016/17.
The revenue adjustment factor
The Constitution gives local government substantial revenue-raising powers (particularly through property
rates and surcharges on services). Municipalities are expected to fund most of their own administrative
costs and cross-subsidise some services for indigent residents. Given the varied levels of poverty across
South Africa, the formula does not expect all municipalities to be able to generate similar amounts of own
revenue. A revenue adjustment factor is applied to the institutional and community services components of
the formula to ensure that these funds assist municipalities that are least likely to be able to fund these
functions from their own revenues.
To account for the varying fiscal capacities of municipalities, this component is based on a per capita index
using the following factors from the 2011 Census (all data has been updated to reflect new municipal
boundaries):
Total income of all individuals/households in a municipality (as a measure of economic activity and
earning)
Reported property values
Number of households on traditional land
Unemployment rate
Proportion of poor households as a percentage of the total number of households in the municipality.
Based on this index, municipalities were ranked according to their per capita revenue-raising potential. The
top 10 per cent of municipalities have a revenue adjustment factor of zero, which means that they do not
receive an allocation from the institutional and community services components. The 25 per cent of
municipalities with the lowest scores have a revenue adjustment factor of 100 per cent, which means that
they receive their full allocation from the institutional and community services components. Municipalities
between the bottom 25 per cent and top 10 per cent have a revenue adjustment factor applied on a sliding
scale, so that those with higher per capita revenue-raising potential receive a lower revenue adjustment
factor and those with less potential receive a larger revenue adjustment factor.
The revenue adjustment factor is not based on the actual revenues municipalities collect. This component
therefore does not create any perverse incentive for municipalities to under-collect potential own revenues
to receive a higher equitable share.
Because district municipalities do not collect own revenues from property rates, the revenue adjustment
factor applied to these municipalities is based on the RSC/JSB levies replacement grant allocations. This
grant replaces a source of own revenue previously collected by district municipalities and it is still treated
as an own-revenue source in many respects. Similar to the revenue adjustment factor for local and
metropolitan municipalities, the factor applied to district municipalities is based on their per capita
RSC/JSB levies replacement grant allocations. District municipalities are given revenue adjustment factors
on a sliding scale – those with a higher per capita RSC/JSB levies replacement grant allocation receive a
lower revenue adjustment factor, while those with lower allocations receive a larger revenue adjustment
factor.
Correction and stabilisation factor
Providing municipalities with predictable and stable equitable share allocations is one of the principles of
the equitable share formula. Indicative allocations are published for the second and third years of the
MTEF period to ensure predictability. To provide stability for municipal planning, while giving national
government flexibility to account for overall budget constraints and amend the formula, municipalities are
guaranteed to receive at least 90 per cent of the indicative allocation for the middle year of the MTEF
period.

ANNEXURE W1: EXPLANATORY MEMORANDUM TO THE DIVISION OF REVENUE
37
The changes to municipal boundaries result in some significant changes to municipal allocations in
2016/17. To cushion the impact of these changes, all municipalities will receive at least 95 per cent of the
equitable share formula allocation indicatively allocated to them in 2016/17 in the 2015 Division of
Revenue Act. For merged municipalities, this guarantee will be based on the sum of the equitable share
allocations to the previously separate municipalities. In cases where a municipality has been split, the
guarantee is applied to an area’s share of the former municipality’s equitable share, based on its portion of
the population in the former municipality.
A new equitable share formula was introduced in 2013/14 using updated 2011 Census data. As a result,
some municipalities will experience large changes in their equitable share allocations. To smooth the
impact of these changes and give municipalities time to adjust (both for municipalities with increasing and
decreasing allocations), the new allocations are being phased in over five years, from 2013/14 to 2017/18.
For municipalities with smaller allocations under the new formula, the phase-in mechanism measures the
difference between the municipality’s old and new allocations and closes this gap by 20 per cent each year.
This means that in the first year, a municipality only experienced a change equivalent to 20 per cent of the
gap between their allocations under the old and new formulas; in the second year, it completed 40 per cent
of the change; in the third year (2015/16), it completed 60 per cent; and in 2016/17 it will complete
80 per cent. In 2017/18, the allocation will be determined entirely through the new formula.
To provide for this phase-in approach, while staying within the limits of the equitable share, municipalities
with larger allocations will also have their increases phased in over five years. The total top-up amount
needed to fund the phasing in for municipalities with declining allocations is calculated and deducted from
those that do not require a top-up in proportion to their “surplus”. This means that municipalities with
larger allocations will have some of those gains delayed over the phase-in period.
Ensuring the formula balances
The formula is structured so that all of the available funds are allocated. The basic services component is
determined by the number of poor households per municipality and the estimated cost of free basic
services, so it cannot be manipulated. This means that the balancing of the formula to the available
resources must take place in the second part of the formula, which includes the institutional and
community services components. The formula automatically determines the value of the allocation per
council seat in the institutional component and the allocation per household for other services in the
community services component to ensure that it balances. Increases in the cost of providing basic services
can result in lower institutional and community services allocations. To ensure that the amounts allocated
through the institutional and basic services components do not decline by more than 10 per cent, the
proportion of households funded for free basic services has been reduced from 100 per cent of households
below the affordability threshold (equivalent to two old age pensions) to 99.3 per cent in 2016/17.
Potential future refinements to the formula
Although the local government equitable share formula has been through extensive consultations and
technical work, national government continues to work with stakeholders to improve the formula. Areas of
work include:
Developing differentiated cost variables to take account of the costs of services in various
circumstances, including costs related to the size of the land area served and settlement types in
municipalities. SALGA and the FFC have undertaken a research project that could provide the basis for
calculating such variables in future.
Refining the methodology used to update household growth estimates, taking account of updated data
from Statistics South Africa, and possibly including the 2016 Community Survey.
Government is committed to considering all proposed refinements to the formula, but another full review
is not envisaged until the current formula has been fully phased in and municipalities have had time to
adjust to the new allocations.

2016 BUDGET REVIEW
38
Details of new allocations
In addition to the three-year formula allocations published in the Division of Revenue Bill, a copy of the
formula, including the data used for each municipality and each component, is
published online (http://mfma.treasury.gov.za/Media_Releases/LGESDiscussions/Pages/default.aspx).
Other unconditional allocations
RSC/JSB levies replacement grant
Before 2006, district municipalities raised levies on local businesses through an RSC or JSB levy. This
source of revenue was replaced in 2006/07 with the RSC/JSB levies replacement grant, which was
allocated to all district and metropolitan municipalities based on the amounts they had previously collected
through the levies (the RSC/JSB levies replacement grant for metropolitan municipalities has since been
replaced by the sharing of the general fuel levy). The grant’s value increases every year. In 2016/17, the
grant increases by 8.5 per cent a year for district municipalities authorised for water and sanitation and
2.8 per cent for unauthorised district municipalities. The different rates recognise the various service
delivery responsibilities of these district municipalities.
Special support for councillor remuneration and ward committees
Councillors’ salaries are subsidised in poor municipalities. The total value of the support provided in
2016/17 is R861.7 million, calculated separately to the local government equitable share and in addition to
the funding for governance costs provided in the institutional component. The level of support for each
municipality is allocated based on a system gazetted by the Minister of Cooperative Governance and
Traditional Affairs, which classifies municipal councils into six grades based on their total income and
population size. Special support is provided to the lowest three grades of municipal councils (the smallest
and poorest municipalities).
A subsidy of 90 per cent of the gazetted maximum remuneration for a part-time councillor is provided for
every councillor in grade 1 municipalities, 80 per cent for grade 2 municipalities and 70 per cent for
grade 3 municipalities. In addition to this support for councillor remuneration, each local municipality in
grades 1 to 3 receives an allocation to provide stipends of R500 per month to 10 members of each ward
committee in their municipality. Each municipality’s allocation for this special support is published in the
Division of Revenue Bill appendices.
All data used in these calculations was updated to take account of new demarcations and councillor
numbers. The new grades for municipalities affected by boundary re-determinations will only be
confirmed once the new municipalities have been formally established. For 2016/17 allocations, it was
assumed that the grade of a new municipality would be equal to the highest grade of the existing
municipalities being merged to form the new municipality. Because grades are based on municipal income
and population, merging municipalities can only increase the grade. The new municipality created in
Limpopo, formed by merging part of Thulamela Local Municipality and part of Makhado Local
Municipality, is assumed to be a grade 3 municipality based on its population size.
Conditional grants to local government
National government allocates funds to local government through a variety of conditional grants. These
grants fall into two main groups: infrastructure and capacity building. The total value of conditional grants
directly transferred to local government increases from R41.1 billion in 2016/17 to R44.5 billion in
2017/18 and R47.1 billion in 2018/19.
ANNEXURE W1: EXPLANATORY MEMORANDUM TO THE DIVISION OF REVENUE
39
There are four types of local government conditional grants:
Schedule 4B sets out general grants that supplement various programmes partly funded by
municipalities.
Schedule 5B grants fund specific responsibilities and programmes implemented by municipalities.
Schedule 6B grants provide in-kind allocations through which a national department implements
projects in municipalities.
Schedule 7B grants provide for the swift allocation and transfer of funds to a municipality to help it
deal with a disaster.
Local government infrastructure grant review
The National Treasury, in collaboration with the Department of Cooperative Governance, the Department
of Planning, Monitoring and Evaluation, SALGA and the FFC, has reviewed the system of local
government infrastructure grants. The process has involved wide consultation, including many
engagements with municipalities and national officials responsible for managing grants. The review
proposes several changes that will be implemented in the 2016 Budget. The structure of grants allocated to
different types of municipalities will be changed to increase their differentiation and reduce grant
proliferation; improve asset management over the lifespan of municipal infrastructure; and enhance
national grant support and oversight.
Following the implementation of the initial changes emerging from the review in 2015/16, further reforms
will be phased in over the 2016 MTEF period in the following areas:
Asset management
The grant review has proposed several changes to incentivise asset management practices that improve
functionality and reliability over the full lifecycle of municipal infrastructure. This includes allowing grant
funds to be used to refurbish infrastructure (in the past, the focus was largely on constructing new
infrastructure) and establish asset maintenance plans. Over time, stronger conditions will be put in place to
require municipalities to use these asset management systems to prioritise the maintenance and investment
needed on their infrastructure.
The quality of rural roads continues to be a major obstacle to mobility in rural communities. Over several
years, data has been collected on the extent and condition of roads using the rural roads asset management
systems grant. This data can be used to guide municipalities on which roads to maintain and upgrade to
achieve the best return for their investment. Unlike other basic municipal functions, there is no funding for
road maintenance in the local government equitable share. As such, the grant review proposes that
municipalities should be allowed to use funds from the municipal infrastructure grant to maintain and
refurbish roads if they use data from their roads asset management systems to prioritise their investments.
Differentiation and grant proliferation
The review acknowledged that the infrastructure needs of cities and rural areas are very different, which is
why the grant system for these areas must be structured differently. While metropolitan municipalities
already receive specialist urban grants such as the urban settlements development grant, secondary cities
largely receive the same grants and are subject to the same rules as rural municipalities. In 2016/17, new
planning requirements will be introduced for secondary cities as the first step towards introducing
differentiation in the grant system to better respond to urban development challenges. Cities that meet the
criteria will be eligible for a separate grant in the outer years of the MTEF period. The consolidation of
infrastructure grants for metropolitan municipalities is also intended to be phased in over the medium term
and eventually extended to secondary cities.
Major investments in urban public transport continue to be made through the grant system. Following the
merging of two public transport grants in the 2015 Budget, the grant review engaged in further analysis
2016 BUDGET REVIEW
40
and consultation to continue the reform. The Department of Transport will introduce a new formula-based
allocation methodology for the public transport network grant over the 2016 MTEF period. This should
increase municipalities’ certainty about the national funding they can expect when planning for their public
transport networks, and encourage cities to plan and develop systems that they can afford to operate in the
long term.
In rural areas, the multiple grants in the water and sanitation sector will be merged to form two grants, the
regional bulk infrastructure grant, which funds large bulk projects, and the water services infrastructure
grant, which funds the building and refurbishment of water and sanitation schemes in municipalities with
weaker capacity.
Grant management
The review concluded that there is substantial scope to improve the outcomes of the infrastructure
conditional grants by enhancing the oversight and support provided to municipalities by the sector
departments transferring conditional grants. Departments have been asked to identify and prioritise the
resources they allocate to manage grants in their departments. The Municipal Infrastructure Support Agent
will also play a greater role in helping municipalities improve their delivery of infrastructure, including
through new regional management support contracts, which will be piloted in 2016/17. The Department of
Cooperative Governance will work to strengthen the municipalities and their project management units
that are funded using the municipal infrastructure grant. Each municipality will have to submit a plan for
how they plan to use their project management unit funds and demonstrate how this will lead to improved
performance. Performance can then be monitored against these plans and municipalities held accountable
for their implementation.
Municipalities have raised many complaints about the extensive reporting required of them, including
through the grant system. The Cities Support Programme is leading a project to reduce overlaps and
simplify reporting requirements that may feed into grant requirements in future. In 2016/17, the reporting
burden should be reduced because several grants have been consolidated, thereby reducing the number of
grants on which municipalities have to report.
Infrastructure conditional grants to local government
National transfers for infrastructure, including indirect or in-kind allocations to entities executing specific
projects in municipalities, amount to R149.3 billion over the 2016 MTEF period.
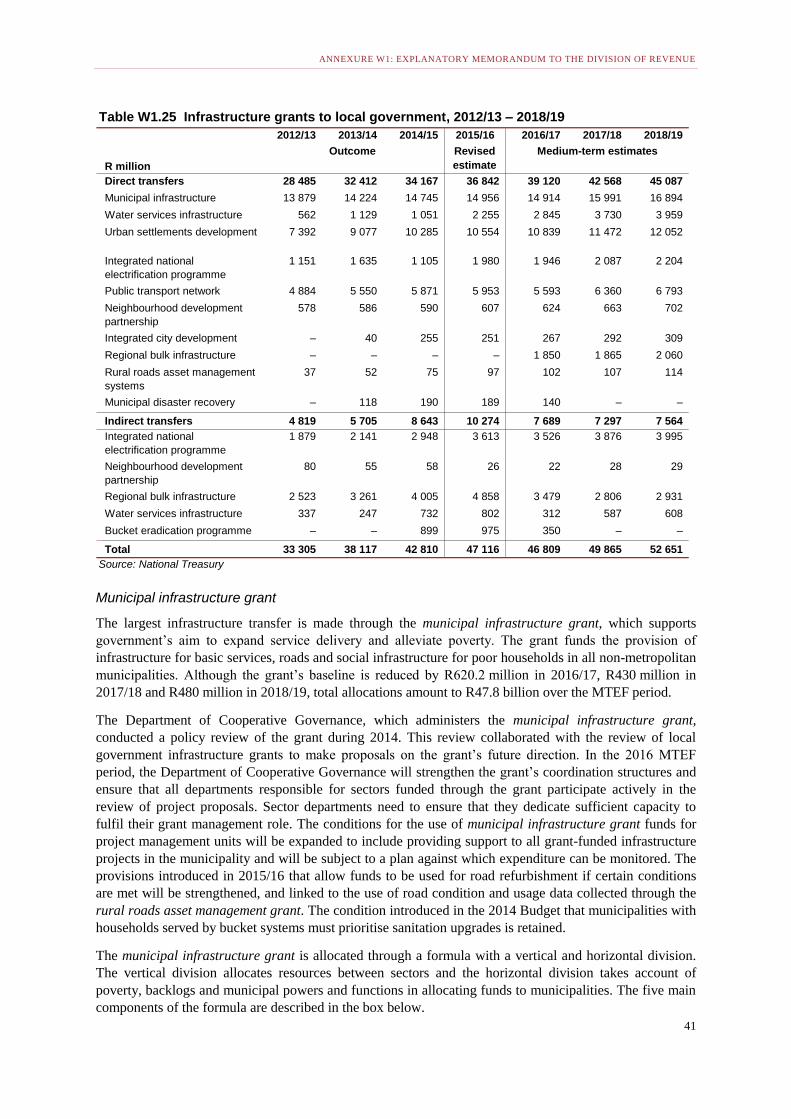
ANNEXURE W1: EXPLANATORY MEMORANDUM TO THE DIVISION OF REVENUE
41
Municipal infrastructure grant
The largest infrastructure transfer is made through the municipal infrastructure grant, which supports
government’s aim to expand service delivery and alleviate poverty. The grant funds the provision of
infrastructure for basic services, roads and social infrastructure for poor households in all non-metropolitan
municipalities. Although the grant’s baseline is reduced by R620.2 million in 2016/17, R430 million in
2017/18 and R480 million in 2018/19, total allocations amount to R47.8 billion over the MTEF period.
The Department of Cooperative Governance, which administers the municipal infrastructure grant,
conducted a policy review of the grant during 2014. This review collaborated with the review of local
government infrastructure grants to make proposals on the grant’s future direction. In the 2016 MTEF
period, the Department of Cooperative Governance will strengthen the grant’s coordination structures and
ensure that all departments responsible for sectors funded through the grant participate actively in the
review of project proposals. Sector departments need to ensure that they dedicate sufficient capacity to
fulfil their grant management role. The conditions for the use of municipal infrastructure grant funds for
project management units will be expanded to include providing support to all grant-funded infrastructure
projects in the municipality and will be subject to a plan against which expenditure can be monitored. The
provisions introduced in 2015/16 that allow funds to be used for road refurbishment if certain conditions
are met will be strengthened, and linked to the use of road condition and usage data collected through the
rural roads asset management grant. The condition introduced in the 2014 Budget that municipalities with
households served by bucket systems must prioritise sanitation upgrades is retained.
The municipal infrastructure grant is allocated through a formula with a vertical and horizontal division.
The vertical division allocates resources between sectors and the horizontal division takes account of
poverty, backlogs and municipal powers and functions in allocating funds to municipalities. The five main
components of the formula are described in the box below.
Table W1.25 Infrastructure grants to local government, 2012/13 – 2018/19
2012/13 2013/14 2014/15 2015/16 2016/17 2017/18 2018/19
R million
Revised
estimate
Direct transfers 28 485 32 412 34 167 36 842 39 120 42 568 45 087
Municipal infrastructure 13 879 14 224 14 745 14 956 14 914 15 991 16 894
Water services infrastructure 562 1 129 1 051 2 255 2 845 3 730 3 959
Urban settlements development 7 392 9 077 10 285 10 554 10 839 11 472 12 052
Integrated national
electrification programme
1 151 1 635 1 105 1 980 1 946 2 087 2 204
Public transport network 4 884 5 550 5 871 5 953 5 593 6 360 6 793
Neighbourhood development
partnership
578 586 590 607 624 663 702
Integrated city development – 40 255 251 267 292 309
Regional bulk infrastructure – – – – 1 850 1 865 2 060
Rural roads asset management
systems
37 52 75 97 102 107 114
Municipal disaster recovery – 118 190 189 140 – –
Indirect transfers 4 819 5 705 8 643 10 274 7 689 7 297 7 564
Integrated national
electrification programme
1 879 2 141 2 948 3 613 3 526 3 876 3 995
Neighbourhood development
partnership
80 55 58 26 22 28 29
Regional bulk infrastructure 2 523 3 261 4 005 4 858 3 479 2 806 2 931
Water services infrastructure 337 247 732 802 312 587 608
Bucket eradication programme – – 899 975 350 – –
Total 33 305 38 117 42 810 47 116 46 809 49 865 52 651
Source: National Treasury
Outcome Medium-term estimates

2016 BUDGET REVIEW
42
Municipal infrastructure grant = C + B + P + E + N
C Constant to ensure increased minimum allocation for small municipalities (this allocation is
made to all municipalities)
B Basic residential infrastructure (proportional allocations for water supply and sanitation, roads
and other services such as street lighting and solid waste removal)
P Public municipal service infrastructure (ring-fenced for municipal sport infrastructure)
E Allocation for social institutions and micro-enterprises infrastructure
N Allocation to the 27 priority districts identified by government
For the 2016 MTEF, the municipal infrastructure grant allocation formula uses data from the 2011 Census
(updated to reflect municipal boundary changes). Allocations for basic services sub-components are based
on the proportion of the national backlog for that service in each municipality. Other components are based
on the proportion of the country’s poor households located in each municipality. Table W1.26 sets out the
proportion of the grant accounted for by each component of the formula. The C-component provides a
R5 million base to all municipalities receiving municipal infrastructure grant allocations.
A total of R300 million of municipal infrastructure grant funds is allocated outside of the grant formula
and earmarked for specific sport infrastructure projects identified by Sport and Recreation South Africa. In
addition, municipalities are required to spend a third of the P-component (equivalent to 4.5 per cent of the
grant) on sport and recreation infrastructure identified in their own integrated development plans.
Municipalities are also encouraged to increase their investment in other community infrastructure,
including cemeteries, community centres, taxi ranks and marketplaces.
Urban settlements development grant
The urban settlements development grant is an integrated source of funding to provide infrastructure for
municipal services and upgrade urban informal settlements in the eight metropolitan municipalities. The
grant is allocated as a supplementary grant to cities (schedule 4 of the Division of Revenue Act), which
means that municipalities are expected to use a combination of grant funds and their own revenue to
develop urban infrastructure and integrated human settlements. Cities report their progress on these
projects against the targets set in their service delivery and budget implementation plans.
Table W1.26 Municipal infrastructure grant allocations per sector
Municipal infrastructure
grant (formula)
Component
weights
Value of
component
2016/17
(R millions)
Proportion of
municipal
infrastructure
grant per
sector
B-component 75.0% 10 113 67.8%
Water and sanitation 72.0% 7 281 48.8%
Roads 23.0% 2 326 15.6%
Other 5.0% 506 3.4%
P-component 15.0% 2 023 13.6%
Sports 33.3% 674 4.5%
E-component 5.0% 674 4.5%
N-component 5.0% 674 4.5%
Constant 1 130 7.6%
300 2.0%
Total 14 914 100.0%
Source: National Treasury
Ringfenced funding for sport infrastructure

ANNEXURE W1: EXPLANATORY MEMORANDUM TO THE DIVISION OF REVENUE
43
The municipal human settlements capacity grant was introduced in 2014/15 to build capacity in
anticipation of the devolution of the housing function to metropolitan municipalities, which has not taken
place. As a result, the 2016 Budget is concluding this grant. Instead, up to three per cent of the urban
settlements development grant may be used to fund municipal capacity in the built environment.
As part of the demarcation process, municipal infrastructure grant funds previously allocated to Naledi
Municipality have been shifted to the urban settlements development grant allocation for Mangaung
Metropolitan Municipality, because the two municipalities are merging. The grant is allocated a total of
R34.4 billion over the 2016 MTEF period.
Integrated city development grant
The grant provides a financial incentive for metropolitan municipalities to focus their use of infrastructure
investment and regulatory instruments to achieve more compact and efficient urban spaces. Cities are
required to submit built environment performance plans for this grant, including a brief strategic overview
of the city’s plans for the built environment, with a focus on the infrastructure grants that form part of the
capital budget. The plan should show how the municipality will ensure alignment between its different
grant-funded programmes and how it will address related policy and regulatory matters. All projects
funded by sector-specific infrastructure grants, including the urban settlements development grant, the
public transport network grant, the neighbourhood development partnership grant and the integrated
national electrification programme grant, must form part of a metropolitan municipality’s built
environment performance plan. The grant is allocated R868 million over the 2016 MTEF period.
Public transport network grant
The public transport network grant, administered by the Department of Transport, helps cities create or
improve public transport systems in line with the National Land Transport Act (2009) and the Public
Transport Strategy. This includes all integrated public transport network infrastructure, such as bus rapid
transit systems, conventional bus services and upgrades for pedestrian and cycling infrastructure. It also
subsidises the operation of these services.
A new formula-based allocation methodology will be phased in over the medium term. This formula aims
to increase certainty about the extent of national funding that municipalities expect when planning their
public transport networks, and encourage cities to shift towards more sustainable transport investments.
Cities need to plan within a realistic envelope of support from national government, without additional
subsidies. By 2017/18, strict eligibility conditions will be enforced, including requirements that cities
demonstrate that their planned public transport systems will be financially sustainable. The formula is
made up of three components, which account for the number of people in a city; the number of public
transport users in a city (the weighting of train commuters is reduced as trains are subsidised separately
through the Passenger Rail Authority of South Africa); and the size of a city’s economy.
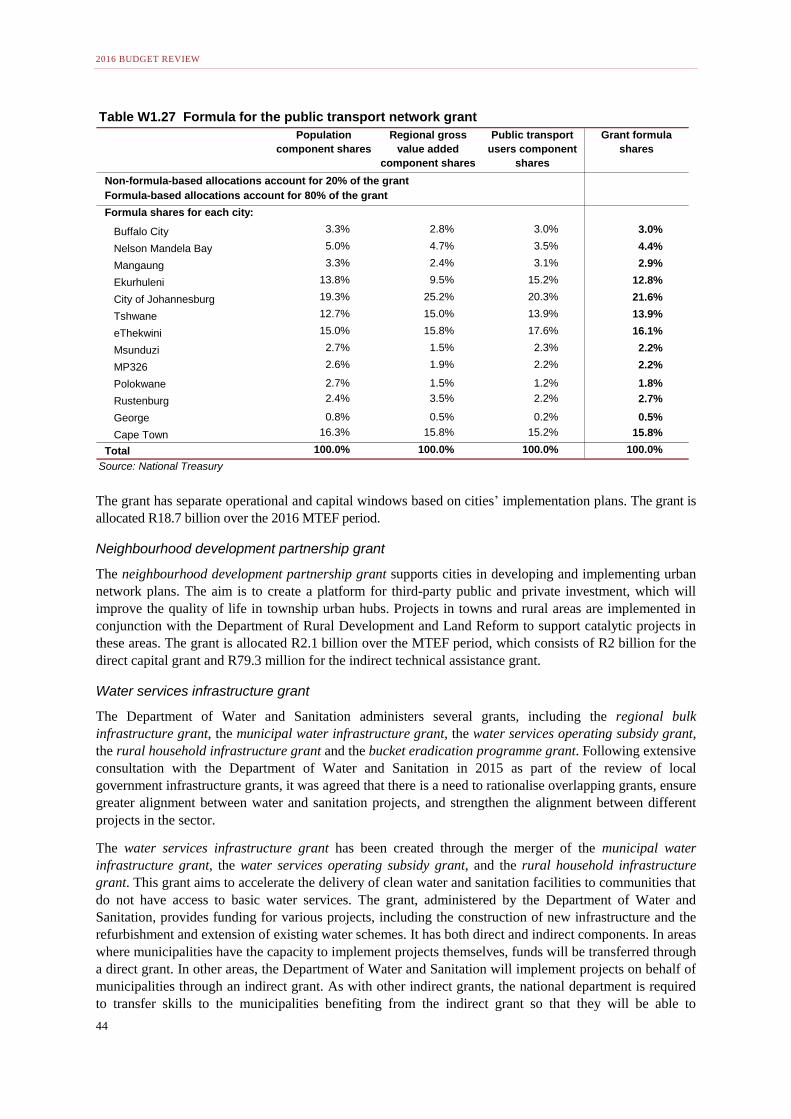
2016 BUDGET REVIEW
44
The grant has separate operational and capital windows based on cities’ implementation plans. The grant is
allocated R18.7 billion over the 2016 MTEF period.
Neighbourhood development partnership grant
The neighbourhood development partnership grant supports cities in developing and implementing urban
network plans. The aim is to create a platform for third-party public and private investment, which will
improve the quality of life in township urban hubs. Projects in towns and rural areas are implemented in
conjunction with the Department of Rural Development and Land Reform to support catalytic projects in
these areas. The grant is allocated R2.1 billion over the MTEF period, which consists of R2 billion for the
direct capital grant and R79.3 million for the indirect technical assistance grant.
Water services infrastructure grant
The Department of Water and Sanitation administers several grants, including the regional bulk
infrastructure grant, the municipal water infrastructure grant, the water services operating subsidy grant,
the rural household infrastructure grant and the bucket eradication programme grant. Following extensive
consultation with the Department of Water and Sanitation in 2015 as part of the review of local
government infrastructure grants, it was agreed that there is a need to rationalise overlapping grants, ensure
greater alignment between water and sanitation projects, and strengthen the alignment between different
projects in the sector.
The water services infrastructure grant has been created through the merger of the municipal water
infrastructure grant, the water services operating subsidy grant, and the rural household infrastructure
grant. This grant aims to accelerate the delivery of clean water and sanitation facilities to communities that
do not have access to basic water services. The grant, administered by the Department of Water and
Sanitation, provides funding for various projects, including the construction of new infrastructure and the
refurbishment and extension of existing water schemes. It has both direct and indirect components. In areas
where municipalities have the capacity to implement projects themselves, funds will be transferred through
a direct grant. In other areas, the Department of Water and Sanitation will implement projects on behalf of
municipalities through an indirect grant. As with other indirect grants, the national department is required
to transfer skills to the municipalities benefiting from the indirect grant so that they will be able to
Table W1.27 Formula for the public transport network grant
Population
component shares
Regional gross
value added
component shares
Public transport
users component
shares
Grant formula
shares
Non-formula-based allocations account for 20% of the grant
Formula-based allocations account for 80% of the grant
Formula shares for each city:
Buffalo City 3.3% 2.8% 3.0% 3.0%
Nelson Mandela Bay 5.0% 4.7% 3.5% 4.4%
Mangaung 3.3% 2.4% 3.1% 2.9%
Ekurhuleni 13.8% 9.5% 15.2% 12.8%
City of Johannesburg 19.3% 25.2% 20.3% 21.6%
Tshwane 12.7% 15.0% 13.9% 13.9%
eThekwini 15.0% 15.8% 17.6% 16.1%
Msunduzi 2.7% 1.5% 2.3% 2.2%
MP326 2.6% 1.9% 2.2% 2.2%
Polokwane 2.7% 1.5% 1.2% 1.8%
Rustenburg 2.4% 3.5% 2.2% 2.7%
George 0.8% 0.5% 0.2% 0.5%
Cape Town 16.3% 15.8% 15.2% 15.8%
Total 100.0% 100.0% 100.0% 100.0%
Source: National Treasury

ANNEXURE W1: EXPLANATORY MEMORANDUM TO THE DIVISION OF REVENUE
45
implement projects themselves in future. Over the 2016 MTEF period, the total allocation for the direct
portion of the grant is R10.5 billion and an additional R1.5 billion will be made available for the indirect
component.
Regional bulk infrastructure grant
This grant supplements the financing of the social component of regional bulk water and sanitation
infrastructure. It targets projects that cut across several municipalities or large bulk projects within one
municipality. The grant funds the bulk infrastructure needed to provide reticulated water and sanitation
services to individual households. It may also be used to appoint service providers to carry out feasibility
studies, related planning or management studies for infrastructure projects. It has both direct and indirect
components. In areas where municipalities have the capacity to implement projects themselves, funds will
be transferred through a direct grant. In other areas, the Department of Water and Sanitation will
implement projects on behalf of municipalities through an indirect grant. A parallel programme, funded by
the Department of Water and Sanitation, also funds water boards for the construction of bulk
infrastructure. Though not part of the division of revenue, these projects still form part of the Department
of Water and Sanitation’s larger programme of subsidising the construction of regional bulk infrastructure
for water and sanitation. The grant has a total allocation of R15 billion over the 2016 MTEF period,
consisting of R5.8 billion and R9.2 billion for the direct and indirect components respectively.
Bucket eradication programme grant
The bucket eradication programme grant is an indirect grant to municipalities administered by the
Department of Water and Sanitation. It funds the eradication of bucket sanitation systems in formal
residential areas. This indirect grant was due to end in 2015/16, but it has been extended by one year to
allow the grant to complete its eradication work (implementation was delayed in 2014/15 due to a
sanitation function shift between departments). The human settlement development grant, urban
settlements development grant and municipal infrastructure grant will prioritise the upgrade of sanitation
in informal areas as part of their funding for informal settlement upgrades. The programme will be
reviewed in 2016/17 to inform the close-out (or extension) of this grant. It is allocated R350 million in
2016/17.
Integrated national electrification programme grants
The national electrification programme has been instrumental in providing 85 per cent of all households
with access to electricity, as reported in the 2011 Census. To sustain progress in connecting poor
households to electricity, government will spend R17.6 billion on the programme over the next three years.
Of this, municipalities are allocated R6.2 billion and Eskom is allocated R11.4 billion to spend on behalf
of municipalities through an indirect grant.
Rural roads asset management systems grant
The Department of Transport administers the rural roads asset management systems grant to improve
rural road infrastructure. The grant funds the collection of data on the condition and usage of rural roads in
line with the Road Infrastructure Strategic Framework for South Africa. This data will guide investments
to maintain and improve these roads. District municipalities collect this data on all the municipal roads in
their area so that the spending of infrastructure funds (from the municipal infrastructure grant and
elsewhere) can be properly planned to maximise impact. As data becomes available, incentives will be
introduced to ensure that municipalities use this information to plan road maintenance appropriately. The
municipal infrastructure grant stipulates that municipalities must use data from roads asset management
systems to prioritise investment in roads projects.
The Department of Transport has committed to working with the municipal infrastructure grant
administrators to ensure that municipal roads projects are chosen, prioritised and approved using roads
asset management systems data wherever possible. The data already collected suggests that as much as
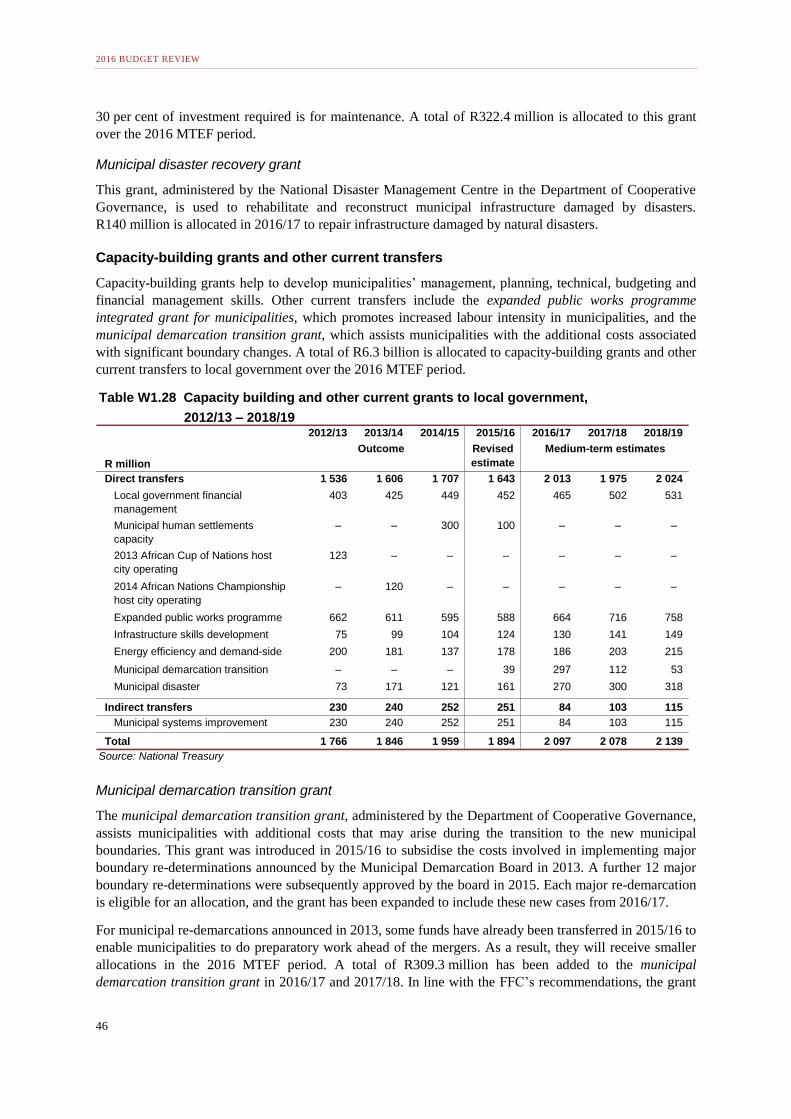
2016 BUDGET REVIEW
46
30 per cent of investment required is for maintenance. A total of R322.4 million is allocated to this grant
over the 2016 MTEF period.
Municipal disaster recovery grant
This grant, administered by the National Disaster Management Centre in the Department of Cooperative
Governance, is used to rehabilitate and reconstruct municipal infrastructure damaged by disasters.
R140 million is allocated in 2016/17 to repair infrastructure damaged by natural disasters.
Capacity-building grants and other current transfers
Capacity-building grants help to develop municipalities’ management, planning, technical, budgeting and
financial management skills. Other current transfers include the expanded public works programme
integrated grant for municipalities, which promotes increased labour intensity in municipalities, and the
municipal demarcation transition grant, which assists municipalities with the additional costs associated
with significant boundary changes. A total of R6.3 billion is allocated to capacity-building grants and other
current transfers to local government over the 2016 MTEF period.
Municipal demarcation transition grant
The municipal demarcation transition grant, administered by the Department of Cooperative Governance,
assists municipalities with additional costs that may arise during the transition to the new municipal
boundaries. This grant was introduced in 2015/16 to subsidise the costs involved in implementing major
boundary re-determinations announced by the Municipal Demarcation Board in 2013. A further 12 major
boundary re-determinations were subsequently approved by the board in 2015. Each major re-demarcation
is eligible for an allocation, and the grant has been expanded to include these new cases from 2016/17.
For municipal re-demarcations announced in 2013, some funds have already been transferred in 2015/16 to
enable municipalities to do preparatory work ahead of the mergers. As a result, they will receive smaller
allocations in the 2016 MTEF period. A total of R309.3 million has been added to the municipal
demarcation transition grant in 2016/17 and 2017/18. In line with the FFC’s recommendations, the grant
Table W1.28 Capacity building and other current grants to local government,
2012/13 – 2018/192012/13 2013/14 2014/15 2015/16 2016/17 2017/18 2018/19
R million
Revised
estimate
Direct transfers 1 536 1 606 1 707 1 643 2 013 1 975 2 024
Local government financial
management
403 425 449 452 465 502 531
Municipal human settlements
capacity
– – 300 100 – – –
2013 African Cup of Nations host
city operating
123 – – – – – –
2014 African Nations Championship
host city operating
– 120 – – – – –
Expanded public works programme
integrated grant for municipalities
662 611 595 588 664 716 758
Infrastructure skills development 75 99 104 124 130 141 149
Energy efficiency and demand-side
management
200 181 137 178 186 203 215
Municipal demarcation transition – – – 39 297 112 53
Municipal disaster 73 171 121 161 270 300 318
Indirect transfers 230 240 252 251 84 103 115
Municipal systems improvement 230 240 252 251 84 103 115
Total 1 766 1 846 1 959 1 894 2 097 2 078 2 139
Source: National Treasury
Outcome Medium-term estimates

ANNEXURE W1: EXPLANATORY MEMORANDUM TO THE DIVISION OF REVENUE
47
will conclude at the end of 2017/18 because it is only intended to fund transitional costs and it will not
form a permanent part of the intergovernmental transfer system.
Local government financial management grant
The local government financial management grant, managed by the National Treasury, funds the
placement of financial management interns and the modernisation of financial management systems. This
includes building in-house municipal capacity to implement multi-year budgeting, linking integrated
development plans to budgets, and producing quality and timely in-year and annual reports. The grant
supports municipalities in the implementation of the Municipal Finance Management Act and also
provides funds for the implementation of the municipal standard chart of accounts. Total allocations
amount to R1.5 billion over the 2016 MTEF period.
Infrastructure skills development grant
The infrastructure skills development grant develops capacity within municipalities by creating a
sustainable pool of young professionals with technical skills related to municipal services, such as water,
electricity and town planning. The grant places interns in municipalities, so they can complete the
requirements of the relevant statutory council within their respective built environment fields. The interns
can be hired by any municipality at the end of their internship. The grant is allocated R420.2 million over
the 2016 MTEF period.
Municipal systems improvement grant
The municipal systems improvement grant will be implemented as an indirect grant in the 2016 MTEF
period. It will fund a range of projects in municipalities in support of the Back to Basics strategy, including
helping municipalities set up adequate records management systems, drawing up organograms for
municipalities and reviewing their appropriateness relative to their assigned functions, and assisting
municipalities with revenue collection plans. The indirect grant will be complemented by the Department
of Cooperative Governance’s work to develop an integrated consumer database that municipalities can
draw data from, as well as a performance management system to track municipal performance. Over the
MTEF period, R302.7 million is allocated to this grant.
Expanded public works programme integrated grant for municipalities
This grant promotes the use of labour-intensive methods in delivering municipal infrastructure and
services. It is allocated through a formula based on past performance, which creates an incentive for
municipalities. The formula has an extra weighting to give bigger allocations to poor, rural municipalities.
The grant is allocated R664 million in 2016/17, and R2.1 billion over the 2016 MTEF period.
The energy efficiency and demand-side management grant
The energy efficiency and demand-side management grant funds selected municipalities to implement
energy-efficiency projects, with a focus on public lighting and energy-efficient municipal infrastructure. In
the 2016 MTEF period, the Department of Energy will monitor and verify grant-funded projects to ensure
greater consistency in the procurement of accredited verification services. The grant is allocated
R603.9 million over the 2016 MTEF period.
Municipal disaster grant
The municipal disaster grant is administered by the National Disaster Management Centre in the
Department of Cooperative Governance as an unallocated grant to local government. The centre is able to
disburse disaster-response funds immediately, without the need for the transfers to be gazetted first. To
ensure that sufficient funds are available in the event of disasters, section 21 of the Division of Revenue
Bill allows for funds allocated to the provincial disaster grant to be transferred to municipalities if funds in
the municipal disaster grant have already been exhausted, and vice versa. The bill also allows for more
2016 BUDGET REVIEW
48
than one transfer to be made to areas affected by disasters, so that initial emergency aid can be provided
before a full assessment of damages and costs is complete. Over the MTEF period, R887.9 million is
available for disbursement through this grant. To ensure that sufficient funds will be available for disaster
relief, section 20 of the Division of Revenue Bill has been revised to allow funds from other conditional
grants to be reallocated to fund disaster relief, subject to the National Treasury’s approval.
Part 6: Future work on provincial and municipal fiscal frameworks
The fiscal frameworks for provincial and local government encompass all their revenue sources and
expenditure responsibilities. As underlying social and economic trends evolve and the assignment of
intergovernmental functions change, so must the fiscal frameworks. The National Treasury, together with
relevant stakeholders, conducts continuous reviews to ensure that provinces and municipalities have an
appropriate balance of available revenues and expenditure responsibilities, while taking account of the
resources available and the principles of predictability and stability. This part of the annexure describes the
main areas of work to be undertaken during 2016/17 as part of the ongoing review and refinement of the
intergovernmental fiscal framework. Provinces and municipalities will be consulted on all proposed
changes to the fiscal frameworks.
Review of the provincial equitable share formula
The Constitution stipulates that provinces are entitled to a share of nationally raised revenue to deliver on
their mandates. The current process of dividing up provincial funds uses a formula that considers the
spread of the burden of service delivery across provinces. The provincial equitable share formula contains
weighted elements that reflect government priorities and incorporates elements to redress inequality and
poverty across provinces. Over time, the formula, like any budgetary allocation tool, may no longer mirror
the realities provinces face. As such, there is a need for periodic review of the formula to assess its
continued appropriateness and equity. In 2016, the National Treasury will start a detailed review of the
equitable share formula. The Technical Committee on Finance and the Budget Council will be consulted as
part of this work.
The role of provinces in promoting economic development
Provinces and municipalities play a crucial role in advancing the economic development of their respective
precincts. Fully functional, well-equipped schools will produce a vibrant and employable workforce.
Smarter health systems develop and maintain the health of the workforce. Provincial agriculture
departments’ support to farmers can stimulate rural development. The provision of provincial and
municipal roads and public transport services ensures mobility for goods and workers, while basic
municipal services such as water, electricity and refuse removal, as well as business licencing and
environmental health functions, enable businesses to operate and grow. Well-managed procurement can
maximise developmental impact without compromising efficiencies.
Government in all three spheres must work with businesses and other relevant stakeholders to provide an
enabling environment for the faster and more inclusive economic growth called for in the National
Development Plan. Since 2015, national and provincial treasuries have been working together through a
task team of the Technical Committee on Finance to better define the role provinces should play in
promoting economic development. This will enable provinces to maximise their impact on provincial
economies in future.
National health insurance policy work
The National Health Insurance White Paper was released on 11 December 2015 for public comment. The
Technical Committee on Finance will review the white paper, with a focus on the impact it will have on
provinces. The aim is to assess the restructuring of the health system, particularly primary healthcare,
necessary to ensure the success of national health insurance in South Africa.

ANNEXURE W1: EXPLANATORY MEMORANDUM TO THE DIVISION OF REVENUE
49
Local government grants
The system of transfers to local government is continuously being reviewed and refined to improve the
effectiveness and value for money achieved from the funds transferred to municipalities. The local
government equitable share was reviewed in 2012 and local government infrastructure grants were
reviewed between 2013 and 2015. In 2016, the National Treasury will lead the continued implementation
of the previous reviews’ recommendations, and make further improvements to the effectiveness of local
government capacity-building allocations.
Reforms to infrastructure grants in the period ahead will focus on:
Improving asset management incentives and enhancing the new provisions in infrastructure grants that
allow funds to be spent on refurbishment.
Strengthening grant management practices in national departments.
Continuing to consolidate urban infrastructure grants.
Supporting cities to promote urban spatial transformation and economic growth
Cities, through delivery of infrastructure and services, play an important role in creating a conducive
environment for inclusive growth, job creation and poverty eradication. To achieve this will require well-
managed spatial transformation of cities. Government is exploring changes to the fiscal and regulatory
structures for urban municipalities to ensure that they have sufficient and effective instruments to mobilise
revenue for financing municipal strategic infrastructure capable of promoting growth.
Potential changes to the structure of the fiscal framework include:
Consolidating urban grants and enhancing the use of performance incentives with transfers, such as
with the integrated cities development grant (this work will form part of the review of local
government infrastructure grants).
Enabling greater flexibility in the use of grants to accelerate the implementation of catalytic
investments.
Enabling cities to leverage grant and own-revenue funds over a longer period for strategic projects.
These measures will be complemented by reviews of, and potential changes to, the regulatory structures
for development charges, municipal borrowing and metropolitan municipalities’ own-revenue powers.
Any potential changes to the fiscal and regulatory systems will also be accompanied by additional
technical support to further strengthen the capacity of cities to take advantage of these changes. The Cities
Support Programme is coordinating initiatives in this area. Cities are already receiving expanded project
preparation support to help them build a pipeline of strategic investment projects that can attract private
finance. In addition, the Development Bank of Southern Africa is increasing its assistance to give cities
better access to funding for strategic projects by enhancing their appraisal and supervision arrangements or
extending the average debt maturity.
Regulating development charges
Municipalities charge developers a once-off fee before approving land development applications. The
National Treasury has consulted with stakeholders on the draft policy framework for municipal
development charges. The draft policy will be published for public comment following Cabinet’s approval.
The Municipal Fiscal Powers and Functions Amendment Bill has been drafted to make provision for the
regulation of development charges. Due to a new requirement to conduct a socio-impact analysis on new
legislation or amendments to existing legislation, the amendment bill will be published at the beginning of
2016/17.
2016 BUDGET REVIEW
50
Reforming municipal borrowing
Long-term borrowing can be an effective way for municipalities to finance infrastructure development.
However, responsible borrowing requires an appropriate institutional framework and financial controls.
The Policy Framework for Municipal Borrowing and Financial Emergencies (1999) and the Municipal
Finance Management Act set out a range of measures to facilitate responsible municipal borrowing. These
measures deal with issues such as sovereign risk, credit enhancements, maturities, avoidance of direct
government assistance, and liquidity through the development of secondary markets.
However, there are still some bottlenecks that impede municipalities’ full participation in the debt market
to mobilise resources for infrastructure development. In August 2015, the National Treasury and the
Department of Cooperative Governance organised the Urban Investment Partnership Conference, which
aimed to renew and strengthen collaboration between government and the private sector on urban
investment needs and opportunities. A working group has since been established as a platform for regular
engagements between metropolitan municipalities, commercial banks, institutional investors, the National
Treasury, the Development Bank of Southern Africa, development finance institutions and SALGA. The
platform aims to jointly develop practical solutions for funding infrastructure in metropolitan
municipalities that will support inclusive growth.
The working group will focus on:
Finding innovative infrastructure financing instruments and mechanisms
Updating the municipal borrowing policy framework.
Reviewing own-revenue sources for metropolitan municipalities
The review of metropolitan municipalities’ own-revenue sources, led by the National Treasury in
collaboration with the Department of Cooperative Governance, SALGA, the FFC and metropolitan
municipalities, is ongoing. The review’s first phase was completed in October 2015. The final report on the
socioeconomic profile of metropolitan municipalities can be accessed on the National Treasury’s website
(www.treasury.gov.za).
The second phase of the review has started, with a focus on assessing whether the own-revenue sources of
metropolitan municipalities are adequate to meet their service delivery and development mandates. The
review aims to understand the underlying challenges faced by cities, which will inform the appropriate
support to improve municipal revenue and/or the necessity for an additional local tax instrument to
complement property rates. The review’s outcomes and recommendations will be presented to the Budget
Forum in October 2016 for adoption and approval.