exploratory investigation of boundary-layer transition …/67531/metadc60712/m2/1/high... ·...
TRANSCRIPT
REPORT 1313
EXPLORATORY INVESTIGATION OF BOUNDARY-LAYER TRANSITION ON A HOLLOW CYLINDERAT A MACH NUMBER OF 6.9 t
By MITCHELH. Bmvcmq
SUMMARY
The Reynolds number for transition on the &-de of ahollow cylkier with heti kan+ifer from the boundary lay; tothe wd? hus been investigated at a Mach number of 6.9 in theLanglq Ii-inch hypersonic tunnel. The type of bown.dqylaper wiw &&rmin.d from impazt-premure Wmeys and opticalmkwn”ng. From a correlation of remdt.s obtu%d from varhu.ssourcw at lower Mach numbers (in the range .%0 to J.6) anddatu from tk present testx with varhble Reynokik number perinch, .ka&@dge i%icknixs and free-sham Reynolds number
. per inch appear to be importani consideratti in jlr.t-plu.teiratiion results. At a given Mach number, it appears thatt?w .Reynold-s number based on leading+xlge thicknew is animportzznt parameter thut must be unwidered in canpariwmofjild-plate transition dutu from vati in#ulikti5n3.
INTRODUCTION
The importance of obtaining extensive regions of laminasflow on surfaces in very high-speed flight does not have to beemphasized. Certain theoretical analyses indicate a de-crease in the critical Reyholds number for transition withMach number (Lees and Lin in refs. 1 and 2 and Van Driest’scalculations, ref. 3, based on the Lee&Lin theory). A recentpaper by Dunn and Lm (ref. 4) removes some of the limita-tions of the Lees-Lin theory mainly by the inclusion of three-dinmnsional disturbances and the demonstration that thestability characteristics can depend on temperature fluctua-tions. According to this theory, at Mach numbers between1 and 2 three-dimensional disturbances begin to play thelading role in many problems of practicil interest, and atsupersonic Mach numbers the boundary layer ean never becompletely stabilized with respect to all three-tiensionaldisturbance For Mach numbers up to about 2, however,moling of the solid surface is found to be effective in stabiliz-ing the boundary layer. Although calculations were notmade, this general conclusion would apparently remainunchanged for Mach numbers up to perhaps 6; however, forMach numbers above about 2 Dunn and Lin do not believetheirpresent method of numerieal calculations to be adequate.
The theoretical prediction that an increase in Mach numbershould decrease the stability (horn the Lew-Lin theory)
waa substantiated to the extent that the earlier experimentalwork on bodies at the lower supersonic Mach numbers (as ina 1951 paper by Potter, ref. 5) showed a decrease in transitionReynolds number with increasing Mach number. An extra-polation of these early data indicated Reynolds number-afortransition that were quite low compared with the Reynoldsnumbem obtained with bodies and wings tested in theLangley n-inch hy-pemcmic tunnel at Mach number 6.9(for example, refs. 6 and 7). However, the models testedin the 1l-inch hypersonic tunnel have an appreciable heattransfer horn the boundary layer to the model surface and,in addition, the Reynolds number per unit length is con-siderably higher than would be obtained by an extrapolationof Potter’s data.
On the basis of experimentally determined trends, Potterin reference 8 revised his earlier observations to include thecstimated effects of factors such as wall temperature andtunnel-air density. Though admittedly crude in applica-tion, Potter’s modifications to wind-tunnel cone-cylinderresults to allow for -mdI-temperature and density efFectsresulted in reasonable agreement with free-flight data frombodies of revolution as compiled by Gazley in reference 9.More recent contributions have been the original -work andcompilations by Czarnecki and Sinclair (refs. 10 and 11)who have investigated the efFects of Mach number, bodyshape, heat transfer, surface roughness, and angle of attack.Although the work of the various investigators has resultedin some progrw, there still dots not exist a coherent pictureof the various factors ailecting transition nor a definite ideaof what the Reynolds number for transition will be at v@ousMach numbem and other varying conditions.
The pr~ent exploratory investigation was initiated in 1951to provide prelimhwy information on boundary-layer transi-tion in the hypersonic range. A hollow cylinder was chosenfor the test configuration because of advantagp in mountingand lack of tip effects. Because the Langley n-inch hyper-sonic tunnel has only a short running time, the wall tempera-ture of the cylinder, wbieh was initially at about roomtemperature, was not controlled. The wall temperatureobtained ww thus a result of the heat transfer during the runfrom the boundary layer on both the inside and the outsideof the cylinder. An attempt was also made to correlate the
723

724 BEPORT 1313—N.MIONAL ADVISORY COMMITTEE FOR ADRONAU’ITCS .
available transition data on cylinder-sand flat plates by useof nondimensional parameters involving the pressure and theleading-edge thickness.
SYMBOLS
Mm
P1’PtP.Np,rR.
R ‘T
R,
tTux
Y
xYz }A&
a+~
+
Pw
subscripts:*
mw.
Mach numberexponent in power law for velocitytotal pressure measured by pitot tube.supply pressurefree-stream pressurePmndtl numberradial distance born tunnel axis (see sketch 1)Reynolds number based on distance from leading
edgeReynolds number based on distance from leading
edge h tmmsitionlocationReynolds number based on leading-edge thick-
nesleading-edge thiclme9sabsolute temperaturevelocitydistance measured from cylinder leading edge,
axially along cylinder surfacedistance normal to cylinder surface, measured
from surface
nozzIe coordinates (see sketch 1)
nozzle axial coordinate station giving location ofcylinder leading edge
boundary-layer thickness
rmgle about X axis of nozzle in .ZY plane (seesketch 1)
densi~dynamic viscositytime
ratio of local conditions to conditions in undis-turbed free stream
refers to conditions in undisturbed free streamrefers to conditions at mill
APPARATUS AND METHODS
TUNNELANDNOZZLES
This investigation was conducted in the Langley n-inchhypersonic tunnel, an intermittent tunnel with running timeof 70 seconds for thwe tests. These tests utilized two tww-dimensionrdnozzles both of which provide a Mach number ofslight@ less than 7. The first nozzle had contours machinedfrom steel and was replaced after the tests had started by anozzle having contours constructed of Invar. Invar wasused for the contour plates of the second nozzle in order to
alleviate the deflection of the @t minimum which occurredin the steel nozzle because of differential heating of the nozzleblocks. In addition, the nozzle was designed so that pressuregradients normal to the horizontal plane of symmetry worea minimum.
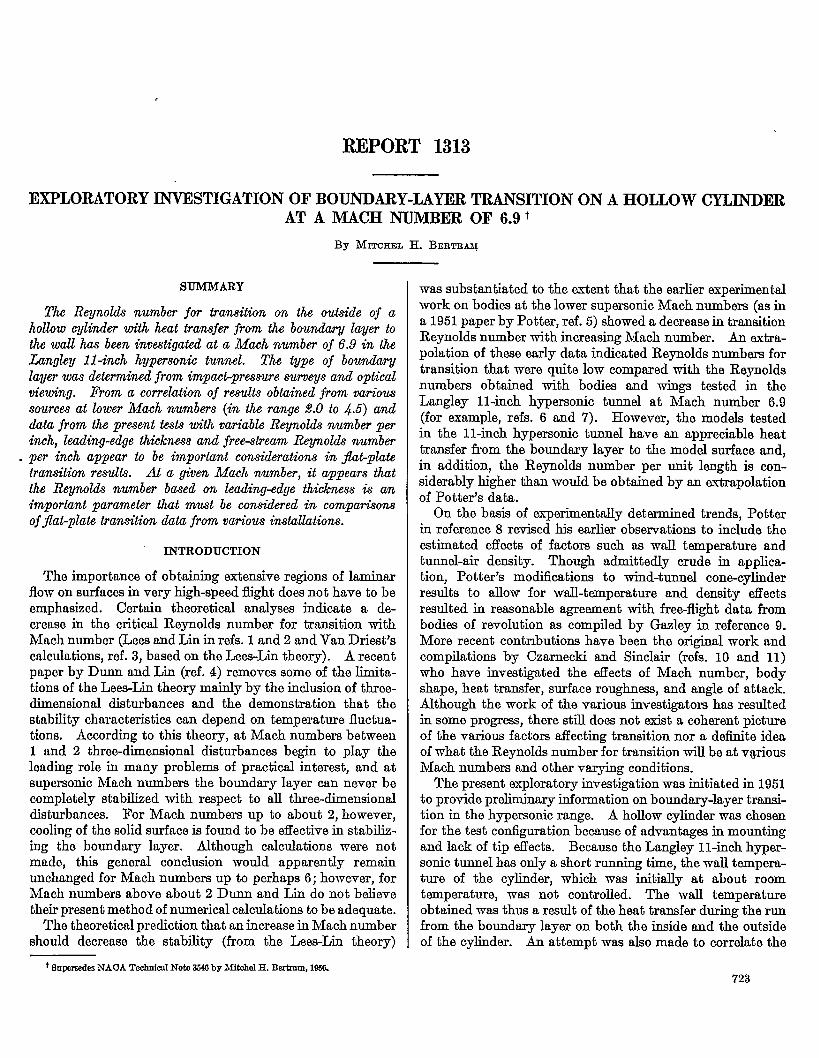
The variation of. free-stream Mach number with longitu-dinal distance in the steel and in the Invar nozzle is shownin figures 1 and 2 for time 60 seconds after the start of thotest run. The center of the test section is taken as theorigin of the coordinate system, as shown in sketch 1, In
wOrigin of coadinote system ot center of test section
Sketch 1.
contrast to the steel nozzle in which the test-section Machnumber changed about 2.5 percent in the period of time from10 to 70 seconds after the start of the run, the Mach numberin the I&m nozzle changed only 1 percent during this sameperiod of time. A description of the tunnel may be foundin reference 12 and a description of the steel nozzlo and amore complete calibration at a stagnation pressure of 26atmospheres in reference 13.
Bouudary-layer-survey tests were conducted at supplypressures of 25 and 33 atmospheres (Reynolds number porinch of about 0.26x 10° and 0.34X10⁸, respectively 1).OpticaI viewing was used to obtain data with supply pres-sures in the range from 14 to 37 atmospheres. Pressuro-fluctuation measurementswere taken in the settling chambmwith a flush diaphragm gage which had a flat responm tofluctuations with a frequency from 4 to 2000 cps. Therecorded fluctuations of air pressure were appro.xinmtely thosame whether the gage was open to the tunnel Qiror blankedoff so that the tunnel air could not directly affect the gagoface (about +0.1 inch mercury at frequencies from 1000 to2000 cps). Thus, either the frequency of the actucd pressurefluctuations was considerably greater than those to whichthe gage would respond accurately or the magnitudo of thofluctuations was less than the electrical noise level of thoinstrumentation setup.
1Thetity @ toobtaintbeRwnoldsnnndmiak Fa@donthoSutborlondfotmulw
BOUNBARY-LAYER TRANSITION ON A HOLLOW CYLINDER AT MACH NUMBER 6.9
FIIMEW1
tRange of mxlel
Ieoding-edge locations7.0
t’b~ ‘
i
i 3 3 ‘o
Y=O, Z= 1.5 ‘in.6.6
7.02
h 3 “ ! 3 3 20Y=O, Z= 0.75 in.
6.6
7.03 2 6 21 9 3 3 3 3
j 2 3 3 n
3 9 3 B
6.6 15
Y= o, ‘Z=o
7.03
t’ 3 3’()
> 3 30
Y= O, Z= -0.75 in.6.6
7.03
h , ‘3 0 0 0 0
(o) Y=O, Z.-1.5 in.6.6
7.0
L .0 0 3 3 0 3’Jn o0 0
uY=O, Z= 1.5 in.
6.6 ,
7.0
~.() D o 0
0. 0D . 0 Do o
Y. ~, Z= 0.75 in.d “
6.6
7.0[1
Ma 3 n 38 ~J le * 8 ‘n 0 3° ao 33 UC n o-.
3 2 36.6 R 9 0
Y.o, Z=o
7.0 I ..1P,’)()
. j 00 0 3 0 0 00 0D
o 0
()o/w’”m
~Y= 8, Z=-O.75 in.
6.6
7.0
0 LOU o 3 (1 D o 0 0. 0 0 30
(b) Y. O, Z~-1.5 in.
%2 -28 -24 -20 -16 -12 -8 -4 0 4 8X, in“.
(a) p,=33.4 atmoepherea.
(b) P~=26 atmospheres.
..—Longitudinal Mach number distribution in steel nozzle at two pressure levels (60 seconde after start of
725
teatrun).

726
—. .—. . . . — _.. — .——..
REPORT 13 13—NATIONAL MW180Ry COMIHITEE FOR AERONAUTICS
7.0() H o ()() Q 0. .0 Q o, ,0( ‘o <)
X= O, r= 1.5 in6.6 I
%7.0
() o 0 () () o ()<) o
(o) X=-725 in., r= 1.5 in.
&6090 180 270 360
I+, deg
1- Rmge of model--iIeoding-edge locot”-
7.0 IL ~: ‘( ) ,
1 c! •1 () I❑ 0
( <J%
1) Rc 1 ❑ 0 0 F 0 n❑ t
6.6tb) k’= O, Z= 0.14 in.
I I I-36 -32 -28 -24 -20 -16 -12 -8 -4 0 4
~ in
(a) Circumferential diatrlbution.
(b) Longitudinal distribution.
FIGURE2.—Mach number dietrl%ution in Invar nozzle at a supply prex+ureof 30 atmospheres (60 seoonde after start of teat run).
During most of these tests, the tunnel was operated at astagnation temperature of about 1,135° R, although stagna-tion temperatures for some runs were as high aa 1,180° Rand for a few others were as low as 1,100° R. In the earliesttests, the air w-as heated by means of the storage heaterdescribed in references 12 and 13. This heater was replacedin later tests by an electrical heater with NMwome tube re-sistance elements. Measurements of the temperature fluc-tuations in the settling chamber and in the test section whenthe resistmm heater was used were made with a chromel-alumel thermocouple formed of No. 40 wire (0.0031-inchdiam.) in series with an adjacent thermocouple of No. 18wire (0.040-inch &am.) with reversed polari~. The ob-served temperature fluctuations can be described approxi-mately as a wave with a frequency of’2 to 4 cps and anamplitude of 5° to 15° upon which is superimposed anotherwave with a frequency of 10 to 15 cps and an amplitude of1° 1? to 2° F. The settling+hamber and test-section meas-urements were in agreement as to magnitude and approxi-mate tiequency of occurrence of the fluctuations. Therewas no apparent difference between temperature fluctuationresults obtained at 25 and 33 atmospheres.
AIODEMANDPROBES
Models.-The models were hollow cylindem for -whichthediameter and method of mounting me shown in figure 3.The cylinders were made horn seamlesssteel tubing machined
and polished longitudinally on the outside and cleaned on thoinside, with the leading edge beveled on the inside. Tholeading-edge thickness was determined by viewing the learl-ing edge through a calibrated microscope.
Surface roughness was measured with a proillometer.Movement of the stylus in the longitudinal direction alongthe outside surface of the cylinder indicated a surface rough-ne9s with root-mean+quare values generally of 3 micro-inches with occasional values of 6 microinches. Lnteraltraverse of the surface at right angles to the direction of thepolishing indicated a root-mean-square surface roughness ofabout 10 microinchea. Such surface-roughnm measure-ments as th=e are highly questionable, however, in view ofthe experience of Jedlicka, Wilkins, and Seiff (ref. 14, page 6)when using such a stylus type of instrument. Photographs ofthe surface at a m@cation of 20X ~dicated that mostscratches on the surface ran in the longitudinal direction.The width of the scratches seen on these photographs werebetween 0.0002 and 0.0005 inch and numbered about 800to the inch of width.
One hollow cylinder had a portion of the outer surfaceknurled near the leading edge. & a general descriptionthe lmurling waa in a diamond pattern with the lateraldimension of the diamond about%, inch and the longitudinaldimension about % inch. This knurling started approxi-mately %inch from the leading edge, covered about 2 inches

BOUNDARY-LAYER TRANSITION ON A HOLLOW CYLINDER AT MACH NUMBER 6.9 ’727
------------------------------------------- --–-– --l-------- HorizontalWeb..,I 1
1.— -
I__- —------------ ——--—-—----—-— —--— -- —- ———-——- ——--— +--------
Station X, in,-30 -20 -lo
1111111 illllll lllllllllllllll lllllly 1111111 ll’flllllll112p
-AItermte~be Iwotion----- —
--------- test- C@@ h hdlcwm~-..
++~ ——-—-—-
%be ot forward kxoticw-”
-\%tup with steet nozzle
D¬e @e Iwnticw
----v S41Jpvtith Invor nozzle
2.72 in.
Sectiord * of Mlmv cy!kler Ieo&q ed$e
Fmum 3.—Mounting and Iooation of hollow oylinder and probe in steel and Invar nozzles.
of cylinder length including a tapered portion of about Xinch at each end, extended above the original surface about0.006 inch, and was indented about 0.003 inch. In theunknurled half inch of length at the leading edge the outersurface was actually at an angle of about 0.8° exposed tothe free-stream flow; othenvise the cylinder was as describedpreviously.
Another cylinder was tested with glass tape wrappedabout CLportion of the outer surface. This tape was 0.007inch thick and started 4 inches behind the hollow cylinderleading edge and extended for 1.25 inches.
Probes .—A pressure probe with a flattened tip typical ofthe type used in the present teats is shown in figure 4. Anumber of these probes were made for replacanent purposes,as they occasionally broke in use. The first of these probesto be made had an outside dimension of the minor axis ofabout 0.015 inch. With more experience in making them,it became practical to construct probes with minor-axisoutside dimensions of 0.006 to 0.010 inch. A further re-duction in this dimension was deemed undesirable becauseof rmticipated difficulties with pressure lag when the probewas located close to the surface of the cylinder in a ltiar
413010&G~7FIGURE4.—Typical impaot-presmrre ~mbe with flattened tip.

728 REPORT 1313—NATIONAII ADVISORY COMMJTTEE FOR AERONAUTICS
boundary layer. Some early tests were conducted with theprobe formed horn unflattered 0.040-outside-diameter by0.020-inside-diwneter tubing. The supporting web for thisprobe was unswept and considerably broader than the webshown in figure 4.
For the tests in the steel nozzle, the probes were mountedon a ~inch-dimneter steel tube (shown in fig. 4); whereas,for the tests in the Invar nozzle, the tube was % inch hdiameter. The probe could be located in several positionsin the test section as shown in figure 3.
The pressuresin the impact tube were measured by meansof the aneroid recording units described in reference 12.Most of the pressureswere measured with an error of about1 percent, although the error in some cas= was 2 or 3 percent.
Heating effects on models and probes, and accmracy ofsetting vertical distance.-The reference setting of theprobe (y=O) vw made visually by sighting through the testsection at an illuminated diilusing screen, masked to a suit-able size. The probe -wasmoved toward the cylinder untilthe light passing between the probe tip and the cylinder wasobserved without magnifying aids to disappw, and theprobe was then backed off from the cylinder until the lightcould bo barely observed. At the stagnation temperatureof these runs (about 675° F) there was a relative deflectionof the probe and the cylinder during the ~“ng time. Thefirst run in each series at a given station was used to cali-brate this relative deflection by having the operator of thetraverse mechanism keep the probe substantially tied withrelation to the cylinder and recording the deflection indicatedby the scale of the traversing head as a function of time.In order to keep this deflection due to heating to a minimum,the steel tube on which the probe was mounted was shieldedfrom the aimtream as shown in figure 3. Corrections to tieinitial setting were made according to the observed deflec-tion. The accuracy with which the operator could followthe relative deflection of the probe and model is believed,in general, to be within 0.002 inch, judging from a comparisonof repeat runs of the deflection calibration.
OPTICALVIE~G
Optical viewing by both shadowgraph and schlieren meth-ods was used to examine the flow over the cylinders. Theschlieren system had a vertical Z+hape light path with ahorizontal knife edge. Schlieren photographs were obtainedby using either continuous lighting with a shutter speed of1./l5o second or flash exposures of 2 to 3 microseconds dura-tion. In order to obtain shadowgraphs photographic paperwas simply placed in the parallel beam of the schlieren sys-tem. This technique necessitated exposures of about 2 sec-onds duration because of the low light densi@.
MOD=TEMPERATURE
At the start of a run, the model has an isothermal surfacewith a ratio of wall temperature to stream temperature ofabout 5.0. With su5cient running time to attain equilibrium,
a ratio of wall temperature to stream temperature of about9.o would be expected for stations away from the loadingedge with a lamimm boundary layer and about 9.4 with rLturbulent boundary layer.
The initial rates of change of model temperature withtime dTJdr determined from theory for laminnr md turbu-lent boundary layem and for boundary layers with transitionoccurring at various Reynolds numbers is shown in figuro 5.Also shown is the assumed rate of change of Tti with timoused to calculate the wall temperature for the determhmtionof various parameters in the boundary layer from the impm~pressure measurements. The value of dTw/dTwas assumcclconstant throughout the running time with no considerationgiven to longitudinal heat conduction. A few experimentalmeasurements of which the accuracy left much to be desiredindicated the assumed curve to be reasonable; although thoassumed dTtJdr is expected on the ivorage to be too highat the more forward stations and too low at the most rear-ward stations. The maximum error in the assumed wnlltemperature is expected to be about 15 percent and thisdeviation should not have a significant effect on the compu-tations for the reduction of the total-pressure@io to velocityratio for present purposes.
RESULTSAND DISCUSSION
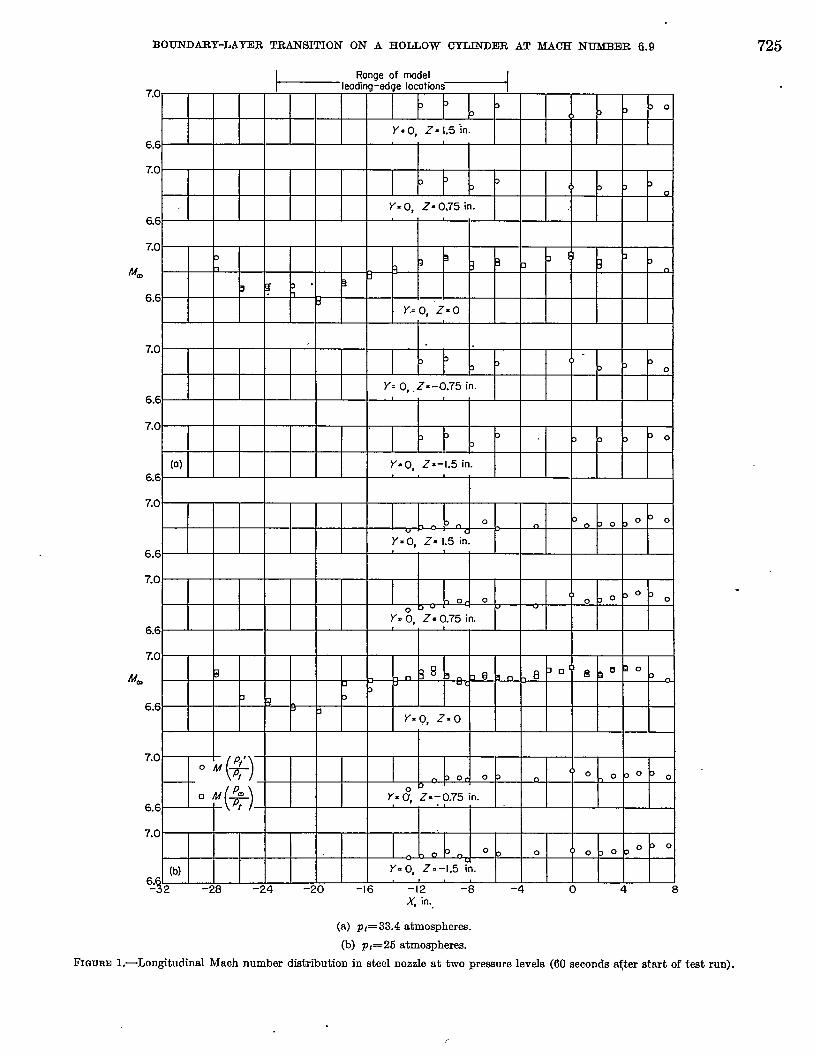
Presented in figure 6 are the impact-pressure proiiles obt-ained in both the steel and the Invrw nozzles 60 secondsafter the start of the tests at a Reynolds number per inch ofabout 0.34X10⁸ (supply pressure of 33 atmospheres). Inthis figure each data point represents the pressure at 60 sec-onds from the start of one test run. These data am sum-marized in table I. The theoretical curves shown in figure 6are those for a l’aminarboundary layer on dlat platecalcukded
7
.,; y-:z“’ z ~ -+ !
1
>-~-~?s:~ed forI
‘~o : 8 12 16 20 24 28 32 36 40
x, in.
FIWJEE5.—Initial rate of dange of wall temperature with timo n~ afunction of distance from the nose of a flat Plate. Plato matcrlnlsteel, 0.040 rnoh thick, heated through one surfnce, insulated on
oppede sm-faoe. $=6; MO=6.9; ~=0.33X 10⁶pm inoh,m

BOUNDARY-LAXER TRANSITION ON A HOLLOW CYLINDER AT MAOH NUMSER 6.9 729
TABLE I.-SUMMARY OF RESULTS FROM STEEL ANDINVAR NOZZLES
[d[ = &9; ~=0.3-lX 106per inch1
Figure R. -~LE,in. Surface Type ;~j:rmdaryCondition
(a) Steel Nozzle4
–10. 8 Tape Laminar–11. 2 Smooth Laminar
6(n) 4. 1X1(F < –11. 2 Smooth Laminar–11. 1 Knurled Laminar–11. o Knurled Laminar–11. 2 Knurled Turbulent.–11. 2 Knurled Turbulent–11. 2 Smooth Trrmeitional
f3(b) 6.2X 100 ~ – 17.2 Tape Inoipient transition–17. 2 Smooth Incipient transition–17. 1 Knurled Laminar 1– 17.1 Knurled Transitional 1
6(U) 7.1X1(Y{
–142 Smooth Transitional 1–147 Smdoth Turbulent I
{
–17. 2 Smooth Turbulent
6(d) 8. 1X1(Y –17. 9 Smooth Turbulent– 23.1 Knurled Inoipient transition 1–23.0 Knurled Turbulent 1
6(e) 9. Oxlv{
–20. 2 Knurled Turbulent–20. 9 Smooth Turbulent
o(f) 10. 1X1OQ –23. 2 Knurled Turbulent
(b) Invar Nozzle—
6(CL) 41X1OO{
–12. o Smooth Turbulent I–120 Smooth Laminar 1
[
–12. o Smooth Turbulent6(b) 6. 2x1CF – 18.0 Smooth Transitional 1
-l&o Smooth Turbulent 16(d) & lXIV
{–l&o Smooth Turbulent–24.0 Smooth Turbulent
1Anomalous cases
by the Crocco method as presented by Van Driest (ref. 15).The effect of Prandtl number, wall temperature, and velocityprofile shape on these curves is discussed in more detail inAppendix A to this report.
If for the moment certain anomalies which appear in thedata and differences in cylinder surface condition are ignored,certain overall results are evident. With the leading edgeof the cylinder located at about the —1l-inch station in thesteel nozzle (figs. 6 (a) and (b)), transition is found to occurbetween a Reynolds number of 4X10E and 6X10E. A valueof RZ=4. 1X 10ecorresponds to a Reynolds number based onmomentum thickness of about 1,720 horn the measuredpressures. With the leading edge at approximately the– 17-inch station in the steel nozzle (figs. 6 (b) and (d)),
transition appears to occur in general between a Reynoldsnumber of about 6X 10e and 8X 10e. One set of data fromthe steel nozzle at a Reynolds number of about 8X10⁸ (fig.6 (d)) with the leading edge set at the —23-inch stationappears to indicnte incipient transition. Less data wereobtained in the Invar nozzle (figs. 6 (a), (b), and (d)) thanin the steel nozzle, but the data apparently do not show thelarge variations in proiile shape with cylinder location foundin the steel nozzle. In this nozzle transition apparentlyoccurred before a Reynolds number of 4X 10e (fig. 6 (a)), atleast for one set of test data.
Possible explanations for this behavior are discussed in thefollowing sections together with a discussionof the previouslydismissed anomalies and other factom.
FACI!OR8INFLUENCINGTRANSITION
Effeot of model looation.-The preceding discussion hasimplied an effect of model location on the Reynolds numbemfor transition obtained in the steel nozzle. The cylinderleading-edge locations shown in figure 6 and table I can beassociated with the iMach number (pressure) gradientsindicated by figures 1 and 2. Take the cylinder locationsshown in figure 6 (b), for example; in the steel nozzle withX., = —17 inches, the forward part of the cylinder wasin a region with a considerable length of negative dp/dXon the nozzle center line; whereas with the cylinder fartherdownstream in the nozzle (X~E= —11 inches) there is a shortlength of positive dp/dX on the nozzle center line in theleading-edge region. As previously noted, in general, the far-ther upstream the location of the leading edge in the steel noz-zle the higher the transition Reynolds number appeared to be.In the Invar nozzle at these same stations the pressuregradient on the nozzle center line is, considerably smaller.The results from the Invar nozzle do not indicate a note-worthy effect of model looation on transition.
Although other factors enter into the problem the im-proved Mach number (pressure) distribution in the Invarnozzle is probably an important reason for the decreasedReynolds number for transition observed in this nozzle.In the Invar nozzle the model apparently did not protrudeinto a region of relatively strong negative pressure gradientas was the case in the steel nozzle for the model positions forwhich the pressure proilles indicated the highest Reynoldsnumber for transition.
Another consideration in the effect of model location isflow angularity in the nozzle; however, at present little canbe said concerning this effect. A calibration of the steelnozzle indicates that flow angles in the test section wherethe model surface is located may be as much as 0.5°, andthe flow angles average to about 0.2” in this region (ref. 13,fig. 13). With the model located at a given station in thenozzle the effects of flow angulariQ- would be considered tobe fixed; however, in a comparison of the results at variousmodel locations, some flow-angularity effects could exist.
730 RDPORT 1313—NATIONAII ADV180RY COMMITTEE FOR AERONAUTICS
.020
.016I I 1 I 11 II L
,- Lominor-kmdruy-. ❑ <>
layer thecmy-,~ ---1
I I +.012
i
.008
/+
u - 11.ri .UKI.0 - I 1.2 .015:
rI&
A -ILI .0[0nM f, h -11.0 .012:
~ ] I ~ ! 1; l~-t-lrda!ed date I I ! 0 “%! “fi.<~~ =
A
<:035 srnooih<.035 Krufed<.039 Kn.uied
‘“v% ] ! I Lib/l I I I I I I I I Probe extended from battomtest section
Steelnozzte
o
.020
.016
.012
P,‘P~
.008
.004
0 SM .16 .24 .32 .40 .48y, in
‘M
LO
.8
.6
.4
.2
0 .08 .16 .24 .32 .40 .48y, in.
Lo
.8
.6
.4
.2
0 .08 .16 .24 .32 .40 .48y, in.
(a) Z=12 in. (R.+4.1X10⁹.
FIGURE6.—Impact pressure and velooity distributions in boundary layer.

BOUNDARY-LAYER TRANSITION ON A HOLLOW CYLINDER AT MACH NUMBRR 6.9 731
, , ,
1 i ~ialiI Prcbe TubeXLE, m. s“w, i% Cwditkm
0 -17.2 1315XJX5 Tape-172-17.1-11.2-[1.2
S1l-&thI@wledSJnoOthKnuriedKrwled H
.Wu!”, e” ~“,.-
1 I 0 -rT.l 0Px039 tid —Probe dsded fran bottom
Ty’ Oftestsdic+l
Steel node
o IllIllIllIllIllIllIllIllIll!11IllIllIllIllIllIllIllIllIll.
.020
“O’’ErlIL+lI
, I II III II I I I I I I I I I I I I I
.012
D.‘I I r! u I I 1 1 , , , ,
, 1 1 1 1 1 1 I
I I I I II I I I I I I I I 1 1 I 1 1 I 1 I
l;lvlll llllo-l~-=z-th II
“w _- w -w
o .08 .16 .24 .32
—, I f
Probeedsrded frcml ‘Wm)
/of test *n
2tcQt
(Iriwr rrdeI 7
.-111 IllIllIllIllIllIllIllIll!11IllIllIllIllIllIll111Ill
LO
.8
% .6
.4
.2
0 .08 J6 .24 32 .40 .48y, in.
1.0
.8
% .6
.4
.2
0 08 .t6 .3.2 .40 .48y~?n
y, in
~) .=18 in. (&=6.2X 10’).
FIGUR.E6.—Clontiiu&d.

732 REPORT 1313—NATIoNm ADWSORY CO~E FOR AERONAUTICS
(c) X=21 in. (&=7.lxl@).
FIGURE6.—&ntinued.

BOUNDARY-LAY23R TRANSITION ON A HOLLOW CYLINDER AT MACH NUMBER 6.9 733
.020
.016
.012
P~‘~
.CK)8
ki iii~) 19 I ❑ -17.2 .OIOX.040 Smooth
A /111o -23.0 .012x.039 [email protected]
I/
A -17.9 .OIOX.040 %wdhA e / +su!uted plate Probe exterdedfrwn bottfnn E1
0 1.4 al/l I I I I I I oftestsectim II
❑ L{yllll,,,!!!!!!l!!!l Steel nozzk[ /l-y I I I I I I I I I
-o/-0 ~ flu’’’’’’’””“’’’’’’’’’’’”“’’’’’’’’’’’”“’’’’’’’’’’’”“’’’’’’’’’’’”
m
.016
.012
I I w I II 1 1 I .,.,-4 x~E,in Ccn-KIit”msize, in. ‘---
) %ooth uI IJ[1 , , ,
,, 0 - lao .oo85x04c
n –240 .0085x040 Smcoth ~-004 % / A I Pro& extended from bottom
0 f/ /1 I I of test sect.mn H
1/-1 r I I I I I I I IEJiiifx!!!!,,!!!!!!!!!!l/ Invor nazzle
o .08 .16 .24 .32 .40 .48
.
Lo
.8
L%.6
.4
.2
0 .08 .16 .24 .32 .40 .48y, in.
U*
o .08 .16 .24 .32 .40 .48y, in.
y, in
(d) z=24 in. (R=8.1X10⁹.
FIQwm 6.—Continued.

734 REPORT 1313-NA~ONm DWSORY co~E FOR AXRONATJTIW
T-xlo -mz .ol~(33B W❑ ‘20,9 .OIOX.040 Sm@th
loted *te Probe exteded from bottom
41 d ts SecIim El
o ~“ltllllll Illllllllllll!l 111111111111111II,J,,,I,,,II,,,,,I,,JI,,I IIllIllIllIll
I I i I I I Iff}.020
.,,,
I I I I Ii/l Hiii.Cm I VI
I/ . -1”(CV p,”,t
//
/ I I/ / :I II I 1 1 1 1 1
0III1II111IllIll
.06IllIllIll11[
.[6 .24 .32. “. ‘.ZIOy, in.
II
.48
U*
Y, in
.4
.2
0y, in,
(d z=27 in. (&=9.0x Icq.
(f) ~=30 in. (L=lo.lxlty).
FIGURE6.—Conoludti.

BOUNDARY-LAYER TRANSITION ON A HOLLOW C~ER AT MACH NUMBER 6.9 735
Effects of model angle of attack would also be expected tobo fhed. However, the misalignment of the cylinder withrespect to the tunnel axis was less than about 3 minutesand the effect of such a misalignment would be expected tobe negligible.
liHeot of surface condition.-The correlation of tests atthe lower supersonic Mach numbers has indicated two im-portant parameters in the effect of surface roughness onboundary-layer transition (refs. 10 and 14). These are theratio of roughness height to a characteristic boundary-layerthickness and the ratio of molecukr mean-free-path lengthto roughness height; however, much concerning these effectsis still speculation. Consider il.rst the taped cylinder de-scribed under the section entitled KModele”. The ratio oftape thickness to boundary-layer displacement thiclmesswas about 0.08. The ratio of tape thickness to mean freepath is about 230 in the stream, 35 at the wall, and 18 as aminimum a little distance from the wall. Conditions atand near the wall are ~ected to be the best criteria formolecular mean-free-path considerations. From considera-tion of both boundary-layer thickness and molecular meanfree path, the tape would not be e~ected to have an effectand this appears to be substantiated in figures 6 (a) and 6 (b).
The other variation in surface condition on the cyl.indemtested was knurling near the leading edge. According tothe lower speed correlations of roughness height to boundarylayer height (ratio 0.18 at start of lmurling baaed on crestto mean surface height), the lumrling could have an effect ontransition of the boundary layer (ref. 10, figs. 6 and 7);however, from mean-free-path considerations it is doubtfulthat such an effect would occur. Actually the data indi-cating what is probably the highest Reynolds number fortransition (see fig. 6(d)) were obtained on the cylinder withknurling. However, the data from the knurled cylinderme not consistent in this regard (see fig. 6 (b)). There isthe.possibility that the high Reynolds number for transitionindicated in figure 6 (d) is associated in part with the slighbbevel inadvertently formed on the surface at the leadingedge. (See the description of the models in a previoussection.) Lee (ref. 16) found that a 10° external bevel ona hollow cylinder, tested at Mach numbers of 2.15 and 3.25, 4increased the Reynolds number for transition by 50 to 60percent over that obtained when the outer surface wasunbroken to the leading edge; however, the external bevelin the present model is only about 0.8°.
Elfeot of leading-edge thiokness,-A possible cause forcertain anomalies in the transition Reynolds number obtainedfrom measurement of the boundary-layer pitot-pressureprofile (as shown in table I) is the variation of leading-edgethickness circumferentially around the leading edge. Inthis case the leading-edge thickness varied between 0.001and 0.003 inch around the leading edge. The followingdiscussion forms a possible explanation for these anomalies.
Two of the more obvious effects inherent in a finite leading-edge thickness which can possibly ailect the Reynolds
number for transition are as follows: First, temperatureincreasw across the strong leading-edge shock and resultsin an initially low value of Reynolds number per inch;second, the pressue is initially high but there is a neggtivegradient in pressure and in surface Reynolds number perunit length, with the pressure becoming essentially equalto stream static pressure at a suihcient distance fi-om theleading edge. The boundary layer is thin near the leadingedge and can therefore be affected considerably by the dis-turbance due to the ~te thickness of the leading edge.It appears that the Reynolds number based on leading-edge thickness Rt is the correct parameter to describe theeffect of the leading edge on the boundary layer. A plausibleargument is that for low Reynolds numbers per unit lengthor small leading-edge thicknesses,or both (low RJ, the bound-ary layer quickly becomes thick enough so that the effect ofthe leading-edge thickness is small; that is, the boundarylayer quickly grows out of the region where tbe main in-fluence is from the strong shock at the leading edge; whereasfor larger leading-edge thicknessesor high Reynolds numbersper unit length, or both (high R,), the boundary layer isthinner and is affected by the leading edge for a considerablygreater distance in terms, say, of boundary-layer thicknesses.Thus, with Reynolds number based on undisturbed free-stream Reynolds number per inch, the Reynolds number fortransition R=~ might be expected to increase with R,.
& the Mach number increases a third factor may becomeincreasingly signi6cant. This factor is the effect of theboundary layer itself in producing a shock and inducinga pressure gradient augmenting the effects due to lcading-edge thickness. The effect of leading+dge thicknes andboundary-layer thiclmess at JJ4=6.9 on the pressures ona flat plate has been reported in reference 18, and theserwults show that rather large increases in surface pressurewith a considerable negative prewme gradient can beascribed to a combination of leading-edge thicknm andboundary-layer-displacement effects.
The previously available data from various sources (refs.18 to 23) for the variation in transition Reynolds numberwith the dimensional parameters, Reynolds number perinch and leading-edge thickness, are shown in figure 7 (a).The trend of the data from the various instdati6ns isobviously similar whether the parameter varied is Reynoldsnumber per unit length or leading-edge thickness. Anincrease in either Reynolds number per inch or leading-edgethickness gives an increase in the Reynolds number fortransition. In this respect the data obtained in the presentexperiments in the steel nozzle (fig. 7 (b)) are similar intrend to the results at lower Mach numbers shown in figure7 (a). The only set of data obtained without movement ofthe model between tests is shown by the circular symbolsin figure 7 (b) where the leading+dge thickness was in therange from 0.003 to 0.005 inch. These shadowgraph dataindicate a Reynolds number from transition varying fromabout 1.3x 10eat a Reynolds number per inch of 0.14X10e
4oolo4-Li~8

736 REPORT 1313—NATIONAII ADVISORY
to about 3.7x 10Eat a Reynolds number per inch of 0.40X10°,so that the distance from the leading edge at which transitionoccurs is indicated to be rdatively unaffected by changes inReynolds number per inch (as obtained mainly by varyingthe stagnation pressure). Other shadowgraphs from twkruns with the cylinder leading edge located 18 inches up-stream of the center of the test section corroborated theplotted shadowgraph data to the intent that the start oftransition was indicated to be outside the area of’ viewailorded by the test section windows that is some distanceless than 12 inches horn the cylinder leading edge. Theappearance of the phenomena which were interpreted toprovide the data shown in iigure 7 (b) is shown in figure 8.Figure 8 (a) is included to show the forward part of themodel and the appearance of a lmown laminar boundarylayer. Figures 8 (b) to 8 (d) show flow phenomena @at areinterpreted as boundary-layer transition by various methodsof viewing, whereas fignrw 8 (e) and 8 (f) show the cylinderwith the leading edge far forward in the nozzle. At thelower Reynolds number (fig. 8 (e)) the flow is apparentlylaminar for an appreciable distance in the field of view.This phenomenon is the anomalous result shown by thetriangular symbol in figure 7 (b) where a Reynolds numberfor transition of about 5.7x10e is indicated at a Reynoldsnumber per inch of 0.25X10⁶. At the higher Reynolhnumber (fig. 8 (f)) the appearance of the boundary layeris changed and the thiclmess is considerably increased.This change is interpreted to represent transitional andturbulent bound~ layer over the entire field of view. Thephotograph shown as figure 8 (f) was obtained during the setof tests for which data are dwignated by the circular symbolfor the steel nozzle in figure 6 (d). When several photo-graphs were obtained by the flash schlieren method duringa given run, all indicated essentially the same Reynoldsnumber for transition. Figure 8 (g) is a flash schlierenphotograph obt&ed immediately after the shadowgraphruns with the model unchanged from the Xm= —18.O-inchposition mentioned previously. From the difFuseappearanceof the boundary layer, transition is in@ated to haveoccurred ahead of the portion of the cylinder in the viewingarea; thus, there is at least qualitative agreement, in thiscase also, between results obtained by these two methods ofviewing.
The data shown in figure 7 (a) are presented in figure 9with the Reynolds number for transition R% in this caseplotted as a function of the nondimensional parameter,Reynolds number based on leading-edge thickness R,. Somesecondary effects are indicated by the data of Brinich andDiaconis (ref. 23); howevar, in general, this set of datacorrelates rwwonably well. As cm be seen, the increase intransition Reynolds numbers can be quite large. This sametrend is shown by results presented in figure 7 of reference24, but sufficient quantitative data are not available toinclude these test results in @ure 9.
COMMI~E FOR AERONAUTICS
Clearly, in an endeavor to correlate the available dotn.certain factom which could prevent correlation have beenneglected; among these is th; turbulence level of the tunnelair. The data of Brinich and Diaconis (ref. 23) me useful inthis comection in a comparison with recent data obtained byBrinich (ref. 25). The main difference in the conditions unclerwhich the two sets of data were obtained is in a modifkmtionto the air-supply chamber of the Lewis 1- by l-foot variableReynolds number wind tunnel to improve the turbulencelevel of the fhw entering the nozzle. These data are shownin figure 10. The increase in the Reynolds number for transi-tion from the latest data (ref. 25) is quite evident. Withinthe individual sets of data a trend of increasing Reynoldsnumber for transition with increasing Reynolds number perinch can be detected. This is the same trend that Ross(ref. 26) observed on a cone tested in the same wkcl tunnel.A more detailed study of transition on a cone in this tumml(ref. 27) has indicated not only an overall change in turbul-ence level between the two sets of data associated with thetunnel modification but in addition secondary changes inturbulence level resulting from variations in Reynolds numbwper inch.
Certain of the datum points indicated in figure 10 merdlected by the leading-edge shock as reflected from tho tun-nel wall and these points are given little weight. Other clmtapoints obtained from reference 25 (R, of 260,1,500, and 8,000)appear to be affected by a wave impinging on the surface.This result is apparently attributable to an imperfectionof the nozzle.
On the basis of the correlation presented in figures 9 ancl10a variation in leading-edge thickness by a factor of 3 WOUIC1be e~ected to give a change in the transition Reynoldsnumber of about 50 percent which is more than adequato toe@ain the anomali~ shown on table I.
Probe effects,-Little is known about the influence of theprobes on transition; however, the main effects on the bound-ary layer of the relatively small probes used in this inveatign-tion app~ to be in the details of the menmrecl profilesrather than in the evaluation of whether the boundmy layeris ltiar or turbulent. A discussion of this latter effect ispresented in appenti B to this report.
PEESSUEETE3TSATA LOWERPRZSSURELEVEL
A few pressure-survey tests were run on the smooth cyl-inder in the steel and Invar nozzles at a Reynolds number pminch of 0.26X10⁸ (p~=25 atmospheres). These data me notas comprehensive as the data presented in figure 6 and thusdo not justify presentation. Transition, according to thesetotal-pressureprofiles,was found to occur between a Reynoldsnumber of 4x 10° and 4.5x 10° (corresponding to XLg from—16 to —18 inches) in both the steel and the Invar nozzles.The wall temperatures for these tests are es-petted to beslightly below the values estimated for the higher pressuretests because of the reduced heat transfer.

BOUNDARY-LAYER TRANSITION ON A HOLLOW CYLINDDR AT MACH NUMBER 6.9
’07rt?
‘T
,.6, /“
///
-,ol+uu10
107
RV
,“6
,.5I
I I I— I I I 1(———
—
—
—————
—
—
(o)I I I 1 I I I 111-
-4!(
I I I II I I I I I I I IL
f, in Mm Model Method sourceo
1
O:O&yn HollowBrinich and
o .006 305 cylinder Schlieren DiomnisA .012 (ref. 23) ~–,
.002 2.41Hol IOW
● %hliereno’ocmnell
.001
I
cylinder1.97
(ref. 18).—— . .––––––– .001 ~~ Flot plote %%&’—-— .001
Cl Colesstress (ref. 19)—.-—
%W%%%W% %&8 :;}
Hollow SUrfoce Srinich—.-. — cylinder tempero!ure (ret 20, 21)
, 1
I I I I I I I I I I I I II106 10’
Ix . -,X“n
I I I I
“
● .:80● *
!2a a aA
o
00 ❑
❑
o 0
0
Rx ire-l
TJ0 o:0$J3xlo6 -
: .27A .40h .58a .67 J
_ 1.53XI06
Method source
Schlieren8rinich ond
Diocork(ref. 23)
-1Dunning
404 Flot plote ‘“fl\&rent ond lJhOM
I
(ret 22)
1I I I I I I I 11111 I I I I I I
10+1111
10-’~ in.
(a) Previously available data.
l’mmw 7.—The Reynolds numbem for transition on hollow cylinders and flat plates as a function of Reynolds number per inoh and lending-edgethiakneas.
‘

738
IC
R‘T
I
REPORT 1313—NATIONAL ADVISORY COMMITTEE FOR AERONAUTICS
i I 1 I I I I I I I I I
(tll
A/ ./?///>//
~ in. Mettuxl
o 0.003 to 0.005 &J$w~@
❑ II(33 to .005 ~~~
o .001 to .003 At&l
A .001 tO .003 ~-m
‘LE, ‘n
- I 3.0
- I3.0
-9. I
-250
-[30
Tubecondition
Smuwh
Srrmth
Srrmth
Srrmth
Knurled
/I I I I I I I I I I I I I
; 2 4 e ,Oe
+, ~-l
(b) Data from present tests with steal nozzle. M.= 6.7 to 6.9.
FIGURE7.—Concluded.

BOUNDARY-J.AYER TRANSITION ON A HOLLOW CYLINDER AT MACH NUMBER 6.9 739
(a) Flash schlieren; Rx/x = C),27XI06 per inch; XLE = -5.O inches; ~ = 0.001 to 0.003 inch.
FIGUEES.—Photographe by various methode of the flow over the hollow oylinder at varioue condition. Mm= 6.9. All photographs in eteelnozzle. Flow from left to right.
,
I Transition
#-x=z=o+
I Transition.
,
(b) Continuous shadowgroph; Rx/x=0.47x106 per inch; A’LE = -1s.0 inches; t = 0.003 to 0.005 inch.
FIcwrm 8.—Contiuued.●

740 REPORT 1313—NATIONAL ADVISORY COMMJTC’EE FOR AERONAUTIC
(c) Continuous schlieren; R’/x = 0.2Gx106 per inch; ~E =–13.O inches; i’= 0.003 to 0.005 inch.
(d Flash schlieren; R’/x = 0.28x10⁶ per inch; XLE = -9.1 inches; t = 0.001 to 0.003 inch.
FIGURE8.—Continued.-...


742 REPORT 1313—NATIONAL ADVISORY CO~ D FOR AERONAUTICS
(g) Flash schlieren; R’/x = 0.23x10⁶ per inch; X&= -18.0 inches; t= 0.003 to O.OO5 inch.
FIGURE8.—Cono1uded.

BOUNDARY-L4YER TRANSITION ON A HOLLOW CYLINDER AT MACH NUM33DR 6.9 743
‘“’rR
‘T
..
,.6 /0-
../’/’/
,05 I I 1’ I I I I
‘-E”1“1”1 1111 I
R‘T t-
,.6
I I I I I [11(
t, in Mm
o Cloo2
:}
.003:~ ‘5
A
● .002 24 I——— .001 1.97’––––––– .001 257—-— .001 370—.-—+%%w%ww %!; ;-—---— }
I I I I I [
i I I I i I I I 11(
1 I I I I +-l
Mafel Method Source
IWlowBrinkh Olld
cytinder Schlieren Dioconis(ref. 23)
HollowSchtieren
@&annaycylinder
MinimumFlat plate shem”ng D Coles
stress (ref. 19)
Hollow Surfoce Brinichcylinder tempemture (ref. 20,21)-1
I I I I I Ill
R~, in.-l Mm Model Methpd SrxrceA
o :~3xl@
; .27 “
I
Brinich adA :40 ’05 J$!%r Schlieren Oiaconisk .58 (ref. 23)a .67
Dunning● L53x106 4,o4 Flat plote ‘“fii~&?_’t and Ulmcmn
(ref. 22)i-1
,.5 I I I I I I I I Ill I I I I T I I I 1111 I I I I Ill10 I02 ,03 I04
Rt
FIQUm !3.-The wynol& nub~ for transition on hollow oylindm and flat plat~ m a funotion of Reynolds number based on leading-edgethiokne% -.

.
744 REPORT 13 13—NATIONAL
1o7- 1 I I 1’1 Ill
1?‘T ●
,.6
1=F Ref. Ret f?.
23 25 y x 10-6, in-l
I0 . 0.093 to Q096
■ .16 to .19: .27AA .36 to .40& .58ad .68
Id 1 I 1,1 I 111110
ADVTSORY COMMJTI’EE FOR AERONAUTICS
I I 1’1 111[
1 I I Ill I 1
R,
I I I 1’1 Ill
~:N%mh0 b
I I I I I 111+
dA
I I I 1,1 I I I I I 111113 104 ,.5
Fmmn 10.—The effeat on the Reynokis number for transition of variations in the parameter R.eynokk number baeed on Ieadlng-edge thiokncesat varioua preseure Ievela in the Lewis 1- by l-foot variable Reynolds number wind tunnel. Flagged symbole affeoted by refle~tiou of lcnding-edge shook.
CQMPAIUSONm OTHERREWJLTS
The tests by Korkegi (ref. 2S) at -M==5.8 on an insulatedflat plate and Lee (ref. 29) at Mach numbers up to 5.0 on ahollow cylinder are perhaps the only wind-tunnel tests forboundary-layer transition on models with essentially zeropressuregradient at,Mach numbe~ approaching those of thepresent investigation However, it is di.tlicult to comparethe results of these inv@igations with the present resultssince their surface heating effects are different from those ofthe prwent tests and their model-leadimg-edge thicknessesme not given.2 Nevertheless, since there is a dearth of highMach number transition data, the redts from these sourcesme presented.
In Korkegi’s eqmiments (ref. 28) the Reynolds numberper inch varied from about 0.07X 10e to 0.23X 10Ewith acorresponding variation in plate Reynolds number fromabout 1.8X 10e.to greater than 5X 10E. Natural transitionwas not detected anywhere in this range. In the tests byLee (ref. 29) the Mach number was varied horn 2.15 to 5.01with a corresponding variation in Reynolds number per inch
lDr. Kmk@statod lnawrsonaf dfsmsdo nwiththeantlwrtkathbellevedtlmttkelmMn&eagathkknamof &e plate forthefnvwtQatfOnrewrtedfnmkenca~was kwtwwnomlando.cnzfnch.rfwmtbemtimml~nm~=~-+M-fmmtiwmammofdm-ahtlmtim.
horn roughly 0.3X10’ to 0.07X10’ (constant supply pressure).The Reynolds number per inch at AI==5.0 is considerably10WWI-than the lowest Reynolds number per inch of tbopresent tests. Whether heat transfer was present is notstated, although the data were obtained in an intermitten~tunnel with short teat durations (approfiatel y 35-secondruns) and some heat transfer from the model to the boundarylayer might occur. Lee’s results show the transition Reyn-olds number in general to decreme with increasing lMachnumber to a value of about 108at ill.= 5, with a scottor ofabout +20 percent. A different cylinder was used for thetests at the high Mach numbem so that it camot be assumedthat the leading-edge thickness was constant for all the tests.
CONCLUDING REMARKS
The Reynolds number for transition on the outside of ahollow cylinder has been invdigated at a Mach number of6.9 in the Langley n-inch hypersonic tunnel. In these teatsthere was heat transfer from the boundmy l~yer to the wnll.The ratio of wall temperature to free-stream temperatureTWIT. was believed to be an average of about 6.6 at thomer+uring stations, whereas TJTm would be expected to beabout 9.0 for the laminar boundary layer on an insulated

BOUNDARY-IAYDR TRANSITION ON A HOLLOW CTT..INDDR AT MACH NUM33ER 6.9 745
plnte under the sameconditions. The nature of the boundarylaym was determined from impact-pressure surveys throughtlm boundary layer and by optical viewing.
Tlm datu from pressure surveys obtained at a Reynoldsnumber per inch of 0.34X10⁸, with a leading-edge thicknessvmying between 0.001 inch and 0.003 inch around thecircumfmmce of the leading edge, in a portion of the nozzlewhere surveys had shown the Mach number variation to besmall, indicated a trrmsit,ion Reynolds number of about4X 10°, although some profiles indicated higher and others,lower values. When the cylinder protruded into a region ofthe nozzle with a considerable negative pressure gradient,tho Reynolds number for transition was increased and forone sot of data appeared to approach 8X 10°.
Datn obtained optically on a similar cylinder with alending-edge thickness in the range from 0.003 to 0.005 inchimlimted a Reynolds number for transition varying hornabout 1.3X 10eat rLReynolds number per inch of 0.14X 10eto ~bout 3,7X 10eat a Reynolds number per inch of 0.4x10e.As with the data obtained fkom pressme surveys an anoma-lous result was obtained for one run in @ich the leading
edge of the cylinder with a slightly thinner leding edgeprotruded far upstream in the nozzle. In this case a Reyn-olds number for transition of about 5.7X10³ was obtainedat a Reynolds number per inch of about 0.25X 10E.
From a ccrralation of results obtained at lower Machnumbers (Mach numbers in the range 2.o to 4.5) and datafrom the present tests with variable Reynolds number perinch, the leading-edge thickness and free-stream Reynoldsnumber per inch appear to be important considerations inflat-plate transition results. Results from various installa-tions would not appear to be comparable unless these factorsme taken into account. At a given Mach number it appeamthat the Reynolds number based on leading-edge thicknessis a significant parameter that must be considered in com-parisons of flat-plate or hollow-cylinder transition data fromvarious facilities.
LANGLEY AERONAUTICAL LABORATORY,
NTATIONAL ADVISORY COMMITTEE FOR AERONAUTICS,LANGLEY l?IELD, TTA., February 9, 1956.

746 RRPOIKI’ 1313—NATIONAL ADVISORY COMbDTTEE FOR AJ3RONAUTICS
APPENDIX A
THEORETICAL BOUNDARY-LAYER PROFILES
Ln order to determine the effect of the various variable orimperfectly known conditions on the prcdilesto be emmined,theoretical calculations of the effects of some of these condi-tions were made. -
EFFECl!OEWALLT~EllATUREON~AR PROFJI,ES
In order to assess the effect of various wall temperatureson the shape of the total-pressure, Mach number, andvelocity prof31eson the laminar boundary layer, calculationswere made by the Crocco method as presented by Van Driest(ref. 15) for free-stream conditions close to those of thepresent tests. The surfaca was assumed isothermal with aconstant-pressure flow field, and the Prandtl number andspecific heats were taken as invariant through the boundarylayer. The computations were carried out to a velocityratio in the boundary layer of 0.999. The results of thesecalculations are shown in figure 11. Qualitatively, forthe range of surface temperatures shown, the eflect on thegeneral protlle shapes of changes in surface, temperatureis small. j
EPFECTOPPRANDTLNUMFIREONLAMINARPROFILES
In order to asaess the effect of various Prandtl numbemon the shape of the total-pressure, Mach number, andvelocity profiles on the huninar boundary layer, calculationswere again made according to reference 15. The resultsare presented in figure 12. The assumptions are the sameas in the preceding paragraph mmpt that the plate is as-sumed to have an insulated surface. Aggin for the presentpurposes the effect of PrandtJ number is found to be minor.
EFPE~ OF EXPONENTIN POWERLAWFOR VELOC.WYONPItoPmR SHAPE
If the linear velocity profle is assumed to approtiate
the velocities in a laminar boundary layer (see @s. 11 and
12) and the turbulent boundary layer is repreaer+tedby avelocity varying as the 1/6 to 1/7 power of distance fromthe surface of an insulated plate (refs. 28 and 30), thepitot pressure, Mach number, and velocity profiles shownin figure 13 are obtained for a Prandtl number of 1.0.
16x10-3. ——
I //
g=4// ‘
12 / I II
/ 7, ‘1 1 1’
// ~ J / {+8 t
1~ /)
/, ‘/ / /, 14 /
/ / ~ .01 (Insuloted plote)
o“ I
I
M*
Fmmm 11.—llffeot of wall temperature on pro51ee of fld.-plritokuninarboundary layer. M.=6.86; 2’. =111° R; NP,=O.726.

BOUNDARY-LAYER TRANSITION ON J HOLLOW CYLINDER AT MACH NUhlBER 6.9 747
4 VA/ I
Lo
.8
.6
u*
.4
.2
0 4 8 12 167
20 .24 28
FIauRE12.—E5ect of Prandtl number on profdea in Iaminar boundarylayer on insulated flat plate. ~i~ = 6.86; T~ = 111° R.
.
u* -
Lo9 -4
.*
> .5 “/ -/ -
.8 / //> ‘
/ /
h
(+) .4 ,— To represent Iom”mr
bxxldory Ioyer
—— To represent turbulent.2 %xrndory layer
o .2 .4 .6 .8 1.0/8
Fuamm 13.—lNlect of assumed velocity prolile on Maoh nuraber andtatal-pmure protila in boundary layer. M. = 6.86; NP,= 1.00.
748 RDPORT 1313—NATIONAL ADVISORY COMMPFEEE FOR AERONAUTICS
APPENDIX B
PROBE
The impact pressure and velocity profiles presented infigure 6 indicate two regions of disagreement between thelaminar theory and the tnqmrimental results that wereclassed as laminar: the fit is near the model surface (bestshown by the velocities); the second is near the outer edgeof the boundary layer (shown by the impact-pressure results).
A probe situated very near a wall can introduce errors ofvarious sorts in the measured pressures. Among these arethe following:
(a) Distortion due to the existence of high velocity gradi-ents near the wall.
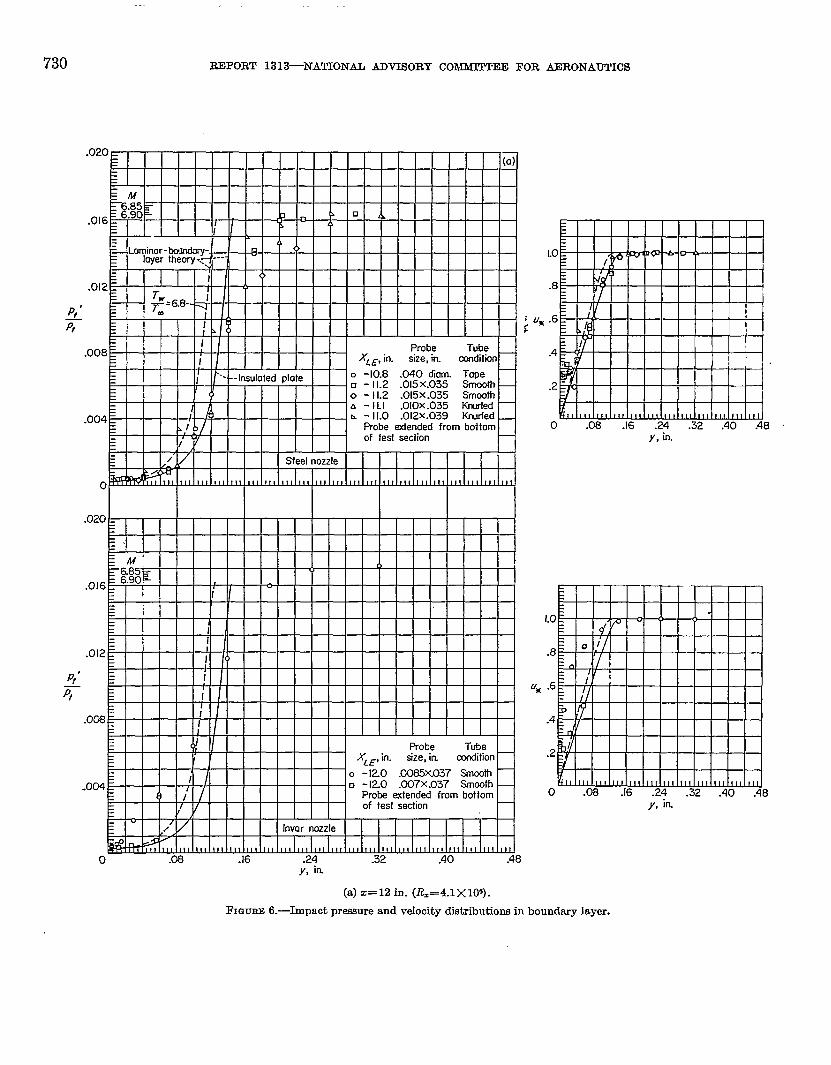
(b) Viicous effects at the probe nose resulting because theReynolds numbem in the subsonic part of the laminarboundmy layer can be seversJ orders of magnitude reducedfrom free-stream values (illustrated by@. 14).
(c) Initiation of separation resulting horn the presenceof the probe (as observed by Morkovin and Bradiield, ref. 31).
The measurement-sof Taylor (ref. 32) using Stanton typesurface tubes and von Doenhoff (ref. 33) using flattened-tiptotal-presmre tubes in contact with the surface bear on theoverall effect of all these factors on the measured pitotpressure. Their results indicate that the indicated impactpressure in the present tests can be 10 to 15 percent higherthan boundary-layer theory would give. This increase inimpact pressure results in an indicated increase in u? ofperhaps 0.15 or 0.2, which is the magnitude of the effectsshown in &yre 6(a) by the data taken near the wall.
In addition to the effects previously discussed, attention isdirected to figure 6(b) (steel nozzle, circle and square sym-bols) and figure 6(d) (steel nozzle, circle symbol), where thedistortion of the profle etids into the supersonic portionof the boundary layer. This eilect is apparently caused bythe onset of transition and resembles an tiect shown incartain of the profiles presented by Korkegi (ref. 28, fig. 24)and is not attributable in its main features to the influenceof the probe. Transition as shown by this profile in iigure6(d) is considered to be slightly more advanced than that offigure 6(b); however, fim a comparison with the theoreticalIaminar profiles, in both cases transition is considered to bein the incipient stage.
The deviation of e.sperimentalimpact-presssure ratio hornthe theoretical value near the outer edge of the boundary
EFFECTS
.014 -
/
.012
kI ~=6+
.010 — — — — — — — ~1’ t
/ /.
I
.008 /
R, / ‘/
/’.006 ,
,-
4 “//
‘/ /q=2--- .,.11
/ /.004
.002/
/ / y
J
o .2 .4 .6 .8 IM
)
FIGURE14—The variation of local Reynolds number pnmrnotm withlocal Maoh number at variouE wall temperatures in the subsonlopart of a laminar boundary layer. Mm=6.86; !f’@=lll OR;NP,=O.726
layer (fig. 6(a) steel nozzle, especially) may be due partly tothe finite thickness of the leading edge. Qualitatively, suchdeviations as this were found by Bradfield, Decoursin, andBlumer at Mm=3.05 (ref. 24, fig. 6) to be due to increasingthe leading-edge thickness. Another possible e~qlwmtionis an inadequacy in flat-plate theory as applied to a cylimlorand, in addition, there are certain terms in the solution tothe boundary-layer equations which can be significant nearthe outer edge of the boundary layer and which woreneglected in the computations of the theory.

BOUNDARY-LAYER TRANSITION ON A HOLLOW CYLINDER AT MACH NUb131ER 6.9 749
REFERENCES
1. Leca, Leator, rmd Lin, Chia Chiao: Investigation of the Stability ofthe Larninar Boundary Layer in a Compressible Fiuid. NACATN 1115, 1946.
2. Lees, Later: The Stabiiity of the Laminar Boundary Layer in aCompressible Fluid. NACA Rep. 876, 1947. (SupersedesNACATN 1360.)
3. Van Driest,E. R.: Calculationof the %abiiity of the LaminarBoundaryLayerIn a CompressibleFluidon a FlatPlatewithHeat Transfer. Jour. Aero. Sci., vol. 19, no. 12, Dea 1952,pp. 801-812.
4. Dunn,D. ~., and Lin, C. C.: On the Stabilityof the LaminarBoundaryLayer in a CompressibleFiuid. Jour. Aero. Sci.,vol. 22,no. 7, July1965,pp. 46S-477.
5. Potter,J. L.: FriotionDragandTransitionReynoldsNumberonBodiesof Revolutionat SupemonicSpeeda. NAVORD Rep.2160,U.S. NavalOral.Lab. (WhiteOak,Md.), Aug.20,1951.
0, hloLelian, Charlea H.: lkploratory Wind-Tunnel Investigationof wings and Bodies at M-6.9. Jour. Aero. Sci., VOL 18,no. 10, Oot. 1951, pp. 641-648.
7. Bcrtram, Mitchel H.: An Approdmate Method for Determiningthe Displacement Effeota and Vfaoous Drag of Laminar BoundrqLayers in ‘hvo-Dimensional Hypemcmio Fiow. NACA TN2773, 1952.
8. Potter, J. L.: New Experimental Inveatigationa of Friction Dragond Boundary Layer Transition on Bodies of Revolution atSupersonic Speeda. NAVORD Rep. 2371, U. S. Navaf Oral.Lab. (White Oak, Md.), Apr. 2% 1952.
9. Gazley, Carl, Jr.: Boundary-Layer Stability and Transition inSubsonic and Supareonio Flow. A Review of Available Infor-mation With New Data in the Supersonic Range. Jour. Aero.SoI., vol. 20, no. 1, Jan. 1963, pp. 19-2%.
10. Czarneoki, K. R., and Sinclair, Arohibald R.: Factors AffectingTransition at Superscmio Speeda. NACA RM L5311~ 1963.
11. Cmrneokf,K. R., andSinoiair, Arohibald R.: An Investigation ofthe Effeota of Heat Transfer on Boundary-Layer Transition ona Paraboiio Body of Revolution (NACA RM–10) at a MaohNumber of 1.61. NACA Rep. 1240, 1954. (Supemedee NACATN’s 3165 and 3166.)
12. hfoLeilan, Charlea H., WiUiaroa, Thomaa W., and Bertram,Mitohel H.: Investigation of a Two-Step Nozzle in the Langley11-Inoh Hypersonic Tunnel. NACA TN 2171, 1950.
13. McLollan, Charlea H., Wiiliams, Thomas W., and Beokwith, IvanE.: Inv~tigation of the Fiow Through a Single-Stage Two-Dhneneionrd Nozzle in the Langley 11-Inoh Hypersonic Tunnel.NACA TN 2223, 195o.
14. Jedlicka, JnmeE R., TVilkina, M= E., and Seiff, Alvin: E~eri-mental Determination of Boundary-Layer Transition on a Bodyof Revolution at M=3.5. hTACA TN 3342, 1954.
16, Van Driest, E. R.: Investigation of Laminar Boundary Layer inCompressible Fluids Using the Crooco Method. NACA TN2597, 1952.
16. Lee, R.. E.: Measurements of Blockage Area Ratio, Pr~ureDistribution, and Boundary Layer Transition on HoilowCyiindera. NAVORD Rep. 3660 (Aeroballiatio Res. Rep. 226),U. S. Naval Oral. Lab., Mar. 8, 1954.
17. Bertram, Mitohel H.: Visoous and Leading-Edge ThickrmzwEffeotson the Preasuree on the Surface of a Flat Plate in Hypersonic
Flow. Jour. Aero. Sci. (Readem’ Forum), vol. 21, no. 6, June1964 pp. 430-431.
18. O’Donneil, Robert M.: Eqerimental Investigation at a MaohNumber of 2.41 of Average Skin-Friction Coefficients and Veloc-ity Protiles for Laminar and Turbulent Boundary Layers and ankaemment of Probe Effects. NACA TN 3122, 1954.
19. cola, Donald: immurements of T~ ona&noothFlat Plate in Supersonic Flow. Jour. Aero. Sci., VOL21, no. 7,Jtiy 1954, pp. 433-448.
20. Brinioh, Paul F.: Boundary-Layer Transition at lMaoh 3.12 Withand Without Single Roughness Elements. NACA TN 3267, -19b4.
21. Brinioh, Paul F.: A Study of Boundary-Layer Transition and Sur-face Temperature Distribution at Maoh 3.12. NACA TN 3609,1955.
22. Dunnin g, Robert W., and Ulmann, Echvard F.: Effects of Sweepand Angle of Attaok on Boundary-Layer Transition on TWn~ atMaoh Number 404. NACA TN 3473, 1955.
23. Briniuh, Paul F., and Diaoonie, Nick S.: Boundary-Layer Development and Skin Friotion at hfaoh Number 3.05. NACA TN2742, 1952.
24. Bradlield, W. S., Decourain, D. G., and Bhuner, C. B.: The EtTeotof Leading-Edge Bluntness on a Laminar Supersonic BoundaryLayer. Jour. Aero. Soi., vol. 21, no. 6, June 1954, pp. 373-382,398.
2S. Brinich, Paul F.: EfTect of Leading-Edge Geometry on Boundary-Layer Transition at Maoh 3.1. NACA TN 3659, 1956.
26. Rosa, Albert O.: Determination of Boundary-Layer TransitionReynolds Numb6ra by Surface-Temperature Meawrernent of a10° Cone in Various NACA Supersonic Wind Tunnels. NACATN 3020, 1953.
27. Eward, John C., Tuoker, Maurioq and Burgeaa, Warren C., Jr.:Statietiool Study of Transition-Point Fiuotuationa in SuperaonioFlow. NACA TN 3100, 1954.
28. Korkegi, IL H.: Transition Studies and Skin-Friotion IMeasurementa on an Inmdated Flat Plate at a Mach Number of 5.8.Jour. Aero. Soi., VOL23, no. 2, Feb. 1956, pp. 97–107, 192.
29. ~ Roland E.: Measurements of Pressure ‘Distribution andBoundary-Layer Transition on a Hollow-Cylinder Model.NAVORD Rep. 2823 (Aeroballistio &. Rep. 176), U. S. NavalOral. Lab. (White Oak, Md.), Apr. 28, 1953.
30. Lobb, R. Kenneth, Winkler, Eva M., and Perah, Jerome: lkperi-mental Inv~tigation of Turbulent Boundary Layera in Hyper-sonic !?low. Joy. Aero. Soi., vol. 22, no. 1, Jan. 1955, pp. 1-9, 50.
31. Morkovin, M. V., and Bradtleld, W. S.: Probe Interference inMeaaurernenta in Superaonio Laminar Boundary Layera. Jour.Aero. Soi. (Readem’ Forum), vol. 21, no. 11, Nov. 1954, pp.785-787.
32. Taylor, G. I.: Measurements With a Haif-Pitot Tube. Proo. Roy.Sot. (London), ser. A, vol. 166, no. 927, June 16, 1938, pp.476-481.
33. Von Doenhoff, Albert E.: Investigation of the Boundary LayerAbout a Syrnmetrieal Airfoil in a Wind Tunnel of LOW Tur-bulence. NACA WR L-507, 1940. (Formerly .NACA ACR,Aug. 1940.)
