exploring a new model for mobile positioning based on cdr
TRANSCRIPT

HAL Id: hal-02043563https://hal.archives-ouvertes.fr/hal-02043563
Preprint submitted on 21 Feb 2019
HAL is a multi-disciplinary open accessarchive for the deposit and dissemination of sci-entific research documents, whether they are pub-lished or not. The documents may come fromteaching and research institutions in France orabroad, or from public or private research centers.
L’archive ouverte pluridisciplinaire HAL, estdestinée au dépôt et à la diffusion de documentsscientifiques de niveau recherche, publiés ou non,émanant des établissements d’enseignement et derecherche français ou étrangers, des laboratoirespublics ou privés.
Exploring a New Model for Mobile Positioning Based onCDR Data of The Cellular Networks
Amnir Hadachi, Artjom Lind
To cite this version:Amnir Hadachi, Artjom Lind. Exploring a New Model for Mobile Positioning Based on CDR Data ofThe Cellular Networks. 2019. �hal-02043563�

EXPLORING A NEW MODEL FOR MOBILE POSITIONING BASEDON CDR DATA OF THE CELLULAR NETWORKS
From Coverage Area to Positioning
A PREPRINT
Amnir Hadachi∗and Artjom Lind
ITS Lab, Institute of Computer ScienceUniversity of Tartu
51014 Tartu, [email protected]
February 21, 2019
ABSTRACT
The emerging technologies related to mobile data especially CDR data has great potential for mobilityand transportation applications. However, it presents some challenges due to its spatio-temporalcharacteristics and sparseness. Therefore, in this article, we introduced a new model to refine thepositioning accuracy of mobile devices using only CDR data and coverage areas locations. Theadopted method has three steps: first, we discovered which model of movement (Move, Stay) isassociated with the coverage areas where the mobile device was connected using a Kalman filter.Then, simultaneously we estimated the location or the position of the device. Finally, we appliedmap-matching to bring the positioning to the right road segment. The results are very encouraging;nevertheless, there is some enhancement that can be done at the level of movement models and mapmatching. For example by introducing more sophisticated movement model based on data-drivenmodeling and a map matching that uses the movement model type detected by matching Stay locationto buildings and Move model to roads.
Keywords Mobile Data · Positioning · Switching Kalman Filter ·Map-matching ·Mobility Modelling
1 Introduction
The rapid development of information and communication technologies has made them very valuable for humanity.Since they are used as a supporting tool for organizing our daily life tasks and duties. It is clear that smartphones have agreat potential of being the ultimate sensor that can reveal many aspects of human mobility and behavior [31]. Fromthis perspective, much research has been done and many applications created in order to evaluate or demonstrate thegreat potential behind mobile data in depicting human mobility [16], road traffic status [3], tourists movement, and theirdisplacement [29].
Understanding human mobility behavior is one of the major challenges in many research domains and applications.The reason behind this is its implication directly or indirectly in many aspects of our daily life, such as urban planning[10], traffic management[15], crowd analysis, and population displacement [22], targeted marketing or advertisement[27], monitoring, and control [8]. After all, mobile phones are literally deployed sensors used as urban sensing devices,reporting on the status of our interactions with our cities, environment and between us [26].
∗The authors gratefully acknowledge the contribution of The Software Technology and Applications Competence Centre (STACC)through Large-scale Mobile Positioning Data Mining (Demograft) project and all the partners in Archimedes project "The Real-timeLocation-based Big Data Algorithms" for their help in providing the data. This research was supported by IUT34-4 "Data ScienceMethods and Applications" (DSMA) project.

A PREPRINT - FEBRUARY 21, 2019
Furthermore, mobile phones provide a rich and massive amount of data with its interesting information andchallenges[24]. The Call Detail Records (CDR) are the data collected by the mobile operator for billing purposes and ithas been an interesting type of data investigated by researchers and also industrials to extract insights and knowledgeabout human mobility patterns [26].
CDR data contains information about the events recorded, their time of occurrence and the ID code of the antennathat provided the connection [7]. These events are registered the moment the mobile device is in use for calling ormessaging or browsing the internet. Hence, CDR data have this characteristic of being temporal data, but, it can be alsoconsidered spatio-temporal data since we can associate the coverage area shapes to the ID code of the antennas usingthe radio waves data.
The fact that the coverage areas are a representation of radio waves rise up many issues related to the fluctuation of thesignal strength due to many factors, such as weather, building, lakes, etc [6]. Additionally, the CDR data is very sparsein time and space; because the events are registered only when the phone is in use and the coverage areas locations arevery granular. Thus, CDR data has some potential since it can reflect human mobility but in order to do so there aresome challenges and obstacle that has to be dealt in order to extract mobility patterns or attempting localization.
Our motivation behind the use of CDR data can be resumed into its potential of reflecting human mobility characteristicsand depicting the population movement and displacement in urban and rural areas. Therefore, our purpose is to tryto transform CDR based trajectories to GPS like trajectories by estimating the exact location of the mobile users byrelying only on the CDR data and coverage areas locations. The resulting outcome can be used for many localizationapplications for tracking purposes, information sharing or broadcasting, target marketing, fleet management, travelinformation systems, intelligent transportation systems, etc.
2 Related work
Location information or positioning is important for many applications related to monitoring the activities in thetelecommunication networks, navigation, mobility management, transportation. This importance comes from the factthat this type of knowledge can help in understanding human mobility patterns, displacement, and daily activities.
From this perspective, there is a lot of research done using GPS data as a source of positioning sensors. For example, in[4] the authors collected GPS data and built an algorithm for extracting meaningful locations. Then, they predictedusers’ movement based on a mobility model created using the discovered displacement patterns. Of course, GPS datacan be considered as a very good source of data for building mobility behavior models and localization; however, notall of the mobile phone users are happy to share this kind of information all the time, whenever and wherever theyare. That’s why CDR data can be a potential source of data for localization and mobility modeling [1]. Moreover,telecommunication data has been collected continuously for many years now, which makes this type of data available inmassive amounts [17]. Furthermore, by correlating the CDR data and the geographic locations of towers as mentionedbefore, the CDR data can be very useful for discovering and extracting mobility patterns [14].
Therefore, we can distinguish three major approaches one is focusing on the spatial characteristics of movements andtheir influence on human mobility, using statistical techniques to depict the movement patterns or on the characteristicsof the radio waves generated by the telecommunication antennas. Concerning the spatial approaches, they are focusedon the use of measures such as jump length, radius of gyration, or centroids [9]. These features allow performing theextraction of meaningful locations since people have a tendency to stay in key locations and spend some time in thoseareas. In [13] the authors used the same ideology and proposed an algorithm to identify significant locations usingCDR data. This results demonstrated that the proposed approach was capable of finding home and work location with88% accuracy. However, the method was not designed to discover other important locations that can occur during themovement between work and home.
Most of the studies conducted regarding mobility are trajectory based where each user’s trajectories are traced, extracted,and studied from a behavioral point of view. In the end, all these studies or research are trying to answer specificquestions that are the key to innovation in localization and mobility patterns in both research and business applications.The main or general question can be categorized into the following categories: displacement [12], movement patternsor models [19], [30], and human daily activities or resources [32], [18].
At this level, it is clear that many applications need not only the detection of behavioral patterns of mobility but alsomore accurate localization awareness using mobile networking. The statistical and probabilistic approaches have provento be robust in providing a clear understanding the mobility patterns and insights discovery. For example, the authorsin [11] proposed a method based on the sequential Monte Carlo for exploiting mobility, improving the accuracy andprecision of positioning. The technique was tested based on a simulation and it was demonstrated that it can provide
2
A PREPRINT - FEBRUARY 21, 2019
accuracy in localization. However, the model used for representing the mobile network coverage does not take intoaccount that the coverage zone can fluctuate and change shapes due to an irregularity of network transmissions.
In the same category, we a have the same method Sequential Monte Carlo (SMC) used in a different manner presented in[5], where the authors tried to enhance the application of SMC by making it robust regarding the localization estimationeven if the range measurement error is high and unpredictable. The testing of the algorithm was done using a simulationand the results showed that the approach is capable of improving the localization range from 12% to 49% under a widerange of conditions. The model presented gave interesting results but there was no testing in real life situations or withdifferent models using simulations.
Regarding the methods based on propagation time and signal strength [23]. Signal strength approaches are focused onreceived signal strength indicators, which reflect the attenuation measurement of the signal in the assumed free spacepropagation of radio signals. However, the reality might be described as a free space propagation; therefore, it affectsthe triangulation method for localization.
These phenomena influencing the signal are as follows: penetration, reflection, scattering, and diffraction. To overcomethis problem, some propagation models have been proposed, such as software-defined radios model (SDR) [2] orcost231-wolfish-Ikegami model [33]. Whereas, propagation time-based methods rely simply on the time measurement,which makes their accuracy depending on the number of measurements acquired and on the geographical environment(urban areas are a big obstacle to its performance). Furthermore, some other researchers investigated localization usingmobile users, but for an indoor case. For example, the work in [20] proposed an algorithm that enables the localizationof mobile users by centering on trajectory matching in indoor settings. The mobility of the users was modeled bylearning from the signal strength from their phones’ historical data. The results showed that the localization had anaverage accuracy of 1.3 m. However, the environment was controlled as well as the measurement, which makes theresults non-realistic with regard to the sparseness in time and space of real mobile data.
3 Data description and problem statement
3.1 Nature of the data
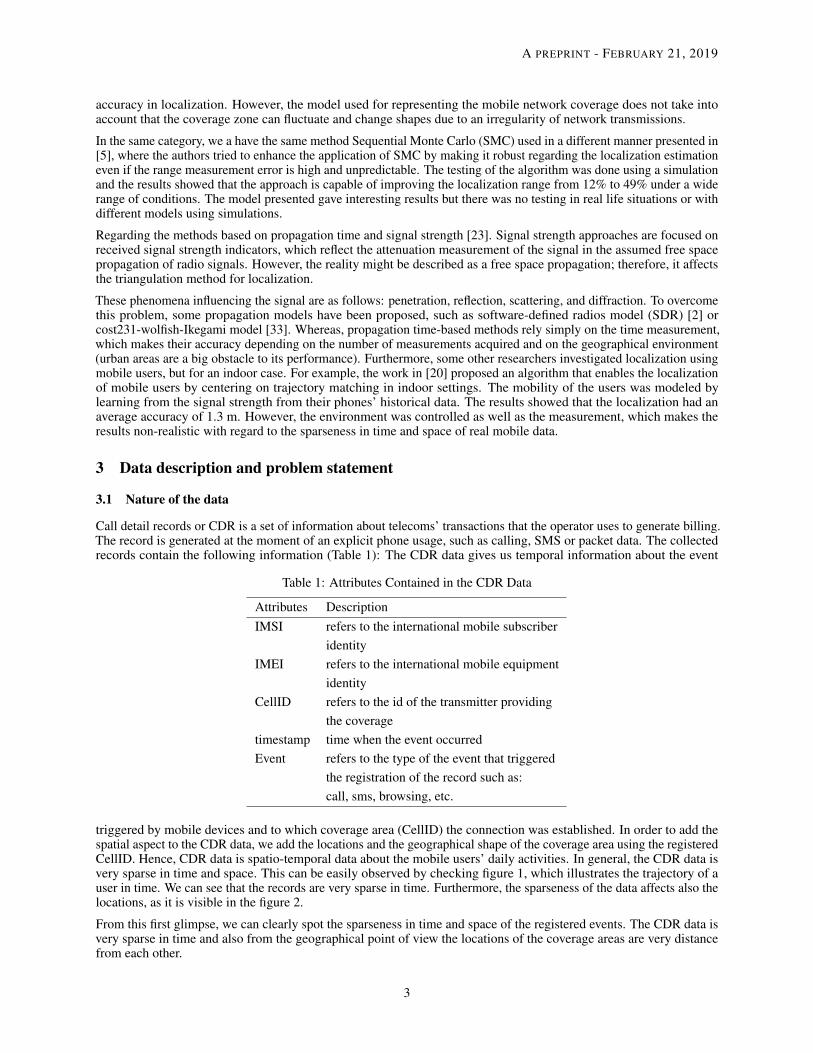
Call detail records or CDR is a set of information about telecoms’ transactions that the operator uses to generate billing.The record is generated at the moment of an explicit phone usage, such as calling, SMS or packet data. The collectedrecords contain the following information (Table 1): The CDR data gives us temporal information about the event
Table 1: Attributes Contained in the CDR Data
Attributes DescriptionIMSI refers to the international mobile subscriber
identityIMEI refers to the international mobile equipment
identityCellID refers to the id of the transmitter providing
the coveragetimestamp time when the event occurredEvent refers to the type of the event that triggered
the registration of the record such as:call, sms, browsing, etc.
triggered by mobile devices and to which coverage area (CellID) the connection was established. In order to add thespatial aspect to the CDR data, we add the locations and the geographical shape of the coverage area using the registeredCellID. Hence, CDR data is spatio-temporal data about the mobile users’ daily activities. In general, the CDR data isvery sparse in time and space. This can be easily observed by checking figure 1, which illustrates the trajectory of auser in time. We can see that the records are very sparse in time. Furthermore, the sparseness of the data affects also thelocations, as it is visible in the figure 2.
From this first glimpse, we can clearly spot the sparseness in time and space of the registered events. The CDR data isvery sparse in time and also from the geographical point of view the locations of the coverage areas are very distancefrom each other.
3

A PREPRINT - FEBRUARY 21, 2019
Figure 1: Users’ trajectory extracted from CDR data and their triggered time - each color represent a different user
Figure 2: User’s Cell based trajectory extracted from combined CDR data and coverage areas locations - polygons arethe coverage areas and the arrows are the chronological order of the event occurrence
3.2 Problem statement
Based on the nature of the data described above, our objective is to find out a way to estimate the exact localization orthe positioning of mobile users inside the mobile network coverage. Therefore, we have to optimize the coverage areas,make a classification of the movement type and at the same time estimate the exact position of the user.
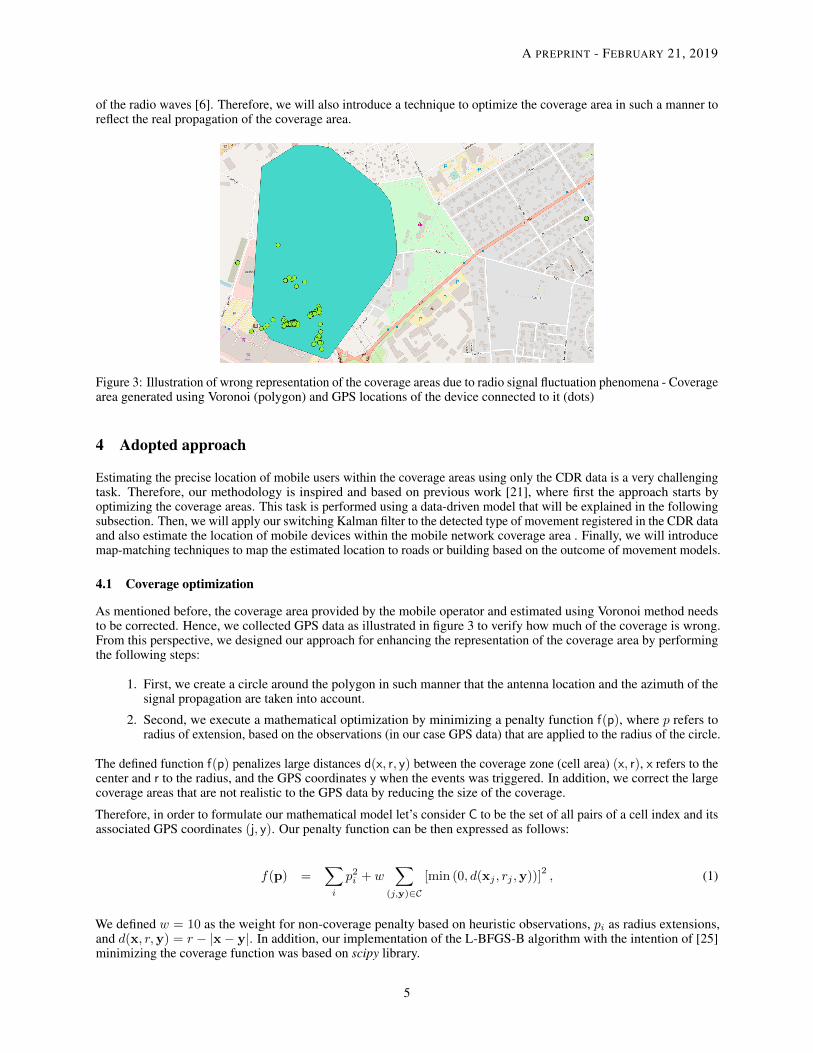
For this reason, the proposed algorithm is capable of detecting the type of moment (moving or staying) betweensuccessive cells’ records within the trajectory and also of estimating the localization of the mobile user inside thecoverage areas or zones. The movement episode detection, that the adaptive Kalman filter performs, is based on themovement models used in the algorithm process. Then, the Kalman filter algorithm makes an estimation of the exactposition of the mobile phone user inside the coverage area. Finally, the estimated position is map-matched to the rightroad segment if the movement episode detected is moving or to the correct building if the movement episode detected isstaying. Moreover, we noticed that sometimes the connection is established with a specific coverage area even if themobile device is located outside the coverage zone (figure 3). This phenomena is due to the signal strength fluctuation
4
A PREPRINT - FEBRUARY 21, 2019
of the radio waves [6]. Therefore, we will also introduce a technique to optimize the coverage area in such a manner toreflect the real propagation of the coverage area.
Figure 3: Illustration of wrong representation of the coverage areas due to radio signal fluctuation phenomena - Coveragearea generated using Voronoi (polygon) and GPS locations of the device connected to it (dots)
4 Adopted approach
Estimating the precise location of mobile users within the coverage areas using only the CDR data is a very challengingtask. Therefore, our methodology is inspired and based on previous work [21], where first the approach starts byoptimizing the coverage areas. This task is performed using a data-driven model that will be explained in the followingsubsection. Then, we will apply our switching Kalman filter to the detected type of movement registered in the CDR dataand also estimate the location of mobile devices within the mobile network coverage area . Finally, we will introducemap-matching techniques to map the estimated location to roads or building based on the outcome of movement models.
4.1 Coverage optimization
As mentioned before, the coverage area provided by the mobile operator and estimated using Voronoi method needsto be corrected. Hence, we collected GPS data as illustrated in figure 3 to verify how much of the coverage is wrong.From this perspective, we designed our approach for enhancing the representation of the coverage area by performingthe following steps:
1. First, we create a circle around the polygon in such manner that the antenna location and the azimuth of thesignal propagation are taken into account.
2. Second, we execute a mathematical optimization by minimizing a penalty function f(p), where p refers toradius of extension, based on the observations (in our case GPS data) that are applied to the radius of the circle.
The defined function f(p) penalizes large distances d(x, r, y) between the coverage zone (cell area) (x, r), x refers to thecenter and r to the radius, and the GPS coordinates y when the events was triggered. In addition, we correct the largecoverage areas that are not realistic to the GPS data by reducing the size of the coverage.
Therefore, in order to formulate our mathematical model let’s consider C to be the set of all pairs of a cell index and itsassociated GPS coordinates (j, y). Our penalty function can be then expressed as follows:
f(p) =∑i
p2i + w∑
(j,y)∈C
[min (0, d(xj , rj ,y))]2, (1)
We defined w = 10 as the weight for non-coverage penalty based on heuristic observations, pi as radius extensions,and d(x, r,y) = r − |x− y|. In addition, our implementation of the L-BFGS-B algorithm with the intention of [25]minimizing the coverage function was based on scipy library.
5

A PREPRINT - FEBRUARY 21, 2019
4.2 Mobility classification and localization
The classical Kalman filter allows the use of only a single transition matrix at each step t = 1, .., T . Thus, it is adynamic linear system defined as follows:
xt = Fxt−1 + qt (2)yt = Hxt + rt , (3)
Where, xt and yt represent the hidden state and observed evidence respectively. Furthermore, F is a transitionmatrix and H is an observation matrix. The last variables in both equations are random Gaussian noises for transitionqt ∼ N (0, Qt) and for observation rt ∼ N (0, Rt).
In general, the Kalman filter represents the belief states xt of using continuous random variables Xt with Gaussianprobability distributions xt ∼ P (Xt = x) = N (x;µt, σt). In addition, the inference algorithms can be used tocalculate the probability distribution of Xt from the up-to-date evidence y1:t, which is filtering, or all the evidence y1:T
- known as smoothing.
The Kalman filter is known to be very good in estimating or predicting a state following one behavioral model. Whereas,human mobility in real life has many behavioral types and it can involve multiple mobility models at each step in atrajectory. Therefore, we will use adaptive Kalman filter [34], where we will introduce discrete random variables tothe algorithm. The adopted discrete variable St will define the chosen model used in the transition step at t. Next,the Kalman filter computes the probability of each model M at time t, given all the evidence (Formula 6 & 7) and theprobability distribution of the hidden state variable associated with each model (Formula 8).
Mt|t(i) = P (St = i|y1:t) (4)Mt|T (i) = P (St = i|y1:T ) (5)
P (Xt|St = i,y1:τ ) = N (µit|τ ,Σit|τ ) τ ∈ {t, T} (6)
In addition, the consolidated belief state of hidden variable Xt at time t is expressed by combining all the Gaussiansmodels and the probabilities of the models as follows:
P (Xt|y1:τ ) =∑i
Mt|τ (i) · P (Xt|St = i,y1:τ ) (7)
Finally, it is necessary to define the model transition probability matrix Tz(i, j) = P (St = j|St−1 = i). We define thetransition probability from St−1 = i to St = j with the higher chance to stay in the same model:
Tz(i, j) =
{0.8 if i = j
0.2Num−1 otherwise
(8)
where, Num is the number of models. Furthermore, one of the issues with KF is the exponential growth of the beliefstate due to the multiplication between the number of Gaussians and the number of models at each step. For this reason,filtering and smoothing are a necessity in the process and they are computed using predefined models of behavior.
After defining and explaining the main component in our adaptive Kalman filter, we will explain how the mobilitymodels are defined and integrated in the algorithm. We begun by considering location x̄t and velocity ϑt at time t as
hidden variables xt =
(x̄tϑt
)and ensuring that a moving user‘s coordinates and velocities comply with the following
equations:
x̄t = x̄t−1 + ϑt−1δt+ q̄t (9)ϑt = ϑt−1 + q̇t (10)
where δt is the time difference from the previous event resulting from the Bayes Network approach and(
q̄tq̇t
)are
noise. In conclusion, the KF equations are as follows:
6

A PREPRINT - FEBRUARY 21, 2019
xt = Fxt−1 +Qt (11)yt = Hxt +Rt , (12)
Hence, for each model we have to define a transition matrix F and a noise variance matrix Qt ∼ N (0,Q(M)t ). For
instance, in case of a moving user on plain 2D map, its transition matrix (Move model) is:
F (M) =
1 0 δt 00 1 0 δt0 0 1 00 0 0 1
(13)
On the other hand, a staying user at the same location can be characterized by an identity matrix F (S) = I (StayModel).
F (S) =
1 0 0 00 1 0 00 0 1 00 0 0 1
(14)
At the same time, the observation model (H and Rt) should reflect the location of the antenna that the user is connectedto, and the coverage zone of the antenna expresses the observation error. During testing, all the "antennas" will have thesame model:
H =
(1 0 0 00 1 0 0
)Rt =
(1.22 0
0 1.22
). (15)
As a consequence, the algorithm computes the probabilities P (St = k|y1:t) of each model k at time t and the probabilitydistribution of the coordinate and the velocity P (Xt|St = k,y1:t) for given up-to-date evidence y1:t. The figure 4illustrate exactly this process of computing the probability of each model based on the observed evidence in our casethe triggered event within a coverage area. Then, the same process is applied to all the evidence y1:T , which givessmoothed results, that are more accurate and therefore are used in actual testing and validation.
Figure 4: Illustration of the algorithm steps in evaluating the Observations and computing the probabilities for Stayand Move models - The circle and dots represent the observed coverage areas and below the associated probabilitiesfollowing the chronological order
7

A PREPRINT - FEBRUARY 21, 2019
4.3 Map-matching
In order to improve the accuracy of the estimated positions, the corresponding points were matched to the closest road(Figure 5). The applied Map-matching on the point pi is performed in two steps: first, the road segments set Spi,r incertain radius r around the pi are looked up to by applying the following formula :
Spi,r = { (p1, p2) | d(p1, pi) <= r ∨ d(p2, pi) <= r } ; (16)
Next for each found road segment sj a matched candidates points set Cpi,r are computed using an orthogonal projection(proj(, )) of pi to sj :
Cpi,r = { proj(pi, sj)|∀sj ∈ Spi,r} ; (17)
Afterwards a distance d(pi, cj) between point pi and all its matched candidates cj is computed using haversine distance[28], since we are dealing with a projection on a sphere (Earth). Finally minimal distant candidate is selected;
mm(pi, r) = { c|d(pi, c) = min[d(pi, cj), cj ∈ Cpi,r] } ; (18)
Figure 5: Map Matching schemtic: pi denotes the point that has to be matched; s1, s2 and s3 are the road segmentsfound in radius r; c1,c2 and c3 are the projections of the pi. Projection c3 is selected for matching pi as it is the closestto pi.
5 Experimental evaluation
The evaluation of our method is executed by comparing it to GPS data collected from the field as a ground truth. TheGPS data was collected using an application developed by us in order to add an annotation to the collected records.This way, we can evaluate the movement episode detection (Move or Stay) and also the estimated locations after andbefore the map-matching process. The data used for testing contains 649 CDR records provided by the mobile operatorfor six different users for almost a period of one month. Furthermore, during the campaign of collecting the data theusers annotated their movement and we had 450 stay locations and 199 move locations.
5.1 Mobility episode detection
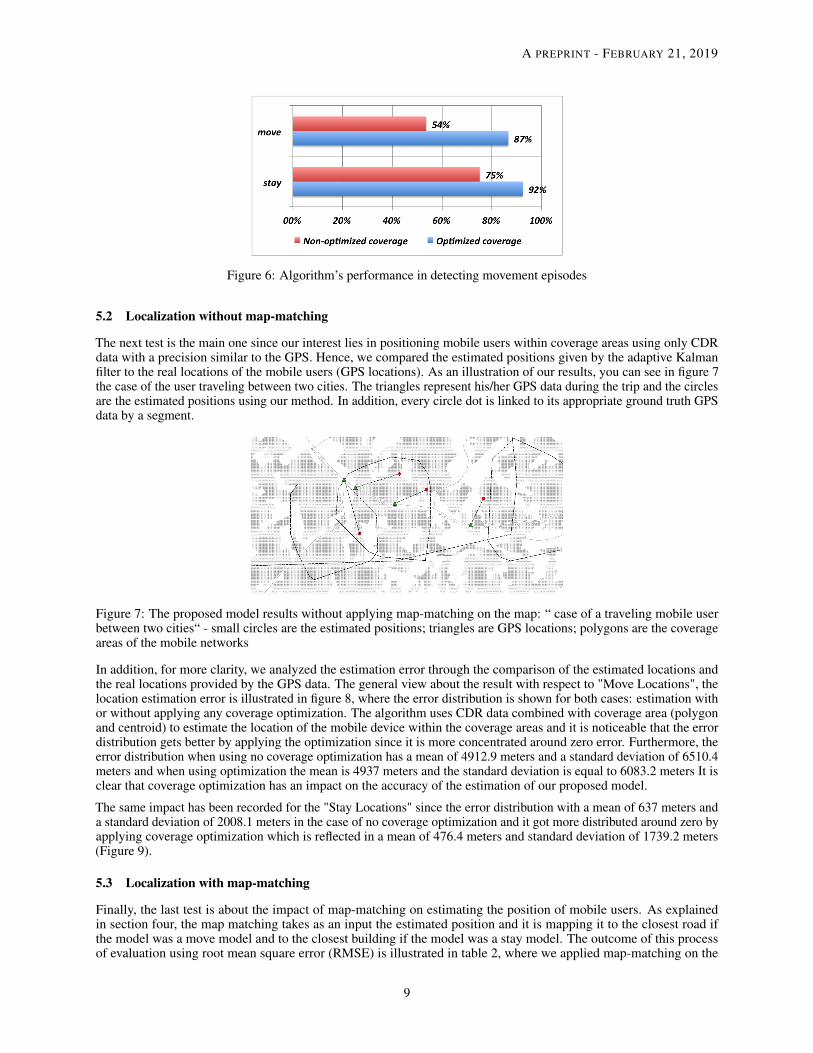
By using the annotated GPS data we have an idea about the users whether they are staying in a specific location ormoving. This information was used to assess the performance of our Kalman algorithm. The general performancecan be visualized in figure 6, where we also tested out how the optimization of the coverage area influences thedetection of movement episodes. The algorithm was capable of estimating stay locations with an accuracy of 75%without introducing our method for optimizing the coverage area and an accuracy of 92% with the proposed coverageoptimization formula. The same increase happened to the detection of move locations from 54% to 87% of accuracy. Itis clear that the coverage optimization approach has a positive impact on enhancing our detection and classification ofthe locations: a "move" location or a "stay" location.
8
A PREPRINT - FEBRUARY 21, 2019
Figure 6: Algorithm’s performance in detecting movement episodes
5.2 Localization without map-matching
The next test is the main one since our interest lies in positioning mobile users within coverage areas using only CDRdata with a precision similar to the GPS. Hence, we compared the estimated positions given by the adaptive Kalmanfilter to the real locations of the mobile users (GPS locations). As an illustration of our results, you can see in figure 7the case of the user traveling between two cities. The triangles represent his/her GPS data during the trip and the circlesare the estimated positions using our method. In addition, every circle dot is linked to its appropriate ground truth GPSdata by a segment.
Figure 7: The proposed model results without applying map-matching on the map: “ case of a traveling mobile userbetween two cities“ - small circles are the estimated positions; triangles are GPS locations; polygons are the coverageareas of the mobile networks
In addition, for more clarity, we analyzed the estimation error through the comparison of the estimated locations andthe real locations provided by the GPS data. The general view about the result with respect to "Move Locations", thelocation estimation error is illustrated in figure 8, where the error distribution is shown for both cases: estimation withor without applying any coverage optimization. The algorithm uses CDR data combined with coverage area (polygonand centroid) to estimate the location of the mobile device within the coverage areas and it is noticeable that the errordistribution gets better by applying the optimization since it is more concentrated around zero error. Furthermore, theerror distribution when using no coverage optimization has a mean of 4912.9 meters and a standard deviation of 6510.4meters and when using optimization the mean is 4937 meters and the standard deviation is equal to 6083.2 meters It isclear that coverage optimization has an impact on the accuracy of the estimation of our proposed model.
The same impact has been recorded for the "Stay Locations" since the error distribution with a mean of 637 meters anda standard deviation of 2008.1 meters in the case of no coverage optimization and it got more distributed around zero byapplying coverage optimization which is reflected in a mean of 476.4 meters and standard deviation of 1739.2 meters(Figure 9).
5.3 Localization with map-matching
Finally, the last test is about the impact of map-matching on estimating the position of mobile users. As explainedin section four, the map matching takes as an input the estimated position and it is mapping it to the closest road ifthe model was a move model and to the closest building if the model was a stay model. The outcome of this processof evaluation using root mean square error (RMSE) is illustrated in table 2, where we applied map-matching on the
9

A PREPRINT - FEBRUARY 21, 2019
Figure 8: Error distribution of the proposed algorithm for "Move" locations
Figure 9: Error distribution of the proposed algorithm for "Stay" locations
estimated position without coverage optimization (Figure 10) and with coverage optimization (Figure 11) . The resultsshow that the map-matching has a good impact on the "Move location" since the error decreased and also it is clear thatthe coverage optimization has a positive impact on reducing the error. however, introducing the map-matching for "staylocation" has impacted it negatively. Therefore, from this analysis, we can conclude that the best model for estimating"Stay locations" is by introducing only the coverage optimization and for "Move locations" introducing the coverageoptimization and the map-matching has a good impact on reducing the error.
Table 2: The RMSE evaluation in meters of the proposed algorithm for positioning with Coverage Optimization (Opt)and Map-Matching (MM)
Model No-opt Opt No-Opt+MM Opt+MMStay 2106.8 1803.3 2788.1 2402.6
locationsMove 8156.1 7834.5 4712.1 3344.4
locations
10

A PREPRINT - FEBRUARY 21, 2019
Figure 10: Validating Map-Matched results of Kalman filter (no coverage optimization); red circles - estimated position,blue squares - map-matched position, green triangles - actual position
Figure 11: Validating Map-Matched results of Kalman filter (using coverage optimization); red circles - estimatedposition, blue squares - map-matched position, green triangles - actual position
6 Conclusion
The emerging technologies related to mobile data especially CDR data has great potential for mobility and transportationapplications. However, it presents some challenges due to its spatio-temporal characteristics and sparseness. Therefore,in this article, we introduced a new model to refine the positioning accuracy of mobile devices using only CDR dataand coverage areas locations. The adopted method has three steps: first, we discovered which model of movement(Move, Stay) is associated with the coverage areas where the mobile device was connected using a switching Kalmanfilter. Then, simultaneously we estimated the location or the position of the device. Finally, we applied map-matchingto bring the positioning to the right road segment. The results are very encouraging and the approach performs withless error in the cases of "Move model" by adding coverage optimization and map-matching and for "Stay model" theoptimization was enough to reduce the errors; nevertheless, there is some enhancement that can be done at the level ofdata preprocessing, movement models and map matching. For example by introducing more sophisticated movementmodel based on reinforced learning and a more sophisticated map matching for matching the estimated locations.
References
[1] Michael JA Berry and Gordon Linoff. Mastering data mining, 2000.
[2] Bastian Bloessl, Michele Segata, Christoph Sommer, and Falko Dressler. Towards an open source ieee 802.11 p
11
A PREPRINT - FEBRUARY 21, 2019
stack: A full sdr-based transceiver in gnu radio. In Vehicular Networking Conference (VNC), 2013 IEEE, pages143–149. IEEE, 2013.
[3] Noelia Caceres, Luis M Romero, Francisco G Benitez, and Jose M del Castillo. Traffic flow estimation modelsusing cellular phone data. IEEE Transactions on Intelligent Transportation Systems, 13(3):1430–1441, 2012.
[4] Manoranjan Dash, Kee Kiat Koo, Joao Bartolo Gomes, Shonali Priyadarsini Krishnaswamy, Daniel Rugeles,and Amy Shi-Nash. Next place prediction by understanding mobility patterns. In Pervasive Computing andCommunication Workshops (PerCom Workshops), 2015 IEEE International Conference on, pages 469–474. IEEE,2015.
[5] Bram Dil, Stefan Dulman, and Paul Havinga. Range-based localization in mobile sensor networks. In EuropeanWorkshop on Wireless Sensor Networks, pages 164–179. Springer, 2006.
[6] Pavel Dohnálek, M Dvorsky, P Gajdos, Libor Michalek, R Sebesta, and M Voznak. A signal strength fluctuationprediction model based on the random forest algorithm. Elektronika ir Elektrotechnika, 20(5):123–126, 2014.
[7] Sara B Elagib, Aisha-Hassan A Hashim, and RF Olanrewaju. Cdr analysis using big data technology. In Computing,Control, Networking, Electronics and Embedded Systems Engineering (ICCNEEE), 2015 International Conferenceon, pages 467–471. IEEE, 2015.
[8] Pierdomenico Fiadino, Danilo Valerio, Fabio Ricciato, and Karin Anna Hummel. Steps towards the extraction ofvehicular mobility patterns from 3g signaling data. In International Workshop on Traffic Monitoring and Analysis,pages 66–80. Springer, 2012.
[9] Marta C Gonzalez, Cesar A Hidalgo, and Albert-Laszlo Barabasi. Understanding individual human mobilitypatterns. nature, 453(7196):779, 2008.
[10] Amnir Hadachi, Artjom Lind, Joonas Lomps, and Peeter Piksarv. From mobility analysis to mobility hubsdiscovery: A concept based on using cdr data of the mobile networks. In Ultra Modern Telecommunications andControl Systems and Workshops (ICUMT), 2018 10th International Congress on, pages 1–6. IEEE, 2018.
[11] Lingxuan Hu and David Evans. Localization for mobile sensor networks. In Proceedings of the 10th annualinternational conference on Mobile computing and networking, pages 45–57. ACM, 2004.
[12] Zhuojie Huang, Udayan Kumar, Todd Bodnar, and Marcel Salathé. Understanding population displacementson location-based call records using road data. In Proceedings of the Second ACM SIGSPATIAL InternationalWorkshop on Mobile Geographic Information Systems, pages 17–21. ACM, 2013.
[13] Sibren Isaacman, Richard Becker, Ramón Cáceres, Stephen Kobourov, Margaret Martonosi, James Rowland, andAlexander Varshavsky. Identifying important places in people’s lives from cellular network data. In InternationalConference on Pervasive Computing, pages 133–151. Springer, 2011.
[14] Sibren Isaacman, Richard Becker, Ramón Cáceres, Margaret Martonosi, James Rowland, Alexander Varshavsky,and Walter Willinger. Human mobility modeling at metropolitan scales. In Proceedings of the 10th internationalconference on Mobile systems, applications, and services, pages 239–252. Acm, 2012.
[15] Andreas Janecek, Karin A Hummel, Danilo Valerio, Fabio Ricciato, and Helmut Hlavacs. Cellular data meetvehicular traffic theory: location area updates and cell transitions for travel time estimation. In Proceedings of the2012 ACM Conference on Ubiquitous Computing, pages 361–370. ACM, 2012.
[16] Shan Jiang, Joseph Ferreira, and Marta C González. Activity-based human mobility patterns inferred from mobilephone data: A case study of singapore. IEEE Transactions on Big Data, 3(2):208–219, 2017.
[17] Hiroshi Kanasugi, Yoshihide Sekimoto, Mori Kurokawa, Takafumi Watanabe, Shigeki Muramatsu, and RyosukeShibasaki. Spatiotemporal route estimation consistent with human mobility using cellular network data. In PervasiveComputing and Communications Workshops (PERCOM Workshops), 2013 IEEE International Conference on,pages 267–272. IEEE, 2013.
[18] Fahim Hasan Khan, Mohammed Eunus Ali, and Himel Dev. A hierarchical approach for identifying user activitypatterns from mobile phone call detail records. In Networking Systems and Security (NSysS), 2015 InternationalConference on, pages 1–6. IEEE, 2015.
[19] Silvia Krug, Matias Federico Siracusa, Sebastian Schellenberg, Peggy Begerow, Jochen Seitz, Thomas Finke, andJuergen Schroeder. Movement patterns for mobile networks in disaster scenarios. In World of Wireless, Mobile andMultimedia Networks (WoWMoM), 2014 IEEE 15th International Symposium on a, pages 1–6. IEEE, 2014.
[20] HyungJune Lee, Martin Wicke, Branislav Kusy, and Leonidas Guibas. Localization of mobile users usingtrajectory matching. In Proceedings of the first ACM international workshop on Mobile entity localization andtracking in GPS-less environments, pages 123–128. ACM, 2008.
12

A PREPRINT - FEBRUARY 21, 2019
[21] Artjom Lind, Amnir Hadachi, and Oleg Batrashev. A new approach for mobile positioning using the cdr data ofcellular networks. In Models and Technologies for Intelligent Transportation Systems (MT-ITS), 2017 5th IEEEInternational Conference on, pages 315–320. IEEE, 2017.
[22] Artjom Lind, Amnir Hadachi, Peeter Piksarv, and Oleg Batrashev. Spatio-temporal mobility analysis for commu-nity detection in the mobile networks using cdr data. In Ultra Modern Telecommunications and Control Systemsand Workshops (ICUMT), 2017 9th International Congress on, pages 250–255. IEEE, 2017.
[23] Huiyu Liu, Yunzhou Zhang, Xiaolin Su, Xintong Li, and Ning Xu. Mobile localization based on received signalstrength and pearson’s correlation coefficient. International Journal of Distributed Sensor Networks, 11(8):157046,2015.
[24] Mingming Lu, Dan Meng, Yanni Peng, Yong Li, Ying Zhao, Xiaoping Fan, and Fangfang Zhou. A visualanalytics approach for exploring individual behaviors in smartphone usage data. In Pacific Visualization Symposium(PacificVis), 2016 IEEE, pages 224–228. IEEE, 2016.
[25] José Luis Morales and Jorge Nocedal. Remark on “algorithm 778: L-bfgs-b: Fortran subroutines for large-scalebound constrained optimization”. ACM Transactions on Mathematical Software (TOMS), 38(1):7, 2011.
[26] Fabio Pinelli, Giusy Di Lorenzo, and Francesco Calabrese. Comparing urban sensing applications using event andnetwork-driven mobile phone location data. In Mobile Data Management (MDM), 2015 16th IEEE InternationalConference on, volume 1, pages 219–226. IEEE, 2015.
[27] Yan Qu and Jun Zhang. Trade area analysis using user generated mobile location data. In Proceedings of the 22ndinternational conference on World Wide Web, pages 1053–1064. ACM, 2013.
[28] C Carl Robusto. The cosine-haversine formula. The American Mathematical Monthly, 64(1):38–40, 1957.[29] Ratul Sikder, Md Jamal Uddin, and Sajal Halder. An efficient approach of identifying tourist by call detail record
analysis. In Computational Intelligence (IWCI), International Workshop on, pages 136–141. IEEE, 2016.[30] Qingquan Sun, Fei Hu, and Qi Hao. Human movement modeling and activity perception based on fiber-optic
sensing system. IEEE Transactions on Human-Machine Systems, 44(6):743–754, 2014.[31] Etienne Thuillier, Laurent Moalic, Sid Lamrous, and Alexandre Caminada. Clustering weekly patterns of human
mobility through mobile phone data. IEEE Transactions on Mobile Computing, 17(4):817–830, 2018.[32] Krasimir Tonchev, Strahil Sokolov, Yuliyan Velchev, Georgy Balabanov, and Vladimir Poulkov. Recognition
of human daily activities. In Communication Workshop (ICCW), 2015 IEEE International Conference on, pages290–293. IEEE, 2015.
[33] Joram Walfisch and Henry L Bertoni. A theoretical model of uhf propagation in urban environments. IEEETransactions on antennas and propagation, 36(12):1788–1796, 1988.
[34] Feng Xiao, Mingyu Song, Xin Guo, and Fengxiang Ge. Adaptive kalman filtering for target tracking. In OceanAcoustics (COA), 2016 IEEE/OES China, pages 1–5. IEEE, 2016.
13