exploring for geothermal resources with electromagnetic ... · exploring for geothermal resources...
TRANSCRIPT
Exploring for Geothermal Resourceswith Electromagnetic Methods
Gerard Munoz
Received: 1 October 2012 / Accepted: 22 April 2013 / Published online: 17 May 2013� Springer Science+Business Media Dordrecht 2013
Abstract Electrical conductivity of the subsurface is known to be a crucial parameter for
the characterization of geothermal settings. Geothermal systems, composed by a system of
faults and/or fractures filled with conducting geothermal fluids and altered rocks, are ideal
targets for electromagnetic (EM) methods, which have become the industry standard for
exploration of geothermal systems. This review paper presents an update of the state-of-the-
art geothermal exploration using EM methods. Several examples of high-enthalpy geo-
thermal systems as well as non-volcanic systems are presented showing the successful
application of EM for geothermal exploration but at the same time highlighting the impor-
tance of the development of conceptual models in order to avoid falling into interpretation
pitfalls. The integration of independent data is key in order to obtain a better understanding of
the geothermal system as a whole, which is the ultimate goal of exploration.
Keywords Geothermics � Electromagnetics � Electrical resistivity � Exploration
1 Introduction
Geothermal energy is an attractive renewable energy which is becoming an important
contributor to the energy mix. In 2008, its power production exceeded that of solar
photovoltaics more than three times (Rybach 2010). However, contrary to other renewable
energy sources like solar or wind energy, which exhibit exponential growths, geothermal
energy has been experiencing a linear growth in the last years (Rybach 2010; Bertani
2010). Some optimistic forecasts also point to an exponential growth for geothermal
energy (Bertani 2010), especially based on technologic developments like enhanced (or
engineered) geothermal systems (EGS) (Rybach 2010) which are viewed by some studies
Electronic supplementary material The online version of this article (doi:10.1007/s10712-013-9236-0)contains supplementary material, which is available to authorized users.
G. Munoz (&)German Research Centre for Geosciences GFZ, Telegrafenberg, 14473 Potsdam, Germanye-mail: [email protected]
123
Surv Geophys (2014) 35:101–122DOI 10.1007/s10712-013-9236-0

as the future of geothermal energy utilization (Tester et al. 2006). EGS are universally
deployable, as no special geological settings are required but generally involve deeper
targets and therefore highlight the need for reliable exploration techniques. Exploration for
geothermal energy is also of great importance in conventional geothermal systems in order
to improve its economic viability (Barbier 2002). Over the last years, there has been an
important increase in the use and development of several exploration methods for geo-
thermal resources, seismic as well as electromagnetic (EM); but while the former (like
repeated 3D surface seismic, surface-to-borehole vertical seismic and borehole-to-borehole
cross-well seismic profiling) have not always led to better understanding of the geothermal
systems, the latter have become very popular due to improved equipment, methodologies
and processing and modelling software (Spichak and Manzella 2009).
The electrical conductivity of the subsurface is known to be a crucial parameter for the
characterization of geothermal settings. Geothermal systems are in general composed by a
region or system of faults and fractures filled with geothermal fluids, which can have high
concentrations of dissolved salts, thus resulting in conducting electrolytes in a rock matrix.
Both fluid and matrix (to a lesser extent) conductivities depend on temperature, and the
geothermal system exhibits, generally, higher conductivity values than the host rocks. Clay
mineral alterations resulting from the hydrothermal processes that take place in geothermal
systems also have a high conductivity signature. This makes geothermal systems ideal
targets for EM methods, which have become the industry standard for exploration of
geothermal systems in many countries. The relatively easy to identify low resistivity zones
produced by brines and clays that cap a geothermal system (Wright et al. 1985) represent
attractive targets for exploration; however, this ‘‘anomaly hunting’’ (Cumming 2009) can
sometimes be misleading; clay caps produce high conductivity anomalies but the opposite
is not true, not all conductive anomalies are clay caps.
In recent years, many papers have been published about the use of electromagnetic
methods for exploration of geothermal zones, including some review papers (Pellerin et al.
1996; Meju 2002; Spichak and Manzella 2009). In this review paper, I will try to present an
update of the state-of-the-art geothermal exploration using EM methods. First, I will
present the conceptual conductivity models of classical convective hydrothermal systems
briefly summarizing the causes of the observed conductivities in geothermal systems and
will introduce other kinds of possible geothermal targets. I will present a number of
examples of use of EM methods for imaging of geothermal targets, both in classical ‘‘clay
cap’’ systems and in other geological settings (e.g., sedimentary basins). I will focus on
magnetotelluric (MT) techniques, as it is the only method to reliably reach depths of
several kilometres needed for some geothermal targets, but I will not forget other EM
methods and I will highlight the importance of incorporating as much additional data
(geological, geophysical, geochemical,…) as possible in order to obtain a better under-
standing of the geothermal system as a whole, which is the ultimate goal of exploration.
2 Conceptual Model
Geothermal resources, understood as systems that store natural heat in rock and fluids
within the Earth, can be divided into different types according to the temperature and the
nature of the reservoir. A primary division of the geothermal systems can be made
according to whether they are related to emplacement of magma or not. Magmatic geo-
thermal systems include convective hydrothermal systems (water or steam dominated), hot
dry rock and partial melt systems, while non-volcanic resources are usually related to hot
102 Surv Geophys (2014) 35:101–122
123

fluids in sedimentary or crystalline reservoirs (Meju 2002). Enhanced (or engineered)
geothermal systems (EGS) are geothermal resources with low permeability and/or porosity
and high temperature which need artificial stimulation of the fracture system to enhance the
fluid circulation. On the other end of the spectrum are supercritical systems, where fluids
are in supercritical conditions and for which the efficiency of power generation would be
very high.
Hydrothermal systems represent the most common type of geothermal reservoir (in
terms of exploitation) and most of the literature on exploration for geothermal resources is
related to hydrothermal systems. An ideal hydrothermal system consists, conceptually, of a
heat source, some sort of groundwater system to transport and sometimes store the heat
(reservoir) and a confining impermeable structure (cap). Geothermal fluids have salts
dissolved in high concentrations which provide conducting electrolytes within a rock
matrix. Both the conductivities of the fluids and the rock matrix are dependent on tem-
perature in a way that causes a large reduction in the bulk resistivity with increasing
temperature. The confining cap for most of the hydrothermal systems is produced by
prolonged reactions of the rocks with the thermal fluids, which produce a clay alteration
layer over a wide temperature range from under 100 �C to over 200 �C (Caldwell et al.
1986; Essene and Peacor 1995). At lower temperatures (70–150 �C), the clay cap is mainly
characterized by smectite. At higher temperatures, illite (in acidic rocks) and/or chlorite
(more abundant in basaltic rocks) become interlayered with smectite, forming a mixed
layer with increasing proportions, especially above 180 �C. At temperatures over
220–240 �C, alteration is mainly in form of chlorite and epidote minerals, which show a
higher resistivity signature than its lower temperature counterparts. The low temperature
(\150 �C) alteration species (illite–smectite) are significantly more conductive than the
higher temperature (chlorite–epidote) species (Bjornsson et al. 1986). Smectites and illites
have loosely bound cations that make these minerals electrically conductive, whereas in
the chlorites and epidotes, all ions are bound in the crystal lattice and are, therefore, more
resistive (Deer et al. 1962). Thus, an increase in resistivity beneath a highly conductive
surficial layer (clay cap), reflecting an increase in temperature with depth, is a common
signature of high-temperature geothermal systems. For a compact but comprehensive
review on the causes of enhanced electrical conductivity in geothermal systems see Ussher
et al. (2000) and references therein.
The strong link between electrical resistivity and clay minerals and therefore tem-
perature allows using the resistivity structure as distinguishing mark for high-tempera-
ture areas. Alteration, however, is generally unaffected by subsequent cooling, and in
most cases, the resistivity structure can be regarded as a ‘‘maximum thermometer’’
(Arnason et al. 2010). In a simple hydrothermal context, the geothermal system can be
conceptualized with the model of Fig. 1a. In a more generalized context, the upflow and
outflow areas can affect the geometry of the low resistivity zone. The upflow area is a
zone in the reservoir where the fluid flow is predominantly vertical and generally the
temperature increases with depth. In upflow areas, the base of the conductive clay cap is
often elevated because of the relative increase in higher resistivity minerals in the mixed
layer with temperature (i.e. depth). In cooler outflow areas, where the flow is pre-
dominantly horizontal and temperature decreases with depth below the main outflow
zone, the base of the clay cap can come closer to the surface and the geometry of the
high conductivity anomaly can be asymmetric and not centred on the reservoir
(Anderson et al. 2000). An example of such a generalized geothermal system is shown
in Fig. 1b. In some cases at high-temperature volcanic-associated geothermal systems,
the clay cap may even be absent. In many high-temperature liquid-dominated
Surv Geophys (2014) 35:101–122 103
123

geothermal systems, the fluid, which is dominantly meteoric, is not re-circulated but
after being heated at depth, it rises by convection to near-surface depths, where it is
entrained into the overall pattern of groundwater flow or discharged joining the surface
drainage (Meju 2002), like in many liquid-dominated geothermal systems in New
Zealand (Bibby et al. 1995). The most favourable conditions for high-temperature
systems that can be used for electricity production usually occur when magma intrudes
into shallow crustal levels (\10 km depth) and hydrothermal convective fluid flow can
take place above the intrusion body.
Non-magmatic geothermal systems, on the other hand, exhibit a much greater varia-
tion in geometry, and it is generally not possible to construct a conceptual model
encompassing the whole range of non-magmatic geothermal systems. The exact nature of
conductive anomalies (if present) can vary greatly between different geothermal systems
but, in general, it is related to electrolytic conduction in saline fluids. Geothermal fluids
tend to have high concentrations of dissolved salts, and their conductivity increases with
temperature (Ucok et al. 1980). For non-magmatic geothermal systems, imaging the
electrical conductivity distribution helps locating deep aquifers that can act as reservoirs
and fluid pathways. In EGS, however, low natural permeability and depth of the system
can produce relatively small and badly connected targets which might be difficult to
image with electromagnetic methods. In these cases, EM methods can be very helpful in
monitoring the engineering process by providing images before, during and after stim-
ulation activities and estimating the enhancement in permeability achieved. In geothermal
systems where saline fluids are key players, its electrical properties can greatly vary
depending on whether faults and fractures constitute pathways that can enhance fluid
(and heat) circulation or whether they represent barriers impeding fluid circulation (Ritter
et al. 2005).
Fig. 1 a Conceptual model of a geothermal system in a simple hydrothermal context. Clay alteration layershows lower resistivity than the surrounding background rocks (redrawn from Pellerin et al. 1996).b Conceptual model of a generalized geothermal system (redrawn from Cumming 2009). The upflow andoutflow areas affect the geometry of the conductive clay cap and cause the anomaly not to be centred on thereservoir
104 Surv Geophys (2014) 35:101–122
123

3 High-Enthalpy Geothermal Systems
High-enthalpy geothermal systems (defined as geothermal systems with temperature above
150–200 �C; for example, Muffler and Cataldi 1978; Benderitter and Cormy 1990) are
most commonly found in tectonically active regions, such as plate boundaries, rift zones
and above hot spots, or in young volcanic regions, where the total thermodynamic energy
is high enough to generate such temperatures. High-enthalpy geothermal systems are the
most likely systems to be described by the conceptual model introduced in the previous
section (Fig. 1). This kind of electrical resistivity distributions (conductive clay cap
overlying a more resistive reservoir) has been observed using a variety of electromagnetic
methods in many regions in the world. Next, I will summarize the most significant findings
at some exemplary geothermal areas (see location in Online Resource 1). However, these
are not by far the only possible examples. Similar high-enthalpy geothermal systems have
been found for instance in Central America (e.g., El Salvador—Romo et al. 1997), Africa
(e.g., Ethiopia—Abiye and Haile 2008; Djibouti—Arnason and Flovenz 1998; Kenya—
Mwangi 2012), Indonesia (e.g., Sibayak in Sumatra—Mulyadi 2000; Daud et al. 2001;
Bajawa in Flores—Uchida et al. 2002; Kamojang in Java and Lahendong in Sulawesi—
Raharjo et al. 2010), Japan (e.g., Sumikawa—Uchida 1995; Muraoka et al. 1998; Uchida
et al. 2000; Yamane et al. 2000; Mt. Aso—Asaue et al. 2005; Minamikayabe—Spichak
2005; Ogiri—Uchida 2005; Yanaizu-Nishiyama—Uchida et al. 2010), Greece (e.g., Lagios
et al. 1998), Turkey (e.g., Burcak et al. 2005; Kuyumcu et al. 2011) or Russia (e.g.,
Spichak et al. 2007; Nurmukhamedov et al. 2010).
3.1 Taupo Volcanic Zone (New Zealand)
The Taupo Volcanic Zone (TVZ) is a region of extension and rhyolite volcanism asso-
ciated with the subduction of the Pacific plate beneath the New Zealand’s North Island.
Associated with the active volcanism are more than 20 high-temperature geothermal
systems with a total heat output of more than 4,000 MW (Bibby et al. 1995). Early
exploration of the TVZ represents perhaps the most successful application of electrical
resistivity techniques for delineating geothermal systems (Bibby et al. 2005). Electrical
resistivity maps (e.g., Bibby 1988; Stagpoole and Bibby 1998) show that all known geo-
thermal systems within the TVZ are associated with low resistivity zones, while the
surrounding volcanic rocks are cold water saturated and more resistive. A characteristic
resistivity increase beneath the highly conductive surficial layer is seen within most geo-
thermal systems of the TVZ and is clearly demonstrated by the Schlumberger mapping
(Bibby 1988). Thus, all known geothermal systems in the TVZ comply with the classical
hydrothermal conceptual model of Fig. 1a. The converse, however, is not true, and not all
low resistivity zones correspond with active hydrothermal systems.
The whole Taupo Volcanic Zone has been extensively studied using electromagnetic
methods (see, e.g., Bibby et al. 1995, 2002; Ogawa et al. 1999; Heise et al. 2007; Bertrand
et al. 2012 and references therein) among others. In addition, a number of studies focused
on specific geothermal systems have been published. Figure 2 resumes some exemplary
electromagnetic studies carried out in the TVZ. Wairakei was the first geothermal system
of the TVZ used for generation of electric power, and it was where the large resistivity
contrast between hot geothermal waters and the background was first successfully dem-
onstrated (for a detailed review on the electromagnetic studies at Wairakei see Bibby et al.
2009 and the references therein). Other well-studied geothermal systems include Rotokawa
(e.g., Heise et al. 2008) and Ngatamariki (Risk et al. 2003). In all these geothermal fields, a
Surv Geophys (2014) 35:101–122 105
123

clear low resistivity anomaly associated with a clay cap has been delineated together with a
deeper higher resistivity core associated with high-temperature alteration mineralogy.
3.2 Hengill Volcanic Zone (Iceland)
The Hengill volcanic complex is located at the southern end of the western volcanic zone
of Iceland and is considered to be one of the largest high-temperature geothermal regions
in the country. The Hengill complex hosts three volcanic centres whose products are
mainly basalts and acidic rocks. Geothermal exploration in the Hengill area dates back to
the 1940s, including a number of geophysical surveys (mostly documented in internal
Fig. 2 Summary of some exemplary electromagnetic studies in the Taupo Volcanic Zone (TVZ) a DCapparent resistivity map of the TVZ obtained from Schlumberger array measurements using AB/2 = 500 m(after Bibby 1988). Arrows indicate location of the geothermal systems shown in the other panels. b contourlines of DC apparent resistivity obtained from Schlumberger array measurements in the Wairakeigeothermal field (modified from Risk 1984). The low resistivity contour lines delineate the extent of the claycap. c Three-dimensional electrical resistivity model obtained from 3D inversion of magnetotelluric (MT)data in the Rotokawa geothermal field. The low resistivity anomaly shows an elevated clay cap together witha higher resistivity core associated with temperatures [250 �C, the black dots represent seismic eventslocated within the high resistivity core (after Heise et al. 2008). d Distance–time apparent resistivitypseudosection obtained from time-domain Eelectromagnetic (TDEM) measurements at the Ngatamarikigeothermal field. A low resistivity feature associated with hydrothermal alteration is visible in thepseudosection (modified from Risk et al. 2003)
106 Surv Geophys (2014) 35:101–122
123

reports in Icelandic) such as DC resistivity (e.g., Hersir 1980), Bouguer gravity, central
loop transient electromagnetic (TEM) or magnetotellurics (e.g., Hersir 1980; Oskooi et al.
2005; Arnason et al. 2010). The Hengill complex is of special relevance for electromag-
netic exploration of geothermal resources because it was in the Nesjavellir geothermal
field, just north of Mount Hengill, where the correlation between alteration mineralogy and
electrical resistivity was first proposed (see Arnason et al. 2000 and references therein).
Arnason et al. (2010) presented a comprehensive electromagnetic study of the Hengill
complex in which they obtained a three-dimensional resistivity distribution from joint 1D
inversion of TEM and MT data and from 3D inversion of MT data. The dataset consists of
148 MT soundings acquired between 2000 and 2006 and more than 250 TEM soundings
acquired since 1991. The TEM data, being unaffected by near-surface homogeneities of the
electric field, can be used to correct the MT data for static shift effects, assuming the
underlying structure is mostly one-dimensional in the first few metres and enough energy
can be transmitted into the ground to ensure a good overlap between TEM and MT
apparent resistivity curves. The authors performed a joint 1D inversion of TEM and MT
(determinant) data and determined static shift factors which were subsequently used for
correcting the MT data for separate 3D inversion.
The obtained 3D resistivity distribution shows a very coherent image between the
stitched 1D joint inversions of TEM and MT and the 3D MT model. Figure 3 shows a
cross-section of the resistivity distribution obtained from stitched 1D inversions along a
12-km-long profile crossing Mount Hengill. A low resistivity layer reflecting smectite-
zeolite alteration is found at shallow depth (between 200 m a.s.l. and 800 m b.s.l.) being
more elevated beneath Mount Hengill. At 800 m b.s.l., a high resistivity zone that was
interpreted as an indication of high-temperature alteration extends to most of the survey
area. A deeper low resistivity layer starts appearing beneath Mount Hengill at about
3,000 m b.s.l. At about 6,500 m b.s.l., it has extended to form a widespread conductor
down to depths of about 10–15 km, where resistivity values reach 100 Xm and higher.
This deep conductive feature was interpreted as hot, solidified intrusions that act as heat
sources for the geothermal system above (Arnason et al. 2010).
3.3 Western US
The west of the US, including areas such as the Basin and Range (B&R) physiographic
province and Yellowstone, hosts a number of high-enthalpy geothermal systems, many of
which are used for electricity generation. The B&R region is characterized by extensional
tectonism that results in fault block mountains separated by alluvial valleys, high heat flow
and seismicity and many active geothermal areas. In the B&R, geothermal systems are
inherently open systems and are often accompanied by surface outflows. Although most of
the presently known geothermal fields were discovered because of surface manifestations
such as hot springs, fumaroles and hydrothermally altered ground, several electromagnetic
methods have been successfully applied to detect and characterize the geothermal fields
(see Fig. 4 for some exemplary electrical models from California).
Possibly, the most well known of the geothermal regions within the B&R is the Coso
geothermal field in southern California. The basement of the Coso Range is dominated by
fractured Mesozoic plutonic rocks that have been intruded by a large number of dikes, and
partly covered by Late Cenozoic volcanics, consisting mainly of basalts and rhyolites. The
emplacement history of the rhyolitic domes is consistent with either a single rhyolitic
reservoir moving upward through the crust or a series of successively shallower reservoirs
(Kurilovitch et al. 2003). This partially molten magma chamber is believed to be the heat
Surv Geophys (2014) 35:101–122 107
123

source that drives the geothermal system (Wannamaker et al. 2004). Permeability is high
within the individual Coso reservoirs but low in most of the surrounding rocks, limiting
reservoir fluid recharge and making reinjection important for sustained productivity
(Newman et al. 2008). A large number of electromagnetic surveys have been carried out in
the Coso area (e.g., Wannamaker et al. 2004; Newman et al. 2005, 2008) revealing the
classic MT response of a high-temperature geothermal reservoir, which presents a low
resistivity hydrothermal alteration zone (smectite clay cap) located above and adjacent to
more resistive propylitic alteration in the reservoir.
Similar low resistivity structures have also been observed in other areas of the western
USA like the Glass Mountain geothermal resource area (Cumming and Mackie 2007,
2010) in northern California, the Beowave geothermal field (Garg et al. 2007) in Nevada,
the Dixie Valley geothermal area also in Nevada (Garg et al. 2006; Wannamaker et al.
2007) or the Sulphur Springs thermal area in New Mexico (Wannamaker et al. 1997a, b).
3.4 Tuscany (Italy)
The geothermal systems in Tuscany (Italy) are concentrated in the Larderello—Travale
area (Larsen et al. 1995; Fiordelisi et al. 1995; Manzella et al. 2006; 2010; Ooskoi and
Fig. 3 Location map (lower right panel) of the MT (red dots) and TEM (black dots) stations in the surveyarea. Section location is indicated with a blue line in the map. Cross-sections (left panels) across the Hengillarea obtained from stitched 1D joint inversion of TEM and determinant MT data. The upper panel focuseson the depth range down to 2,500 m b.s.l. and shows a shallow low resistivity layer reflecting smectite-zeolite alteration. The high resistivity below reflects high-temperature alteration. The lower panel shows theresistivity distribution down to depths of 20 km and highlights the presence of a deeper widespread lowresistivity feature associated with hot, solidified intrusions that act as a heat source for the geothermalsystem above. Modified from Arnason et al. (2010)
108 Surv Geophys (2014) 35:101–122
123

Manzella 2011) and near the extinct volcano Mount Amiata (Fiordelisi et al. 2000; Volpi
et al. 2003). These two systems represent interesting examples in the sense that although
they are high-enthalpy geothermal systems, they do not conform to the classical electrical
resistivity structure of a conductive clay cap overlying a high resistivity high-temperature
reservoir core.
The Larderello—Travale (Fig. 5) system is a vapour dominated system with a deep
reservoir defined by fractures within metamorphic rocks down to 4,000 m depth and
characterized by very high temperatures up to 400 �C (Manzella et al. 2006). The
Larderello—Travale area has been studied extensively using seismic methods (e.g., Brogi
et al. 2003; Casini et al. 2010) whose main results comprise two reflective horizons (so-
called H- and K-horizons) related to high productivity areas. The origin of the reflectivity
of these horizons is considered to be related to the occurrence of localized high fluid
pressure within fractured levels, although the underlying fracturing mechanism is still
controversial (e.g., Marini and Manzella 2005). Resistivity models along 2D profiles in the
Travale area (e.g., Manzella et al. 2006; Ooskoi and Manzella 2011) reveal high con-
ductivity anomalies that the authors relate to a deep fractured and highly productive zone
in the metamorphic rocks, thus being caused by high conductive geothermal fluids within a
high permeability host.
Fig. 4 a Location map of the Coso and Glass Mountain geothermal fields. b 3D electrical resistivity modelof the Coso geothermal field obtained from 3D inversion of MT data (after Newman et al. 2008). c Cross-section of a 3D model obtained from inversion of the Zxy component of MT data corrected using TEMmeasurements in the Glass Mountain geothermal area (after Cumming and Mackie 2010). In both cases, thelow resistivity anomaly associated with clay cap alteration mineralogy is clearly imaged over a higherresistivity high-temperature reservoir
Surv Geophys (2014) 35:101–122 109
123

4 Non-Volcanic Geothermal Systems
Non-volcanic geothermal systems (including low-enthalpy systems, EGS, sedimentary
reservoirs, etc.) are usually associated with hot fluids in sedimentary or crystalline reser-
voirs, either with natural permeability (through faults and fractures) or needing additional
stimulation (EGS) of fluid pathways. In these systems, the aim of electromagnetic
exploration is to image low resistivity anomalies correlated with saline geothermal fluids.
Non-volcanic geothermal systems have been studied in a large variety of geographical and
geological context such as in Bulgaria (Polyanovo, Bojadgieva et al. 2006), Philippines
(Mabini, Del Rosario and Oanes 2010), Portugal (Chaves, Monteiro Santos et al. 1996,
2007), Korea (Pohang, Uchida et al. 2004, 2005; Lee et al. 2007), Brazil (Caldas Novas,
Pastana de Lugao et al. 2002), France (Soultz-sous-Forets, Geiermann and Schill 2010;
Spichak et al. 2010) or Hungary (Szentlorinc, Yu et al. 2010; Tulinius et al. 2010). In the
following section, I will highlight some examples of electromagnetic exploration of non-
volcanic geothermal systems.
4.1 Llucmajor Aquifer System (Spain)
The Llucmajor aquifer system is located in the southern part of the island of Majorca
(Spain). Water for agricultural purposes is extracted from the unconfined aquifer of the
Fig. 5 a Location map of the Tuscany geothermal systems (Larderello, Travale, Mt. Amiata) and theTravale MT profile (blue line). Modified after Ooskoi and Manzella (2011). b Resistivity cross-sectionobtained from 2D inversion of MT data in the Travale geothermal area. High conductivity appears related tofractured high productivity zones in the metamorphic rocks (green lines). Modified after Manzella et al.(2006)
110 Surv Geophys (2014) 35:101–122
123

system. Some wells show a geothermal anomaly manifested by anomalous high water
temperatures of 50 �C (Fig. 6). Because of the lack of heat sources in this region (volcanic
or through heat generation in the rock matrix), these high values have been associated with
vertical movements of water (Arango et al. 2009). An AMT–MT survey was carried out in
2002 to understand the aquifer system. A 3D resistivity model obtain from trial and error
forward modelling of the AMT–MT data reveals a high resistive top layer, a more con-
ductive middle layer, between 200 and 500 m, and a relatively resistive layer at the bottom.
The main characteristic of the geoelectrical model is the thickness variation of the con-
ductive layer, which presents minimum thickness in the area where the geothermal
anomaly is located (Arango et al. 2009). The authors establish a simple conceptual model
with two aquifers: one unconfined aquifer on top, and another deeper confined aquifer to
supply the hot water, with the aquitard between both aquifers presenting a discontinuity
(fault or fracture) to favour vertical fluid movements. An exploratory well drilled based on
the results of the AMT data revealed a good coincidence of the resistivity model with the
well logs and detected a layer of calcareous breccia which could be associated with the
structure that allows warm water to rise (Arango et al. 2009). This very low-enthalpy
resource represents an interesting example in the sense that the freshwater aquifers are
imaged as moderate to high resistivity features, contrary to the more typical examples
where the saline geothermal fluids have low resistivity signature.
4.2 Groß Schonebeck Geothermal Test Site (Germany)
The Groß Schonebeck in situ geothermal laboratory, located 40 km north of Berlin in
northeastern Germany, is a key site for testing the geothermal potential of deep sedi-
mentary basins. The target reservoir is located in Lower Permian sandstones and volcanic
strata, which host deep aquifers throughout the Northeast German Basin (NEGB, Huenges
et al. 2007). The laboratory consists of two 4.3-km-deep boreholes forming a geothermal
Fig. 6 a Location map of the Llucmajor aquifer system. The black dots represent the position of MTstations and the red ellipse the area with thermal manifestations. b Three-dimensional electrical resistivitydistribution obtained from forward modelling by fitting the observed data through trial and error. Theshallow and deep aquifers correspond with moderate/high resistivity regions, whereas the confining aquitardcorresponds with low resistivity (Arango, pers. comm)
Surv Geophys (2014) 35:101–122 111
123

doublet system. The NEGB setting is typical for deep sedimentary basins and for low-
enthalpy reservoirs in general. MT data were collected along two profiles to obtain a
resistivity distribution of the Groß Schonebeck area (Munoz et al. 2010a). Figure 7 shows
the 2D resistivity model obtained from inversion of the MT data along the main profile. At
surface, Tertiary sediments are imaged as a moderately conductive layer (20–50 Xm),
overlying a low resistivity layer which presents an antiform shape and coincides with the
Mesozoic sedimentary sequences. At depth, two very low resistivity anomalies are
obtained, coinciding with the reservoir level. These conductive bodies occur below the
areas where the overlying evaporitic layer presents local lows, while only moderate
resistivities are observed beneath the salt upwelling. In this context, the authors speculate
that the reduced resistivity is associated with fracturing in brittle anhydrites, resulting in
enhanced hydraulic permeability. This interpretation is supported by a statistical joint
interpretation (Munoz et al. 2010b) of the MT data together with coincident seismic
tomography models (Bauer et al. 2010).
4.3 Puga Geothermal Area (India)
The Puga hot spring area, located to the south of the Indus Suture Zone in NW Himalaya, is
considered to be the most promising geothermal field in India. The area exposes Pre-
cambrian metamorphic rocks interlayered with bands of limestone and alluvium sediments
on top and some younger granite intrusions of Tertiary age (Abdul Azeez and Harinara-
yana 2007). The high heat flow values obtained in thermal surveys have established the
existence of a thermal anomaly in the Puga valley with over 100 hot springs with tem-
peratures ranging from 35 to 84 �C and discharge rate up to 5 l/s (Shankar et al. 1976). An
MT survey with 35 stations was carried out to explore the geothermal potential of the area
(Harinarayana et al. 2004). Electrical resistivity cross-sections obtained from 2D inversion
of the MT data (Fig. 8) show a near-surface low resistive (10–30 Xm) zone of about
300–400 m thickness (A). The low resistive region, approximately 4 km in length, cor-
related well with the area marked by surface expressions of geothermal activity (Harin-
arayana et al. 2006). The authors explained the low resistivity of this layer by the varying
thickness of alluvium sediments saturated with hot water or a mixture of deep thermal
Fig. 7 Resistivity cross-section obtained from 2D inversion of MT data along a 40-km profile measured inthe vicinity of the Groß Schonebeck geothermal test site (Germany). Shallow sediments were imaged asmoderately resistive above a low resistivity layer with an antiform shape overlying a thick evaporiticsequence. Deep conductive anomalies associated with salt lows were interpreted as associated with highlyfractured anhydrite rich areas enhancing hydraulic permeability (after the model from Munoz et al. 2010a)
112 Surv Geophys (2014) 35:101–122
123

water and freshwater, as observed in shallow wells, and considered it to be the shallow
reservoir part of the geothermal field. No low resistivity structure was found west of the
Kiagor Tatso fault, which marks the western boundary of the surface thermal manifesta-
tions. Another prominent feature imaged in the resistivity model was an anomalous low
resistive structure (10–50 Xm) from approximately 2–8 km depth below the geothermal
manifestation and extending to the west (B). Underlying it, a 50 Xm lower crust was found
(C) (Abdul Azeez and Harinarayana 2007). The authors interpreted the low resistivity layer
as a porous region with hot fluids located at the top of the magmatic heat source repre-
sented by the deeper moderate resistivity feature.
5 EGS Monitoring Tools
The importance of enhanced geothermal systems (EGS) for the development of geothermal
energy is crucial (Tester et al. 2006). EM methods can provide important tools where
advancements in subsurface characterization are imperative to develop EGS into a com-
petitive industry. One significant complication in EGS development is estimating where
injected fluids flow in the subsurface. EM methods, being sensitive to electrical resistivity
contrast (between the low resistive injected fluids and the higher resistivity host rock), can
be used as a supplementary tool to delineate reservoir boundaries. Few publications deal
with application of EM methods for monitoring of temporal variations in subsurface
electrical resistivity associated with geothermal fluid movement (e.g., Bedrosian et al.
2004; Aizawa et al. 2011) but interest is certainly increasing. Peacock et al. (2012a, b)
present pioneering results from continuous MT measurements that show coherent changes
generated from a fluid injection pilot experiment for an EGS at Paralana, South Australia.
In July 2011, a volume of 3.1Ml of saline water (0.3 Xm) was pumped into the intended
reservoir at 3,680 m depth during 5 days. A star-shaped array of 30 MT stations (Fig. 9)
Fig. 8 a Location map of the Puga geothermal area and MT profile (red line). b Resistivity cross-sectionobtained from 2D inversion of the MT data for the first 1.6 km. A low resistivity area (A) appears east of theKiagor Tatso fault, in the region where thermal manifestations are present. c Resistivity cross-section downto a depth of 40 km. Two low resistivity regions (B and C) are imaged at greater depths. Modified fromAbdul Azeez and Harinarayana (2007)
Surv Geophys (2014) 35:101–122 113
123

was deployed before injection to measure a base line, and measurements were repeated
after the injection had been completed. The variations in MT parameters (apparent resis-
tivity, impedance phase and phase tensor parameters) were estimated by computing
residuals of pre- and post-injection values (Peacock et al. 2012a). Figure 9 shows phase
tensor determinant residuals of before and after fluids are introduced into the system for all
sites and various periods. Red colours indicate a change towards higher conductivities and
blue colours a change towards lower conductivities. A conductive anomaly located to the
right of the borehole observed at periods from 2 to 16 s was interpreted as a complex
reservoir evolution to the NE of the borehole, expanding in a NE preferred orientation
(Peacock et al. 2012a).
6 Misinterpretation of Electrical Resistivity Data in Geothermal Systems
Electromagnetic methods have proven to be very successful for delineating geothermal
systems, as reported in the previous sections, and have become industry standard for
exploration of geothermal resources. This success, however, has resulted sometimes in
careless and inaccurate interpretation based on the belief that electrical resistivity data can
be interpreted correlating one-to-one areas of low resistivity with presence of geothermal
fluids and/or conducting clay minerals produced by hydrothermal alteration. This explo-
ration approach, which some authors call ‘‘anomaly hunting’’, can lead to severe misin-
terpretations of electrical resistivity data.
While many known geothermal systems have a low resistivity signature, the converse is
not true; the existence of low resistivity zones in a geothermal area does not necessarily
imply an active hydrothermal systems. An alteration which produces the low resistivity of
the clay cap is unaffected by subsequent cooling, that is, even if the temperatures that
produced the alteration mineralogy do not prevail the clay cap still presents a low resis-
tivity signature. For instance, to the SE of the Hengill geothermal field in Iceland, the
resistivity structure derived from a TEM sounding revealed alteration mineralogy con-
sistent with drilled cores (Arnason and Magnusson 2001). A resistive core, which would be
indicative of temperatures above 240 �C within a hot geothermal system, was found as
Fig. 9 Map view of phase tensor determinant residuals pre- and post-injection at different periods. Blacktriangles represent the location of MT stations. The borehole is centred within the cross of black triangles.Red colours indicate a conductive change and blue a resistive change. The conductive anomaly NE of theborehole was interpreted as caused by fluid migration in a NE preferred direction (modified from Peacocket al. 2012b)
114 Surv Geophys (2014) 35:101–122
123

shallow as at 200 m depth, whereas the temperatures in the well were measured under
200 �C to a depth of 1,000 m. At the Krafla geothermal field, also in Iceland, Arnason et al.
(2000) report resistivity structures in agreement with alteration. However, a well drilled in
an area where the resistivity pattern was interpreted as indicating high temperature mea-
sured surprisingly cold temperatures below 100 �C between 700 and 1,400 m depth
(Mortensen 2009).
Moreover, the causes of low resistivity structures could be unrelated to a geothermal
system, even in an active geothermal area. Bibby et al. (2005) report on an exploratory well
drilled down to a depth of 593 m in the Matahana basin near the Horohoro geothermal field
in the TVZ of New Zealand in 1986. The well targeted the northern limit of a deep low
resistivity zone revealed by a DC Schlumberger array using AB/2 = 1,000 m. It was
postulated that this low resistivity zone represented a deep geothermal system from which
thermal fluids flowed laterally to reach the surface at the nearby Horohoro springs.
Temperatures at hole bottom reached a maximum of 80 �C, and no geothermal fluids were
found in the hole, indicating a non-geothermal origin of the low resistivity anomaly.
Subsequent regional resistivity mapping (Bibby 1988) indicated that this deeper low
resistivity anomaly could be part of a conductive layer with regional extent. Bibby et al.
(2005) interpreted this regional low resistivity layer as associated with old ignimbrites
([1 Ma). Petrological studies of these ignimbrites show that they contain low-temperature
hydrothermal alteration products (Allis 1987) which allow electric conduction along
crystalline interfaces and result in its characteristic low resistivity values.
Another example of a misinterpretation of a low resistivity anomaly in the context of a
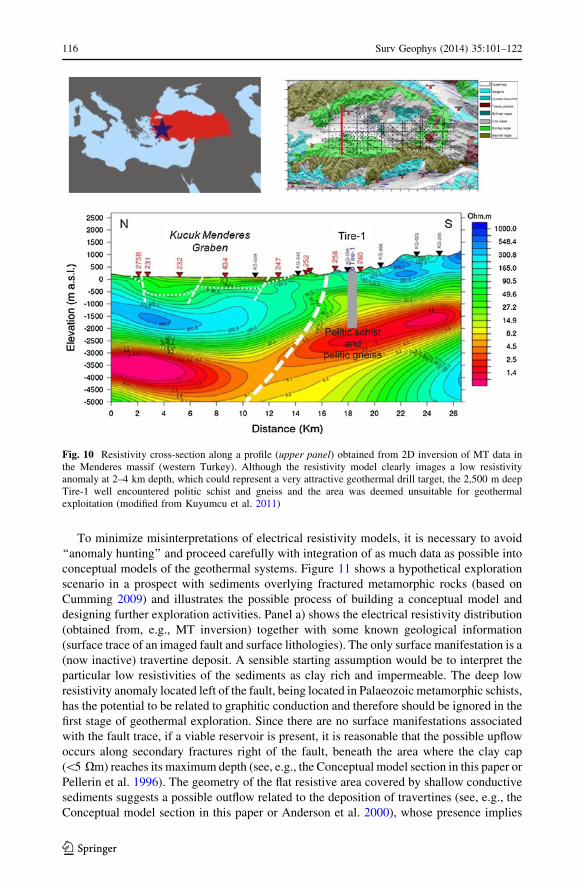
geothermal resource exploration in the Menderes massif can be found in Kuyumcu et al.
(2011). The Menderes massif is a major metamorphic complex in western Turkey with
geothermal potential. A three-dimensional resistivity model obtained from an extended MT
survey in the Tire area, over the central Menderes massif, reveals a widespread intra-
basement conductor dipping down to the north and to the west (Fig. 10). A striking low
resistivity anomaly like this might look appealing as a hot fluid geothermal target. A first
exploration well (Tire-1) was drilled down to a depth of 2,325 m, resulting in a temper-
ature of only 85 �C and a flow rate of 4 l/min. Rock samples collected from the well at
various depths were analyzed with X-ray diffraction revealing pelitic schist and gneiss
formations with significant graphite content. In this context, graphite was interpreted as the
most likely cause of the low resistivity in the basement. Kuyumcu et al. (2011) point out
that the region was already known to have shear zones, some with graphitic units, prior to
drilling the exploration well.
Three-dimensional MT inversion of a dataset collected in the Krafla volcanic complex
in northeastern Iceland (Gasperikova et al. 2011) revealed a highly resistive layer near the
surface, which was identified as unaltered basalt, covering a low resistivity cap corre-
sponding to the smectite-zeolite zone. Below this area, an increase in resistivity could
correspond to the chlorite-epidote zone. Although this resistivity distribution, correlated
with alteration mineralogy rather than lithology, pointed to a classical hydrothermal sys-
tem, and the high resistivity core seemed to be a suitable target for drilling, the Iceland
Deep Drilling Programme (IDDP) well at Krafla encountered magma at the depth of
2.1 km and drilling was stopped (Gasperikova et al. 2011). This does not represent a
misinterpretation of resistivity data in the same sense as the previous examples, but rather
illustrates the fact that MT is sensitive to large geological structures but not to individual
fractures, in this case filled with magma. Other studies in the same area (Einarsson 1978;
Mortensen et al. 2010) suggested possible shallow magma chambers in the region.
Surv Geophys (2014) 35:101–122 115
123
To minimize misinterpretations of electrical resistivity models, it is necessary to avoid
‘‘anomaly hunting’’ and proceed carefully with integration of as much data as possible into
conceptual models of the geothermal systems. Figure 11 shows a hypothetical exploration
scenario in a prospect with sediments overlying fractured metamorphic rocks (based on
Cumming 2009) and illustrates the possible process of building a conceptual model and
designing further exploration activities. Panel a) shows the electrical resistivity distribution
(obtained from, e.g., MT inversion) together with some known geological information
(surface trace of an imaged fault and surface lithologies). The only surface manifestation is a
(now inactive) travertine deposit. A sensible starting assumption would be to interpret the
particular low resistivities of the sediments as clay rich and impermeable. The deep low
resistivity anomaly located left of the fault, being located in Palaeozoic metamorphic schists,
has the potential to be related to graphitic conduction and therefore should be ignored in the
first stage of geothermal exploration. Since there are no surface manifestations associated
with the fault trace, if a viable reservoir is present, it is reasonable that the possible upflow
occurs along secondary fractures right of the fault, beneath the area where the clay cap
(\5 Xm) reaches its maximum depth (see, e.g., the Conceptual model section in this paper or
Pellerin et al. 1996). The geometry of the flat resistive area covered by shallow conductive
sediments suggests a possible outflow related to the deposition of travertines (see, e.g., the
Conceptual model section in this paper or Anderson et al. 2000), whose presence implies
Fig. 10 Resistivity cross-section along a profile (upper panel) obtained from 2D inversion of MT data inthe Menderes massif (western Turkey). Although the resistivity model clearly images a low resistivityanomaly at 2–4 km depth, which could represent a very attractive geothermal drill target, the 2,500 m deepTire-1 well encountered politic schist and gneiss and the area was deemed unsuitable for geothermalexploitation (modified from Kuyumcu et al. 2011)
116 Surv Geophys (2014) 35:101–122
123

exposure to a temperature of about 180 �C at some previous time. The inactivity of the
travertine deposit might be attributed to a drop in the water table (see, e.g., Cumming 2009).
Possible further exploration step could be a shallow (250 m) exploration well (well A in
Fig. 11b) to obtain water samples from the high resistivity outflow zone (aquifer) and a
shallow seismic survey to localize fractured regions. To continue this hypothetical scenario,
let us assume that the exploration well reveals silicified sandstones with a temperature of
100 �C at 250 m depth, with cation geothermometry of 200 �C at the well bottom and the
seismic image reveals several fractures nearby the mapped fault. Based on this data, a second
deeper well (well B in Fig. 11b) could be planned to be drilled directionally across as many
structures as possible in order to establish a complete conceptual model and as a potential
exploitation well. For more details on this exploration scenario see Cumming (2009).
7 Conclusions
EM exploration of geothermal zones provides a useful contribution to geothermal explo-
ration and exploitation. Given the nature of the geothermal reservoirs, both high-enthalpy
hydrothermal systems and non-volcanic systems, electrical resistivity is a key parameter
(perhaps the key parameter) for exploration and the development of conceptual models. In
hydrothermal systems, electrical resistivity is dominated by alteration mineralogy, which
can be used as a useful proxy for temperature and therefore constrain the properties of
geothermal systems. In non-volcanic reservoirs, saline geothermal fluids and their flow
paths (faults and fractures) can be imaged by EM methods. Knowing the conductivity of
the fluids, it is possible to establish sensible estimates of porosity and/or permeability of
the system, which are important reservoir parameters. EM exploration of geothermal
systems is mostly a story of success, but the relationship between low resistivity anomalies
and geothermal targets should not be carried too far (avoid anomaly hunting) to not avoid
interpretation pitfalls which can result in expensive drilling exercises. Development of
conceptual models, based on electrical resistivity data, but incorporating geological,
geochemical, temperature and/or other geophysical data becomes a necessity when it
comes to the ultimate goal of exploration: understand the system.
Fig. 11 a Results of a hypothetical electrical resistivity survey and some known geological features.b Possible conceptual model of the geothermal system. See text for details on the development of theconceptual model (redrawn after Cumming 2009)
Surv Geophys (2014) 35:101–122 117
123

Acknowledgments I would like to thank the Program Committee of the 21st Electromagnetic InductionWorkshop for giving me the opportunity to write this review paper. My attendance to the workshop wasfinanced by the project Brine (Grant Nr. 03G0758A/B) funded by the German Federal Ministry of Educationand Research. I also thank all authors who sent me their papers, manuscripts and conference contributions,which helped me a lot in writing this review paper, and I apologise for any omissions. This paper has beenimproved by the comments of my colleague Ute Weckmann, Knutur Arnason and an anonymous reviewer.
References
Abdul Azeez KK, Harinarayana T (2007) Magnetotelluric evidence of potential geothermal resource inPuga, Ladakh, NW Himalaya. Curr Sci 93:323–329
Abiye TA, Haile T (2008) Geophysical exploration of the Boku geothermal area, Central Ethiopian Rift.Geothermics 37:586–596
Aizawa K, Kanda W, Ogawa Y, Iguchi M, Yokoo A, Yakiwara H, Sugano T (2011) Temporal changes inelectrical resistivity at Sakurajima Volcano from continuous magnetotelluric observations. J VolcanolGeoth Res 199:165–175
Allis RG (1987) Geophysics and geochemical investigations of the Horohoro geothermal prospect. Report.213, Geophysics Division, DSIR, Wellington, pp 78
Anderson E, Crosby D, Ussher G (2000) Bulls-eye! Simple resistivity imaging to reliably locate thegeothermal reservoir. In: proceedings world geothermal congress, Kyushu-Tohoku, Japan, pp 909–914
Arango C, Marcuello A, Ledo J, Queralt P (2009) 3D magnetotelluric characterization of the geothermalanomaly in the Llucmajor aquifer system (Majorca, Spain). J Appl Geophys 68:479–488
Arnason K, Flovenz OG (1998) Geothermal exploration by TEM-soundings in the Central Asal Rift inDjibouti, East Africa. In: proceedings world geothermal congress, Florence, Italy, pp 933–938
Arnason K, Magnusson IÞ (2001) Geothermal Activity in Hengill and Hellisheiði. Results of ResistivitySurveys. Orkustofnun Report OS-2001/091, Reykjavik, Iceland, pp 250 (in Icelandic)
Arnason K, Karlsdottir R, Eysteinsson H, Flovenz OG, Guðlaugsson STh (2000) The resistivity structure ofhigh-temperature geothermal systems in Iceland. In: proceedings world geothermal congress, Tohoku-Kyushu, Japan, pp 923–928
Arnason K, Eysteinsson H, Hersir GP (2010) Joint 1D inversion of TEM and MT data and 3D inversion ofMT data in the Hengill area, SW Iceland. Geothermics 39:13–34
Asaue H, Koike K, Yoshinaga T, Takakura S (2005) Magnetotelluric resistivity modeling for 3D charac-terization of geothermal reservoirs in the Western side of Mt. Aso, SW Japan. J Appl Geophys58:296–312
Barbier E (2002) Geothermal energy technology and current status: an overview. Renew Sustain Energy Rev6:3–65
Bauer K, Moeck I, Norden B, Schulze A, Weber M, Wirth A (2010) Tomographic P-wave velocity andvertical velocity gradient structure across the geothermal site Groß Schonebeck (NE German Basin):relationship to lithology, salt tectonics, and thermal regime. Journal of geophysical Research 115, doi:10.1029/2009JB006895
Bedrosian PA, Weckmann U, Ritter O, Hammer CU, Hubert J, Jung A (2004) Electromagnetic monitoringof the Groß Schonebeck stimulation experiment. In: proceedings Jahrestagung der Deutschen Geo-physikalischen Gessellschaft, p 64, GFZ, Berlin
Benderitter Y, Cormy G (1990) Possible approach to geothermal research and relative costs. In: DicksonMH, Fanelli M (eds) Small geothermal resources: a guide to development and utilization. UNITAR,New York, pp 59–69
Bertani R (2010) Geothermal power generation in the world. 2005–2010 Update Report. In: proceedingsworld geothermal congress, Bali, Indonesia
Bertrand EA, Caldwell TG, Hill GJ, Wallin EL, Bennie SL, Cozens N, Onacha SA, Ryan GA, Walter C,Zaino A, Wameyo P (2012) Magnetotelluric imaging of upper-crustal convection plumes beneath theTaupo Volcanic Zone, New Zealand. Geophys Res Lett 39:L02304. doi:10.1029/2011GL050177
Bibby HM (1988) Electrical resistivity mapping in the Central Volcanic Region of New Zealand. NZ J GeolGeophys 31:259–274
Bibby HM, Caldwell TG, Davey FJ, Webb TH (1995) Geophysical evidence on the structure of the TaupoVolcanic Zone and its hydrothermal circulation. J Volcanol Geoth Res 68:29–58
Bibby HM, Caldwell TG, Risk GF (2002) Long offset tensor resistivity surveys of the Taupo Volcanic Zone,New Zealand. J Appl Geophys 49:17–32
118 Surv Geophys (2014) 35:101–122
123

Bibby HM, Risk GF, Caldwell TG, Bennie SL (2005) Misinterpretation of electrical resistivity data ingeothermal prospecting: a case study from the Taupo Volcanic Zone. In: proceedings world geothermalcongress, Antalya, Turkey
Bibby HM, Risk GF, Caldwell TG, Heise W (2009) Investigations of deep resistivity structures at the-Wairakei geothermal field. Geothermics 38:98–107
Bjornsson A, Hersir GP, Bjornsson G (1986) The Hengill high-temperature area, S.W. Iceland: regionalGeophysical Survey. Trans Geotherm Res Counc 10:205–210
Brogi A, Lazzarotto A, Liotta D, Ranalli G (2003) Extensional shear zones as imaged by reflection seismiclines: the Larderello geothermal field (central Italy). Tectonophysics 363:127–139
Bojadgieva K, Hristov V, Srebrov B, Harinarayana T, Veeraswamy K (2006) Temperature investigation inPolyanovo hydrothermal reservoir (SE Bulgaria). Bulg Geophys J 32:3–11
Burcak M, Kaya C, Riza Kılıc A, Akdogan N (2005) Exploration of the heat source and geothermalpossibilities of the Aksaray Region, Central Anatolia, Turkey. In: proceedings world geothemalcongress, Antalya, Turkey
Caldwell G, Pearson C, Zayadi H (1986) Resistivity of rocks in geothermal systems: a laboratory study. In:proceedings 8th NZ geothermal workshop, pp 227–231
Casini M, Ciuffi M, Fiordelisi A, Mazzotti A, Stucchi E (2010) Results of a 3D seismic survey at the Travale(Italy) test site. Geothermics 39:4–12
Cumming W (2009) Geothermal resource conceptual models using surface exploration data. In: proceed-ings, 34th workshop on geothermal reservoir engineering, Stanford University
Cumming W, Mackie R (2007) 3D MT resistivity imaging for geothermal resource assessment and envi-ronmental mitigation at the glass mountain KGRA, California. GRC Transactions 31:331–334
Cumming W, Mackie R (2010) Resistivity imaging of geothermal resources using 1D, 2D and 3D MTinversion and TDEM static shift correction illustrated by a glass mountain case history. In: proceedingsworld geothemal congress, Bali, Indonesia
Daud Y, Sudarman S, Ushijima K (2001) Imaging reservoir permeability of the Sibayak geothermal field,Indonesia using geophysical measurements. In: proceedings, 26th workshop on geothermal reservoirEngineering, Stanford University
Deer WA, Howie RA, Zussman J (1962) Rock-forming minerals, Vol 3 sheet silicates. Longmans, Greenand Co Ltd, London, p 270
Del Rosario R, Oanes AF (2010) Controlled source magnetotelluric survey of Mabini geothermal prospect,Mabini, Batangas, Philippines. In: proceedings world geothemal congress, Bali, Indonesia
Einarsson P (1978) S-wave shadows in the Krafla caldera in NE-Iceland, evidence for a magma chamber inthe crust. Bull Volcanol 41:187–195
Essene EJ, Peacor DR (1995) Clay mineral thermometry; a critical perspective. Clays Clay Miner43:540–553
Fiordelisi A, Mackie RL, Madden T, Manzella A, Rieven SA (1995) Application of the magnetotelluricmethod using a remote—remote reference system for characterizing deep geothermal system. In:proceedings world geothemal congress, Florence, Italy, pp 893–897
Fiordelisi A, Manzella A, Buonasorte G, Larsen JC, Mackie RL (2000) MT methodology in the detection ofdeep, water-dominated geothermal systems. In: proceedings world geothemal congress, Tohoku-Kyushu, Japan, pp 1121–1126
Garg SK, Pritchett JW, Combs J (2006) Characterization of geothermal reservoir conditions using electricalsurveys: some preliminary results. GRC Transactions 30:419–424
Garg SK, Pritchett JW, Wannamaker PE, Combs J (2007) Characterization of geothermal reservoirs withelectrical surveys: beowawe geothermal field. Geothermics 36:487–517
Gasperikova E, Newman G, Feucht D, Arnason K (2011) 3D MT characterization of two geothermal fieldsin Iceland. GRC Transactions 35:1667–1671
Geiermann J, Schill E (2010) 2-D magnetotellurics at the geothermal site at Soultz-Sous-Forets- resistivitydistribution to about 3000 M Depth. Comptes Rendus Geoscience. doi:10.1016/j.crte.2010.04.001
Harinarayana T, Abdul Azeez KK, Naganjaneyulu K, Manoj C, Veeraswamy K, Murthy DN, PrabhakarEknath Rao S (2004) Magnetotelluric studies in Puga valley geothermal field, NW Himalaya, Jammuand Kashmir, India. J Volcanol Geoth Res 138:405–424
Harinarayana T, Abdul Azeez KK, Murthy DN, Veeraswamy K, Eknath Rao SP, Manoj C, Naganjaneyulu K(2006) Exploration of geothermal structure in Puga geothermal field, Ladakh Himalayas, India bymagnetotelluric studies. J Appl Geophys 58:280–295
Heise W, Bibby HM, Caldwell TG, Bannister SC, Ogawa Y, Takakura S, Uchida T (2007) Melt distributionbeneath a young continental rift: the Taupo volcanic zone, New Zealand. Geophys Res Lett 34:L14313.doi:10.1029/2007GL029629
Surv Geophys (2014) 35:101–122 119
123
Heise W, Caldwell TG, Bibby HM, Bannister SC (2008) Three-dimensional modelling of magnetotelluricdata from the Rotokawa geothermal field, Taupo Volcanic Zone, New Zealand. Geophys J Int173:740–750. doi:10.1111/j.1365-246X.2008.03737.x
Hersir GP (1980) Electric and electromagnetic measurements across the Mid-Atlantic Ridge in SouthwestIceland, with special reference to the high temperature area of Hengill. M. Sc. Thesis. University ofAarhus, Denmark, pp 165
Huenges E, Moeck I, the geothermal group of the GFZ (2007) Directional drilling and stimulation of a deepsedimentary geothermal reservoir. Sci Drill 5:47–49
Kurilovitch L, Norman D, Heizler M, Moore J, McCulloch J (2003) 40Ar/39Ar Thermal History of the CosoGeothermal Field. In: proceedings, 28th workshop on geothermal reservoir engineering, StanfordUniversity
Kuyumcu OC, Destegul Solaroglu UZ, Hallinan S, Colpan B, Turkoglu E, Soyer W (2011) Interpretation of3D Magnetotelluric (MT) Surveys: basement conductors of the Menderes Massif, Western Turkey.GRC Transactions 35:861–866
Lagios E, Galanopoulos D, Hobbs BA, Dawes GJK (1998) Two-dimensional magnetotelluric modelling ofthe Kos Island geothermal region (Greece). Tectonophysics 287:157–172
Larsen J, Mackie R, Fiordelisi A, Manzella A, Rieven S (1995) Robust processing for removing train signalsfrom Magnetotelluric Data in Central Italy. In: proceedings world geothemal congress, Florence, Italy,pp 903–908
Lee TJ, Song Y, Uchida T (2007) Three-dimensional magnetotelluric surveys for geothermal developmentin Pohang, Korea. Explor Geophys 38:44–49
Manzella A, Spichak V, Pushkarev P, Sileva D, Oskooi B, Ruggieri G, Sizov Y (2006) Deep fluid circu-lation in the travale geothermal area and its Relation with Tectonic Structure Investigated by aMagnetotelluric Survey. In: proceedings, 31st workshop on geothermal reservoir engineering, StanfordUniversity
Manzella A, Ungarelli C, Ruggieri G, Giolito C, Fiordelisi A (2010) Electrical resistivity at the Travalegeothermal field (Italy). In: proceedings world geothemal congress, Bali, Indonesia
Marini L, Manzella A (2005) Possible seismic signature of the a–b quartz transition in the lithosphere ofSouthern Tuscany (Italy). J Volcanol Geoth Res 148:81–97
Meju MA (2002) Geoelectromagnetic exploration for natural resources: models, case studies and challenges.Surv Geophys 23:133–205
Monteiro Santos FA, Dupis A, Andrade Afonso AR, Mendes-Victor LA (1996) An audiomagnetotelluricsurvey over the Chaves geoth geothermal field (NE Portugal). Geothermics 25:389–406
Monteiro Santos FA, Andrade Afonso AR, Dupis A (2007) 2D joint inversion of DC and scalar audio-magnetotelluric data in the evaluation of low enthalpy geothermal fields. J Geophys Eng 4:53–62
Mortensen AK (ed), Guðmundsson A, Sigmundsson F, Axelsson G, Armannsson H, Bjornsson H, AgustssonK, Sæmundsson K, Olafsson M, Karlsdottir R, Halldorsdottir S, Hauksson T (2009) Krafla GeothermalSystem. A compilation of explorations and developments of the geothermal system and a reevaluationof the conceptual model. Landsvirkjun Report LV-2009/111 and ISOR, ISOR-2009/057, Reykjavik,Iceland, pp 180 (in Icelandic)
Mortensen AK, Gronvold K, Guðmundsson A, Steingrımsson B, Egilson T (2010) Quenched silicic glassfrom well K-39 in Krafla, North-Eastern Iceland. In: proceedings world geothermal congress, Bali,Indonesia
Muffler P, Cataldi R (1978) Methods for regional assessment of geothermal resources. Geothermics 7:53–89Mulyadi (2000) Magnetotelluric method applied for geothermal exploration in Sibayak, North Sumatra. In:
proceedings world geothemal congress, Tohoku-Kyushu, Japan, pp 1469–1472Munoz G, Ritter O, Moeck I (2010a) A target-oriented magnetotelluric inversion approach for character-
izing the low enthalpy Groß Schonebeck geothermal reservoir. Geophys J Int 183:1199–1215Munoz G, Bauer K, Moeck I, Schulze A, Ritter O (2010b) Exploring the Groß Schonebeck (Germany)
geothermal site using a statistical joint interpretation of magnetotelluric and seismic tomographymodels. Geothermics 39:35–45
Muraoka H, Uchida T, Sasada M, Yagi M, Akaku K, Sasaki M, Yasukawa K, Miyazaki S, Doi M, Saito S,Sato S, Tanakam S (1998) Deep geothermal resources survey program: igneous, metamorphic andhydrothermal processes in a well encountering 500 �C at 3729 m Depth, Kakkonda, Japan. Geother-mics 27:507–534
Mwangi AW (2012) Eburru Geothermal Prospect, Kenya —Joint 1D Inversion of MT and TEM Data. In:proceedings, 37th workshop on geothermal reservoir Engineering, Stanford University
Newman GA, Hoversten M, Gasperikova E, Wannamaker PE (2005) 3D magnetotelluric characterization ofthe Coso geothermal field. In: proceedings, 30th workshop on geothermal reservoir Engineering,Stanford University
120 Surv Geophys (2014) 35:101–122
123

Newman GA, Gasperikova E, Hoversten GM, Wannamaker PE (2008) Three-dimensional magnetotelluriccharacterization of the Coso geothermal field. Geothermics 37:369–399
Nurmukhamedov AG, Chernev II, Alekseev DA, Yakovlev AG (2010) 3D geoelectric model of the Mutnovsteam hydrothermal deposit. Phys Solid Earth 46:739–750
Ogawa Y, Bibby HM, Caldwell TG, Takakura S, Uchida T, Matsushima N, Bennie SL, Tosha T, Nishi Y(1999) Magnetotelluric image of the Taupo Volcanic Zone, New Zealand. Geophys Res Lett26:3673–3676
Ooskoi B, Manzella A (2011) 2D inversion of the Magnetotelluric data from Travale geothermal field inItaly. J Earth Space Phys 36:1–18
Oskooi B, Pedersen LB, Smirnov M, Arnason K, Eysteinsson H, Manzella A, the DGP Working Group(2005) The deep geothermal structure of the Mid-Atlantic Ridge deduced from MT data in SW Iceland.Phys Earth Planet Inter 150:183–195
Pastana de Lugao P, LaTerra EF, Kriegshauser B, Fontes SL (2002) Magnetotelluric studies of the CaldasNovas geothermal reservoir, Brazil. J Appl Geophys 49:33–46
Peacock JR, Thiel S, Reid P, Heinson G (2012a) Magnetotelluric monitoring of a fluid injection: Examplefrom an enhanced geothermal system. Geophysical Research Letters 39, doi:10.1029/2012GL053080
Peacock JR, Thiel S, Reid P, Messellier M, Heinson G (2012b) Monitoring enhanced geothermal fluids withmagnetotellurics, test case: Paralana, South Australia. In: proceedings, 37th workshop on geothermalreservoir Engineering, Stanford University
Pellerin L, Johnston JM, Hohmann GW (1996) A numerical evaluation of electromagnetic methods ingeothermal exploration. Geophysics 61:121–130
Raharjo IB, Maris V, Wannamaker PE, Chapman DS (2010) Resistivity Structures of Lahendong andKamojang geothermal systems revealed from 3-D Magnetotelluric Inversions, a Comparative Study.In: proceedings world geothemal congress, Bali, Indonesia
Risk GF, Caldwell TG, Bibby HM (2003) Tensor time-domain electromagnetic resistivity measurements atNgatamariki geothermal field, New Zealand. J Volcanol Geoth Res 127:33–54
Ritter O, Hoffmann-Rothe A, Bedrosian PA, Weckmann U, Haak V (2005) Electrical conductivity imagesof active and fossil fault zones. In: Bruhn D and Burlini L (eds), High Strain Zones: Structure andPhysical Properties, The Geological Society, pp 165–186
Romo JM, Flores C, Vega R, Vazquez R, Perez Flores MA, Gomez Trevino E, Esparza FJ, Quijano JE,Garcıa VH (1997) A closely-spaced magnetotelluric study of the Ahuachapan-Chipilapa geothermalfield, El Salvador. Geothermics 26:627–656
Rybach L (2010) Status and prospects of geothermal energy. In: proceedings world geothermal congress,Bali, Indonesia
Shankar R, Padhi RN, Prakash G, Thussu JL, Wangdus C (1976) Recent geological studies in upper Indusvalley and the plate tectonics. Geol Surv India, Misc Publ 34:41–56
Spichak V (2005) Three-dimensional resistivity structure of the Minamikayabe geothermal zone revealed byBayesian inversion of MT Data. In: proceedings world geothemal congress, Antalya, Turkey
Spichak V, Manzella A (2009) Electromagnetic sounding of geothermal zones. J Appl Geophys 68:459–478Spichak V, Schwartz Y, Nurmukhamedov AG (2007) Conceptual Model of the Mutnovsky Geothermal
Deposit (Kamchatka) Based on electromagnetic, gravity and magnetic data. In: Proceedings, EGMinternational workshop
Spichak V, Geiermann J, Zakharova O, Calcagno P, Genter A, Schill E (2010) Deep temperature extrap-olation in the Soultz-sous-Forets geothermal area using magnetotelluric data
Stagpoole VM, Bibby HM (1998) The shallow resistivity structure of the Taupo Volcanic Zone, NewZealand. In: Proceedings of the 20th N.Z. geothermal workshop, University of Auckland GeothermalInstitute, pp 303–310
Tester JW and the MIT geothermal panel (2006) The future of geothermal energy—impact of enhancedgeothermal systems (EGS) on the United States in the 21st Century, MIT—Massachusetts Institute ofTechnology, Cambridge, MA. p 358
Tulinius H, Þorbergsdottir IM, Adam L, Hu ZZ, Yu G (2010) Geothermal evaluation in Hungary usingintegrated interpretation of well, seismic, and MT data. In: proceedings world geothemal congress,Bali, Indonesia
Uchida T (1995) Resistivity structure of Sumikawa geothermal field, northeastern Japan, obtained frommagnetotelluric data. In: proceedings world geothemal congress, Florence, Italy, pp 921–925
Uchida T (2005) Three-dimensional magnetotelluric investigation in geothermal fields in Japan and Indo-nesia. In: proceedings world geothemal congress, Antalya, Turkey
Uchida T, Ogawa Y, Takakura S, Mitsuhata Y (2000) Geoelectrical investigation of the kakkonda geo-thermal field, Northern Japan. In: proceedings world geothemal congress, Tohoku-Kyushu, Japan,pp 1893–1898
Surv Geophys (2014) 35:101–122 121
123
Uchida T, Lee TJ, Honda M, Andan A (2002) 2-D and 3-D interpretation of magnetotelluric data in theBajawa geothermal field, central Flores, Indonesia. Bull Geol Surv Japan 53:265–283
Uchida T, Song T, Lee TJ, Mitsuhata Y, Lee SK, Lim SK (2004) 3D magnetotelluric interpretation inPohang low-enthalpy geothermal area, Korea. In: proceedings 17th electromagnetic induction work-shop, Hyderabad, India
Uchida T, Song Y, Lee TJ, Mitsuhata Y, Lee SK, Lim SK (2005) Magnetotelluric survey in an extremelynoisy environment at the pohang low-enthalpy geothermal area, Korea. In: proceedings world geo-thermal congress, Antalya, Turkey
Uchida T, Takakura S, Ueda T, Adachi M, Ozeki M, Kamada K, Sato T (2010) 3D magnetotelluric survey atthe Yanaizu-Nishiyama geothermal field, Northern Japan. In: Proceedings of the 9th Asian GeothermalSymposium, pp 26–31
Ucok H, Ershaghi I, Olhoeft G (1980) Electrical resistivity of geothermal brines. J Petrol Technol32:717–727
Ussher G, Harvey C, Johnstone R, Anderson E (2000) Understanding the resistivities observed in geo-thermal systems. In: proceedings world geothermal congress, Kyushu-Tohoku, Japan, pp 1915–1920
Volpi G, Manzella A, Fiordelisi A (2003) Investigation of geothermal structures by magnetotellurics (MT):an example from the Mt. Amiata area, Italy. Geothermics 32:131–145
Wannamaker PE (1997a) CSAMT survey over the sulphur springs thermal area, Valles Caldera, NewMexico, USA, Part I: implications for structure of the western caldera. Geophysics 62:451–465
Wannamaker PE (1997b) Tensor CSAMT survey over the sulphur springs thermal area, Valles Caldera,New Mexico, USA, Part II: implications for CSAMT methodology. Geophysics 62:466–476
Wannamaker PE, Rose PE, Doerner WM, Berard BC, McCulloch J, Nurse K (2004) Magnetotelluricsurveying and monitoring at the Coso geothermal area, California, in support of the enhanced geo-thermal systems concept: survey parameters and initial results. In: proceedings, 29th workshop ongeothermal reservoir Engineering, Stanford University
Wannamaker PE, Doerner WM, Hasterok DP (2007) Integrated dense array and transect MT surveying atdixie valley geothermal area, Nevada; structural controls, hydrothermal alteration and deep fluidsources. In: proceedings, 32th workshop on geothermal reservoir Engineering, Stanford University
Wright PM, Ward SH, Ross HP, West RC (1985) State of the art geophysical exploration for geothermalresources. Geophysics 50:2666–2696
Yamane K, Ohsato K, Ohminato T, Kim HJ (2000) Three-dimensional magnetotelluric investigation inKakkonda geothermal area, Japan. In: proceedings world geothemal congress, Tohoku-Kyushu, Japan,pp 1965–1968
Yu G, Strack K, Tulinius H, Þorbergsottir IM Adam L, Hu ZZ, He ZX (2010) Integrated MT/Gravitygeothermal exploration in Hungary: A success story. 21 ASEG Conference and Exhibition, Sydney
122 Surv Geophys (2014) 35:101–122
123