exploring illusions of height in suit design
TRANSCRIPT
University of Kentucky University of Kentucky
UKnowledge UKnowledge
Theses and Dissertations--Psychology Psychology
2018
EXPLORING ILLUSIONS OF HEIGHT IN SUIT DESIGN EXPLORING ILLUSIONS OF HEIGHT IN SUIT DESIGN
Michael P. Lee University of Kentucky, [email protected] Digital Object Identifier: https://doi.org/10.13023/ETD.2018.158
Right click to open a feedback form in a new tab to let us know how this document benefits you. Right click to open a feedback form in a new tab to let us know how this document benefits you.
Recommended Citation Recommended Citation Lee, Michael P., "EXPLORING ILLUSIONS OF HEIGHT IN SUIT DESIGN" (2018). Theses and Dissertations--Psychology. 134. https://uknowledge.uky.edu/psychology_etds/134
This Doctoral Dissertation is brought to you for free and open access by the Psychology at UKnowledge. It has been accepted for inclusion in Theses and Dissertations--Psychology by an authorized administrator of UKnowledge. For more information, please contact [email protected].
STUDENT AGREEMENT: STUDENT AGREEMENT:
I represent that my thesis or dissertation and abstract are my original work. Proper attribution
has been given to all outside sources. I understand that I am solely responsible for obtaining
any needed copyright permissions. I have obtained needed written permission statement(s)
from the owner(s) of each third-party copyrighted matter to be included in my work, allowing
electronic distribution (if such use is not permitted by the fair use doctrine) which will be
submitted to UKnowledge as Additional File.
I hereby grant to The University of Kentucky and its agents the irrevocable, non-exclusive, and
royalty-free license to archive and make accessible my work in whole or in part in all forms of
media, now or hereafter known. I agree that the document mentioned above may be made
available immediately for worldwide access unless an embargo applies.
I retain all other ownership rights to the copyright of my work. I also retain the right to use in
future works (such as articles or books) all or part of my work. I understand that I am free to
register the copyright to my work.
REVIEW, APPROVAL AND ACCEPTANCE REVIEW, APPROVAL AND ACCEPTANCE
The document mentioned above has been reviewed and accepted by the student’s advisor, on
behalf of the advisory committee, and by the Director of Graduate Studies (DGS), on behalf of
the program; we verify that this is the final, approved version of the student’s thesis including all
changes required by the advisory committee. The undersigned agree to abide by the statements
above.
Michael P. Lee, Student
Dr. C. Melody Carswell, Major Professor
Dr. Mark Fillmore, Director of Graduate Studies
EXPLORING ILLUSIONS OF HEIGHT IN SUIT DESIGN
DISSERTATION
A dissertation submitted in partial fulfillment of the
requirements for the degree of Doctor of Philosophy in the
College of Arts and Sciences at the University of Kentucky
By
Michael Patrick Lee
Lexington, Kentucky
Director: Dr. C. Melody Carswell, Professor of Psychology
Lexington, Kentucky
2018
Copyright © Michael Patrick Lee 2018
i
ABSTRACT OF DISSERTATION
EXPLORING ILLUSIONS OF HEIGHT IN SUIT DESIGN
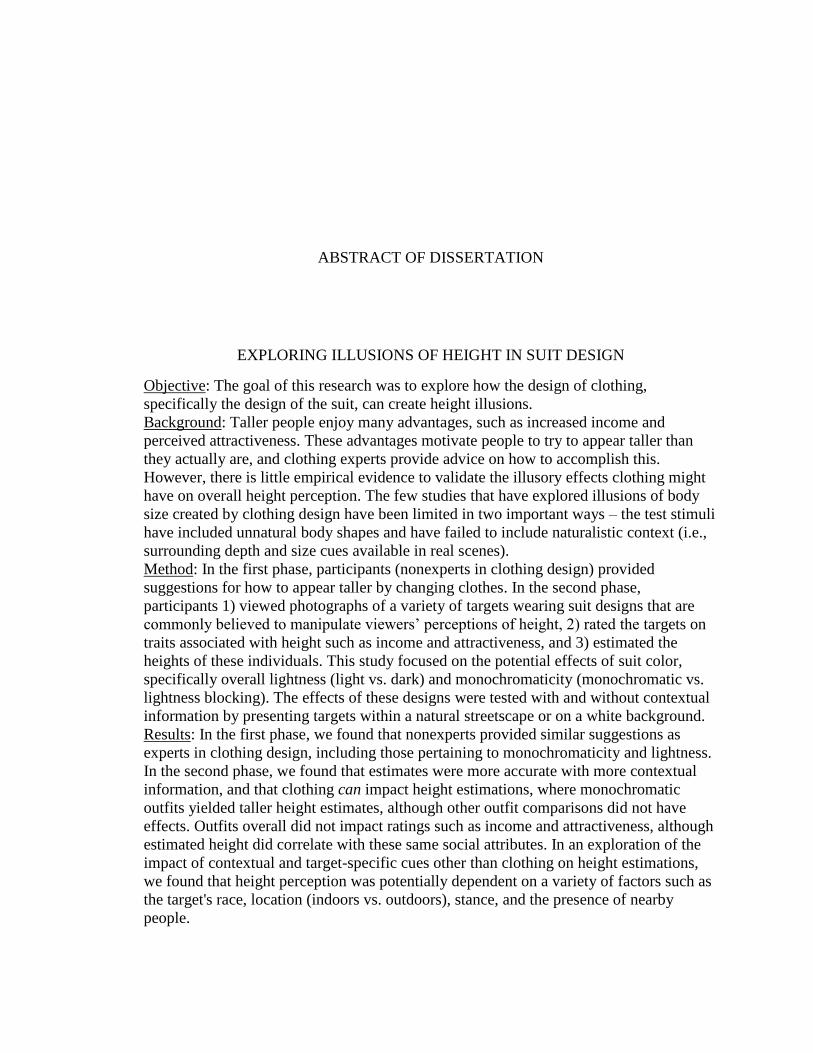
Objective: The goal of this research was to explore how the design of clothing,
specifically the design of the suit, can create height illusions.
Background: Taller people enjoy many advantages, such as increased income and
perceived attractiveness. These advantages motivate people to try to appear taller than
they actually are, and clothing experts provide advice on how to accomplish this.
However, there is little empirical evidence to validate the illusory effects clothing might
have on overall height perception. The few studies that have explored illusions of body
size created by clothing design have been limited in two important ways – the test stimuli
have included unnatural body shapes and have failed to include naturalistic context (i.e.,
surrounding depth and size cues available in real scenes).
Method: In the first phase, participants (nonexperts in clothing design) provided
suggestions for how to appear taller by changing clothes. In the second phase,
participants 1) viewed photographs of a variety of targets wearing suit designs that are
commonly believed to manipulate viewers’ perceptions of height, 2) rated the targets on
traits associated with height such as income and attractiveness, and 3) estimated the
heights of these individuals. This study focused on the potential effects of suit color,
specifically overall lightness (light vs. dark) and monochromaticity (monochromatic vs.
lightness blocking). The effects of these designs were tested with and without contextual
information by presenting targets within a natural streetscape or on a white background.
Results: In the first phase, we found that nonexperts provided similar suggestions as
experts in clothing design, including those pertaining to monochromaticity and lightness.
In the second phase, we found that estimates were more accurate with more contextual
information, and that clothing can impact height estimations, where monochromatic
outfits yielded taller height estimates, although other outfit comparisons did not have
effects. Outfits overall did not impact ratings such as income and attractiveness, although
estimated height did correlate with these same social attributes. In an exploration of the
impact of contextual and target-specific cues other than clothing on height estimations,
we found that height perception was potentially dependent on a variety of factors such as
the target's race, location (indoors vs. outdoors), stance, and the presence of nearby
people.
ii
Scientific merit: This study increased our understanding of the conditions under which
illusions of size in simple geometric stimuli generalize to the manipulation of size
perception in real-world scenes.
Broader impact: A better understanding of biases in height perception is relevant to
domains in which such estimates are used to identify individuals (e.g., criminal justice) as
well as domains in which visual characteristics of individuals are associated with errors
in judgments of performance-based merit. (e.g., personnel selection and promotion).
KEYWORDS: illusions, clothing design, height perception, psychophysical estimation,
social perception
Michael Patrick Lee
4/16/2018
Date
iii
EXPLORING ILLUSIONS OF HEIGHT IN SUIT DESIGN
By
Michael Patrick Lee
Dr. C. Melody Carswell
Director of Dissertation
Dr. Mark Fillmore
Director of Graduate Studies
4/16/2018
Date
iv
This dissertation is dedicated to Janet Faraci Lee, D.M.D.
v
Acknowledgments
The following dissertation, while an individual work, benefited from the insights
and direction of several people. First, my Dissertation Chair, C. Melody Carswell,
exemplifies the high-quality scholarship to which I aspire. Next, I wish to thank the
complete Dissertation Committee, and outside reader, respectively: Ramesh Bhatt,
Christia Spears Brown, Kimberly Miller-Spillman, and Adam Craig. Each individual
provided insights that guided and challenged my thinking, substantially improving the
finished product. In addition to the technical and instrumental assistance above, I
received equally important assistance from family and friends. My lab mates, Michelle
Sublette and Travis Kent, provided on-going support throughout the dissertation process,
as well as technical assistance critical for completing the project.
I would also acknowledge the podcast content creators and the communities
around them which have provided much joy and support, especially, but not exclusively,
John, Jesse, Jordan, Justin, Travis, Griffin, Jimmy, Matt, Eliot, Garon, Scott, Paul,
Lauren, Matt, Marc, Jeremy, Adam, Andy, Dave, Graham, Dan, Stuart, Elliot, Renee,
Allegra, Nick, Mike, Chris, Karen, Arnie, Matt, Jess, Zach, Linda, Stephen, Glen, Guy,
Karen, Wynter, Margaret, John, Sydnee, Rachel, Clint, Helen, Roman, Maria, Amanda,
Janet, Nilay, Dieter, Paul, Lauren, Kara, Ben, Ben, Paget, Marc, Mark, Hal, Jessica,
Lennon, Howard, Kulap, Ricky, Andrea, Doug, David, Kyle, and Tig.
iii
vi
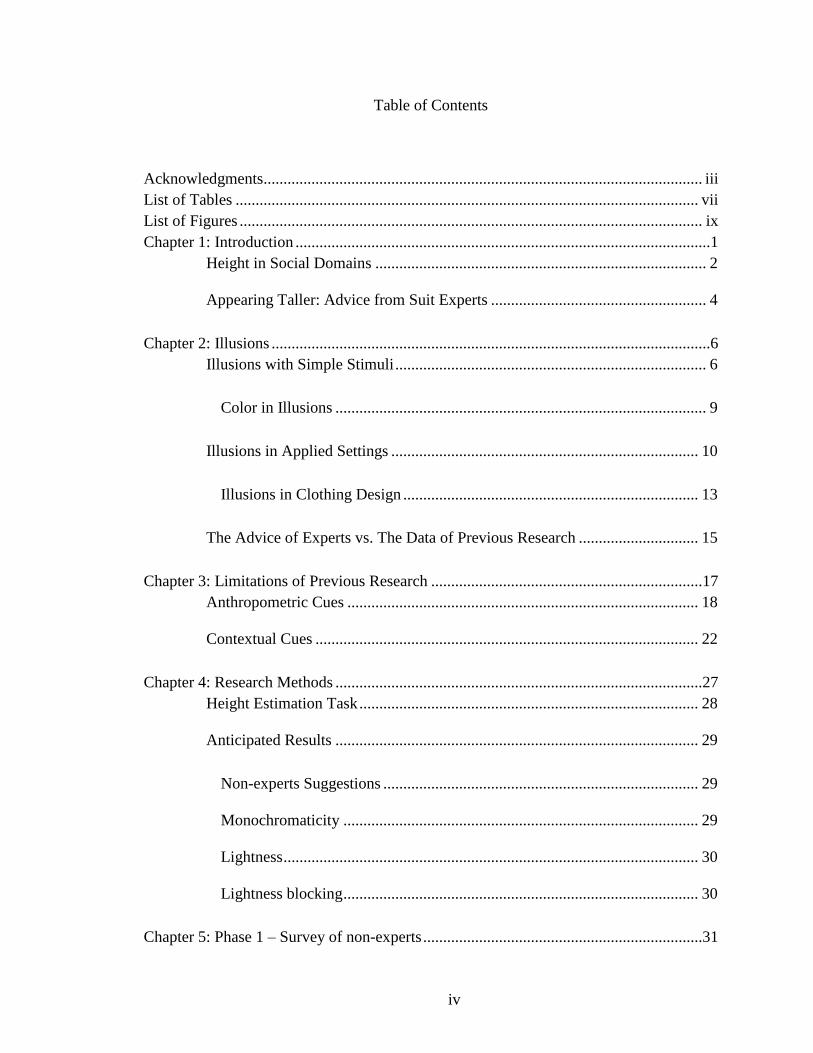
Table of Contents
Acknowledgments.............................................................................................................. iii
List of Tables .................................................................................................................... vii
List of Figures .................................................................................................................... ix
Chapter 1: Introduction ........................................................................................................1
Height in Social Domains ................................................................................... 2
Appearing Taller: Advice from Suit Experts ...................................................... 4
Chapter 2: Illusions ..............................................................................................................6
Illusions with Simple Stimuli .............................................................................. 6
Color in Illusions ............................................................................................. 9
Illusions in Applied Settings ............................................................................. 10
Illusions in Clothing Design .......................................................................... 13
The Advice of Experts vs. The Data of Previous Research .............................. 15
Chapter 3: Limitations of Previous Research ....................................................................17
Anthropometric Cues ........................................................................................ 18
Contextual Cues ................................................................................................ 22
Chapter 4: Research Methods ............................................................................................27
Height Estimation Task ..................................................................................... 28
Anticipated Results ........................................................................................... 29
Non-experts Suggestions ............................................................................... 29
Monochromaticity ......................................................................................... 29
Lightness ........................................................................................................ 30
Lightness blocking ......................................................................................... 30
Chapter 5: Phase 1 – Survey of non-experts ......................................................................31
iv
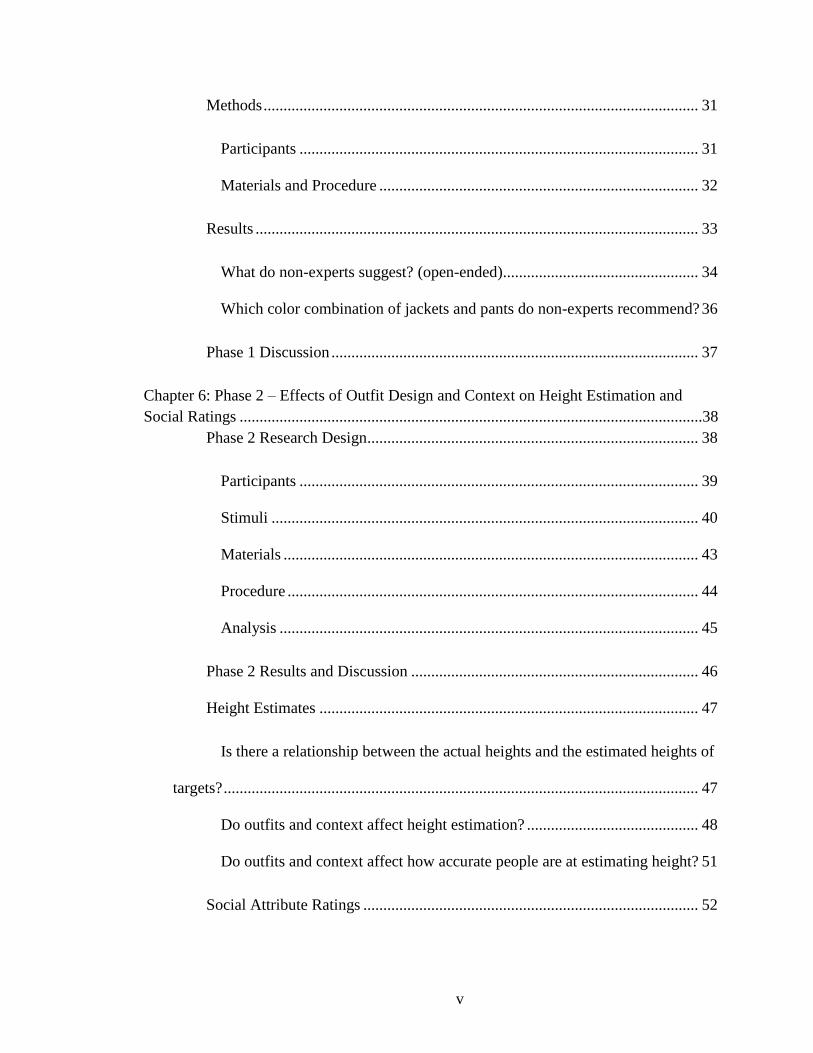
vii
Methods ............................................................................................................. 31
Participants .................................................................................................... 31
Materials and Procedure ................................................................................ 32
Results ............................................................................................................... 33
What do non-experts suggest? (open-ended)................................................. 34
Which color combination of jackets and pants do non-experts recommend? 36
Phase 1 Discussion ............................................................................................ 37
Chapter 6: Phase 2 – Effects of Outfit Design and Context on Height Estimation and
Social Ratings ....................................................................................................................38
Phase 2 Research Design................................................................................... 38
Participants .................................................................................................... 39
Stimuli ........................................................................................................... 40
Materials ........................................................................................................ 43
Procedure ....................................................................................................... 44
Analysis ......................................................................................................... 45
Phase 2 Results and Discussion ........................................................................ 46
Height Estimates ............................................................................................... 47
Is there a relationship between the actual heights and the estimated heights of
targets? ....................................................................................................................... 47
Do outfits and context affect height estimation? ........................................... 48
Do outfits and context affect how accurate people are at estimating height? 51
Social Attribute Ratings .................................................................................... 52
v
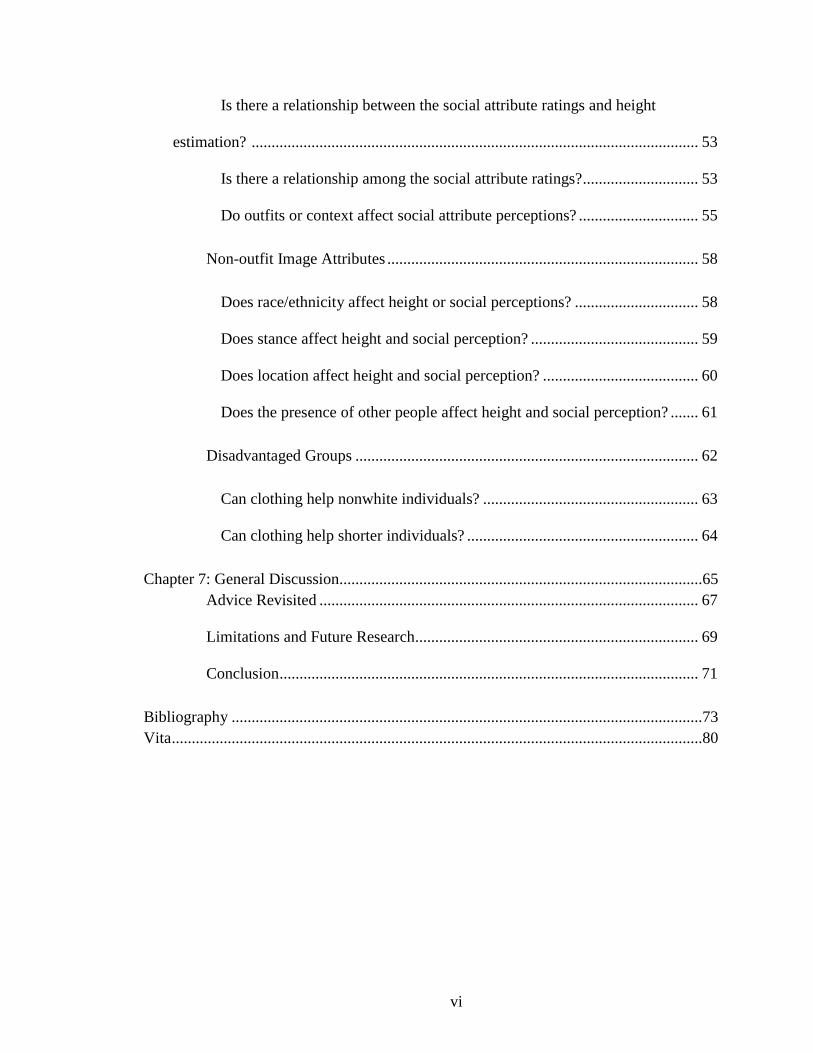
viii
Is there a relationship between the social attribute ratings and height
estimation? ................................................................................................................ 53
Is there a relationship among the social attribute ratings? ............................. 53
Do outfits or context affect social attribute perceptions? .............................. 55
Non-outfit Image Attributes .............................................................................. 58
Does race/ethnicity affect height or social perceptions? ............................... 58
Does stance affect height and social perception? .......................................... 59
Does location affect height and social perception? ....................................... 60
Does the presence of other people affect height and social perception? ....... 61
Disadvantaged Groups ...................................................................................... 62
Can clothing help nonwhite individuals? ...................................................... 63
Can clothing help shorter individuals? .......................................................... 64
Chapter 7: General Discussion...........................................................................................65
Advice Revisited ............................................................................................... 67
Limitations and Future Research....................................................................... 69
Conclusion ......................................................................................................... 71
Bibliography ......................................................................................................................73
Vita .....................................................................................................................................80
vi
ix
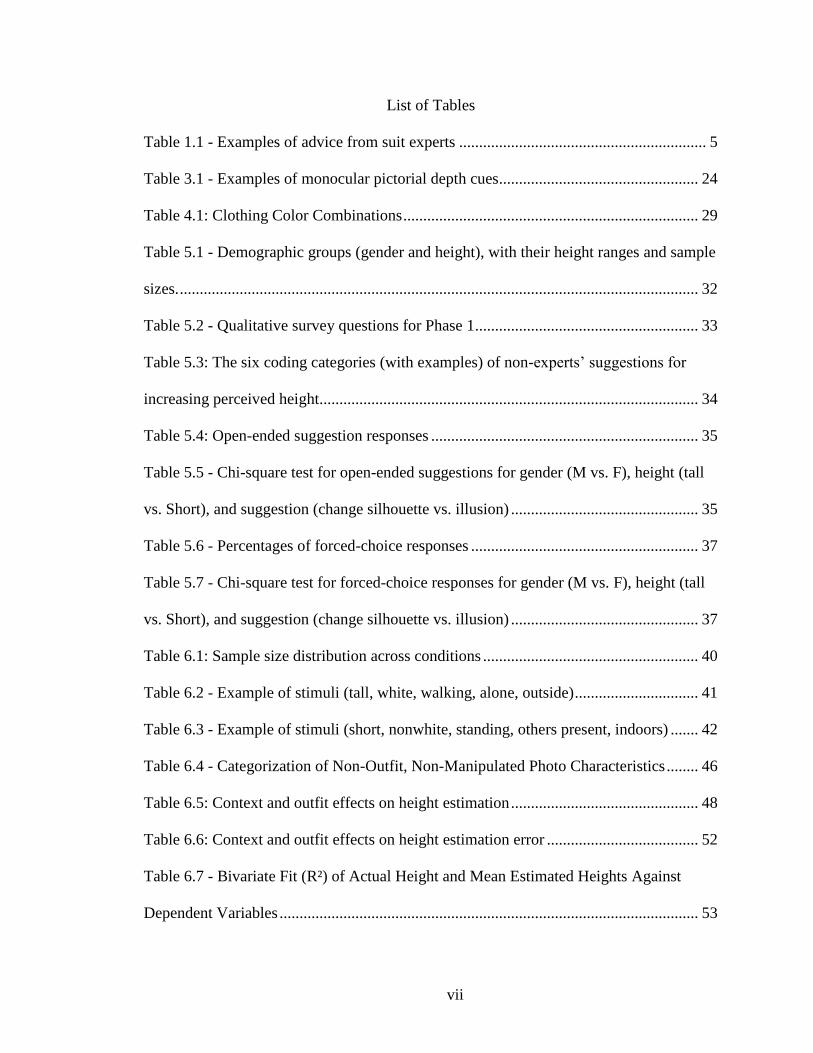
List of Tables
Table 1.1 - Examples of advice from suit experts .............................................................. 5
Table 3.1 - Examples of monocular pictorial depth cues.................................................. 24
Table 4.1: Clothing Color Combinations .......................................................................... 29
Table 5.1 - Demographic groups (gender and height), with their height ranges and sample
sizes. .................................................................................................................................. 32
Table 5.2 - Qualitative survey questions for Phase 1 ........................................................ 33
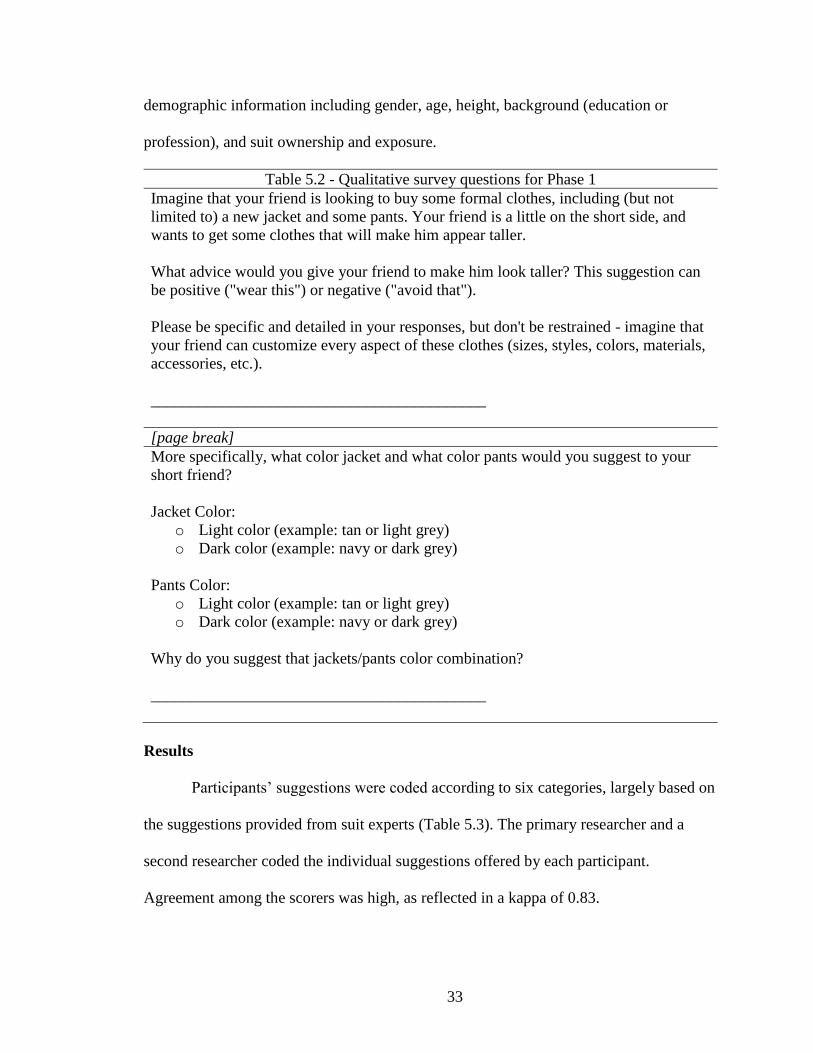
Table 5.3: The six coding categories (with examples) of non-experts’ suggestions for
increasing perceived height............................................................................................... 34
Table 5.4: Open-ended suggestion responses ................................................................... 35
Table 5.5 - Chi-square test for open-ended suggestions for gender (M vs. F), height (tall
vs. Short), and suggestion (change silhouette vs. illusion) ............................................... 35
Table 5.6 - Percentages of forced-choice responses ......................................................... 37
Table 5.7 - Chi-square test for forced-choice responses for gender (M vs. F), height (tall
vs. Short), and suggestion (change silhouette vs. illusion) ............................................... 37
Table 6.1: Sample size distribution across conditions ...................................................... 40
Table 6.2 - Example of stimuli (tall, white, walking, alone, outside) ............................... 41
Table 6.3 - Example of stimuli (short, nonwhite, standing, others present, indoors) ....... 42
Table 6.4 - Categorization of Non-Outfit, Non-Manipulated Photo Characteristics ........ 46
Table 6.5: Context and outfit effects on height estimation ............................................... 48
Table 6.6: Context and outfit effects on height estimation error ...................................... 52
Table 6.7 - Bivariate Fit (R²) of Actual Height and Mean Estimated Heights Against
Dependent Variables ......................................................................................................... 53
vii
x
Table 6.8 - Table of Correlations (r) for Social Attribute Ratings .................................... 54
Table 6.9 - Rotated Factor Loading .................................................................................. 55
Table 6.10 - Bivariate Fit (R²) of Actual Height and Estimated Heights Against
Dependent Variables ......................................................................................................... 55
Table 6.11 - Statistics for Context and Outfit Effects on Social Attribute Ratings .......... 56
Table 6.12 - Height Estimation and Social Attribute Ratings by Race/Ethnicity ............. 59
Table 6.13 – Effect of Race/Ethnicity on Height Estimation and Social Attribute Ratings
........................................................................................................................................... 59
Table 6.14 - Height Estimation and Social Attribute Ratings by Stance .......................... 60
Table 6.15 – Effect of Stance on Height Estimation and Social Attribute Ratings .......... 60
Table 6.16 - Height Estimations and Social Attribute Ratings by Location ..................... 61
Table 6.17 – Effect of Location on Height Estimation and Social Attribute Ratings ...... 61
Table 6.18 - Height Estimation and Social Attribute Ratings by Presence of Others ...... 62
Table 6.19 – Effect of Presence of Others on Height Estimation and Social Attribute
Ratings .............................................................................................................................. 62
Table 6.20 – Effect of Outfit Height Estimation and Social Attribute Ratings for
Nonwhite targets ............................................................................................................... 63
Table 6.21 – Descriptive statistics (Mean and Standard Error) for Nonwhite targets by
Outfit ................................................................................................................................. 64
Table 6.22 – Effect of Outfit on Height Estimation and Social Attribute Ratings for
Shorter targets ................................................................................................................... 64
Table 6.23 – Descriptive statistics (Mean and Standard Error) for Shorter targets by
Outfit ................................................................................................................................. 64
viii
xi
List of Figures
Figure 1.1 - Robotic telepresence system used in Rae et al. (2013) ................................... 3
Figure 1.2 - Pant breaks ...................................................................................................... 6
Figure 2.1 - Müller-Lyer illusion ........................................................................................ 7
Figure 2.2 – Inverted-T illusion .......................................................................................... 8
Figure 2.3 – Helmholtz illusion .......................................................................................... 9
Figure 2.4 - Oppel-Kundt illusion ....................................................................................... 9
Figure 2.5 – Wundt illusion .............................................................................................. 11
Figure 2.6 – Poggendorf illusion ...................................................................................... 12
Figure 2.7 - Helmholtz illusion in clothing patterns (Ashida et al., 2013) ....................... 14
Figure 2.8 - Müller-Lyer illusion in swimsuit design (Morikawa, 2003) ......................... 15
Figure 3.1 – Anthropometric cues and contextual cues .................................................... 17
Figure 3.2 - Body structure proportions through development ......................................... 20
Figure 3.3 - Demonstration of textures in ecological perception ...................................... 23
Figure 3.4 - Size constancy and distance perception in the Ponzo illusion ...................... 25
Figure 3.5 - Visual cues influencing height and status perception (Marsh et al., 2009) ... 26
Figure 3.6 – Background manipulation in height-contrast illusions (Ludwig & Pollet,
2014) ................................................................................................................................. 26
Figure 5.1: Forced-choice responses ................................................................................. 36
Figure 6.1 - Scales for social attribute ratings for Phase 2 ............................................... 43
Figure 6.2 - Example height estimation question (with target) ........................................ 44
Figure 6.3: Height estimation results for context and outfit ............................................. 49
Figure 6.4: Height estimation results for monochromaticity of outfits ............................ 50
ix
xii
Figure 6.5: Height estimation error results for context and outfit .................................... 52
Figure 6.6: Factor analysis plots ....................................................................................... 54
Figure 6.7 - Aesthetic social attribute ratings (attractiveness and style) by outfit and
condition ........................................................................................................................... 57
Figure 6.8 - Dominance social attribute ratings (income, leadership, and status) by outfit
and condition ..................................................................................................................... 57
x
1
Exploring Illusions of Height in Suit Design
Chapter 1: Introduction
Taller people earn more money. Research suggests people who are 72 inches tall
will earn $166,000 more over the course of a 30-year career than their peers who are
seven inches shorter (Judge & Cable, 2004). Height has other associated benefits, such as
increases in perceived attractiveness and leadership abilities. While altering physical
height is easy, what if it were possible to create the illusion of greater height? With the
suit being the historical epitome of formal businesswear (Reilly & Cosbey, 2008), it is
not surprising that suit designers often suggest ways to create the illusion of increased
height. These suggestions include manipulation of such features as the addition of
vertical elements (e.g., adding pinstripes) and eliminating horizontal elements (e.g.,
avoiding clear color differentiation among suit components). Although people
disseminate these “rules of thumb” widely, there is little evidence to support claims that
they influence height perception. The purpose of this dissertation is to test the effects of
such design manipulations on actual height perception.
This dissertation is grounded in the multidisciplinary traditions of human factors
psychology and user-centered design; it will draw from a variety of research approaches
and application domains. After a review of some domains where height perception is
particularly relevant, we will discuss common suggestions from suit experts whose intent
is to help clients appear taller. We will then review common visual illusions that might
plausibly explain purported height-enhancing effects. Although it has been tempting for
designers to apply illusions from isolated research labs directly to size perception
problems in domains as diverse as traffic safety, aviation safety, interior design, and
fashion design, we will discuss the challenges involved in this translation of research
2
from the lab to the field. For example, existing research applying well-known illusions to
clothing design are limited in two important ways. First, there are important constraints in
natural body shape variations that may provide inherent cues about height that may, in
turn, constrain the impact superficial suit design elements can have on appearance of
height. Second, people are usually viewed as part of complex scenes that provide many
additional cues of distance and comparative size that can also constrain the apparent
height of individuals. Based on this critical review of the literature, we will demonstrate
methods for assessing the presence and magnitude of clothing-induced size illusions that
can be used to explore not only the specific design heuristics tested here but should also
prove useful in evaluating many other well-entrenched rules of clothing design.
Height in Social Domains
Social science researchers have often explored the implications of being tall.
Domains such as business and politics frequently seem to be the focus of such research,
and suits are often the normative attire in both domains. Increased height can lead to
increases in income over time (Judge & Cable, 2004), perhaps because the rate at which
someone receives promotions is positively correlated with height (Melamed &
Bozionelos, 1992). These promotions, in turn, could stem from the fact that taller people
are often attributed with positive traits such as better leadership abilities (Re et al., 2012)
and increased attractiveness (Pierce, 1996). Such positive trait associations could also
drive the findings that taller presidential candidates have received more popular votes,
although they were not significantly more likely to win the actual election (Stulp, Buunk,
Verhulst, & Pollet, 2013).
3
Factors other than actual physical height affect perceived height and associated
social attributes. For example, nonverbal cues such as posture have been shown to
influence perceptions of height along with perceptions of dominance (Marsh, Yu,
Schechter, & Blair, 2009). Contrast illusions (i.e., comparisons to taller or shorter people)
have also been found to influence perceptions of height and associated social perceptions
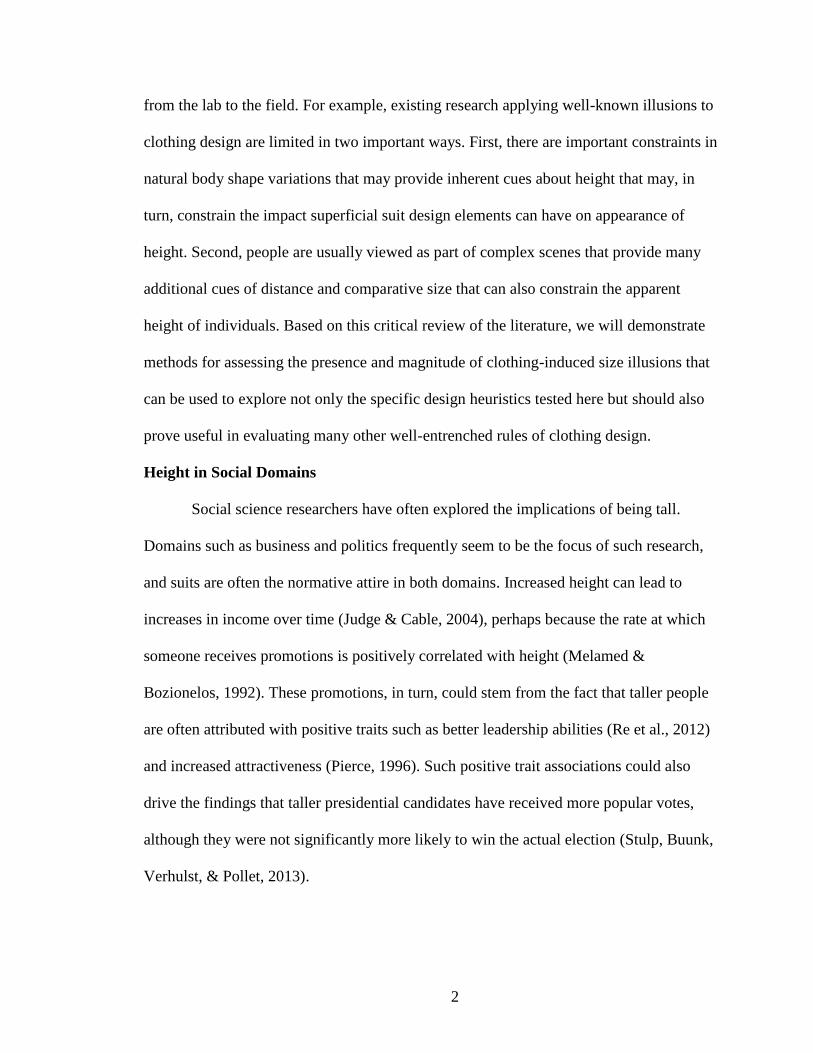
such as attractiveness and dominance (Ludwig & Pollet, 2014). Perceived dominance can
even be affected by the height of a robotic telepresence system, (Rae, Takayama, &
Mutlu, 2013). For example, if the user controlling the robot is in a leadership position
over the user viewing the robot, the leader will be perceived as less persuasive the shorter
the robot (Figure 1.1).
Figure 1.1 - Robotic telepresence system used in Rae et al. (2013)
Height and clothing are also influential in the criminal justice system, particularly
in eye-witness descriptions of perpetrators. However, the accuracy of physical descriptors
is suspect (Meissner, Sporer, & Schooler, 2013). Even when eyewitnesses accurately
recall height information, they are not more likely to accurately identify the perpetrator
(Cutler, Penrod, & Martens, 1987). Clothing and size perception are also relevant in the
4
court room. Offenders and suspects wearing black clothing are more likely to be
perceived as guilty, and they are viewed as more aggressive than those wearing other
colors (Vrij, 1997). However, black clothing is often said to create slimming illusions
(Raes, 2008), which could motivate obese defendants to wear black clothing to combat
weight biases associated with perceptions of guilt (Schvey, Puhl, Levandoski, &
Brownell, 2013). Finally, Bodenhorn, Moehling, & Price (2012) argue that the finding
that prisoners are on average shorter than the general population may be due to shorter
individuals receiving fewer legitimate opportunities due to negative stereotypes.
Appearing Taller: Advice from Suit Experts
Given the benefits associated with increased height, it is no surprise that many
people wish they were taller. Clothing serves as a way to transform an actual self into an
ideal self, and there is an extensive body of academic research surrounding this complex
relationship between clothing and the “self” in all its forms (Miller, 1997). A brief search
online will yield many books or articles on “how to dress taller,” many of which focus on
suit or suit-like attire. For this review, we compiled advice and suggestions from four
books and eight internet sources (Table 1.1). Note that the purpose here is not to review
the academic research on how to create the illusion of height, but rather to identify the
actual advice that clothing experts and fashion critics give to those in the general
population who want to change their body shape and size. Portions of these sources are
redundant; for example, one internet source includes an interview with the author of one
of the books. Because the purpose of this study is to explore the effects of illusions, we
omitted suggestions relating to drastic changes to the silhouette, such as wearing shoes
with thicker soles or a jacket with built-up shoulders. Similarly, we also omitted
5
suggestions in the vein of “get a suit that fits” or “have a good tailor” due to their lack of
specificity.
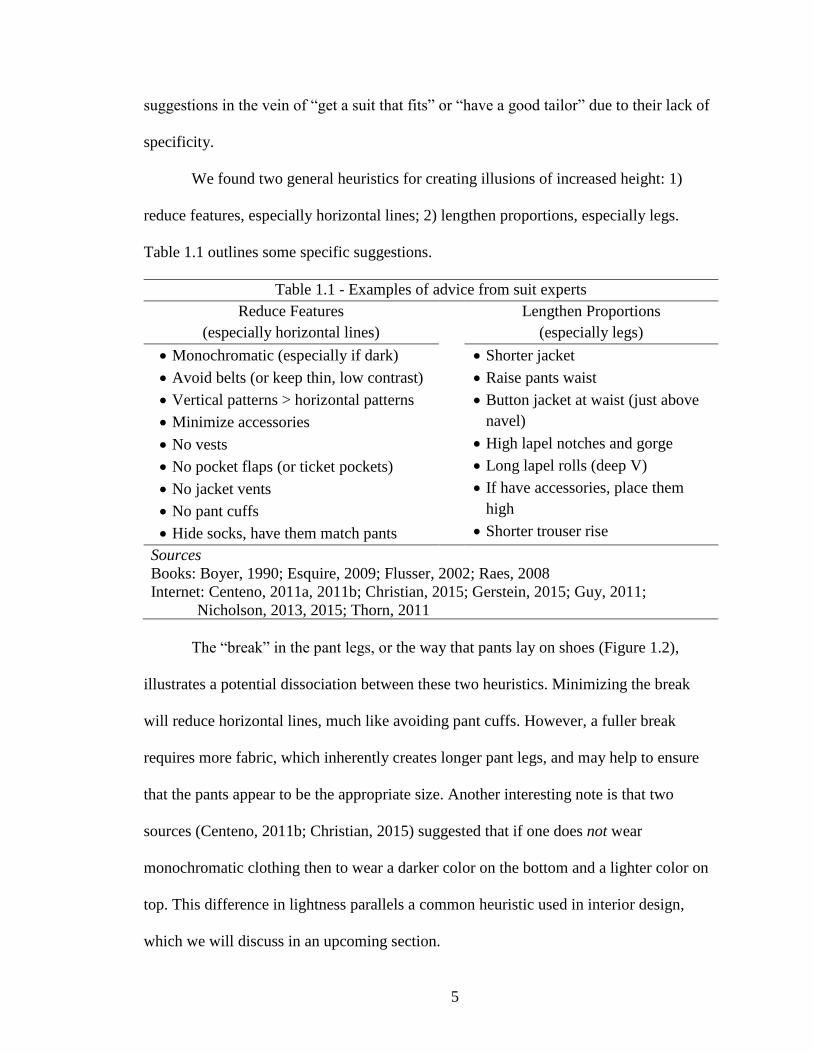
We found two general heuristics for creating illusions of increased height: 1)
reduce features, especially horizontal lines; 2) lengthen proportions, especially legs.
Table 1.1 outlines some specific suggestions.
Table 1.1 - Examples of advice from suit experts
Reduce Features
(especially horizontal lines)
Lengthen Proportions
(especially legs)
• Monochromatic (especially if dark)
• Avoid belts (or keep thin, low contrast)
• Vertical patterns > horizontal patterns
• Minimize accessories
• No vests
• No pocket flaps (or ticket pockets)
• No jacket vents
• No pant cuffs
• Hide socks, have them match pants
• Shorter jacket
• Raise pants waist
• Button jacket at waist (just above
navel)
• High lapel notches and gorge
• Long lapel rolls (deep V)
• If have accessories, place them
high
• Shorter trouser rise
Sources
Books: Boyer, 1990; Esquire, 2009; Flusser, 2002; Raes, 2008
Internet: Centeno, 2011a, 2011b; Christian, 2015; Gerstein, 2015; Guy, 2011;
Nicholson, 2013, 2015; Thorn, 2011
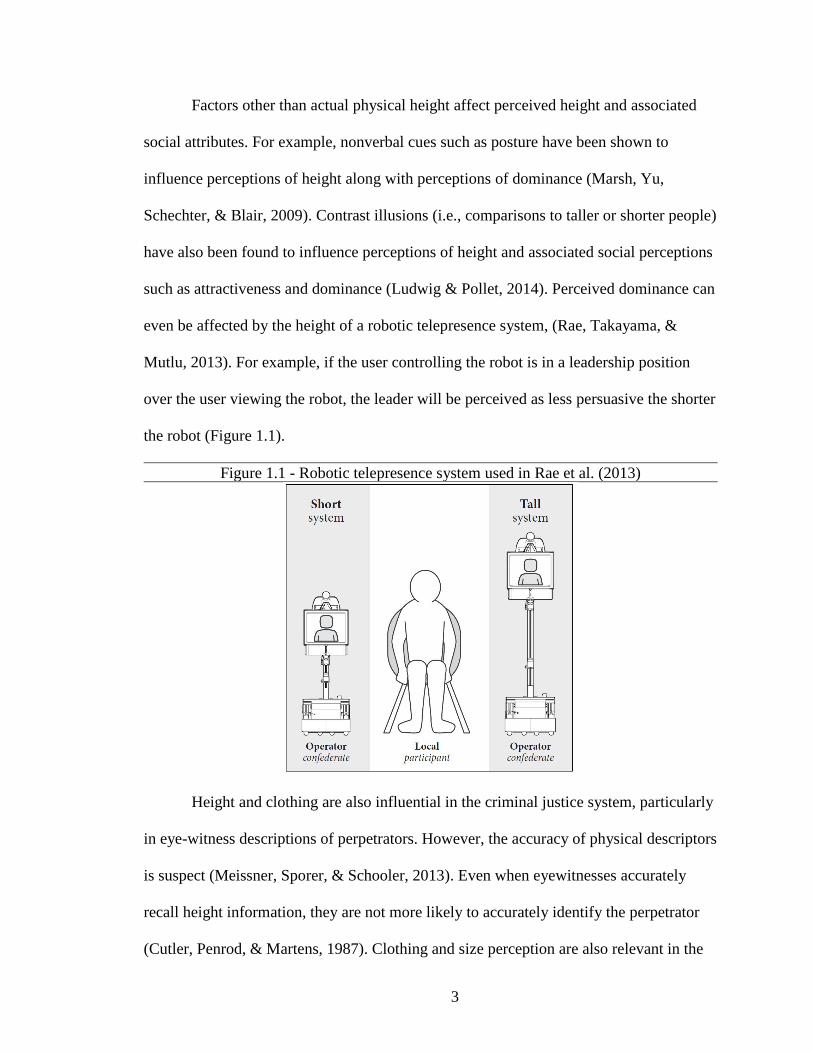
The “break” in the pant legs, or the way that pants lay on shoes (Figure 1.2),
illustrates a potential dissociation between these two heuristics. Minimizing the break
will reduce horizontal lines, much like avoiding pant cuffs. However, a fuller break
requires more fabric, which inherently creates longer pant legs, and may help to ensure
that the pants appear to be the appropriate size. Another interesting note is that two
sources (Centeno, 2011b; Christian, 2015) suggested that if one does not wear
monochromatic clothing then to wear a darker color on the bottom and a lighter color on
top. This difference in lightness parallels a common heuristic used in interior design,
which we will discuss in an upcoming section.
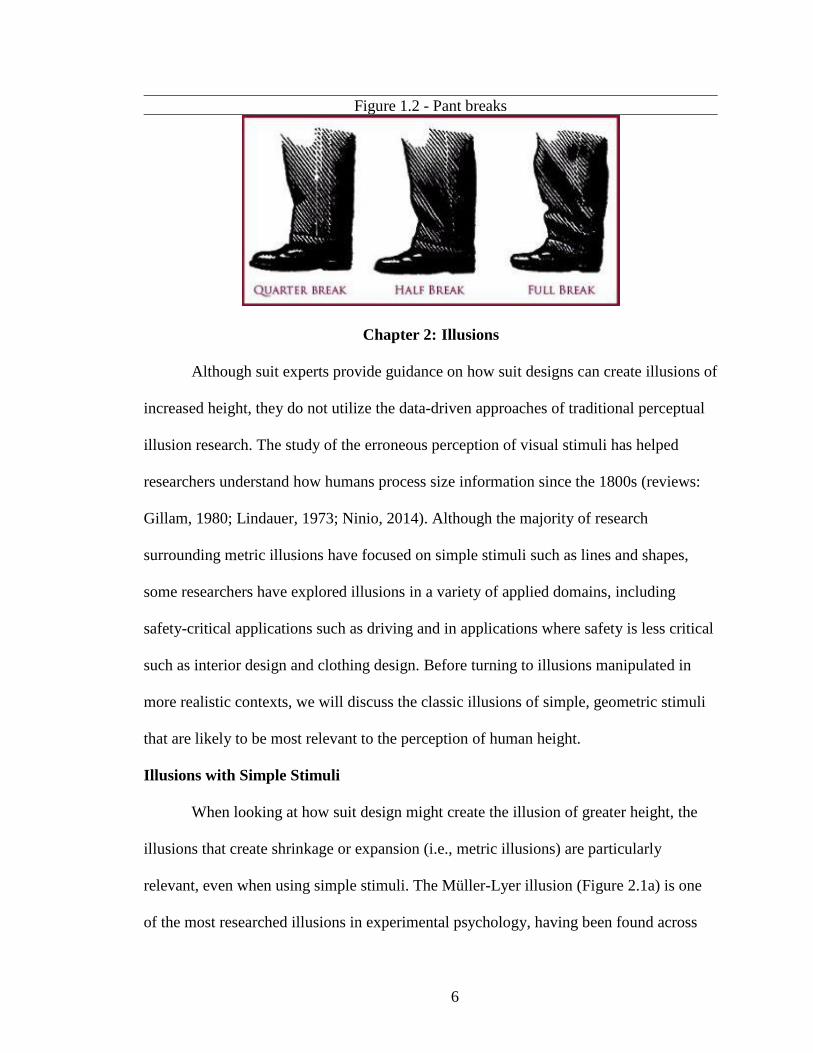
6
Figure 1.2 - Pant breaks
Chapter 2: Illusions
Although suit experts provide guidance on how suit designs can create illusions of
increased height, they do not utilize the data-driven approaches of traditional perceptual
illusion research. The study of the erroneous perception of visual stimuli has helped
researchers understand how humans process size information since the 1800s (reviews:
Gillam, 1980; Lindauer, 1973; Ninio, 2014). Although the majority of research
surrounding metric illusions have focused on simple stimuli such as lines and shapes,
some researchers have explored illusions in a variety of applied domains, including
safety-critical applications such as driving and in applications where safety is less critical
such as interior design and clothing design. Before turning to illusions manipulated in
more realistic contexts, we will discuss the classic illusions of simple, geometric stimuli
that are likely to be most relevant to the perception of human height.
Illusions with Simple Stimuli
When looking at how suit design might create the illusion of greater height, the
illusions that create shrinkage or expansion (i.e., metric illusions) are particularly
relevant, even when using simple stimuli. The Müller-Lyer illusion (Figure 2.1a) is one
of the most researched illusions in experimental psychology, having been found across
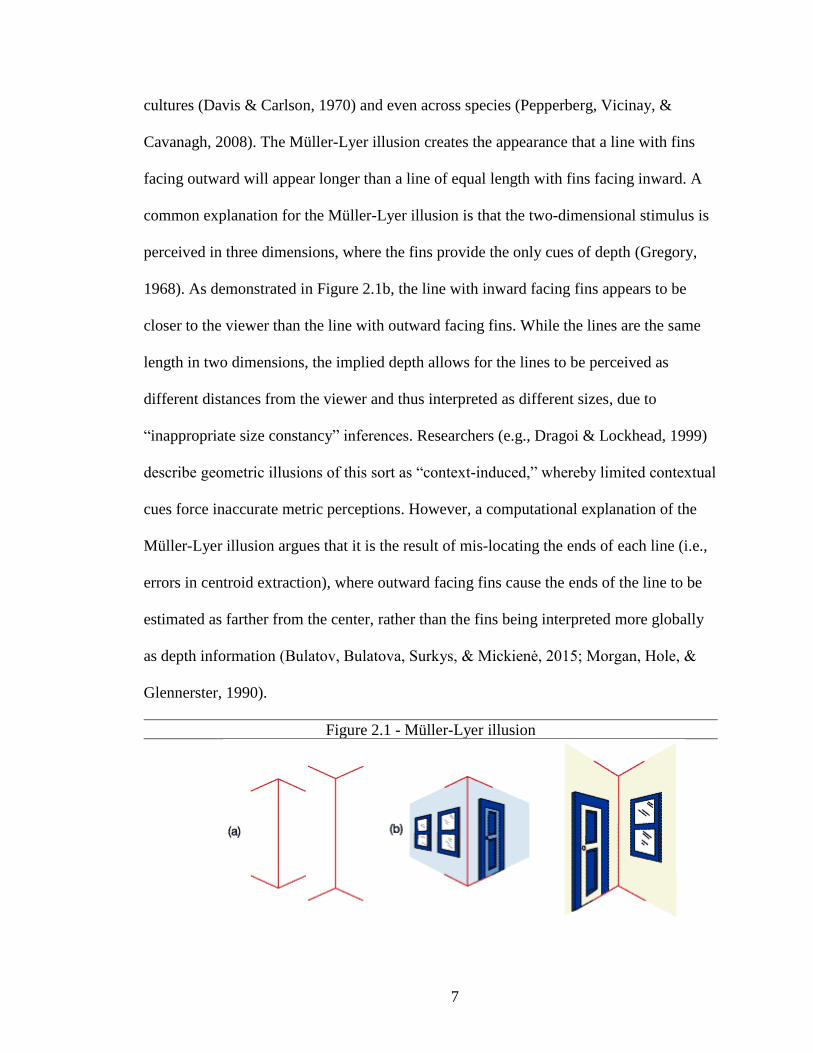
7
cultures (Davis & Carlson, 1970) and even across species (Pepperberg, Vicinay, &
Cavanagh, 2008). The Müller-Lyer illusion creates the appearance that a line with fins
facing outward will appear longer than a line of equal length with fins facing inward. A
common explanation for the Müller-Lyer illusion is that the two-dimensional stimulus is
perceived in three dimensions, where the fins provide the only cues of depth (Gregory,
1968). As demonstrated in Figure 2.1b, the line with inward facing fins appears to be
closer to the viewer than the line with outward facing fins. While the lines are the same
length in two dimensions, the implied depth allows for the lines to be perceived as
different distances from the viewer and thus interpreted as different sizes, due to
“inappropriate size constancy” inferences. Researchers (e.g., Dragoi & Lockhead, 1999)
describe geometric illusions of this sort as “context-induced,” whereby limited contextual
cues force inaccurate metric perceptions. However, a computational explanation of the
Müller-Lyer illusion argues that it is the result of mis-locating the ends of each line (i.e.,
errors in centroid extraction), where outward facing fins cause the ends of the line to be
estimated as farther from the center, rather than the fins being interpreted more globally
as depth information (Bulatov, Bulatova, Surkys, & Mickienė, 2015; Morgan, Hole, &
Glennerster, 1990).
Figure 2.1 - Müller-Lyer illusion
8
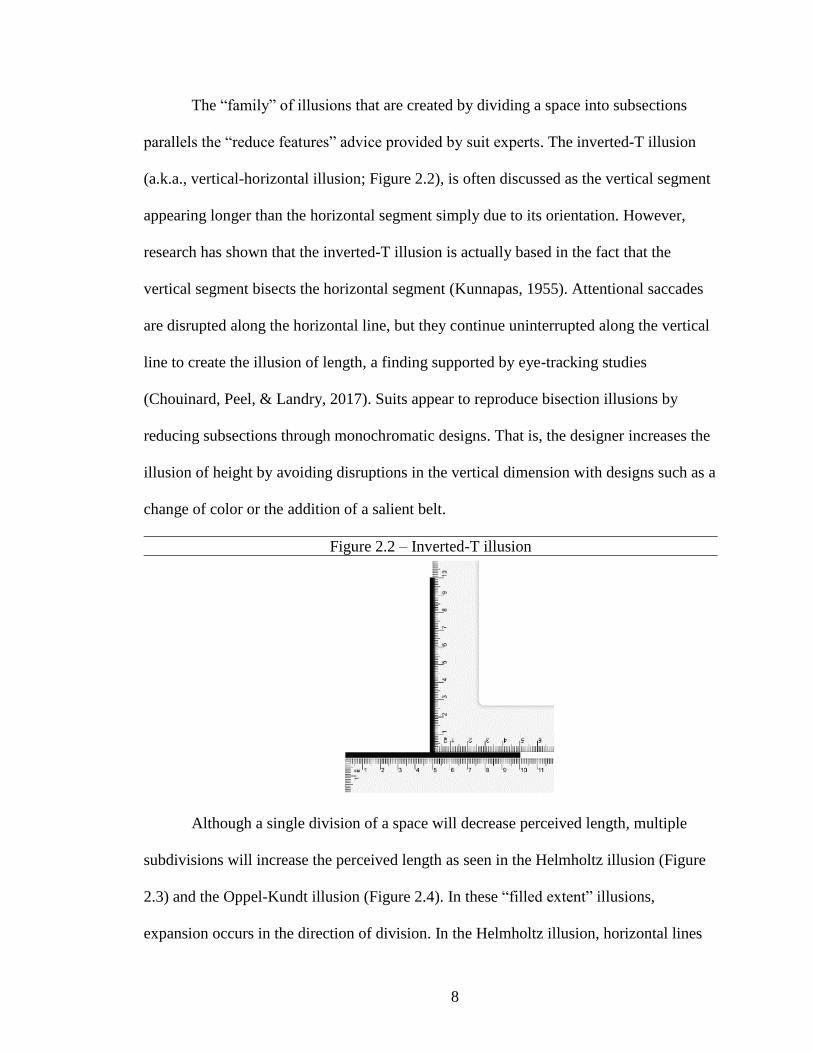
The “family” of illusions that are created by dividing a space into subsections
parallels the “reduce features” advice provided by suit experts. The inverted-T illusion
(a.k.a., vertical-horizontal illusion; Figure 2.2), is often discussed as the vertical segment
appearing longer than the horizontal segment simply due to its orientation. However,
research has shown that the inverted-T illusion is actually based in the fact that the
vertical segment bisects the horizontal segment (Kunnapas, 1955). Attentional saccades
are disrupted along the horizontal line, but they continue uninterrupted along the vertical
line to create the illusion of length, a finding supported by eye-tracking studies
(Chouinard, Peel, & Landry, 2017). Suits appear to reproduce bisection illusions by
reducing subsections through monochromatic designs. That is, the designer increases the
illusion of height by avoiding disruptions in the vertical dimension with designs such as a
change of color or the addition of a salient belt.
Figure 2.2 – Inverted-T illusion
Although a single division of a space will decrease perceived length, multiple
subdivisions will increase the perceived length as seen in the Helmholtz illusion (Figure
2.3) and the Oppel-Kundt illusion (Figure 2.4). In these “filled extent” illusions,
expansion occurs in the direction of division. In the Helmholtz illusion, horizontal lines
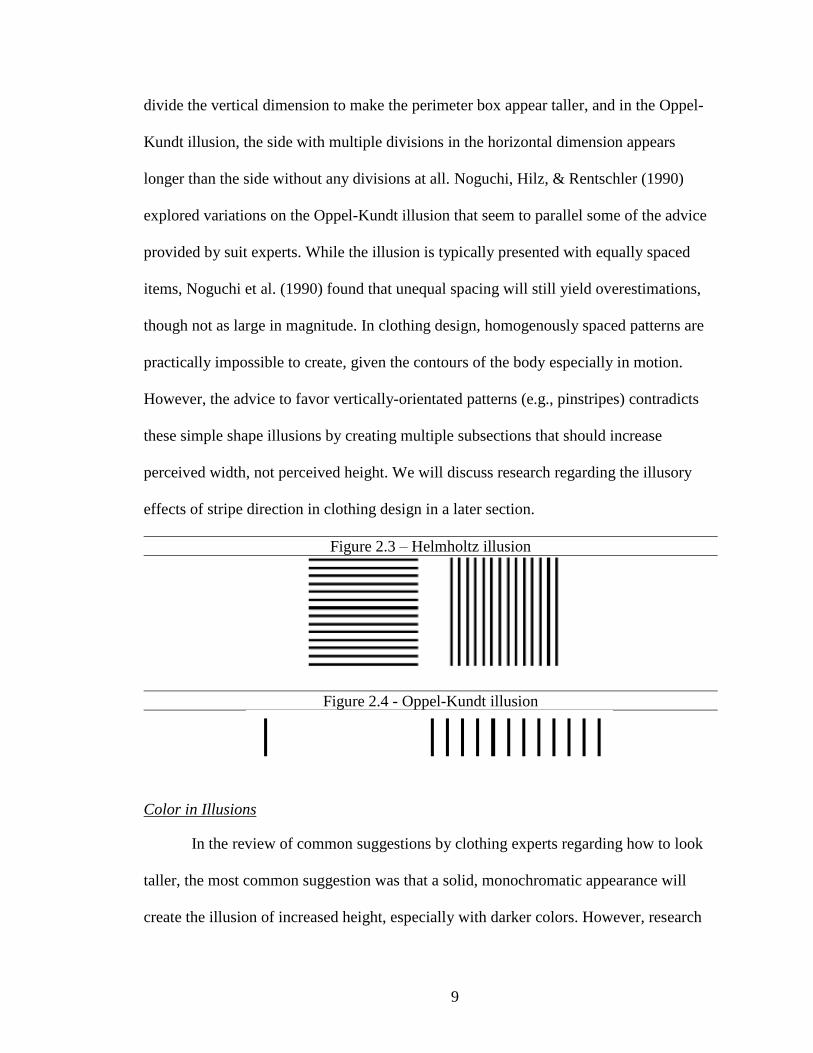
9
divide the vertical dimension to make the perimeter box appear taller, and in the Oppel-
Kundt illusion, the side with multiple divisions in the horizontal dimension appears
longer than the side without any divisions at all. Noguchi, Hilz, & Rentschler (1990)
explored variations on the Oppel-Kundt illusion that seem to parallel some of the advice
provided by suit experts. While the illusion is typically presented with equally spaced
items, Noguchi et al. (1990) found that unequal spacing will still yield overestimations,
though not as large in magnitude. In clothing design, homogenously spaced patterns are
practically impossible to create, given the contours of the body especially in motion.
However, the advice to favor vertically-orientated patterns (e.g., pinstripes) contradicts
these simple shape illusions by creating multiple subsections that should increase
perceived width, not perceived height. We will discuss research regarding the illusory
effects of stripe direction in clothing design in a later section.
Figure 2.3 – Helmholtz illusion
Figure 2.4 - Oppel-Kundt illusion
Color in Illusions
In the review of common suggestions by clothing experts regarding how to look
taller, the most common suggestion was that a solid, monochromatic appearance will
create the illusion of increased height, especially with darker colors. However, research
10
from the information processing tradition suggests that size and lightness are processed as
separable dimensions (Handel & Imai, 1972), meaning that an object will appear the
same size, regardless its lightness. Nevertheless, research surrounding the irradiation
illusion suggests that light, white objects appear larger than equally-sized dark, black
objects (Westheimer, 2008). A neurophysiological explanation for the irradiation illusion
is in the asymmetrical nature of neural pathways for contrasting light objects against a
dark background compared to the reversed polarity (dark on a light background;
Kremkow et al., 2014). Another explanation of the irradiation illusion derives from depth
perception, where lighter objects are perceived as being farther away (Coules, 1955),
which creates inappropriate size-depth constancy. We will discuss the link between size
and depth more thoroughly when we discuss the importance of contextual cues in helping
observers more accurately estimate the distance of objects.
Illusions in Applied Settings
While metric illusions exist in simple stimuli, human factors researchers have
explored how visual illusions might also affect perception and performance in
application. Depending on the specific domain, illusions can lead to errors with dire
consequences, such as the illusions of size or distance that pilots can encounter when
making a night landing (Gibb, Ercoline, & Scharff, 2011). Researchers have also
discovered that some illusions that occur when driving can have serious consequences.
For example, a car’s design can make drivers overestimate intervehicular distances. A
smaller-than-average car will appear farther away (Eberts & MacMillan, 1985), as will
cars with taillights that are closer together (Cavallo, Colomb, & Dore, 2001) or higher on
the car than average (Buchner, Brandt, Bell, & Weise, 2006). These studies call attention
11
to misinterpretations that have severely negative outcomes (i.e., car crashes), but
designers may also intentionally create illusions to yield positive results. For example, a
pattern designed on the road to resemble the Wundt illusion where parallel lines appear to
bend inward (Figure 2.5) will make drivers drive slower, supposedly because the road
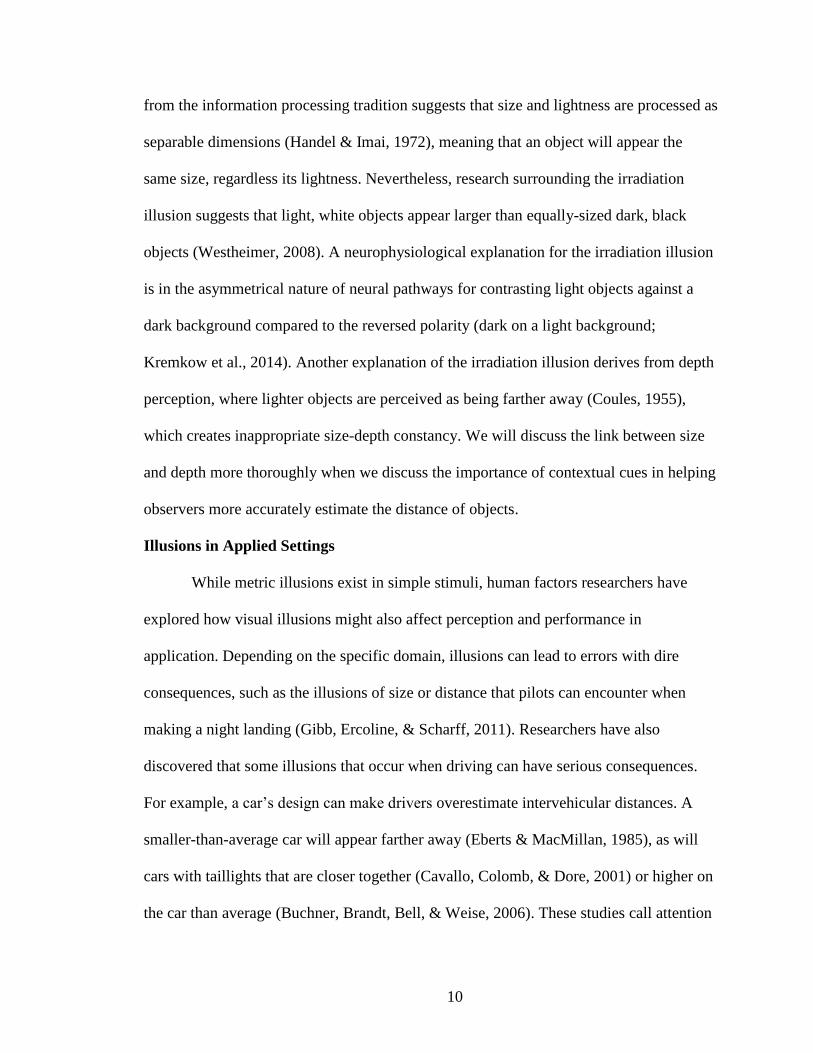
appears narrower (Shinar, Rockwell, & Malecki, 1980).
Figure 2.5 – Wundt illusion
Given the high stakes in flying and driving, understanding illusions in those cases
is certainly important. However, illusions also exist in designs where safety is less
critical. For example, illusions affect the interpretation of data visualization graphs
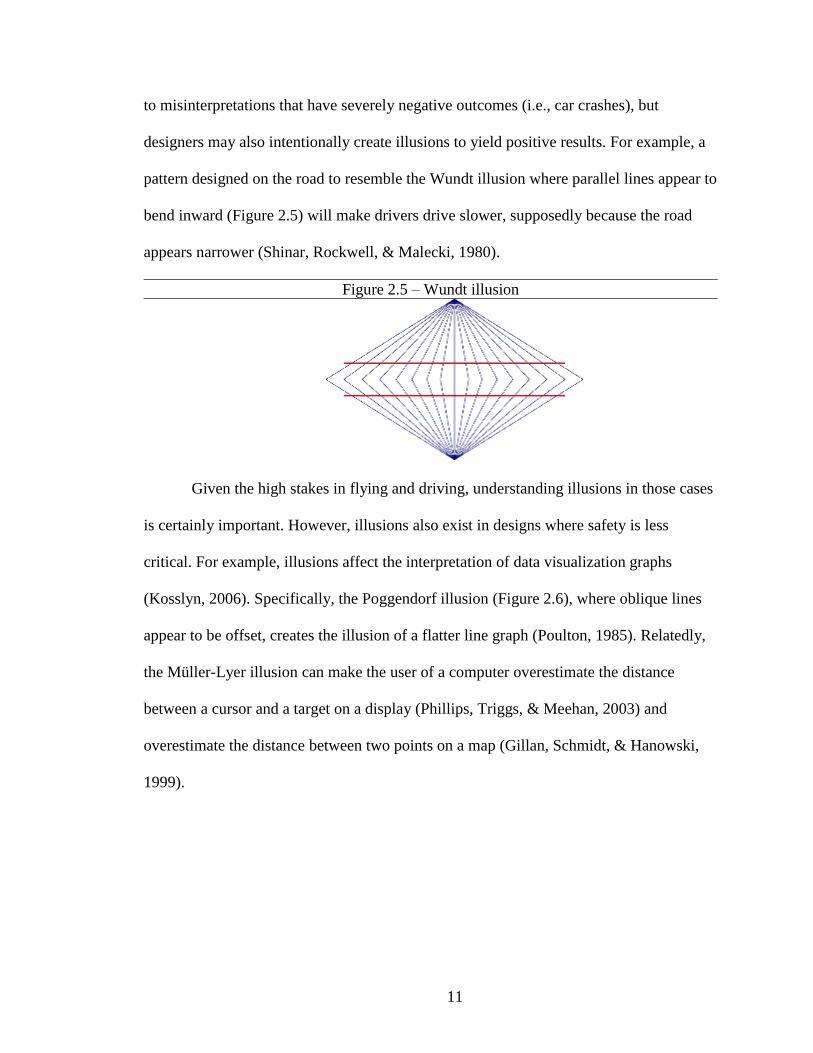
(Kosslyn, 2006). Specifically, the Poggendorf illusion (Figure 2.6), where oblique lines
appear to be offset, creates the illusion of a flatter line graph (Poulton, 1985). Relatedly,
the Müller-Lyer illusion can make the user of a computer overestimate the distance
between a cursor and a target on a display (Phillips, Triggs, & Meehan, 2003) and
overestimate the distance between two points on a map (Gillan, Schmidt, & Hanowski,
1999).
12
Figure 2.6 – Poggendorf illusion
Examples from graph and interaction design demonstrate how illusions can
negatively affect performance, but there are also cases where people design illusions to
have positive effects in non-safety-critical contexts. An example of an intentional illusion
can be seen in interior design (Oberfeld & Hecht, 2011; Oberfeld, Hecht, & Gamer, 2010;
von Castell, Hecht, & Oberfeld, 2017), where a common design heuristic is that a room
will appear larger depending on the combinations of ceiling color, wall color, and floor
color. Specifically, a room will appear taller if the ceiling is lighter than the walls (i.e., a
contrast effect). Both experts and nonexperts endorse this contrast heuristic. However, the
assumed relation between lightness contrast and room height is erroneous. Perceptual
studies showed that contrasting shades do not influence perceived room height. Rather,
there is an overall lightness effect. A room will appear taller if both the ceiling and walls
are a light shade. These results are similar to findings from a small study conducted by
Ramkumar & Bennett (1979), where they built small-scale models to test size
perceptions. In their model, they placed a human figurine in a room and manipulated the
color of the wall behind the figure. When the wall was lighter, observers overestimated
the distance between the figure and the wall, and they overestimated the height of the
figure as well. Both interior design and clothing design experts tout the contrast heuristic
that higher portions should be lighter.
13
Illusions in Clothing Design
A few studies have explored the application of simple metric illusions to clothing
design. Horn & Gurel (1981) and Sethumadhavan (2012) discussed simple illusions in
relation to clothing, but they did not support their assertions with data. Additionally,
Ridgway, Parsons, & Sohn (2016) explored clothing illusions as they relate to body
image, although they only utilized qualitative semi-structured interviews, which provide
no information about the actual magnitude of potential illusions.
Other researchers have collected data to support their conclusions about the
direction and magnitude of clothing illusions. For example, Bian et al. (2013) found that
people in lighter clothing appeared larger overall (i.e., in height and width) than those in
darker clothing. Two specific simple illusions in clothing have been explored
independent of color: the Helmholtz illusion and the Müller-Lyer illusion. The Helmholtz
illusion, if found in clothing, would contradict the common design guidance that vertical
stripes will make the body appear taller and thinner than horizontal stripes. Thompson &
Mikellidou (2011) found evidence of the Helmholtz illusion – horizontal lines on a dress
created the illusion of increased height while vertical lines increased perceived width.
However, Ashida, Kuraguchi, & Miyoshi (2013) found that the illusory effect in the
horizontal dimension varies depending on the thinness of the figure, in that horizontal
lines only created a thinning illusion when the person is already thin (Figure 2.7). While
Ashida et al. (2013) did not collect height judgments, Chen & Peng (2013) did, finding
that horizontal stripes made tall targets appear shorter while vertical stripes made short
targets appear taller.
We would like to note that Chen & Peng (2013) used photographs of people
wearing loose-fitting clothing, while the other studies used drawings or computer
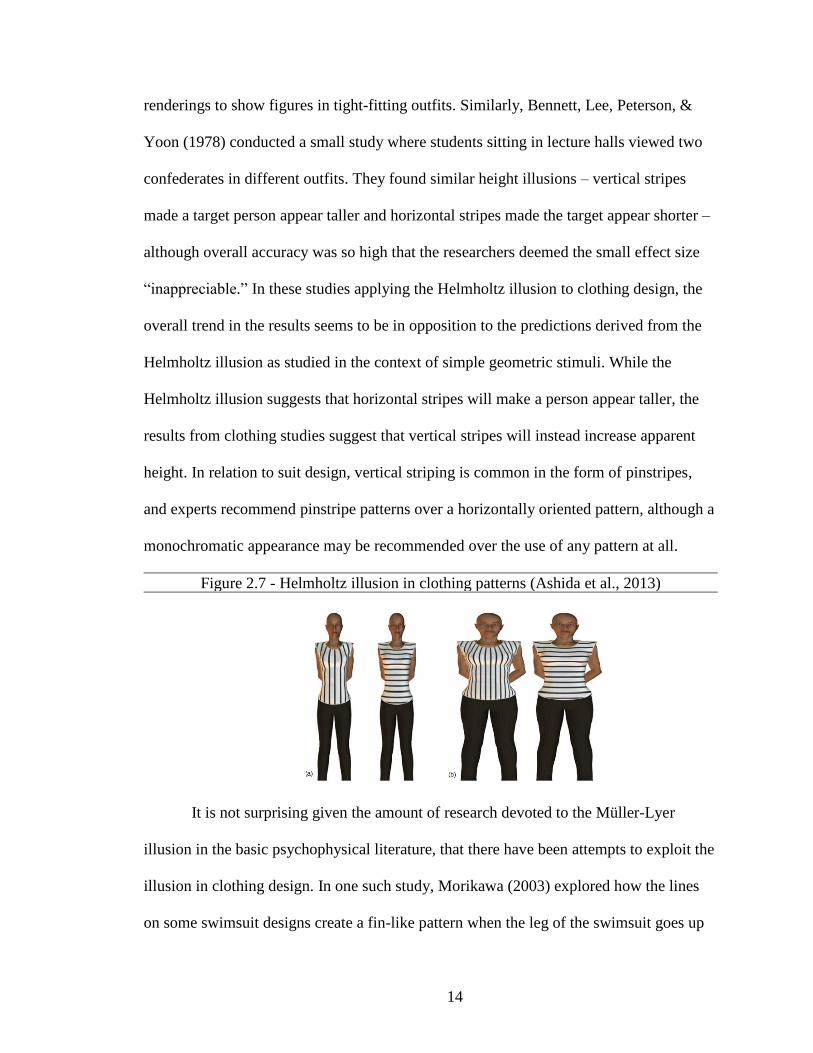
14
renderings to show figures in tight-fitting outfits. Similarly, Bennett, Lee, Peterson, &
Yoon (1978) conducted a small study where students sitting in lecture halls viewed two
confederates in different outfits. They found similar height illusions – vertical stripes
made a target person appear taller and horizontal stripes made the target appear shorter –
although overall accuracy was so high that the researchers deemed the small effect size
“inappreciable.” In these studies applying the Helmholtz illusion to clothing design, the
overall trend in the results seems to be in opposition to the predictions derived from the
Helmholtz illusion as studied in the context of simple geometric stimuli. While the
Helmholtz illusion suggests that horizontal stripes will make a person appear taller, the
results from clothing studies suggest that vertical stripes will instead increase apparent
height. In relation to suit design, vertical striping is common in the form of pinstripes,
and experts recommend pinstripe patterns over a horizontally oriented pattern, although a
monochromatic appearance may be recommended over the use of any pattern at all.
Figure 2.7 - Helmholtz illusion in clothing patterns (Ashida et al., 2013)
It is not surprising given the amount of research devoted to the Müller-Lyer
illusion in the basic psychophysical literature, that there have been attempts to exploit the
illusion in clothing design. In one such study, Morikawa (2003) explored how the lines
on some swimsuit designs create a fin-like pattern when the leg of the swimsuit goes up
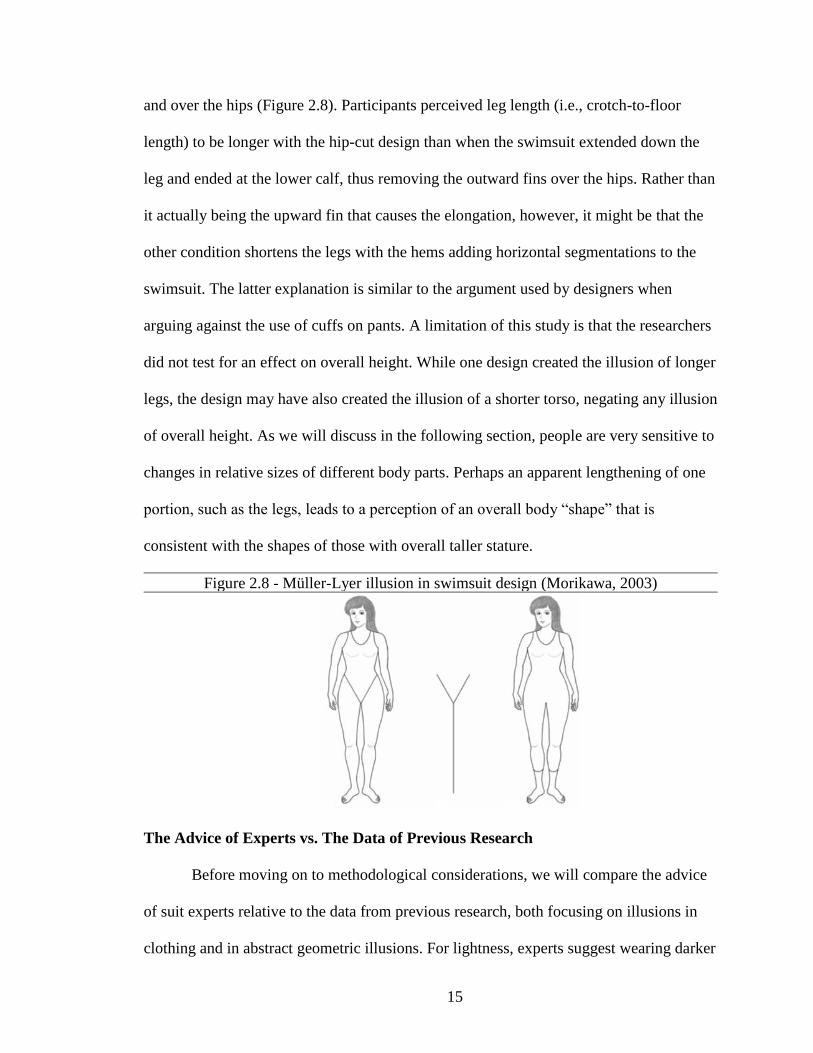
15
and over the hips (Figure 2.8). Participants perceived leg length (i.e., crotch-to-floor
length) to be longer with the hip-cut design than when the swimsuit extended down the
leg and ended at the lower calf, thus removing the outward fins over the hips. Rather than
it actually being the upward fin that causes the elongation, however, it might be that the
other condition shortens the legs with the hems adding horizontal segmentations to the
swimsuit. The latter explanation is similar to the argument used by designers when
arguing against the use of cuffs on pants. A limitation of this study is that the researchers
did not test for an effect on overall height. While one design created the illusion of longer
legs, the design may have also created the illusion of a shorter torso, negating any illusion
of overall height. As we will discuss in the following section, people are very sensitive to
changes in relative sizes of different body parts. Perhaps an apparent lengthening of one
portion, such as the legs, leads to a perception of an overall body “shape” that is
consistent with the shapes of those with overall taller stature.
Figure 2.8 - Müller-Lyer illusion in swimsuit design (Morikawa, 2003)
The Advice of Experts vs. The Data of Previous Research
Before moving on to methodological considerations, we will compare the advice
of suit experts relative to the data from previous research, both focusing on illusions in
clothing and in abstract geometric illusions. For lightness, experts suggest wearing darker
16
colors to appear taller, but this contradicts the research. Using abstract stimuli, lighter
objects appear larger, and someone is wearing lighter colors produces a similar effect.
The story is not so clear when focusing on dividing subsections, or reducing interruptions
for attentional saccades. For example, suit experts suggest wearing vertical stripes and
avoiding horizontal stripes to appear taller, while the Helmholtz illusion shows that a box
of horizontal stripes appears taller than one of vertical stripes, and the data from studies
exploring this phenomenon provides mixed findings. However, the general trend appears
to be that vertical stripes make someone appear taller. At a more macro level, experts
suggest reducing features and dressing monochromatically in the name of reducing
saccadic interruption, which aligns with abstract geometric illusions such as the inverted-
T illusion. Unfortunately, there does not appear to be any data on the illusory effects this
type of visual division has on perceived height of individuals due to the clothing they
wear.
The discrepancies among these three categories (expert advice, abstract illusions
data, and clothing illusions data) may highlight interesting comparisons in this type of
research. For example, drawing an analogy from classic information processing models,
we can describe the advice from experts as “top-down,” while the data from studies on
abstract illusions are more “bottom-up.” Unfortunately, there is great variability among
the studies focusing on clothing illusions, all of which have some degree of
methodological issues that may contribute to the inconsistencies among their results, but
also restrict their generalizability beyond the scope of the study to real world applications
to explore real world effects. The following chapter will discuss these limitations.
17
Chapter 3: Limitations of Previous Research
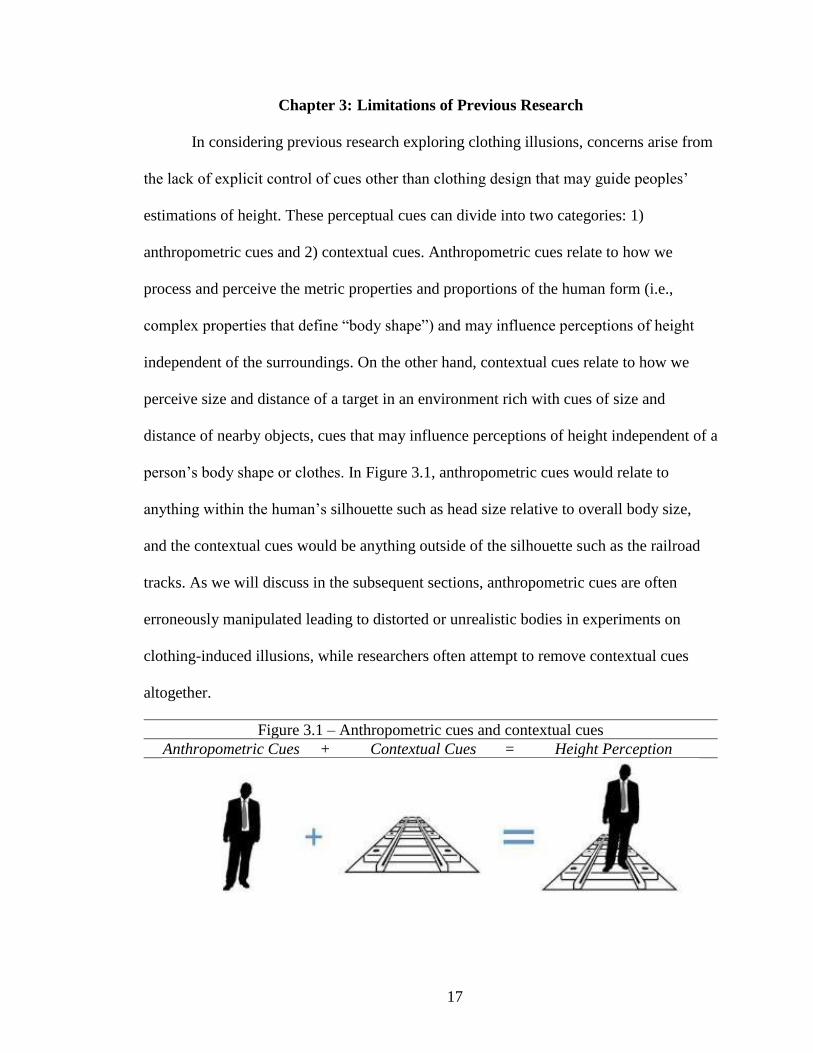
In considering previous research exploring clothing illusions, concerns arise from
the lack of explicit control of cues other than clothing design that may guide peoples’
estimations of height. These perceptual cues can divide into two categories: 1)
anthropometric cues and 2) contextual cues. Anthropometric cues relate to how we
process and perceive the metric properties and proportions of the human form (i.e.,
complex properties that define “body shape”) and may influence perceptions of height
independent of the surroundings. On the other hand, contextual cues relate to how we
perceive size and distance of a target in an environment rich with cues of size and
distance of nearby objects, cues that may influence perceptions of height independent of a
person’s body shape or clothes. In Figure 3.1, anthropometric cues would relate to
anything within the human’s silhouette such as head size relative to overall body size,
and the contextual cues would be anything outside of the silhouette such as the railroad
tracks. As we will discuss in the subsequent sections, anthropometric cues are often
erroneously manipulated leading to distorted or unrealistic bodies in experiments on
clothing-induced illusions, while researchers often attempt to remove contextual cues
altogether.
Figure 3.1 – Anthropometric cues and contextual cues
Anthropometric Cues + Contextual Cues = Height Perception
18
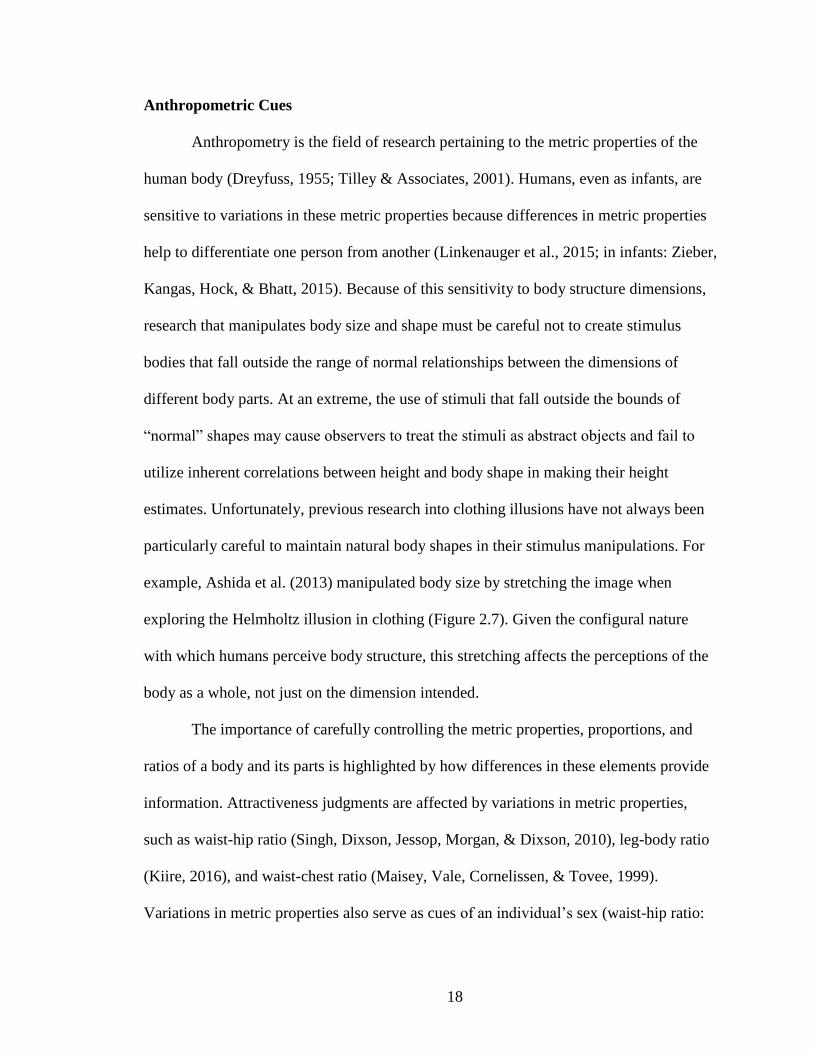
Anthropometric Cues
Anthropometry is the field of research pertaining to the metric properties of the
human body (Dreyfuss, 1955; Tilley & Associates, 2001). Humans, even as infants, are
sensitive to variations in these metric properties because differences in metric properties
help to differentiate one person from another (Linkenauger et al., 2015; in infants: Zieber,
Kangas, Hock, & Bhatt, 2015). Because of this sensitivity to body structure dimensions,
research that manipulates body size and shape must be careful not to create stimulus
bodies that fall outside the range of normal relationships between the dimensions of
different body parts. At an extreme, the use of stimuli that fall outside the bounds of
“normal” shapes may cause observers to treat the stimuli as abstract objects and fail to
utilize inherent correlations between height and body shape in making their height
estimates. Unfortunately, previous research into clothing illusions have not always been
particularly careful to maintain natural body shapes in their stimulus manipulations. For
example, Ashida et al. (2013) manipulated body size by stretching the image when
exploring the Helmholtz illusion in clothing (Figure 2.7). Given the configural nature
with which humans perceive body structure, this stretching affects the perceptions of the
body as a whole, not just on the dimension intended.
The importance of carefully controlling the metric properties, proportions, and
ratios of a body and its parts is highlighted by how differences in these elements provide
information. Attractiveness judgments are affected by variations in metric properties,
such as waist-hip ratio (Singh, Dixson, Jessop, Morgan, & Dixson, 2010), leg-body ratio
(Kiire, 2016), and waist-chest ratio (Maisey, Vale, Cornelissen, & Tovee, 1999).
Variations in metric properties also serve as cues of an individual’s sex (waist-hip ratio:
19
Johnson & Tassinary, 2005), race (femur-body ratio: Feldesman & Fountain, 1996),
health (leg-body ratio: Bogin & Varela-Silva, 2010), or age (head-body ratio: Alley,
1983).
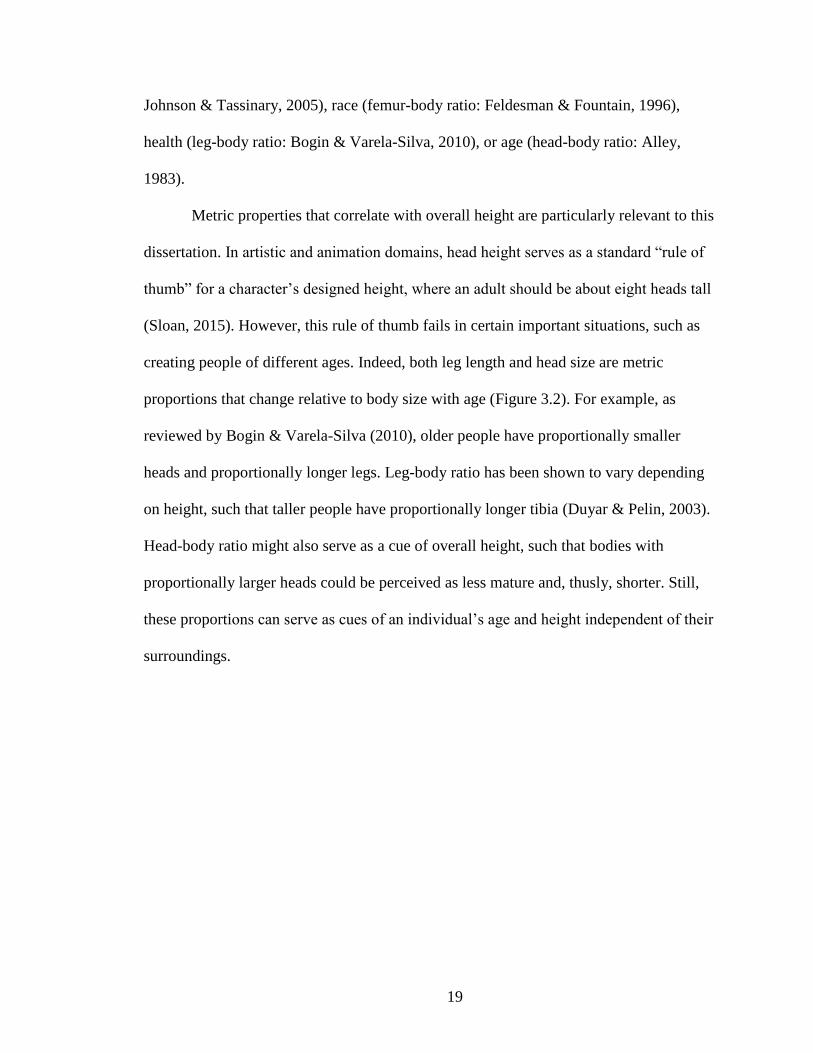
Metric properties that correlate with overall height are particularly relevant to this
dissertation. In artistic and animation domains, head height serves as a standard “rule of
thumb” for a character’s designed height, where an adult should be about eight heads tall
(Sloan, 2015). However, this rule of thumb fails in certain important situations, such as
creating people of different ages. Indeed, both leg length and head size are metric
proportions that change relative to body size with age (Figure 3.2). For example, as
reviewed by Bogin & Varela-Silva (2010), older people have proportionally smaller
heads and proportionally longer legs. Leg-body ratio has been shown to vary depending
on height, such that taller people have proportionally longer tibia (Duyar & Pelin, 2003).
Head-body ratio might also serve as a cue of overall height, such that bodies with
proportionally larger heads could be perceived as less mature and, thusly, shorter. Still,
these proportions can serve as cues of an individual’s age and height independent of their
surroundings.
20
Figure 3.2 - Body structure proportions through development
From Bogin & Varela-Silva (2010): “Changes in body proportion during human growth
after birth. Ages for each profile are, from left to right, newborn, 2 years, 6 years, 12
years, 25 years. The hair style and shading of the cartoon silhouettes are for artistic
purposes and is not meant to imply any ethnic, eco-geographical, or “racial” phenotypic
characteristics of the human species”
However, as demonstrated by the changes in head and leg size with age, an
increase in one metric property does not mean that the rest of the body increases
isomorphically. In researching contrast effects, Ludwig & Pollet (2014) manipulated
body size by proportionally increasing the body in all directions Figure 3.6. They cite
these uniform size increases as a limitation as such proportions are not always realistic. In
fact, a uniform increase in body proportions may be interpreted as a person being closer
to the observer rather than inherently larger. However, similar assumptions of
proportional increases of size in body parts have been the driving force in standardized
clothing-size practices dating back to military uniforms in the 1800s (Boyer, 1990; Gupta
21
& Zakaria, 2014). To simplify manufacturing, clothing may be designed to correlate to
different body proportions, such as an arm length being predicted based on a specific
chest circumference. While such predictions may be relatively accurate in a very
homogeneous population (e.g., all healthy males of a specific age range, often within a
limited height range), after-purchase clothing alterations in the broader community
demonstrate the variability inherent in comparisons of one metric property to others.
Human factors researchers have explored and discussed the inaccuracies of such
correlational approaches and have made suggestions about how to more effectively
measure and model the metric properties of users (Peacock, 2003; Robinette & Veitch,
2016).
The abstract parts, or “geons” (Biederman, 1987), of a body parallel those of a
suit in their spatial configuration and proportions. However, we should note that there are
discrepancies. For example, the suit covers and drapes the body to create an abstracted
size and shape, or silhouette, which differs from the body underneath. The body’s actual
waist and the suit’s presented waist may be quite different in size and location. A suit
may have added features such as cuffs that appear to influence metric properties of the
body such as leg length. While leg length, alone or in proportion to the rest of the body,
may serve as a cue of height, the leg-body ratio may also influence judgments of
attractiveness and other social attributes independent of height perceptions.
In the current study, we maintained those natural configural properties of bodies
that may be used by observers as cues to overall height, even in the absence of
environmental context. For targets (i.e., to-be-judged stimuli), we digitally manipulated
the clothing on photographs of a sample of men who represent a range of actual heights.
22
Contextual Cues
Although the metric properties of a body other than height may influence how tall
a person looks, there is additional perceptual information surrounding the body that can
also influence perceived size. This additional contextual information is often limited in
research on visual illusions to force participants to attend to the dimensions of interest to
the researcher and induce illusory effects. On the other hand, targets surrounded by rich
contextual information may make size easily and directly perceptible, with no need to
compute estimated height based on perceived distance. The “ecological” approach to
perception of J.J. Gibson argues that the use of simplified, static stimuli in research is
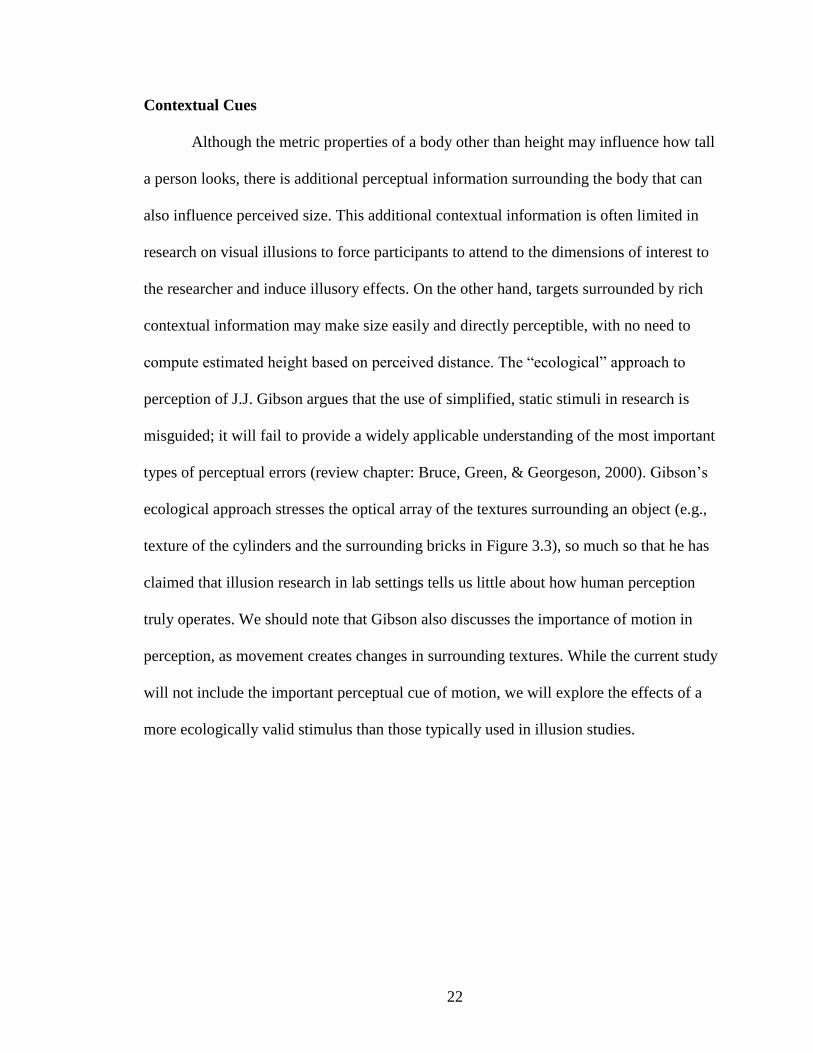
misguided; it will fail to provide a widely applicable understanding of the most important
types of perceptual errors (review chapter: Bruce, Green, & Georgeson, 2000). Gibson’s
ecological approach stresses the optical array of the textures surrounding an object (e.g.,
texture of the cylinders and the surrounding bricks in Figure 3.3), so much so that he has
claimed that illusion research in lab settings tells us little about how human perception
truly operates. We should note that Gibson also discusses the importance of motion in
perception, as movement creates changes in surrounding textures. While the current study
will not include the important perceptual cue of motion, we will explore the effects of a
more ecologically valid stimulus than those typically used in illusion studies.
23
Figure 3.3 - Demonstration of textures in ecological perception
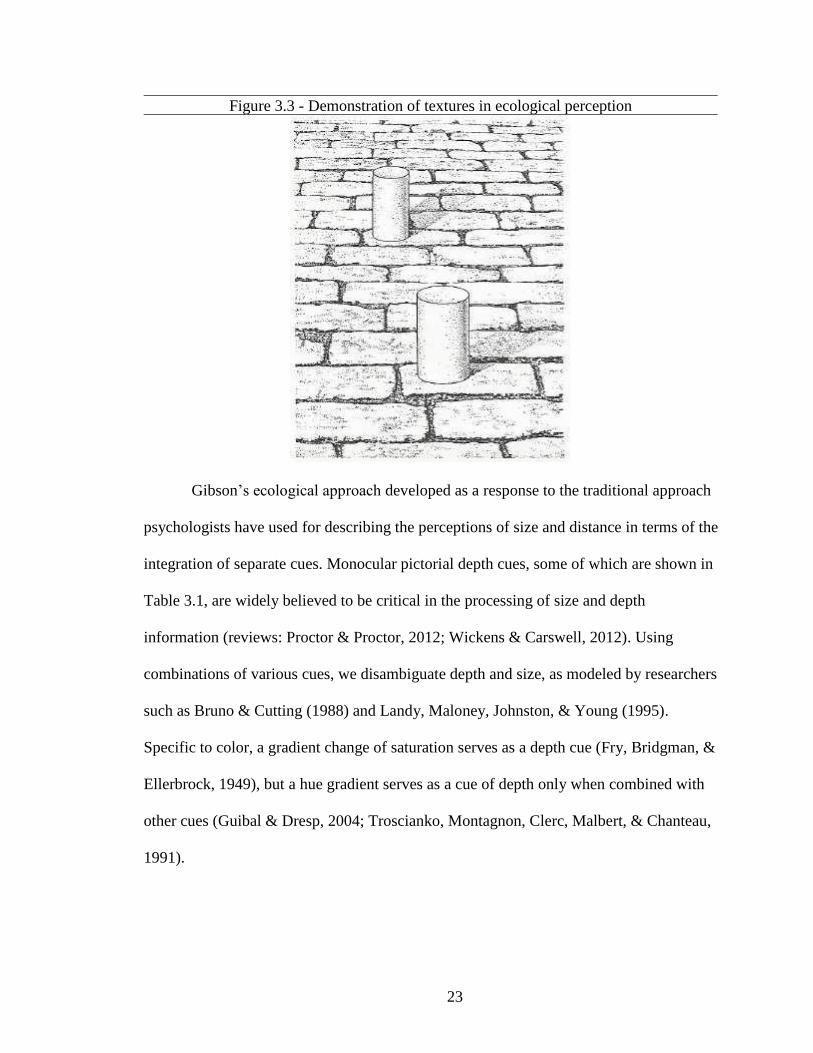
Gibson’s ecological approach developed as a response to the traditional approach
psychologists have used for describing the perceptions of size and distance in terms of the
integration of separate cues. Monocular pictorial depth cues, some of which are shown in
Table 3.1, are widely believed to be critical in the processing of size and depth
information (reviews: Proctor & Proctor, 2012; Wickens & Carswell, 2012). Using
combinations of various cues, we disambiguate depth and size, as modeled by researchers
such as Bruno & Cutting (1988) and Landy, Maloney, Johnston, & Young (1995).
Specific to color, a gradient change of saturation serves as a depth cue (Fry, Bridgman, &
Ellerbrock, 1949), but a hue gradient serves as a cue of depth only when combined with
other cues (Guibal & Dresp, 2004; Troscianko, Montagnon, Clerc, Malbert, & Chanteau,
1991).
24
Table 3.1 - Examples of monocular pictorial depth cues
Retinal Size: Familiar Size: Interposition: Shading:
Visual angle size on
retina
Knowledge of
what size should
be
Occlusion,
foreground
covers
background
Shadows, assume
light source is above
Linear Perspective: Height in Plane:
Texture
Gradient: Color Gradient:
Parallel lines converge
at horizon
Closer to horizon
means farther
away
Linear
perspective +
familiar size
Color is less
saturated at farther
distances
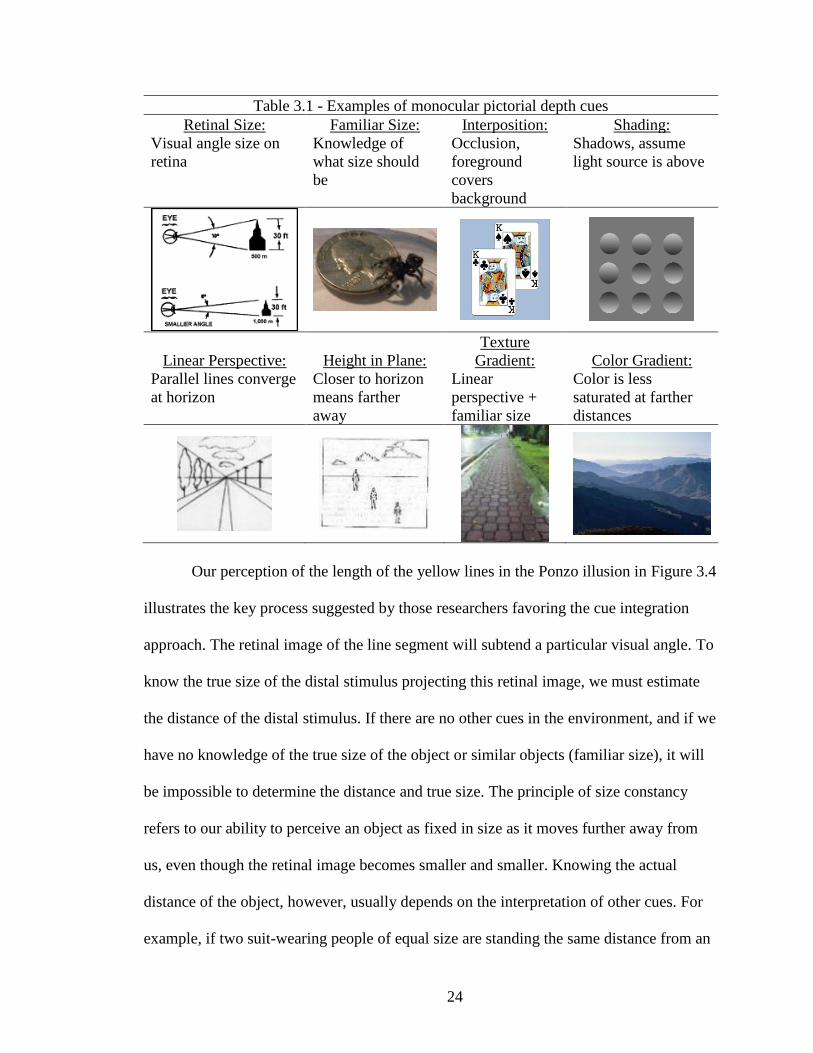
Our perception of the length of the yellow lines in the Ponzo illusion in Figure 3.4
illustrates the key process suggested by those researchers favoring the cue integration
approach. The retinal image of the line segment will subtend a particular visual angle. To
know the true size of the distal stimulus projecting this retinal image, we must estimate
the distance of the distal stimulus. If there are no other cues in the environment, and if we
have no knowledge of the true size of the object or similar objects (familiar size), it will
be impossible to determine the distance and true size. The principle of size constancy
refers to our ability to perceive an object as fixed in size as it moves further away from
us, even though the retinal image becomes smaller and smaller. Knowing the actual
distance of the object, however, usually depends on the interpretation of other cues. For
example, if two suit-wearing people of equal size are standing the same distance from an
25
observer, they may still appear different sizes if additional cues make one of the two
appear further away. If the color of the suit of one of the two people is interpreted as
meaning that person is closer, then size constancy will be inaccurately applied by the
observer and he or she will assume that the closer person must be smaller (put another
way, the other person is farther away yet casts the same size retinal image and, thus, must
be larger). If, however, there are additional cues to demonstrate that these two people are
actually the same distance away, then the illusory effects may diminish.
Figure 3.4 - Size constancy and distance perception in the Ponzo illusion
When encountering a clothed person, there are typically numerous visual cues to
provide information regarding their height such as nearby cars, doorways, and other
people. However, studies exploring clothing illusions often use stimuli stripped of such
cues, forcing people to rely on more idiosyncratic points of reference, such as their own
height as anchors (Twedt, Crawford, & Proffitt, 2015), or making judgments based on the
correlation between height and other anthropometric cues. The absence of contextual
information may artificially inflate the effect clothing has on perceived height. A richer
environment may constrain illusions by reducing the contribution of clothing-based cues

26
in favor of more reliable context cues. Past social research found context manipulations
affected perceived height and height-associated attributes, such as varying the height of
wall outlets to influence perceived height and dominance (Figure 3.5; Marsh et al., 2009).
Similarly, Ludwig & Pollet (2014) influenced perceived height, attractiveness, and
dominance by surrounding a target individual with distractor individuals of different sizes
(Figure 3.6). This contrast-illusion effect was demonstrated when presenting the
individuals against a white background and against a more realistic background full of
contextual depth cues.
Figure 3.5 - Visual cues influencing height and status perception (Marsh et al., 2009)
Figure 3.6 – Background manipulation in height-contrast illusions (Ludwig & Pollet,
2014)
27
In the current study, we maintained the rich, real-world contextual information
(i.e., backgrounds) that existed in the original photograph of the target for one of the
experimental conditions. The backgrounds of the stimuli varied in multiple ways, some of
which we categorized for within-subject comparison as we will discuss later. For the
other experimental condition, we removed the background so that the target appeared
against a white background, although still in the same position in the frame.
Chapter 4: Research Methods
This dissertation used an exploratory sequential mixed-methods design in two
phases (Creswell & Plano Clark, 2011). Phase 1 consisted of a survey of non-experts to
see how their advice and suggestions parallel the advice and suggestions of suit experts as
covered in Chapter 1. The purpose of the exploratory Phase 1 was to see what suit design
manipulations should be included in the stimuli for Phase 2. The advice of experts, along
with the history of perceptual research in illusions, gave us the idea to manipulate
monochromaticity and overall lightness, but these conditions needed validation with a
more general population. Phase 2 utilized a height estimation task to examine whether
our selected manipulations of clothing design can make the wearer appear taller. We also
investigated the impact of naturalistic context on the magnitude of any obtained size
illusions. Because the height of individuals correlates with social judgments about a
variety of attributes such as attractiveness and status, we also determined whether
variations in suit design, which theoretically impact perceived height, also created
corresponding changes in observers’ judgments about these characteristics.
28
Height Estimation Task
The key data from this dissertation are the height estimations. There are concerns
around utilizing estimation methodologies for collecting psychophysical data
(Gescheider, 1988; Poulton, 1979). However, estimation methods using responses linked
to well-known rules such as familiar physical units (e.g., feet and meters) are less
susceptible to methodological biases (e.g., centering bias and stimulus spacing bias) than
estimation methods using arbitrary units (Poulton, 1979). For the height of people, an
estimation task using familiar physical units ensures that participants understand that they
are to estimate the presumed size of the target person rather than estimate the size of the
image rendered on their screens. Furthermore, an estimation task using familiar units has
application in the criminal justice domain, despite the inaccuracies described earlier. One
contributing factor to these inaccuracies could be how people will bias height estimations
of others towards their own height (Twedt et al., 2015).
Other psychophysical methods we could have potentially used, such as those
outlined by Gescheider (1985), have their own limitations. For example, some
researchers (e.g., Oberfeld & Hecht, 2011; Oberfeld et al., 2010) fear that direct
comparisons such as those in a forced-choice task could emphasize irrelevant differences,
decreasing the possible impact of an illusion. When Coren & Girgus (1972a) compared
five different methods for testing the Müller-Lyer illusion, they found that magnitude
estimation yielded a reliably larger effect size (ω2=0.07) compared to a rating scale task
or a graded series task, and magnitude estimation had the same effect size as a
reproduction task. Pilot testing for this dissertation revealed that a reproduction task was
slow and difficult, making fatigue and attrition potential problems. Furthermore,
29
reproduction tasks might encourage participants to use ad hoc reference strategies (e.g.,
using their own hand length to measure), which could be a problem when conducting
online research.
Anticipated Results
Non-experts Suggestions
We predicted that many of the suggestions of non-experts would parallel those of
experts. Non-experts have heard the many of the “rules” experts have proliferated, which
likely drive what non-experts know about how clothing design impacts perceived height.
More specifically, we predicted that non-experts will suggest monochromatic outfits over
lightness-blocked outfits, and that overall dark outfits will be suggested more than overall
lighter outfits. These generally echo the advice of experts, and also validate that
monochromaticity and lightness-blocking are valid suit design manipulations to explore
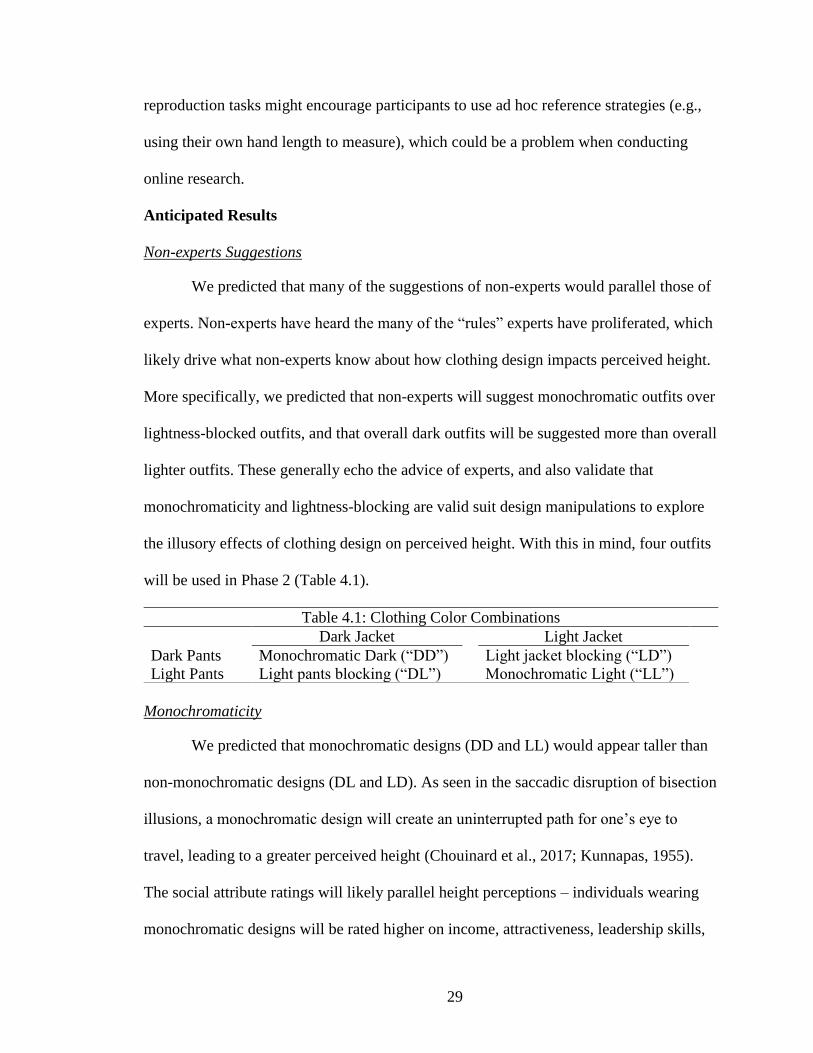
the illusory effects of clothing design on perceived height. With this in mind, four outfits
will be used in Phase 2 (Table 4.1).
Table 4.1: Clothing Color Combinations
Dark Jacket Light Jacket
Dark Pants Monochromatic Dark (“DD”) Light jacket blocking (“LD”)
Light Pants Light pants blocking (“DL”) Monochromatic Light (“LL”)
Monochromaticity
We predicted that monochromatic designs (DD and LL) would appear taller than
non-monochromatic designs (DL and LD). As seen in the saccadic disruption of bisection
illusions, a monochromatic design will create an uninterrupted path for one’s eye to
travel, leading to a greater perceived height (Chouinard et al., 2017; Kunnapas, 1955).
The social attribute ratings will likely parallel height perceptions – individuals wearing
monochromatic designs will be rated higher on income, attractiveness, leadership skills,
30
status, and stylishness. The interaction of monochromaticity with the context
manipulation will likely be minimal as the illusory effects are not derived from false size
constancies induced by the absence of depth cues. Generally speaking, height estimations
in the C- condition will be more erroneous, but monochromaticity is not expected to
interact with these cues in any reliable way.
Lightness
We predicted that the lighter condition (LL) would appear taller than the darker
condition (DD). Lighter objects appear larger, or farther away which leads to the
perception of greater size at the same visual angle, which suggests that lighter suits
should create the illusion of increased height, despite the standard advice from stylists to
select darker colors to increase the perception of height. The social attribute ratings may
diverge from the height estimations. The darker suit may have higher ratings because of
the traditionally ubiquitous nature of the dark suit, along with experts suggesting darker
colors. Unlike monochromaticity, the context manipulation will likely interact with
lightness. If the lightness illusion occurs because lighter objects appear farther away, then
the lightness manipulations may create greater illusions in the C- condition because there
is not additional information to correct inaccuracies in distance estimates caused by
lightness.
Lightness blocking
We predicted that the lighter pants condition (DL) will appear taller than the
lighter jacket condition (LD). As discussed above, lighter objects appear larger, and
based on the anthropometric proportions of leg length to overall height, the appearance of
longer legs should create the appearance of greater overall height. The social attribute
ratings will likely parallel the height estimations, where the lighter pants condition will be
31
rated higher, especially as this lightness blocking is likely more familiar due to
similarities to the traditional, preppy, “Ivy League” style of a dark blazer with khaki
pants. However, experts suggest a lighter jacket to increase height because dark pants
will purportedly grab attention first, forcing the viewer to scan up the full length of the
body to create the illusion of height (Centeno, 2011b). The context manipulation will
likely interact with the lightness blocking manipulation for the same reasons discussed
regarding overall lightness effects.
Chapter 5: Phase 1 – Survey of non-experts
Our literature review revealed suggestions from experts about how to create the
illusion that someone is taller than they really are through different clothing design
choices, with two general heuristics arising: 1) reduce features, especially horizontal
lines; 2) lengthen proportions, especially legs. However, rather than assume nonexperts
shared these views, we conducted a survey to see if individuals who worked outside of
the clothing design industry used the similar heuristics, including reducing features by
wearing monochromatic outfits.
Methods
Phase 1 was an online qualitative survey used to investigate heuristics employed
by non-experts to choose clothing that would create the illusion of increased height.
Participants
Two hundred thirty-two participants (F=146, M=86) completed the survey, with a
mean age of 34 years. We recruited participants from Amazon Mechanical Turk with the
limitation that they must be in the United States to complete the survey. Participants
received $1.50 compensation, with an average completion time of four minutes.
32
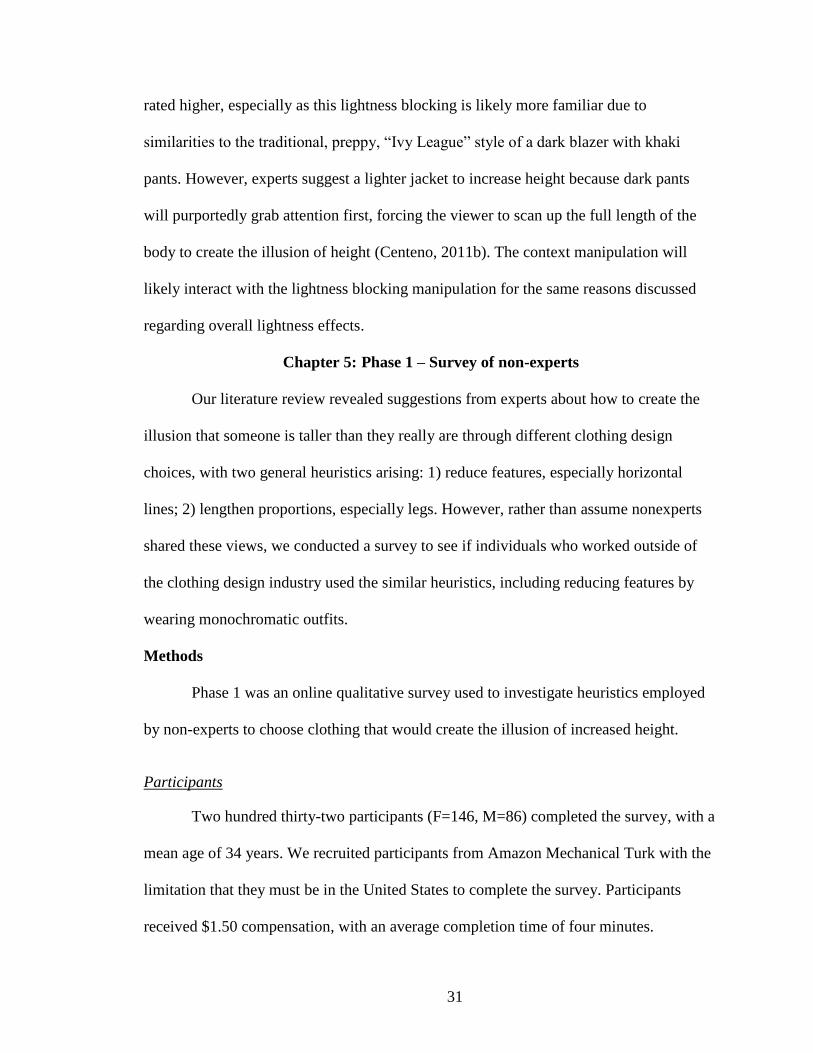
Participants reported owning 2 suits (on average), and 56% of the participants reported
wearing a suit at least once a year, with 7% reporting wearing a suit at least once a week.
The most commonly reported professions/educational backgrounds were business (25%)
and education (13%), with no participants reporting being designers or working in the
fashion industry. Male participants’ reported heights ranged from 63 inches to 79
(median=71) while female participants’ reported heights ranged from 58 to 70 inches
(median=65). During exploration into the data, analyses included the participants’ heights
as a covariate, and the results paralleled those presented below (without controlling for
the participants’ heights). Table 5.1 includes the sample sizes among the demographic
groups, but we excluded participants of median height in their respective gender group
from a follow-up gender x height chi-squared analysis of suggestion frequencies (19 M
excluded, 23 F excluded).
Table 5.1 - Demographic groups (gender and height), with their
height ranges and sample sizes.
Short Tall
Male n=38 n=29
Female n=63 n=60
Materials and Procedure
Participants completed the survey on Qualtrics using their own computers. This
survey had three parts: open-ended advice, forced-choice advice, and demographic
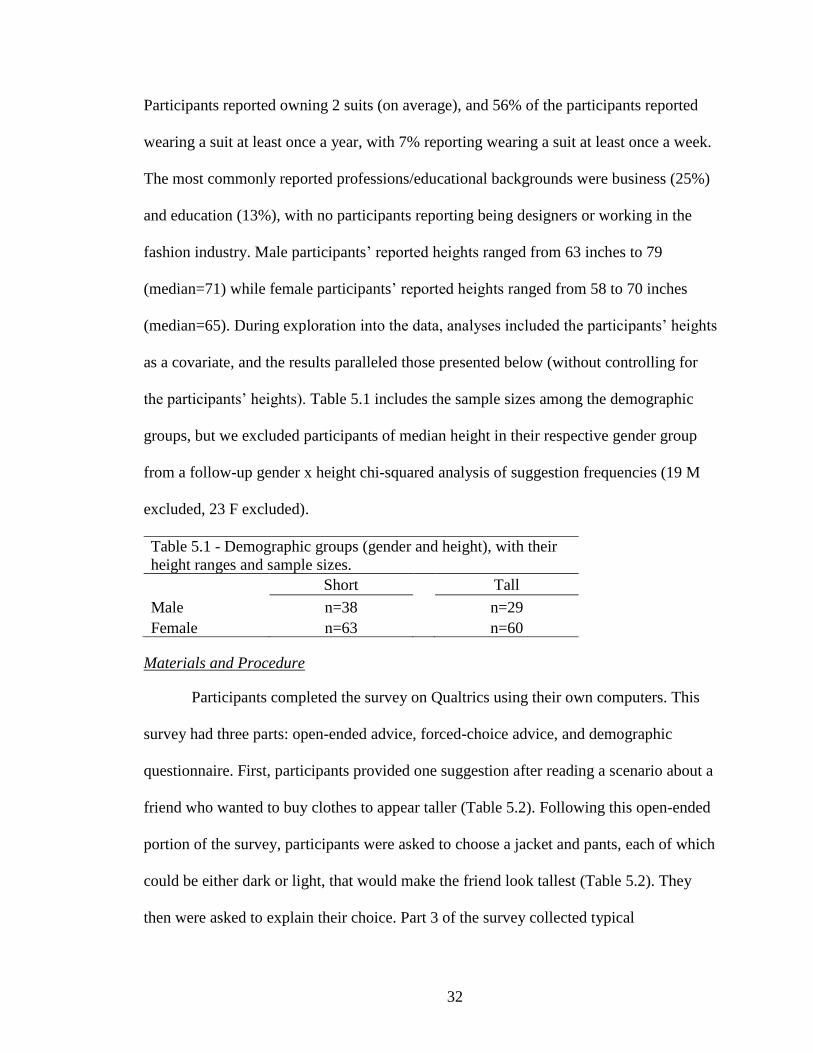
questionnaire. First, participants provided one suggestion after reading a scenario about a
friend who wanted to buy clothes to appear taller (Table 5.2). Following this open-ended
portion of the survey, participants were asked to choose a jacket and pants, each of which
could be either dark or light, that would make the friend look tallest (Table 5.2). They
then were asked to explain their choice. Part 3 of the survey collected typical
33
demographic information including gender, age, height, background (education or
profession), and suit ownership and exposure.
Table 5.2 - Qualitative survey questions for Phase 1
Imagine that your friend is looking to buy some formal clothes, including (but not
limited to) a new jacket and some pants. Your friend is a little on the short side, and
wants to get some clothes that will make him appear taller.
What advice would you give your friend to make him look taller? This suggestion can
be positive ("wear this") or negative ("avoid that").
Please be specific and detailed in your responses, but don't be restrained - imagine that
your friend can customize every aspect of these clothes (sizes, styles, colors, materials,
accessories, etc.).
__________________________________________
[page break]
More specifically, what color jacket and what color pants would you suggest to your
short friend?
Jacket Color:
o Light color (example: tan or light grey)
o Dark color (example: navy or dark grey)
Pants Color:
o Light color (example: tan or light grey)
o Dark color (example: navy or dark grey)
Why do you suggest that jackets/pants color combination?
__________________________________________
Results
Participants’ suggestions were coded according to six categories, largely based on
the suggestions provided from suit experts (Table 5.3). The primary researcher and a
second researcher coded the individual suggestions offered by each participant.
Agreement among the scorers was high, as reflected in a kappa of 0.83.
34
Table 5.3: The six coding categories (with examples) of non-experts’ suggestions for
increasing perceived height
Reduce Features Global Changes Lengthen Proportions
• Monochromatic
• Avoid belts (or keep
thin, low contrast)
• Minimize accessories
• No vests
• No pocket flaps (or
extra pockets, such as
ticket pockets)
• No jacket vents
• No pant cuffs
• Hide socks, have
them match pants
• Overall colors
suggestions (dark vs.
light)
• Add vertical patterns
• Avoid horizontal
patterns
• Specific textures
and/or materials
• Shorter jacket
• Raise pants waist
• Button jacket at waist
(just above navel)
• High lapel notches
and gorge
• Long lapel rolls (deep
V)
• If have accessories,
place them high
• Shorter trouser rise
Silhouette Change Physiological Other
• Good tailoring
• Fit (tighter or bigger)
• Hat
• Taller hair
• Taller shoes
• Bigger shoulders
• Work out / lose
weight
• Better posture
• Do stretches
• Smile
• Be comfortable in
your own skin
• Anything else that
does not fit into one
of the other categories
What do non-experts suggest? (open-ended)
According to the frequency percentages of each category presented in Table 5.4,
the two most common design suggestions were global changes (38.84%) and silhouette
changes (35.71%). Because participants were not told to avoid changing the silhouette, it
is no surprise that they suggested changes such as wearing taller shoes and avoiding
baggy clothes. Global change suggestions most frequently referenced stripes, either
wearing vertical (18.02%) or avoiding horizontal (5.41%). This reflects the proliferation
of heuristics regarding stripes in clothing design discussed in Chapter 1. However,
participants also suggested wearing dark colors (6.76%). The third most common
category of suggestions was reduce features (10.71%). Most of these suggestions
mentioned monochromaticity, independent of brightness or hue (7.66%). Interestingly,
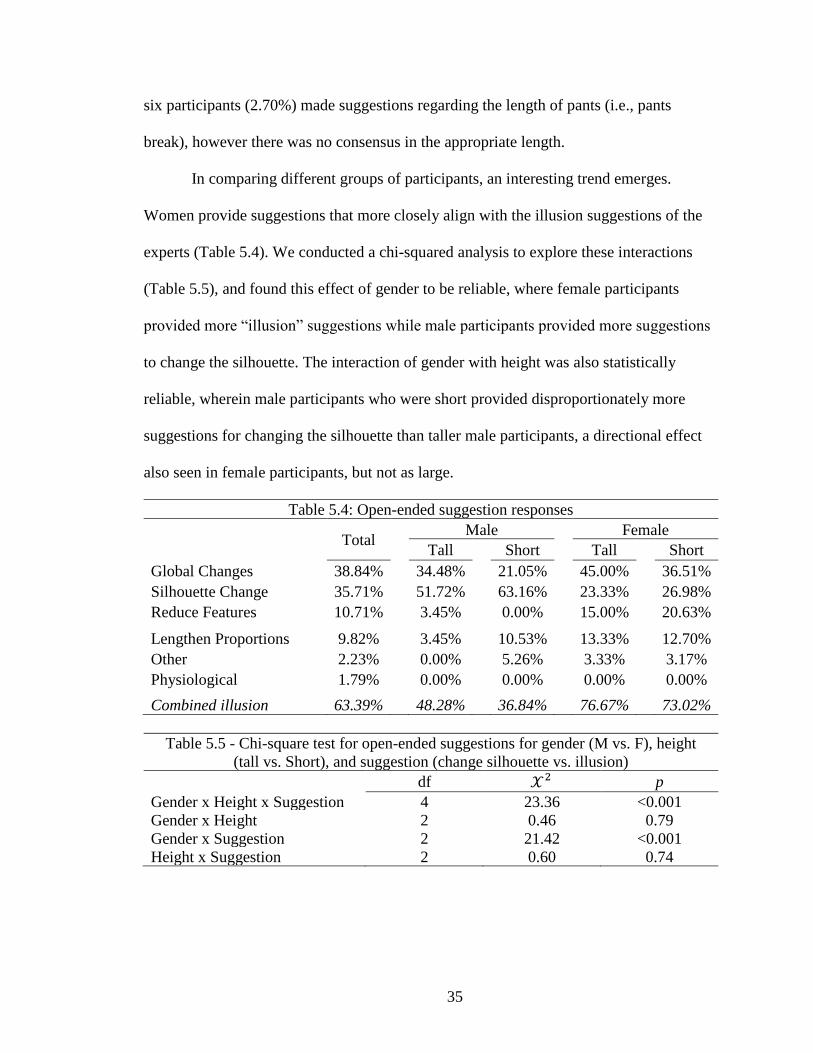
35
six participants (2.70%) made suggestions regarding the length of pants (i.e., pants
break), however there was no consensus in the appropriate length.
In comparing different groups of participants, an interesting trend emerges.
Women provide suggestions that more closely align with the illusion suggestions of the
experts (Table 5.4). We conducted a chi-squared analysis to explore these interactions
(Table 5.5), and found this effect of gender to be reliable, where female participants
provided more “illusion” suggestions while male participants provided more suggestions
to change the silhouette. The interaction of gender with height was also statistically
reliable, wherein male participants who were short provided disproportionately more
suggestions for changing the silhouette than taller male participants, a directional effect
also seen in female participants, but not as large.
Table 5.4: Open-ended suggestion responses
Total Male Female
Tall Short Tall Short
Global Changes 38.84% 34.48% 21.05% 45.00% 36.51%
Silhouette Change 35.71% 51.72% 63.16% 23.33% 26.98%
Reduce Features 10.71% 3.45% 0.00% 15.00% 20.63%
Lengthen Proportions 9.82% 3.45% 10.53% 13.33% 12.70%
Other 2.23% 0.00% 5.26% 3.33% 3.17%
Physiological 1.79% 0.00% 0.00% 0.00% 0.00%
Combined illusion 63.39% 48.28% 36.84% 76.67% 73.02%
Table 5.5 - Chi-square test for open-ended suggestions for gender (M vs. F), height
(tall vs. Short), and suggestion (change silhouette vs. illusion)
df 𝒳2 p
Gender x Height x Suggestion 4 23.36 <0.001
Gender x Height 2 0.46 0.79
Gender x Suggestion 2 21.42 <0.001
Height x Suggestion 2 0.60 0.74
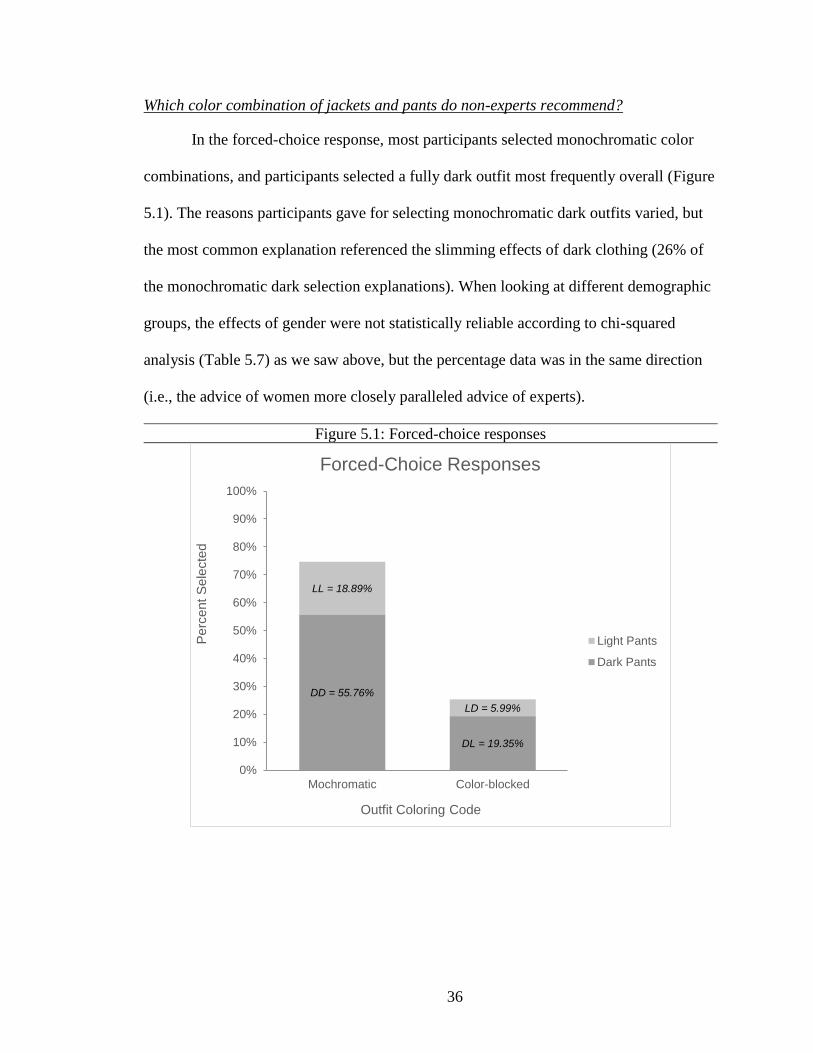
36
Which color combination of jackets and pants do non-experts recommend?
In the forced-choice response, most participants selected monochromatic color
combinations, and participants selected a fully dark outfit most frequently overall (Figure
5.1). The reasons participants gave for selecting monochromatic dark outfits varied, but
the most common explanation referenced the slimming effects of dark clothing (26% of
the monochromatic dark selection explanations). When looking at different demographic
groups, the effects of gender were not statistically reliable according to chi-squared
analysis (Table 5.7) as we saw above, but the percentage data was in the same direction
(i.e., the advice of women more closely paralleled advice of experts).
Figure 5.1: Forced-choice responses
DD = 55.76%
DL = 19.35%
LL = 18.89%
LD = 5.99%
0%
10%
20%
30%
40%
50%
60%
70%
80%
90%
100%
Mochromatic Color-blocked
Perc
ent
Sele
cte
d
Outfit Coloring Code
Forced-Choice Responses
Light Pants
Dark Pants
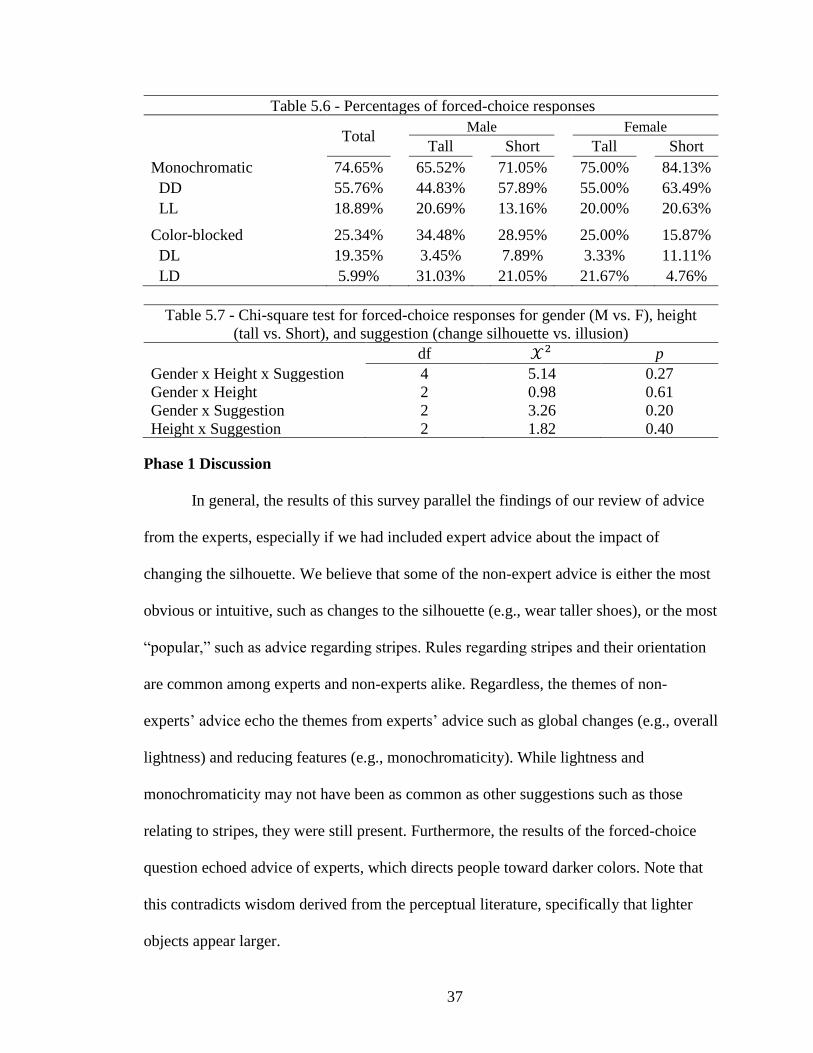
37
Table 5.6 - Percentages of forced-choice responses
Total Male Female
Tall Short Tall Short
Monochromatic 74.65% 65.52% 71.05% 75.00% 84.13%
DD 55.76% 44.83% 57.89% 55.00% 63.49%
LL 18.89% 20.69% 13.16% 20.00% 20.63%
Color-blocked 25.34% 34.48% 28.95% 25.00% 15.87%
DL 19.35% 3.45% 7.89% 3.33% 11.11%
LD 5.99% 31.03% 21.05% 21.67% 4.76%
Table 5.7 - Chi-square test for forced-choice responses for gender (M vs. F), height
(tall vs. Short), and suggestion (change silhouette vs. illusion)
df 𝒳2 p
Gender x Height x Suggestion 4 5.14 0.27
Gender x Height 2 0.98 0.61
Gender x Suggestion 2 3.26 0.20
Height x Suggestion 2 1.82 0.40
Phase 1 Discussion
In general, the results of this survey parallel the findings of our review of advice
from the experts, especially if we had included expert advice about the impact of
changing the silhouette. We believe that some of the non-expert advice is either the most
obvious or intuitive, such as changes to the silhouette (e.g., wear taller shoes), or the most
“popular,” such as advice regarding stripes. Rules regarding stripes and their orientation
are common among experts and non-experts alike. Regardless, the themes of non-
experts’ advice echo the themes from experts’ advice such as global changes (e.g., overall
lightness) and reducing features (e.g., monochromaticity). While lightness and
monochromaticity may not have been as common as other suggestions such as those
relating to stripes, they were still present. Furthermore, the results of the forced-choice
question echoed advice of experts, which directs people toward darker colors. Note that
this contradicts wisdom derived from the perceptual literature, specifically that lighter
objects appear larger.
38
In exploring effects among different demographics groups, we found that women
provided more open-ended suggestions which aligned with the illusion suggestions of
experts. One explanation is that women have sought these types of suggestions, or they
make more of an effort to retain those suggestions, to combat the nature of generally
being shorter in the overall population. It is also interesting to note the interaction of
height with this gender effect, wherein shorter male participants provided the most
suggestions pertaining to changes in the silhouette. One explanation could be that shorter
men have tried creating illusions but have not felt any meaningful effects. For example, if
a shorter man is wearing a monochromatic outfit, he will still be physically looking up to
see taller counterparts, but taller shoes will reduce the amount of “looking up” he will
have to do. These key findings – the focus by experts and nonexperts alike on
monochromaticity and overall darkness – provide additional justification for our choice
of suit manipulations in the remainder of this dissertation.
Chapter 6: Phase 2 – Effects of Outfit Design and Context on Height Estimation and
Social Ratings
In Phase 1 and the literature review in Chapter 1, we found that experts and
nonexperts believe some general heuristics to create the illusion of increased height.
However, the validity of these claims is suspect, as data-driven research to investigate
these claims is sparse. In Phase 2, we will discuss a data-driven research approach to
investigate the illusory effects clothing may have on height perception.
Phase 2 Research Design
Phase 2 utilized a 2 (context) x 4 (outfit) x 50 (target) mixed-factor design, with
context and outfit designs manipulated between subjects and targets manipulated within
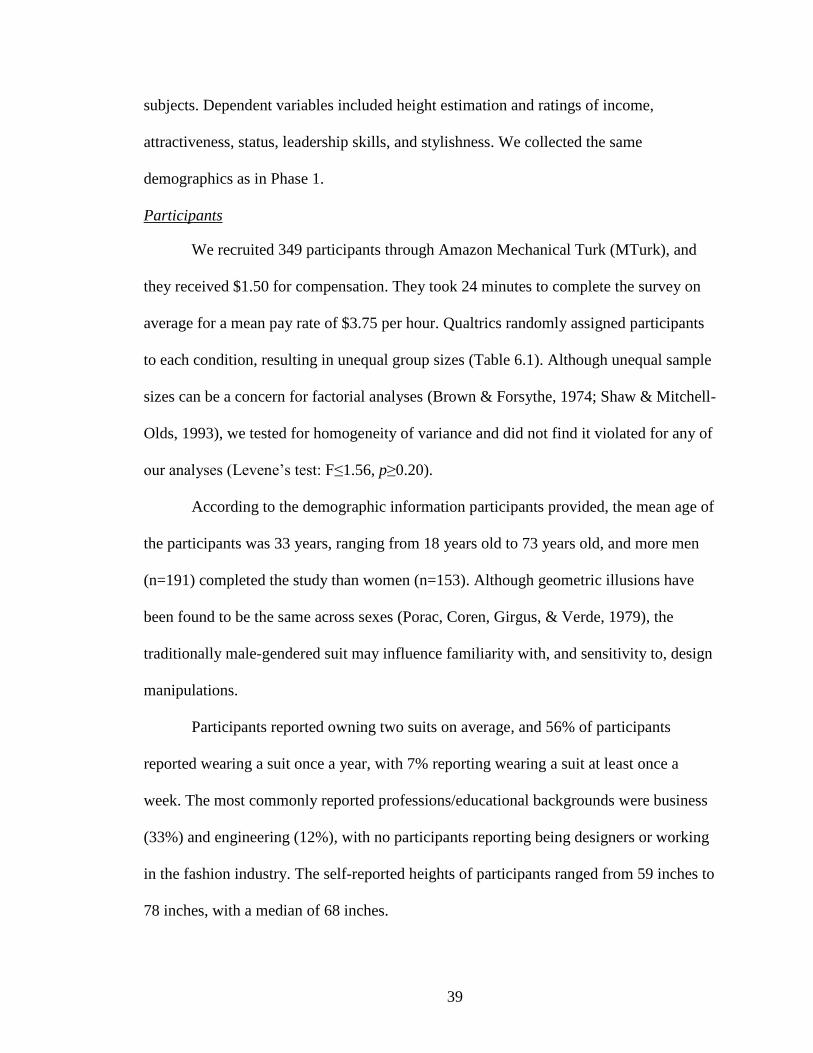
39
subjects. Dependent variables included height estimation and ratings of income,
attractiveness, status, leadership skills, and stylishness. We collected the same
demographics as in Phase 1.
Participants
We recruited 349 participants through Amazon Mechanical Turk (MTurk), and
they received $1.50 for compensation. They took 24 minutes to complete the survey on
average for a mean pay rate of $3.75 per hour. Qualtrics randomly assigned participants
to each condition, resulting in unequal group sizes (Table 6.1). Although unequal sample
sizes can be a concern for factorial analyses (Brown & Forsythe, 1974; Shaw & Mitchell-
Olds, 1993), we tested for homogeneity of variance and did not find it violated for any of
our analyses (Levene’s test: F≤1.56, p≥0.20).
According to the demographic information participants provided, the mean age of
the participants was 33 years, ranging from 18 years old to 73 years old, and more men
(n=191) completed the study than women (n=153). Although geometric illusions have
been found to be the same across sexes (Porac, Coren, Girgus, & Verde, 1979), the
traditionally male-gendered suit may influence familiarity with, and sensitivity to, design
manipulations.
Participants reported owning two suits on average, and 56% of participants
reported wearing a suit once a year, with 7% reporting wearing a suit at least once a
week. The most commonly reported professions/educational backgrounds were business
(33%) and engineering (12%), with no participants reporting being designers or working
in the fashion industry. The self-reported heights of participants ranged from 59 inches to
78 inches, with a median of 68 inches.
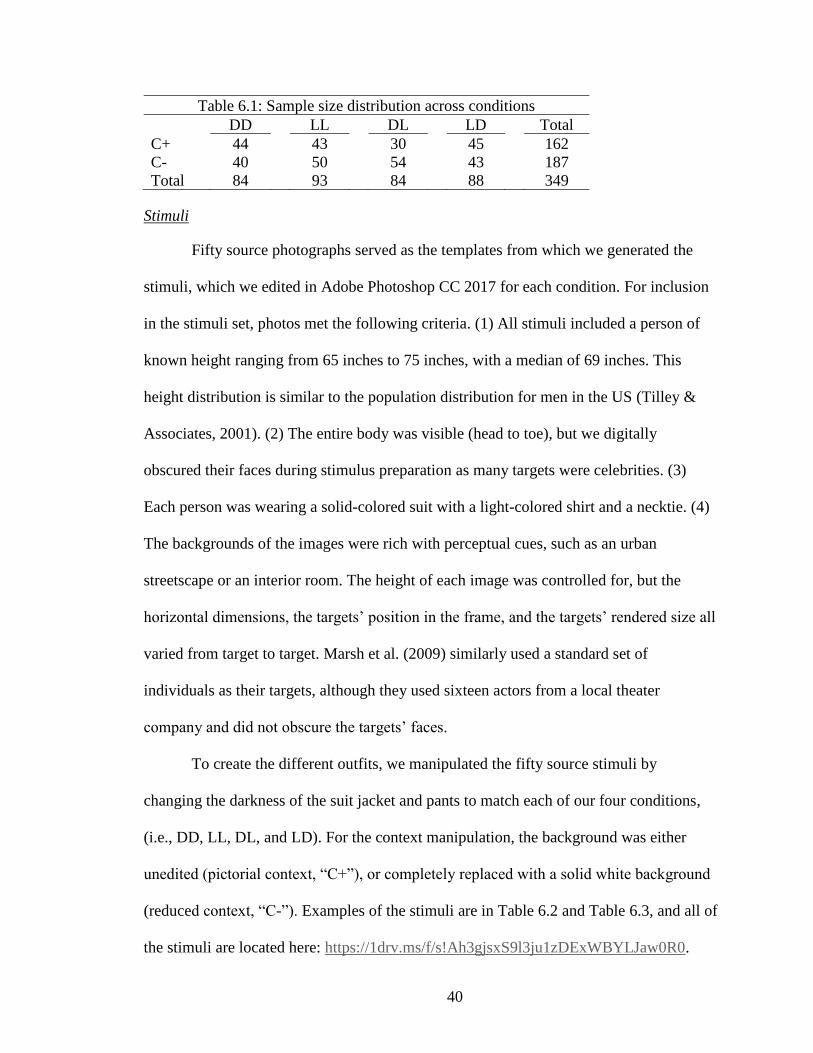
40
Table 6.1: Sample size distribution across conditions
DD LL DL LD Total
C+ 44 43 30 45 162
C- 40 50 54 43 187
Total 84 93 84 88 349
Stimuli
Fifty source photographs served as the templates from which we generated the
stimuli, which we edited in Adobe Photoshop CC 2017 for each condition. For inclusion
in the stimuli set, photos met the following criteria. (1) All stimuli included a person of
known height ranging from 65 inches to 75 inches, with a median of 69 inches. This
height distribution is similar to the population distribution for men in the US (Tilley &
Associates, 2001). (2) The entire body was visible (head to toe), but we digitally
obscured their faces during stimulus preparation as many targets were celebrities. (3)
Each person was wearing a solid-colored suit with a light-colored shirt and a necktie. (4)
The backgrounds of the images were rich with perceptual cues, such as an urban
streetscape or an interior room. The height of each image was controlled for, but the
horizontal dimensions, the targets’ position in the frame, and the targets’ rendered size all
varied from target to target. Marsh et al. (2009) similarly used a standard set of
individuals as their targets, although they used sixteen actors from a local theater
company and did not obscure the targets’ faces.
To create the different outfits, we manipulated the fifty source stimuli by
changing the darkness of the suit jacket and pants to match each of our four conditions,
(i.e., DD, LL, DL, and LD). For the context manipulation, the background was either
unedited (pictorial context, “C+”), or completely replaced with a solid white background
(reduced context, “C-”). Examples of the stimuli are in Table 6.2 and Table 6.3, and all of
the stimuli are located here: https://1drv.ms/f/s!Ah3gjsxS9l3ju1zDExWBYLJaw0R0.
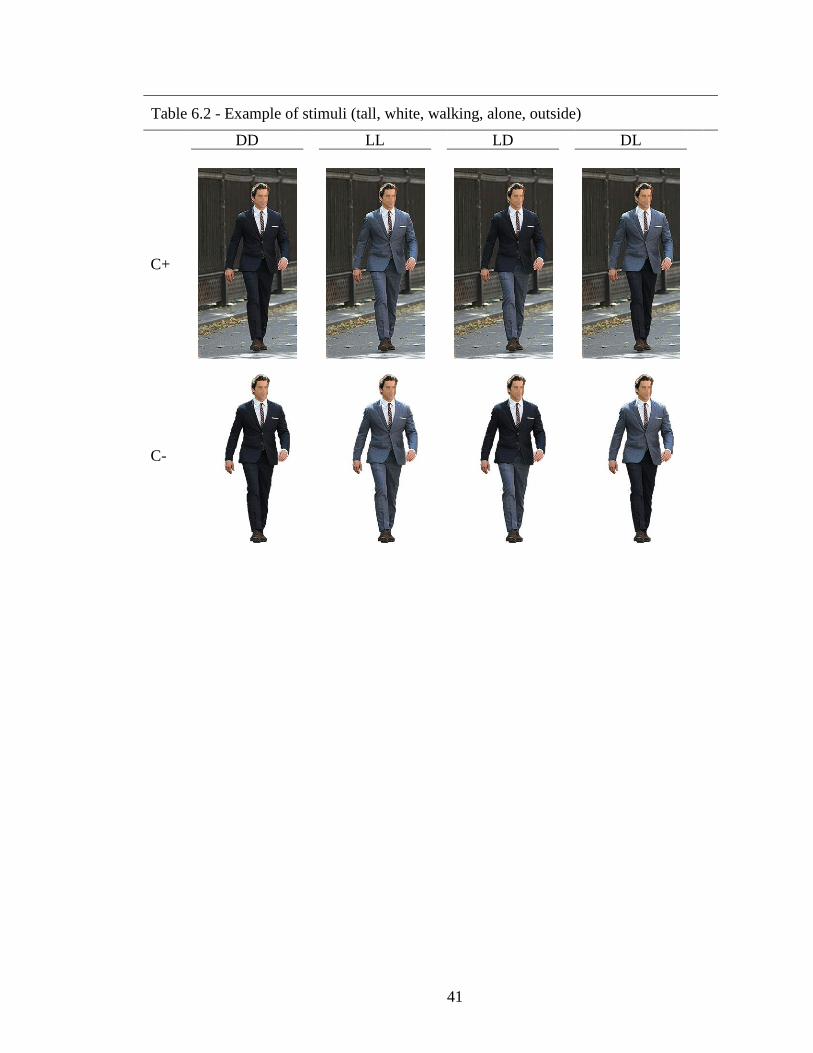
41
Table 6.2 - Example of stimuli (tall, white, walking, alone, outside)
DD LL LD DL
C+
C-
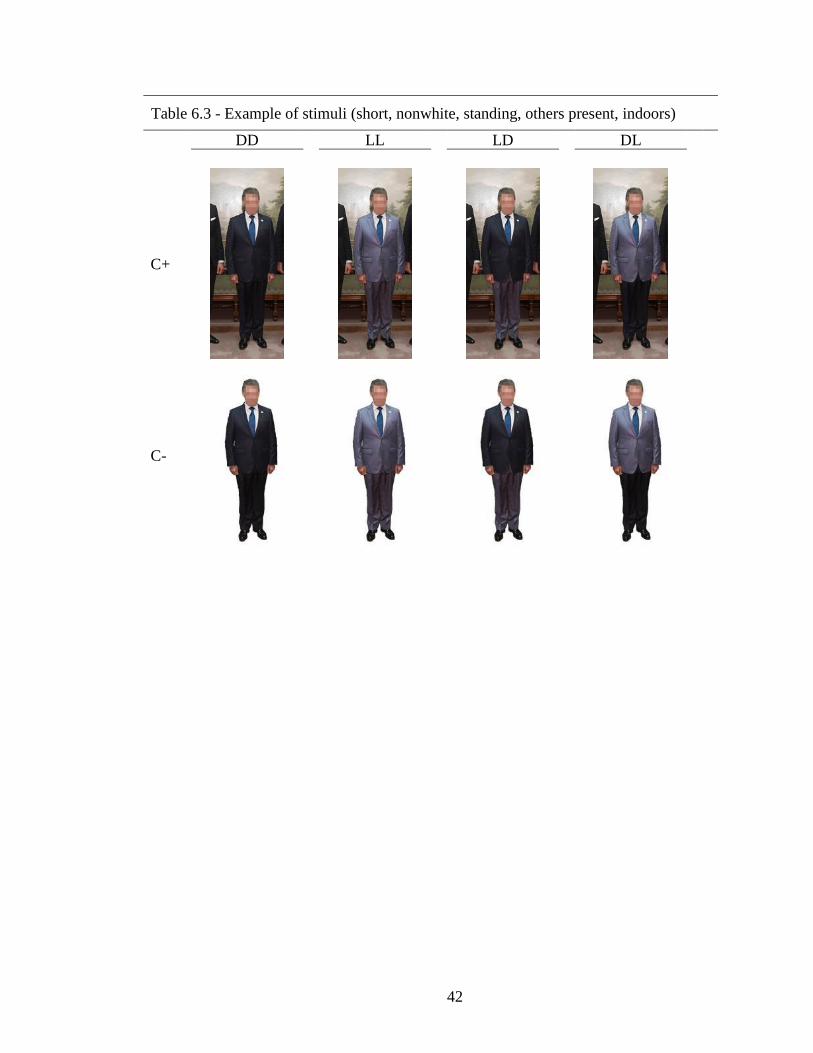
42
Table 6.3 - Example of stimuli (short, nonwhite, standing, others present, indoors)
DD LL LD DL
C+
C-
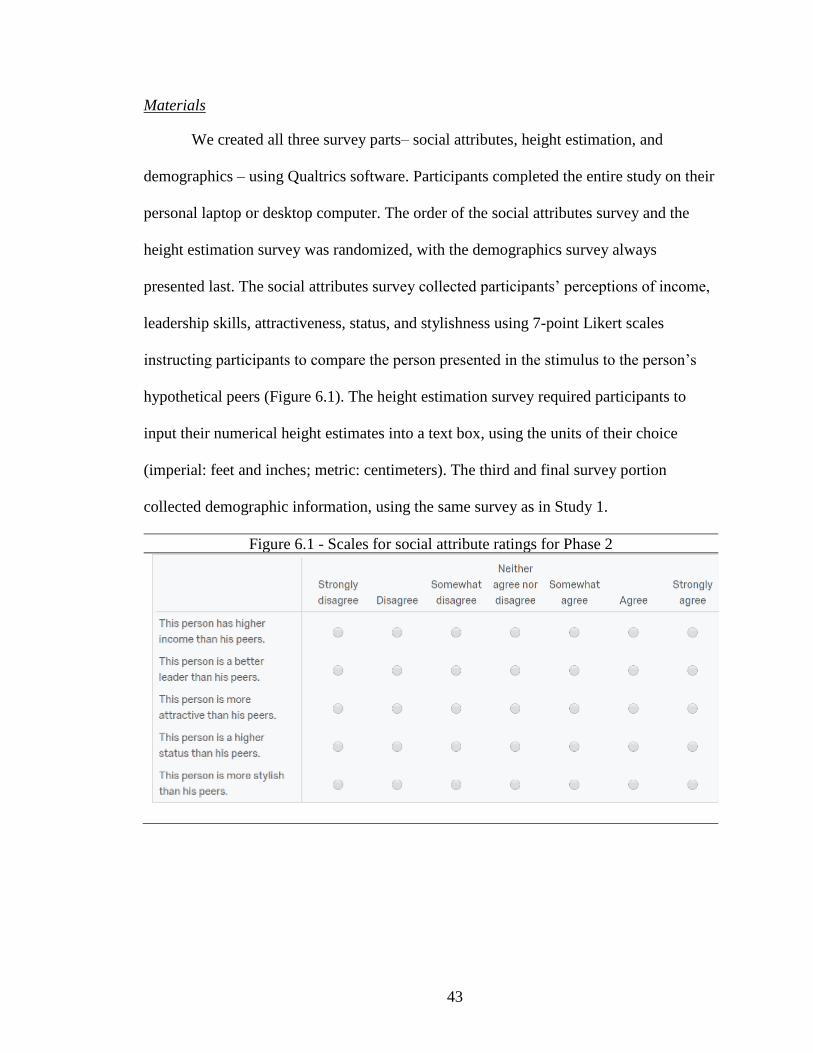
43
Materials
We created all three survey parts– social attributes, height estimation, and
demographics – using Qualtrics software. Participants completed the entire study on their
personal laptop or desktop computer. The order of the social attributes survey and the
height estimation survey was randomized, with the demographics survey always
presented last. The social attributes survey collected participants’ perceptions of income,
leadership skills, attractiveness, status, and stylishness using 7-point Likert scales
instructing participants to compare the person presented in the stimulus to the person’s
hypothetical peers (Figure 6.1). The height estimation survey required participants to
input their numerical height estimates into a text box, using the units of their choice
(imperial: feet and inches; metric: centimeters). The third and final survey portion
collected demographic information, using the same survey as in Study 1.
Figure 6.1 - Scales for social attribute ratings for Phase 2
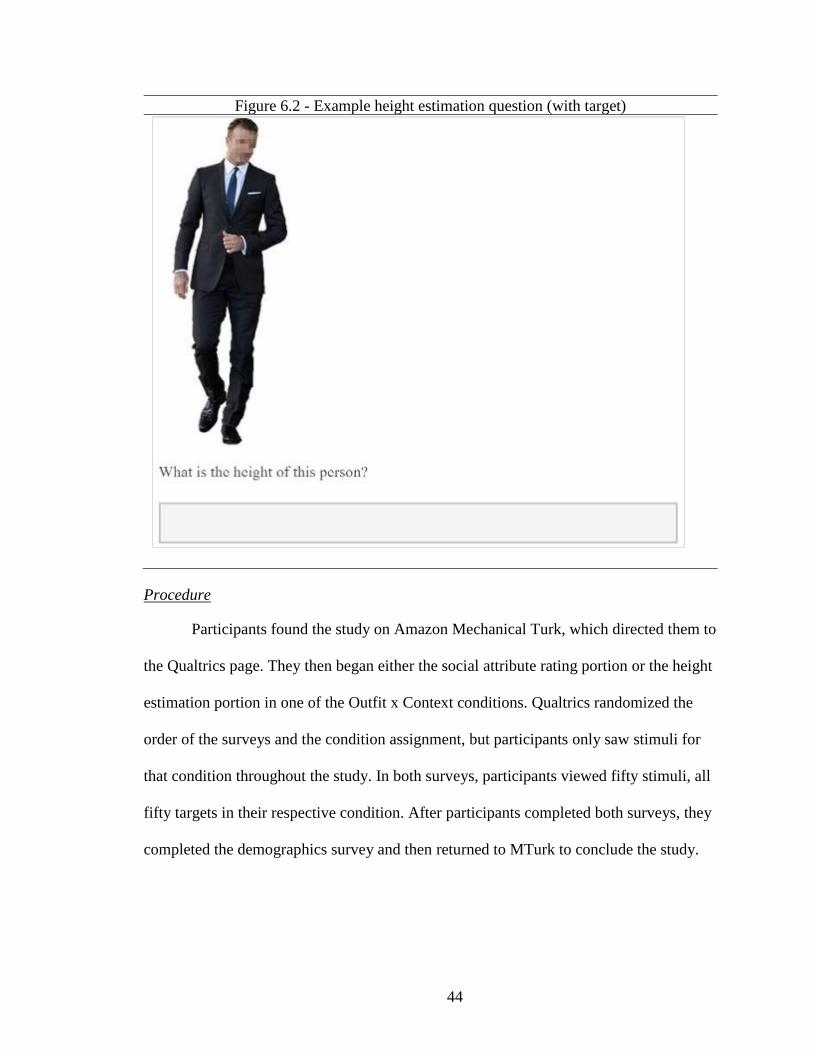
44
Figure 6.2 - Example height estimation question (with target)
Procedure
Participants found the study on Amazon Mechanical Turk, which directed them to
the Qualtrics page. They then began either the social attribute rating portion or the height
estimation portion in one of the Outfit x Context conditions. Qualtrics randomized the
order of the surveys and the condition assignment, but participants only saw stimuli for
that condition throughout the study. In both surveys, participants viewed fifty stimuli, all
fifty targets in their respective condition. After participants completed both surveys, they
completed the demographics survey and then returned to MTurk to conclude the study.
45
Analysis
We transformed all estimates into inches for our analyses (two participants
responded in centimeters, while the rest responded in feet and inches). We calculated
error by taking the absolute value of the estimates’ difference from the targets’ actual
height (as reported by online sources). Additionally, we categorized existing
characteristics of the images into non-outfit attributes, specifically coding based on two
person-oriented attributes and two environment-oriented attributes (Table 6.4). We did
not manipulate these non-outfit attributes in Photoshop as we did for the outfits. Rather,
using the images we selected based on the constraints for the primary analyses, we sorted
and categorized those existing images based on specific attributes for additional
exploratory analyses.
The person-oriented attributes were race (white & nonwhite) and stance (walking
and standing). We created an additional category of height stratification dividing thirds
by height, but we did not include data from the analysis of this factor in the present
dissertation because the findings parallel those presented in the sections referencing the
relations among dependent variables. However, we included the height stratification
categorization in the “Disadvantaged Groups” section to focus on the effects of our suit
manipulations on shorter individuals.
There were two categories for variations among environment-oriented attributes:
presence of other people (alone, man present, woman present), and location (indoors and
outdoors). The presence of other people categorization includes some overlap between
genders, as some targets’ backgrounds had both men and women present. The only full
body visible in the stimuli was the targets’, but portions of other people were visible in 30
of the images.
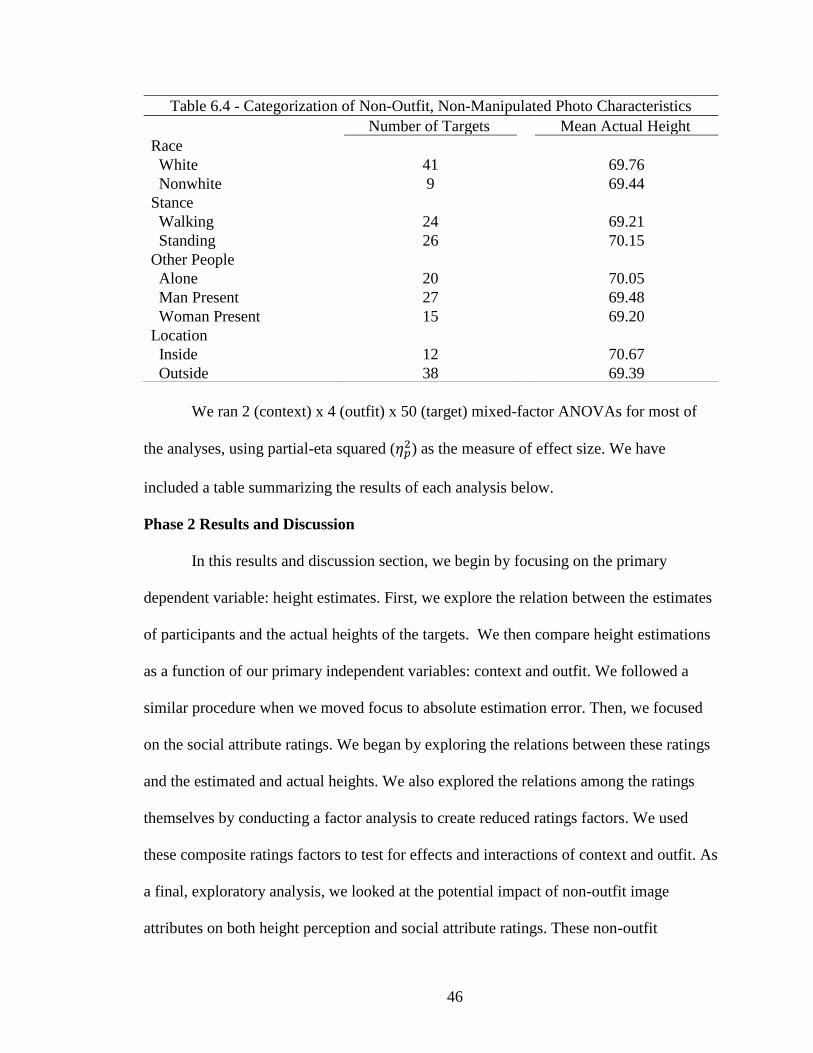
46
We ran 2 (context) x 4 (outfit) x 50 (target) mixed-factor ANOVAs for most of
the analyses, using partial-eta squared (𝜂𝑝2) as the measure of effect size. We have
included a table summarizing the results of each analysis below.
Phase 2 Results and Discussion
In this results and discussion section, we begin by focusing on the primary
dependent variable: height estimates. First, we explore the relation between the estimates
of participants and the actual heights of the targets. We then compare height estimations
as a function of our primary independent variables: context and outfit. We followed a
similar procedure when we moved focus to absolute estimation error. Then, we focused
on the social attribute ratings. We began by exploring the relations between these ratings
and the estimated and actual heights. We also explored the relations among the ratings
themselves by conducting a factor analysis to create reduced ratings factors. We used
these composite ratings factors to test for effects and interactions of context and outfit. As
a final, exploratory analysis, we looked at the potential impact of non-outfit image
attributes on both height perception and social attribute ratings. These non-outfit
Table 6.4 - Categorization of Non-Outfit, Non-Manipulated Photo Characteristics
Number of Targets Mean Actual Height
Race White 41 69.76
Nonwhite 9 69.44
Stance Walking 24 69.21
Standing 26 70.15
Other People Alone 20 70.05
Man Present 27 69.48
Woman Present 15 69.20
Location Inside 12 70.67
Outside 38 69.39
47
attributes included whether the target is walking or standing, is inside or outside, is white
or nonwhite, and is alone or with others (Table 6.4). Lastly we explored the impact of suit
design specifically on those subgroups who stand to gain the most social capital from
being perceived as taller. We identified two groups as a focus: shorter individuals (the
shorter third of targets) and nonwhite targets.
Height Estimates
As we discussed in Chapter 4, the primary dependent measure in this study is
participants’ height. We predicted, based on research on perceptual illusions, that
monochromatic outfits appear taller than lightness-blocked outfits, and that lighter outfits
would appear taller than darker outfits.
Is there a relationship between the actual heights and the estimated heights of targets?
We conducted a bivariate linear regression to explore the relations between the
targets’ actual heights and the means of the targets’ estimated heights, averaging
participants’ estimates across outfit and context conditions for each of the fifty targets.
Thirty-six percent of the variance was explained (R2=0.36), suggesting that participants
were not incredibly accurate in their estimates, but they were on the right track. More
importantly, 64% of the variance in height estimates was due to something other than the
actual height of the target. The same approximate amount of variance is explained for
each outfit (DD: R2=0.34, DL: R2=0.32, LD: R2=0.33, LL: R2=0.36), but some more of
the variance was explained when focusing on targets with full context (C+: R2=0.42) than
targets without (C-: R2=0.26). We will discuss the differences in C+ and C- when we
discuss the height estimate errors in a later section.
Yes, there is a positive relationship between the actual heights and the estimated
heights of targets.
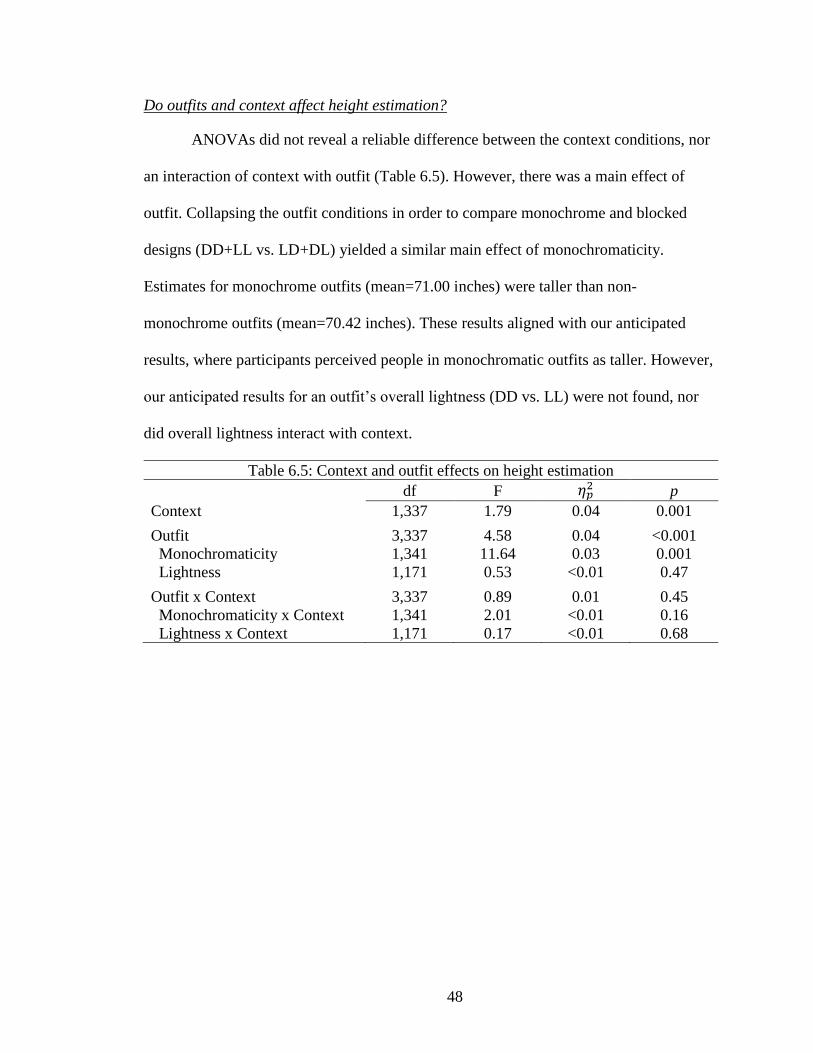
48
Do outfits and context affect height estimation?
ANOVAs did not reveal a reliable difference between the context conditions, nor
an interaction of context with outfit (Table 6.5). However, there was a main effect of
outfit. Collapsing the outfit conditions in order to compare monochrome and blocked
designs (DD+LL vs. LD+DL) yielded a similar main effect of monochromaticity.
Estimates for monochrome outfits (mean=71.00 inches) were taller than non-
monochrome outfits (mean=70.42 inches). These results aligned with our anticipated
results, where participants perceived people in monochromatic outfits as taller. However,
our anticipated results for an outfit’s overall lightness (DD vs. LL) were not found, nor
did overall lightness interact with context.
Table 6.5: Context and outfit effects on height estimation
df F 𝜂𝑝2 p
Context 1,337 1.79 0.04 0.001
Outfit 3,337 4.58 0.04 <0.001
Monochromaticity 1,341 11.64 0.03 0.001
Lightness 1,171 0.53 <0.01 0.47
Outfit x Context 3,337 0.89 0.01 0.45
Monochromaticity x Context 1,341 2.01 <0.01 0.16
Lightness x Context 1,171 0.17 <0.01 0.68
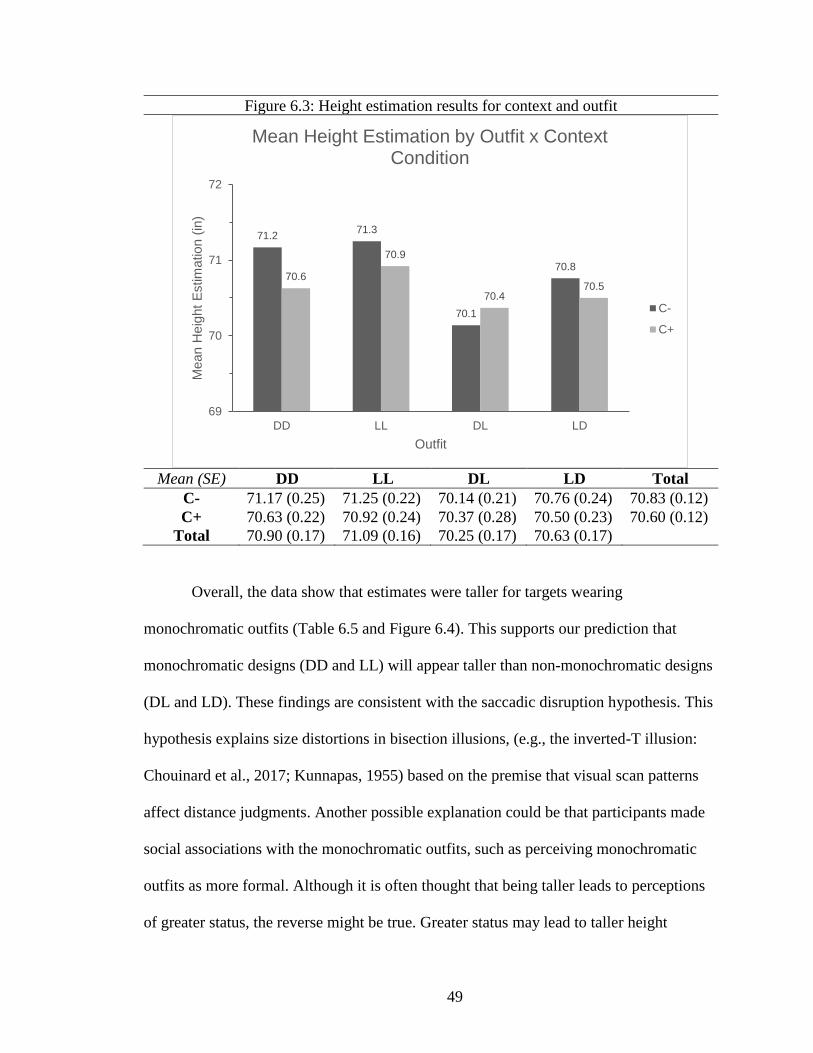
49
Figure 6.3: Height estimation results for context and outfit
Mean (SE) DD LL DL LD Total
C- 71.17 (0.25) 71.25 (0.22) 70.14 (0.21) 70.76 (0.24) 70.83 (0.12)
C+ 70.63 (0.22) 70.92 (0.24) 70.37 (0.28) 70.50 (0.23) 70.60 (0.12)
Total 70.90 (0.17) 71.09 (0.16) 70.25 (0.17) 70.63 (0.17)
Overall, the data show that estimates were taller for targets wearing
monochromatic outfits (Table 6.5 and Figure 6.4). This supports our prediction that
monochromatic designs (DD and LL) will appear taller than non-monochromatic designs
(DL and LD). These findings are consistent with the saccadic disruption hypothesis. This
hypothesis explains size distortions in bisection illusions, (e.g., the inverted-T illusion:
Chouinard et al., 2017; Kunnapas, 1955) based on the premise that visual scan patterns
affect distance judgments. Another possible explanation could be that participants made
social associations with the monochromatic outfits, such as perceiving monochromatic
outfits as more formal. Although it is often thought that being taller leads to perceptions
of greater status, the reverse might be true. Greater status may lead to taller height
71.271.3
70.1
70.870.6
70.9
70.470.5
69
70
71
72
DD LL DL LD
Mean H
eig
ht
Estim
ation (
in)
Outfit
Mean Height Estimation by Outfit x Context Condition
C-
C+
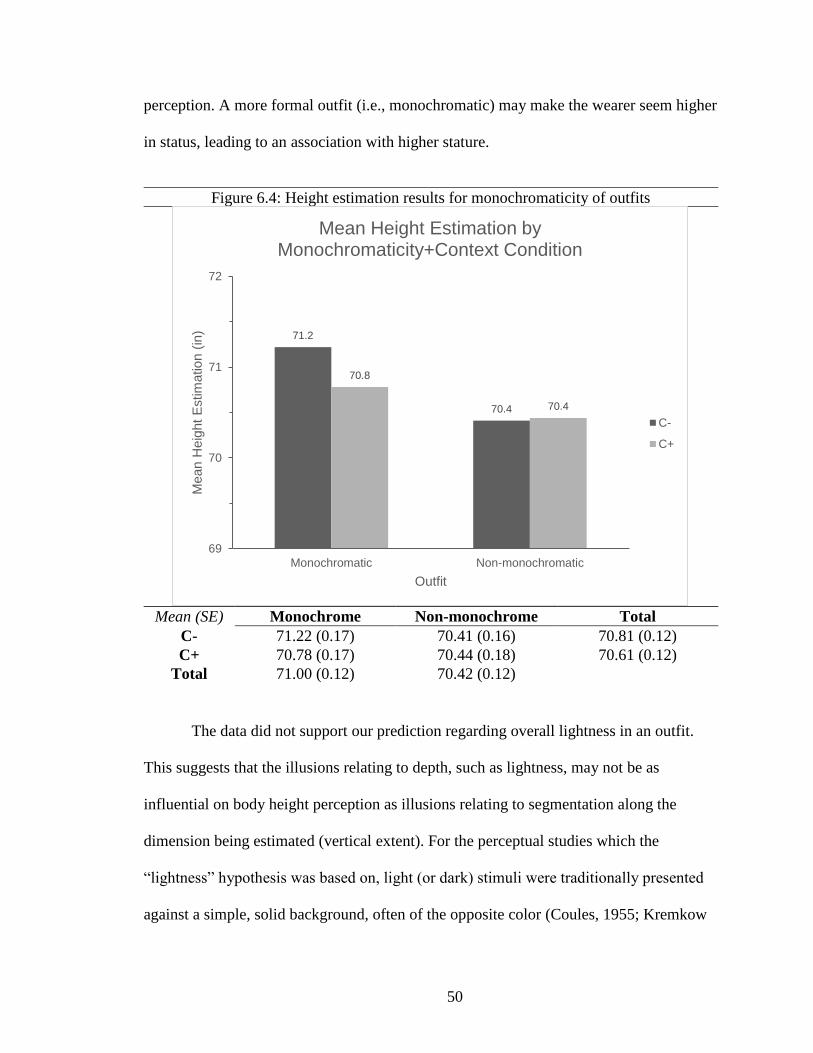
50
perception. A more formal outfit (i.e., monochromatic) may make the wearer seem higher
in status, leading to an association with higher stature.
The data did not support our prediction regarding overall lightness in an outfit.
This suggests that the illusions relating to depth, such as lightness, may not be as
influential on body height perception as illusions relating to segmentation along the
dimension being estimated (vertical extent). For the perceptual studies which the
“lightness” hypothesis was based on, light (or dark) stimuli were traditionally presented
against a simple, solid background, often of the opposite color (Coules, 1955; Kremkow
Figure 6.4: Height estimation results for monochromaticity of outfits
Mean (SE) Monochrome Non-monochrome Total
C- 71.22 (0.17) 70.41 (0.16) 70.81 (0.12)
C+ 70.78 (0.17) 70.44 (0.18) 70.61 (0.12)
Total 71.00 (0.12) 70.42 (0.12)
71.2
70.4
70.8
70.4
69
70
71
72
Monochromatic Non-monochromatic
Mean H
eig
ht
Estim
ation (
in)
Outfit
Mean Height Estimation by Monochromaticity+Context Condition
C-
C+
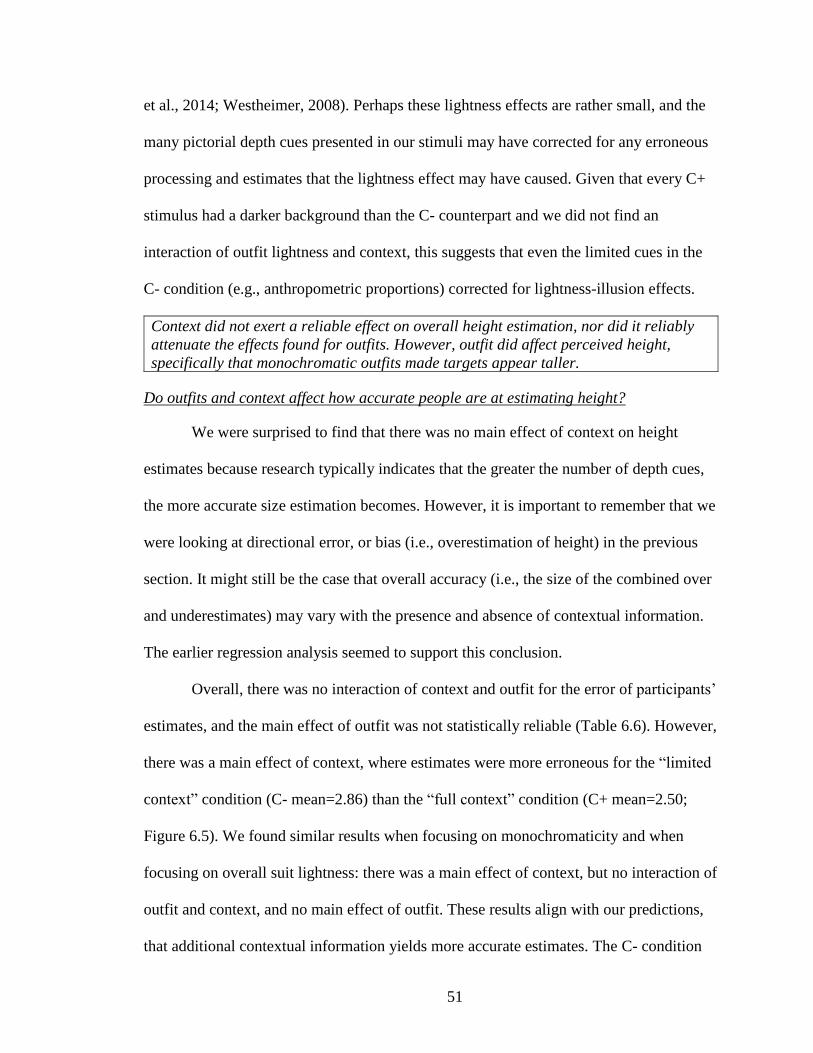
51
et al., 2014; Westheimer, 2008). Perhaps these lightness effects are rather small, and the
many pictorial depth cues presented in our stimuli may have corrected for any erroneous
processing and estimates that the lightness effect may have caused. Given that every C+
stimulus had a darker background than the C- counterpart and we did not find an
interaction of outfit lightness and context, this suggests that even the limited cues in the
C- condition (e.g., anthropometric proportions) corrected for lightness-illusion effects.
Context did not exert a reliable effect on overall height estimation, nor did it reliably
attenuate the effects found for outfits. However, outfit did affect perceived height,
specifically that monochromatic outfits made targets appear taller.
Do outfits and context affect how accurate people are at estimating height?
We were surprised to find that there was no main effect of context on height
estimates because research typically indicates that the greater the number of depth cues,
the more accurate size estimation becomes. However, it is important to remember that we
were looking at directional error, or bias (i.e., overestimation of height) in the previous
section. It might still be the case that overall accuracy (i.e., the size of the combined over
and underestimates) may vary with the presence and absence of contextual information.
The earlier regression analysis seemed to support this conclusion.
Overall, there was no interaction of context and outfit for the error of participants’
estimates, and the main effect of outfit was not statistically reliable (Table 6.6). However,
there was a main effect of context, where estimates were more erroneous for the “limited
context” condition (C- mean=2.86) than the “full context” condition (C+ mean=2.50;
Figure 6.5). We found similar results when focusing on monochromaticity and when
focusing on overall suit lightness: there was a main effect of context, but no interaction of
outfit and context, and no main effect of outfit. These results align with our predictions,
that additional contextual information yields more accurate estimates. The C- condition
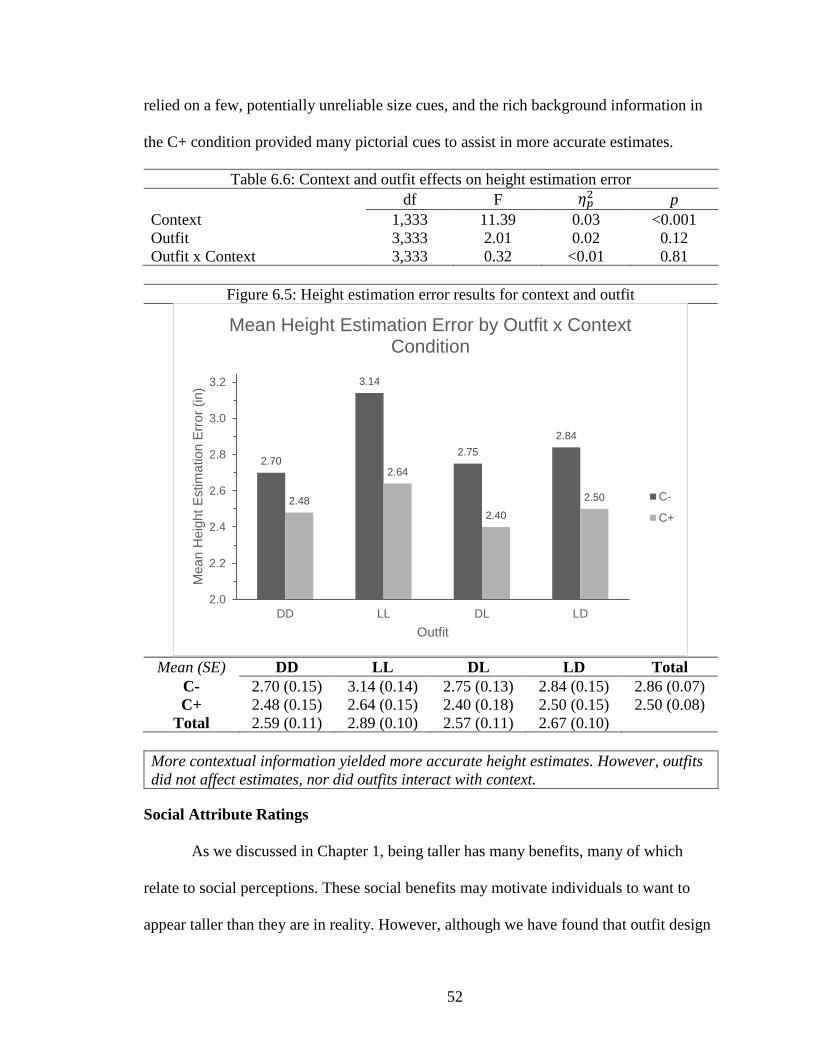
52
relied on a few, potentially unreliable size cues, and the rich background information in
the C+ condition provided many pictorial cues to assist in more accurate estimates.
Table 6.6: Context and outfit effects on height estimation error
df F 𝜂𝑝2 p
Context 1,333 11.39 0.03 <0.001
Outfit 3,333 2.01 0.02 0.12
Outfit x Context 3,333 0.32 <0.01 0.81
Figure 6.5: Height estimation error results for context and outfit
Mean (SE) DD LL DL LD Total
C- 2.70 (0.15) 3.14 (0.14) 2.75 (0.13) 2.84 (0.15) 2.86 (0.07)
C+ 2.48 (0.15) 2.64 (0.15) 2.40 (0.18) 2.50 (0.15) 2.50 (0.08)
Total 2.59 (0.11) 2.89 (0.10) 2.57 (0.11) 2.67 (0.10)
More contextual information yielded more accurate height estimates. However, outfits
did not affect estimates, nor did outfits interact with context.
Social Attribute Ratings
As we discussed in Chapter 1, being taller has many benefits, many of which
relate to social perceptions. These social benefits may motivate individuals to want to
appear taller than they are in reality. However, although we have found that outfit design
2.70
3.14
2.75
2.84
2.48
2.64
2.40
2.50
2.0
2.2
2.4
2.6
2.8
3.0
3.2
DD LL DL LD
Mean H
eig
ht
Estim
ation E
rror
(in)
Outfit
Mean Height Estimation Error by Outfit x Context Condition
C-
C+
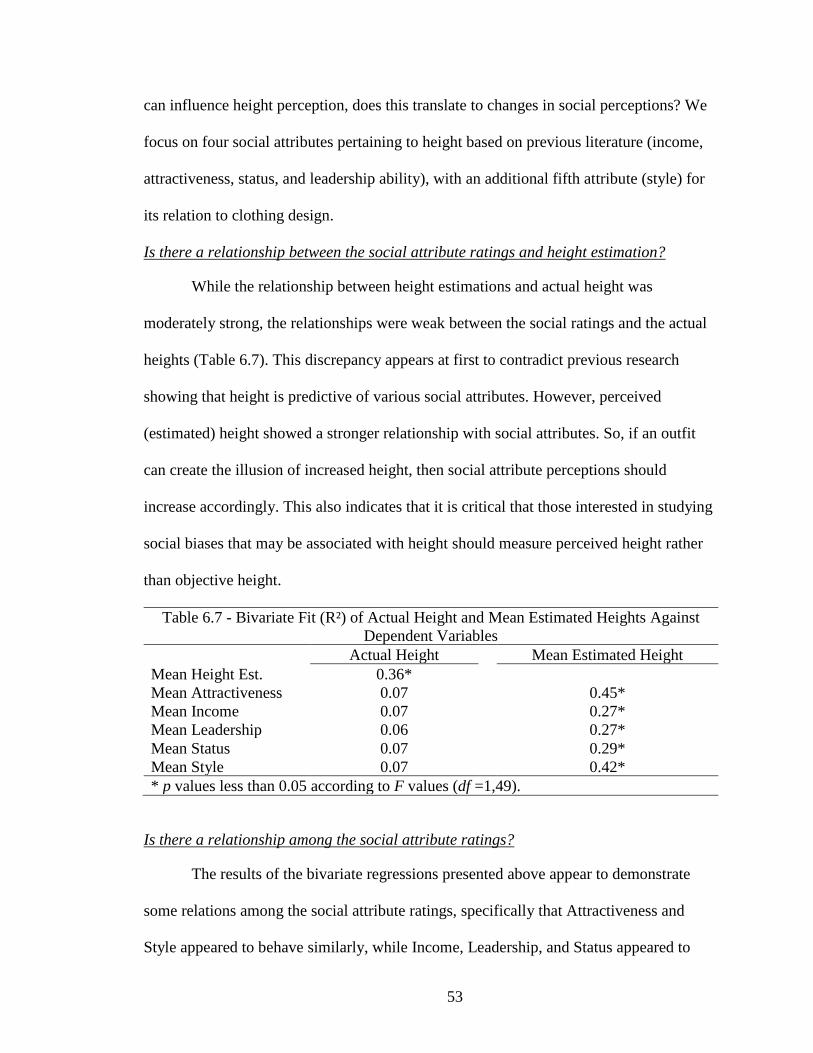
53
can influence height perception, does this translate to changes in social perceptions? We
focus on four social attributes pertaining to height based on previous literature (income,
attractiveness, status, and leadership ability), with an additional fifth attribute (style) for
its relation to clothing design.
Is there a relationship between the social attribute ratings and height estimation?
While the relationship between height estimations and actual height was
moderately strong, the relationships were weak between the social ratings and the actual
heights (Table 6.7). This discrepancy appears at first to contradict previous research
showing that height is predictive of various social attributes. However, perceived
(estimated) height showed a stronger relationship with social attributes. So, if an outfit
can create the illusion of increased height, then social attribute perceptions should
increase accordingly. This also indicates that it is critical that those interested in studying
social biases that may be associated with height should measure perceived height rather
than objective height.
Table 6.7 - Bivariate Fit (R²) of Actual Height and Mean Estimated Heights Against
Dependent Variables
Actual Height Mean Estimated Height
Mean Height Est. 0.36*
Mean Attractiveness 0.07 0.45*
Mean Income 0.07 0.27*
Mean Leadership 0.06 0.27*
Mean Status 0.07 0.29*
Mean Style 0.07 0.42*
* p values less than 0.05 according to F values (df =1,49).
Is there a relationship among the social attribute ratings?
The results of the bivariate regressions presented above appear to demonstrate
some relations among the social attribute ratings, specifically that Attractiveness and
Style appeared to behave similarly, while Income, Leadership, and Status appeared to
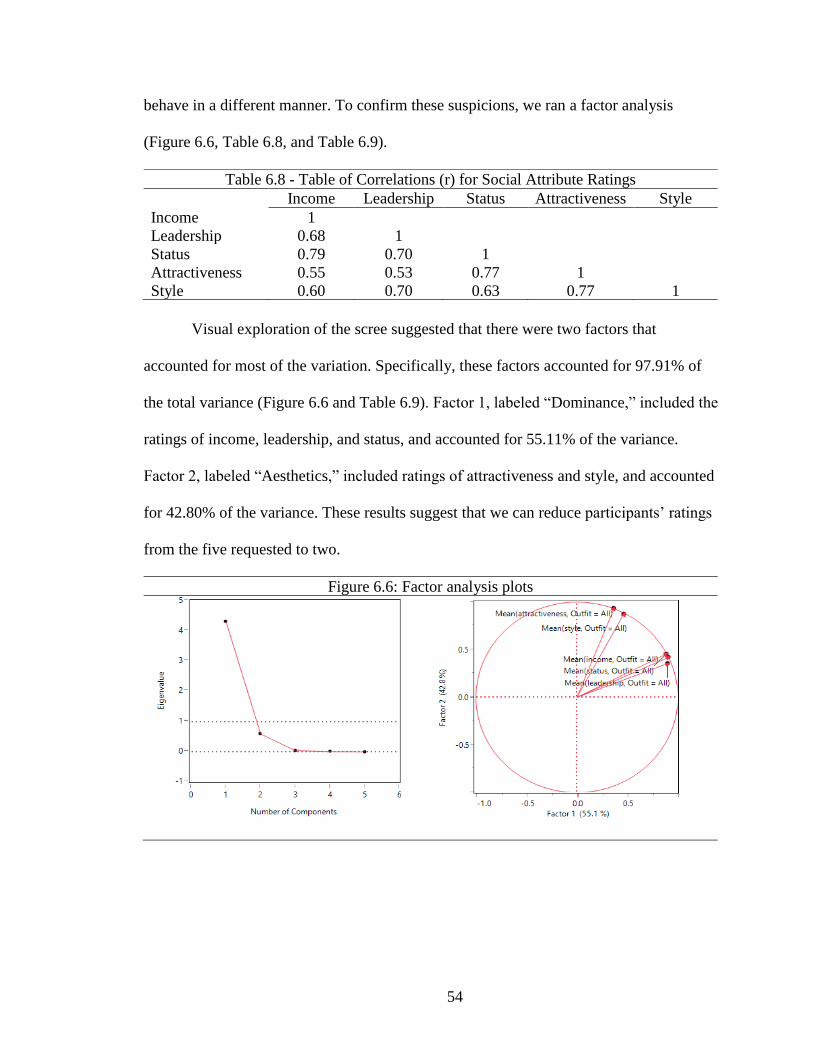
54
behave in a different manner. To confirm these suspicions, we ran a factor analysis
(Figure 6.6, Table 6.8, and Table 6.9).
Visual exploration of the scree suggested that there were two factors that
accounted for most of the variation. Specifically, these factors accounted for 97.91% of
the total variance (Figure 6.6 and Table 6.9). Factor 1, labeled “Dominance,” included the
ratings of income, leadership, and status, and accounted for 55.11% of the variance.
Factor 2, labeled “Aesthetics,” included ratings of attractiveness and style, and accounted
for 42.80% of the variance. These results suggest that we can reduce participants’ ratings
from the five requested to two.
Figure 6.6: Factor analysis plots
Table 6.8 - Table of Correlations (r) for Social Attribute Ratings
Income Leadership Status Attractiveness Style
Income 1
Leadership 0.68 1
Status 0.79 0.70 1
Attractiveness 0.55 0.53 0.77 1
Style 0.60 0.70 0.63 0.77 1
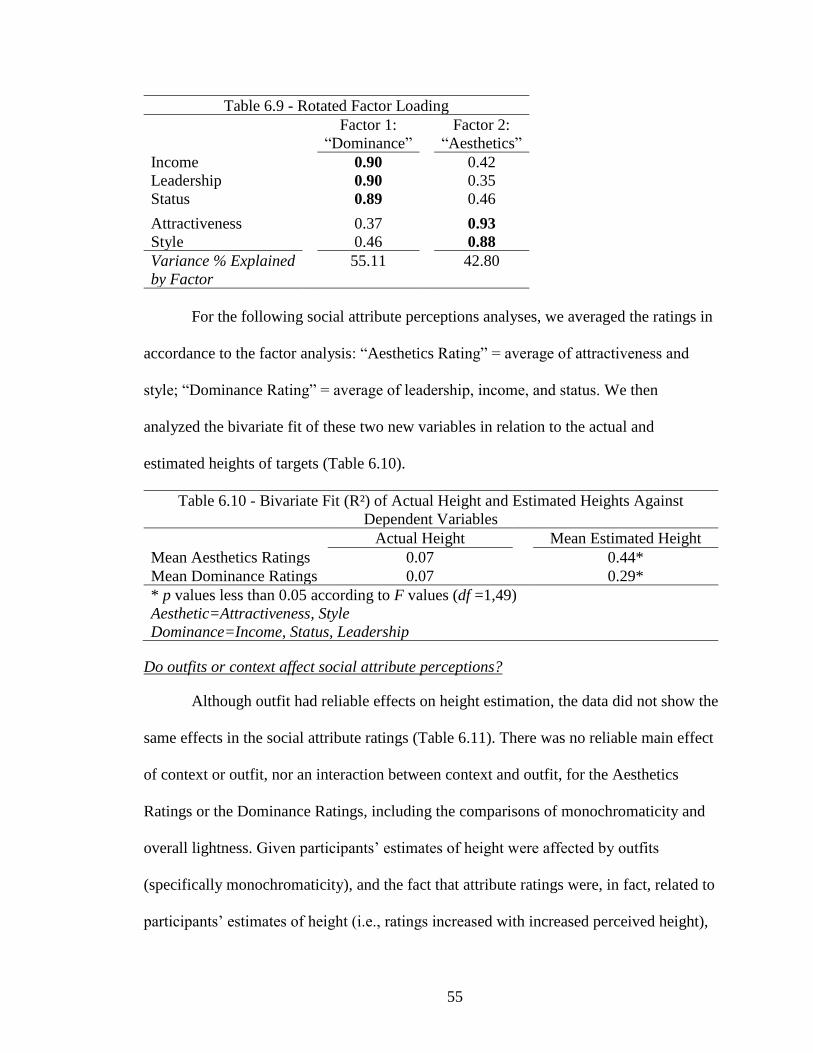
55
Table 6.9 - Rotated Factor Loading
Factor 1:
“Dominance”
Factor 2:
“Aesthetics”
Income 0.90 0.42
Leadership 0.90 0.35
Status 0.89 0.46
Attractiveness 0.37 0.93
Style 0.46 0.88
Variance % Explained
by Factor
55.11 42.80
For the following social attribute perceptions analyses, we averaged the ratings in
accordance to the factor analysis: “Aesthetics Rating” = average of attractiveness and
style; “Dominance Rating” = average of leadership, income, and status. We then
analyzed the bivariate fit of these two new variables in relation to the actual and
estimated heights of targets (Table 6.10).
Table 6.10 - Bivariate Fit (R²) of Actual Height and Estimated Heights Against
Dependent Variables Actual Height Mean Estimated Height
Mean Aesthetics Ratings 0.07 0.44*
Mean Dominance Ratings 0.07 0.29*
* p values less than 0.05 according to F values (df =1,49)
Aesthetic=Attractiveness, Style
Dominance=Income, Status, Leadership
Do outfits or context affect social attribute perceptions?
Although outfit had reliable effects on height estimation, the data did not show the
same effects in the social attribute ratings (Table 6.11). There was no reliable main effect
of context or outfit, nor an interaction between context and outfit, for the Aesthetics
Ratings or the Dominance Ratings, including the comparisons of monochromaticity and
overall lightness. Given participants’ estimates of height were affected by outfits
(specifically monochromaticity), and the fact that attribute ratings were, in fact, related to
participants’ estimates of height (i.e., ratings increased with increased perceived height),
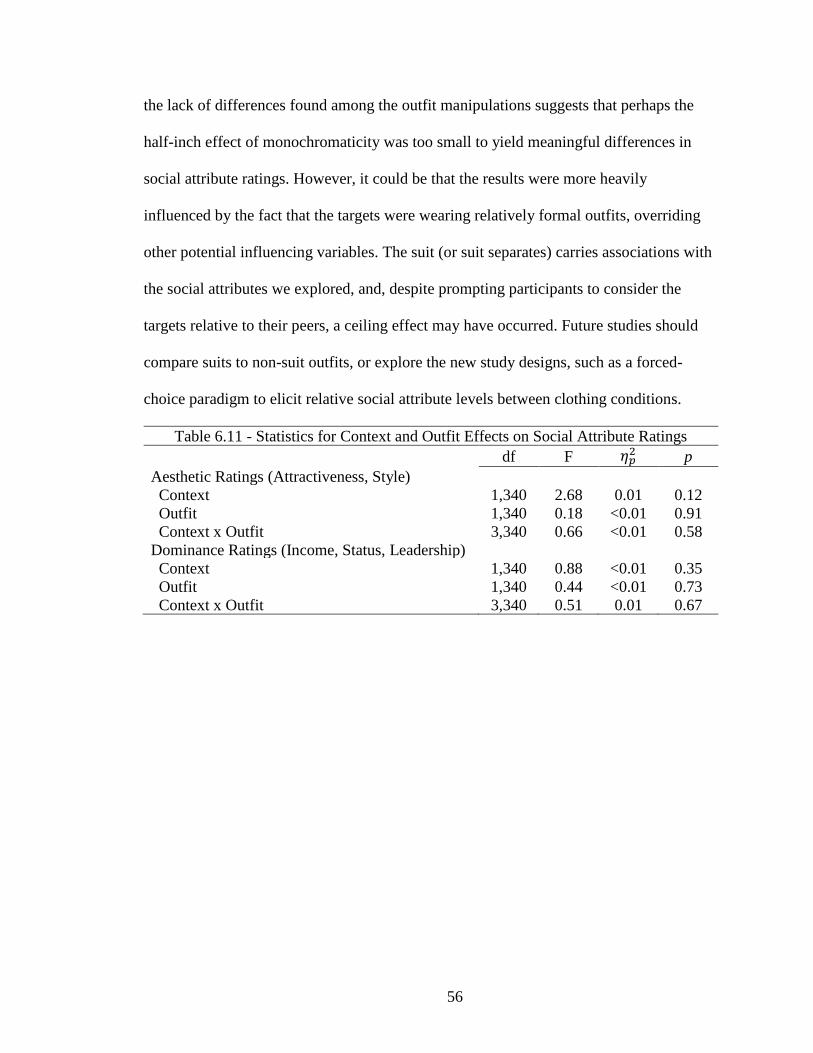
56
the lack of differences found among the outfit manipulations suggests that perhaps the
half-inch effect of monochromaticity was too small to yield meaningful differences in
social attribute ratings. However, it could be that the results were more heavily
influenced by the fact that the targets were wearing relatively formal outfits, overriding
other potential influencing variables. The suit (or suit separates) carries associations with
the social attributes we explored, and, despite prompting participants to consider the
targets relative to their peers, a ceiling effect may have occurred. Future studies should
compare suits to non-suit outfits, or explore the new study designs, such as a forced-
choice paradigm to elicit relative social attribute levels between clothing conditions.
Table 6.11 - Statistics for Context and Outfit Effects on Social Attribute Ratings
df F 𝜂𝑝2 p
Aesthetic Ratings (Attractiveness, Style)
Context 1,340 2.68 0.01 0.12
Outfit 1,340 0.18 <0.01 0.91
Context x Outfit 3,340 0.66 <0.01 0.58
Dominance Ratings (Income, Status, Leadership)
Context 1,340 0.88 <0.01 0.35
Outfit 1,340 0.44 <0.01 0.73
Context x Outfit 3,340 0.51 0.01 0.67
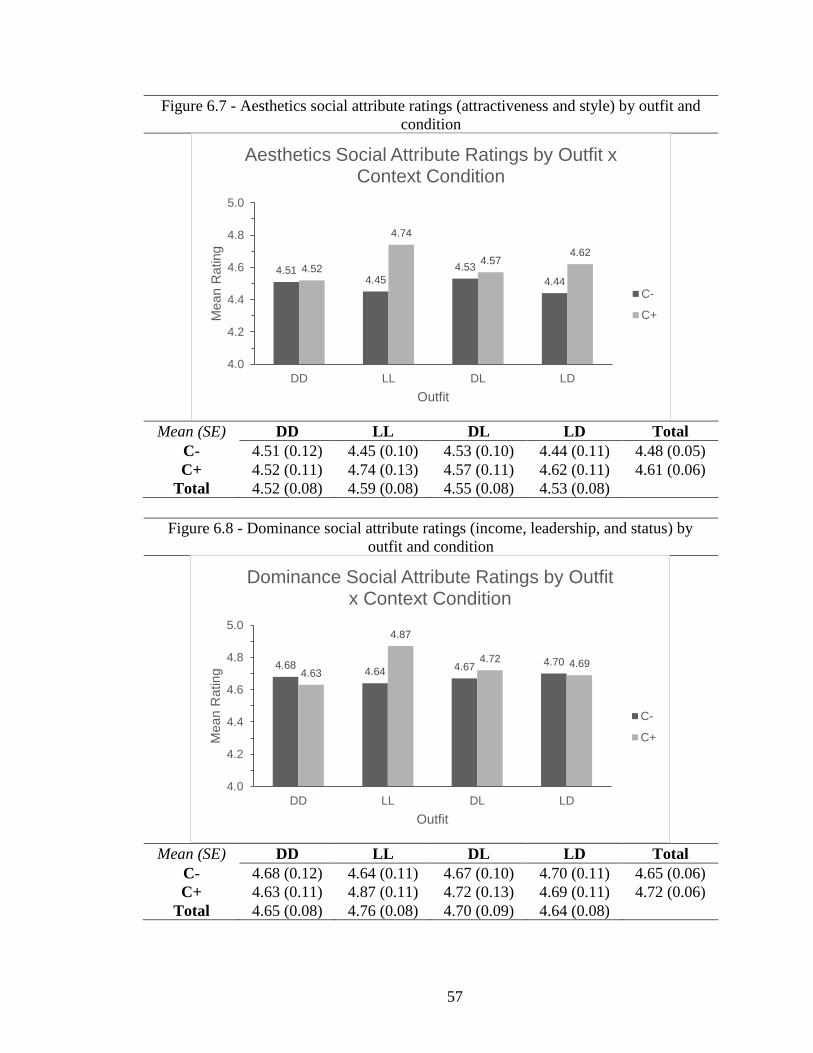
57
Figure 6.7 - Aesthetics social attribute ratings (attractiveness and style) by outfit and
condition
Mean (SE) DD LL DL LD Total
C- 4.51 (0.12) 4.45 (0.10) 4.53 (0.10) 4.44 (0.11) 4.48 (0.05)
C+ 4.52 (0.11) 4.74 (0.13) 4.57 (0.11) 4.62 (0.11) 4.61 (0.06)
Total 4.52 (0.08) 4.59 (0.08) 4.55 (0.08) 4.53 (0.08)
Figure 6.8 - Dominance social attribute ratings (income, leadership, and status) by
outfit and condition
Mean (SE) DD LL DL LD Total
C- 4.68 (0.12) 4.64 (0.11) 4.67 (0.10) 4.70 (0.11) 4.65 (0.06)
C+ 4.63 (0.11) 4.87 (0.11) 4.72 (0.13) 4.69 (0.11) 4.72 (0.06)
Total 4.65 (0.08) 4.76 (0.08) 4.70 (0.09) 4.64 (0.08)
4.514.45
4.53
4.44
4.52
4.74
4.574.62
4.0
4.2
4.4
4.6
4.8
5.0
DD LL DL LD
Mean R
ating
Outfit
Aesthetics Social Attribute Ratings by Outfit x Context Condition
C-
C+
4.684.64 4.67 4.70
4.63
4.87
4.72 4.69
4.0
4.2
4.4
4.6
4.8
5.0
DD LL DL LD
Mean R
ating
Outfit
Dominance Social Attribute Ratings by Outfit x Context Condition
C-
C+
58
Non-outfit Image Attributes
We have found that variations in the monochromaticity of outfit design can affect
the perceived height of a target, and that the presence or absence of rich contextual
information can affect the accuracy of height estimations, but that neither the outfit nor
context manipulations affect social attribute ratings. However, there are image attributes
among the fifty stimuli that we can also explore for other sources of variability. Person-
oriented attributes (i.e., such as the targets’ race/ethnicity and stance), or environment-
oriented attributes (i.e., location and other people) may affect height perception,
estimation accuracy, and social attribute ratings.
To explore the potential effects of these non-outfit image attributes on height
estimation and social attribute ratings, we used repeated measures analysis of covariance,
controlling for the actual height of the targets. We have included the raw descriptive
statistics (mean and standard error) along with the adjusted parameters.
Does race/ethnicity affect height or social perceptions?
Controlling for actual target height, the estimates for white targets were reliably
taller, and more accurate, than estimates for nonwhite targets, and the social attribute
ratings, for both aesthetics and dominance, were higher for white targets than for
nonwhite targets (Table 6.12 and Table 6.13).
Height estimates were more erroneous for non-white targets, leading to more
under-estimates, and the cultural associations with white targets prevailed in the social
attribute ratings. The more erroneous estimates for non-white targets may have been due
to some “other-race” effects. Other-race effects have found that sensitivity to relative
spatial features in faces (Kelly et al., 2007) or in bodies (Humphreys, Hodsoll, &
Campbell, 2005) vary depending on whether there is a match between the race of the
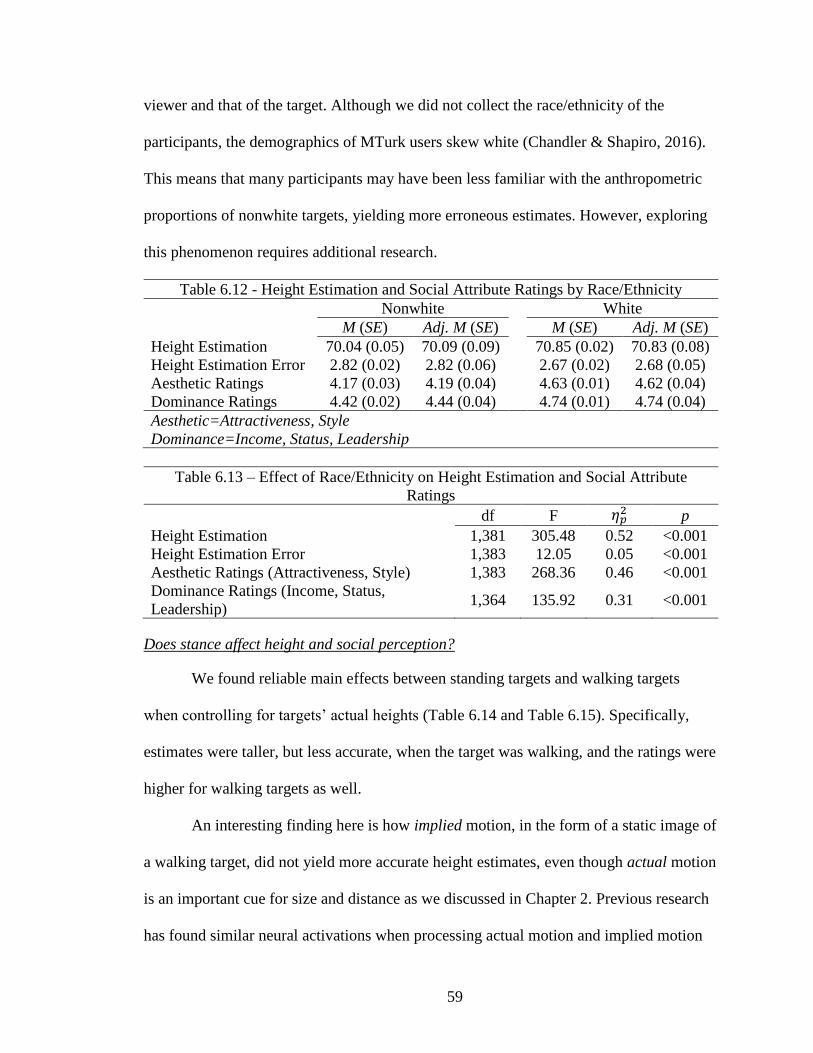
59
viewer and that of the target. Although we did not collect the race/ethnicity of the
participants, the demographics of MTurk users skew white (Chandler & Shapiro, 2016).
This means that many participants may have been less familiar with the anthropometric
proportions of nonwhite targets, yielding more erroneous estimates. However, exploring
this phenomenon requires additional research.
Table 6.12 - Height Estimation and Social Attribute Ratings by Race/Ethnicity
Nonwhite White
M (SE) Adj. M (SE)
M (SE) Adj. M (SE)
Height Estimation 70.04 (0.05) 70.09 (0.09) 70.85 (0.02) 70.83 (0.08)
Height Estimation Error 2.82 (0.02) 2.82 (0.06) 2.67 (0.02) 2.68 (0.05)
Aesthetic Ratings 4.17 (0.03) 4.19 (0.04) 4.63 (0.01) 4.62 (0.04)
Dominance Ratings 4.42 (0.02) 4.44 (0.04) 4.74 (0.01) 4.74 (0.04)
Aesthetic=Attractiveness, Style
Dominance=Income, Status, Leadership
Table 6.13 – Effect of Race/Ethnicity on Height Estimation and Social Attribute
Ratings
df F 𝜂𝑝2 p
Height Estimation 1,381 305.48 0.52 <0.001
Height Estimation Error 1,383 12.05 0.05 <0.001
Aesthetic Ratings (Attractiveness, Style) 1,383 268.36 0.46 <0.001
Dominance Ratings (Income, Status,
Leadership) 1,364 135.92 0.31 <0.001
Does stance affect height and social perception?
We found reliable main effects between standing targets and walking targets
when controlling for targets’ actual heights (Table 6.14 and Table 6.15). Specifically,
estimates were taller, but less accurate, when the target was walking, and the ratings were
higher for walking targets as well.
An interesting finding here is how implied motion, in the form of a static image of
a walking target, did not yield more accurate height estimates, even though actual motion
is an important cue for size and distance as we discussed in Chapter 2. Previous research
has found similar neural activations when processing actual motion and implied motion
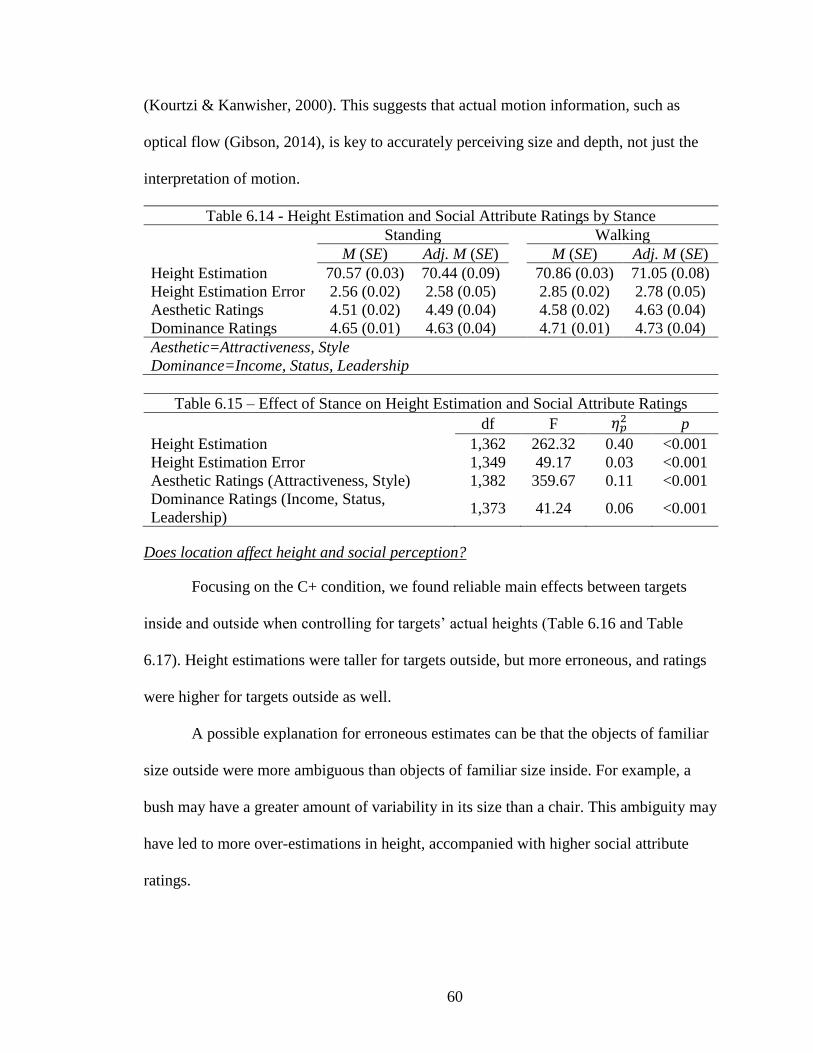
60
(Kourtzi & Kanwisher, 2000). This suggests that actual motion information, such as
optical flow (Gibson, 2014), is key to accurately perceiving size and depth, not just the
interpretation of motion.
Table 6.14 - Height Estimation and Social Attribute Ratings by Stance
Standing Walking
M (SE) Adj. M (SE)
M (SE) Adj. M (SE)
Height Estimation 70.57 (0.03) 70.44 (0.09) 70.86 (0.03) 71.05 (0.08)
Height Estimation Error 2.56 (0.02) 2.58 (0.05) 2.85 (0.02) 2.78 (0.05)
Aesthetic Ratings 4.51 (0.02) 4.49 (0.04) 4.58 (0.02) 4.63 (0.04)
Dominance Ratings 4.65 (0.01) 4.63 (0.04) 4.71 (0.01) 4.73 (0.04)
Aesthetic=Attractiveness, Style
Dominance=Income, Status, Leadership
Table 6.15 – Effect of Stance on Height Estimation and Social Attribute Ratings
df F 𝜂𝑝2 p
Height Estimation 1,362 262.32 0.40 <0.001
Height Estimation Error 1,349 49.17 0.03 <0.001
Aesthetic Ratings (Attractiveness, Style) 1,382 359.67 0.11 <0.001
Dominance Ratings (Income, Status,
Leadership) 1,373 41.24 0.06 <0.001
Does location affect height and social perception?
Focusing on the C+ condition, we found reliable main effects between targets
inside and outside when controlling for targets’ actual heights (Table 6.16 and Table
6.17). Height estimations were taller for targets outside, but more erroneous, and ratings
were higher for targets outside as well.
A possible explanation for erroneous estimates can be that the objects of familiar
size outside were more ambiguous than objects of familiar size inside. For example, a
bush may have a greater amount of variability in its size than a chair. This ambiguity may
have led to more over-estimations in height, accompanied with higher social attribute
ratings.
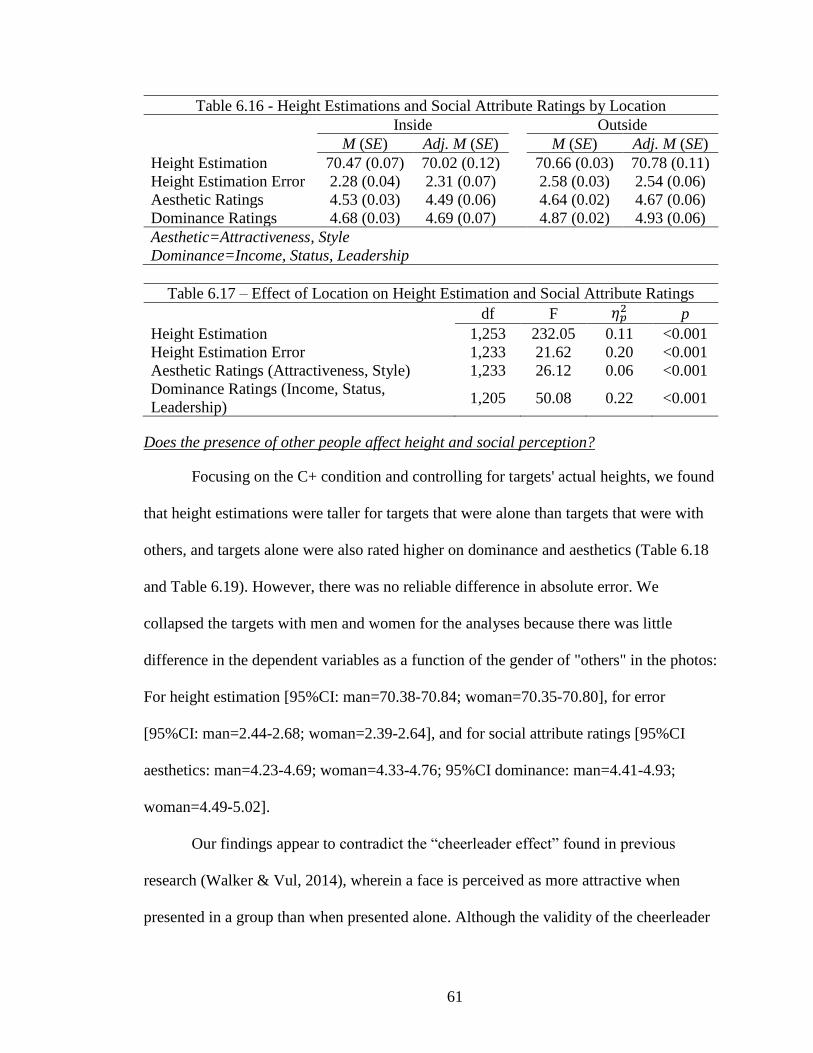
61
Table 6.16 - Height Estimations and Social Attribute Ratings by Location
Inside Outside
M (SE) Adj. M (SE)
M (SE) Adj. M (SE)
Height Estimation 70.47 (0.07) 70.02 (0.12) 70.66 (0.03) 70.78 (0.11)
Height Estimation Error 2.28 (0.04) 2.31 (0.07) 2.58 (0.03) 2.54 (0.06)
Aesthetic Ratings 4.53 (0.03) 4.49 (0.06) 4.64 (0.02) 4.67 (0.06)
Dominance Ratings 4.68 (0.03) 4.69 (0.07) 4.87 (0.02) 4.93 (0.06)
Aesthetic=Attractiveness, Style
Dominance=Income, Status, Leadership
Table 6.17 – Effect of Location on Height Estimation and Social Attribute Ratings
df F 𝜂𝑝2 p
Height Estimation 1,253 232.05 0.11 <0.001
Height Estimation Error 1,233 21.62 0.20 <0.001
Aesthetic Ratings (Attractiveness, Style) 1,233 26.12 0.06 <0.001
Dominance Ratings (Income, Status,
Leadership) 1,205 50.08 0.22 <0.001
Does the presence of other people affect height and social perception?
Focusing on the C+ condition and controlling for targets' actual heights, we found
that height estimations were taller for targets that were alone than targets that were with
others, and targets alone were also rated higher on dominance and aesthetics (Table 6.18
and Table 6.19). However, there was no reliable difference in absolute error. We
collapsed the targets with men and women for the analyses because there was little
difference in the dependent variables as a function of the gender of "others" in the photos:
For height estimation [95%CI: man=70.38-70.84; woman=70.35-70.80], for error
[95%CI: man=2.44-2.68; woman=2.39-2.64], and for social attribute ratings [95%CI
aesthetics: man=4.23-4.69; woman=4.33-4.76; 95%CI dominance: man=4.41-4.93;
woman=4.49-5.02].
Our findings appear to contradict the “cheerleader effect” found in previous
research (Walker & Vul, 2014), wherein a face is perceived as more attractive when
presented in a group than when presented alone. Although the validity of the cheerleader
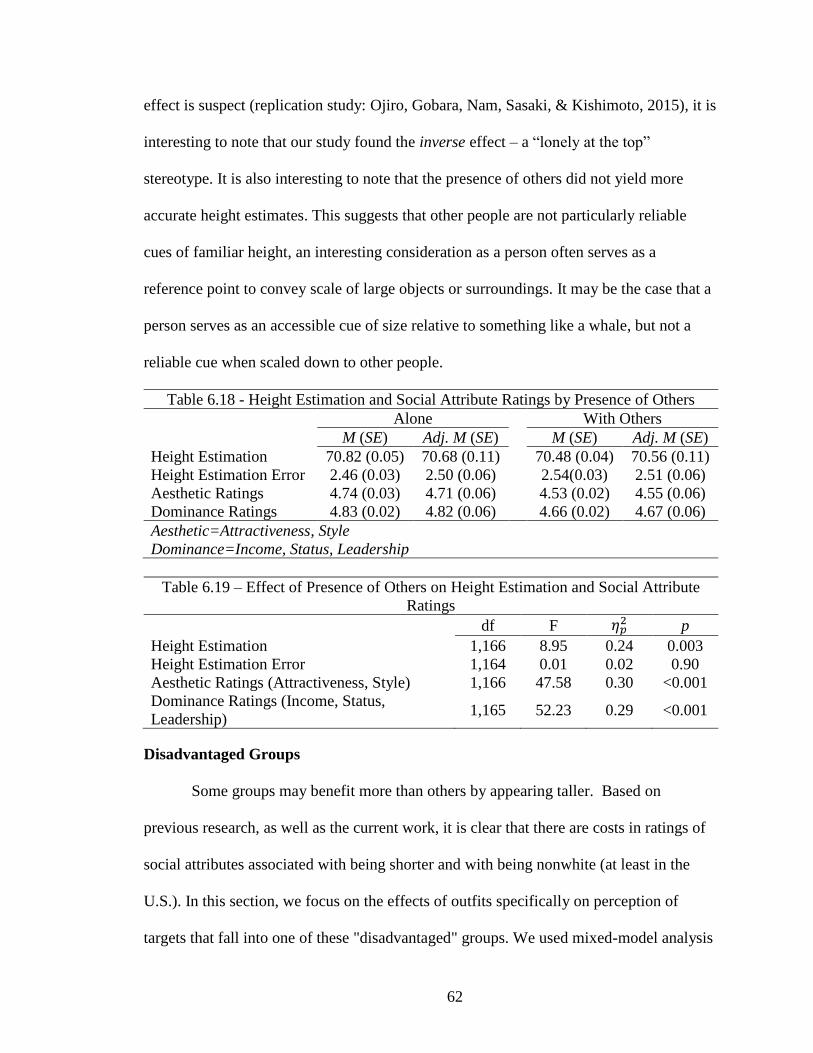
62
effect is suspect (replication study: Ojiro, Gobara, Nam, Sasaki, & Kishimoto, 2015), it is
interesting to note that our study found the inverse effect – a “lonely at the top”
stereotype. It is also interesting to note that the presence of others did not yield more
accurate height estimates. This suggests that other people are not particularly reliable
cues of familiar height, an interesting consideration as a person often serves as a
reference point to convey scale of large objects or surroundings. It may be the case that a
person serves as an accessible cue of size relative to something like a whale, but not a
reliable cue when scaled down to other people.
Table 6.18 - Height Estimation and Social Attribute Ratings by Presence of Others
Alone With Others
M (SE) Adj. M (SE)
M (SE) Adj. M (SE)
Height Estimation 70.82 (0.05) 70.68 (0.11) 70.48 (0.04) 70.56 (0.11)
Height Estimation Error 2.46 (0.03) 2.50 (0.06) 2.54(0.03) 2.51 (0.06)
Aesthetic Ratings 4.74 (0.03) 4.71 (0.06) 4.53 (0.02) 4.55 (0.06)
Dominance Ratings 4.83 (0.02) 4.82 (0.06) 4.66 (0.02) 4.67 (0.06)
Aesthetic=Attractiveness, Style
Dominance=Income, Status, Leadership
Table 6.19 – Effect of Presence of Others on Height Estimation and Social Attribute
Ratings
df F 𝜂𝑝2 p
Height Estimation 1,166 8.95 0.24 0.003
Height Estimation Error 1,164 0.01 0.02 0.90
Aesthetic Ratings (Attractiveness, Style) 1,166 47.58 0.30 <0.001
Dominance Ratings (Income, Status,
Leadership) 1,165 52.23 0.29 <0.001
Disadvantaged Groups
Some groups may benefit more than others by appearing taller. Based on
previous research, as well as the current work, it is clear that there are costs in ratings of
social attributes associated with being shorter and with being nonwhite (at least in the
U.S.). In this section, we focus on the effects of outfits specifically on perception of
targets that fall into one of these "disadvantaged" groups. We used mixed-model analysis
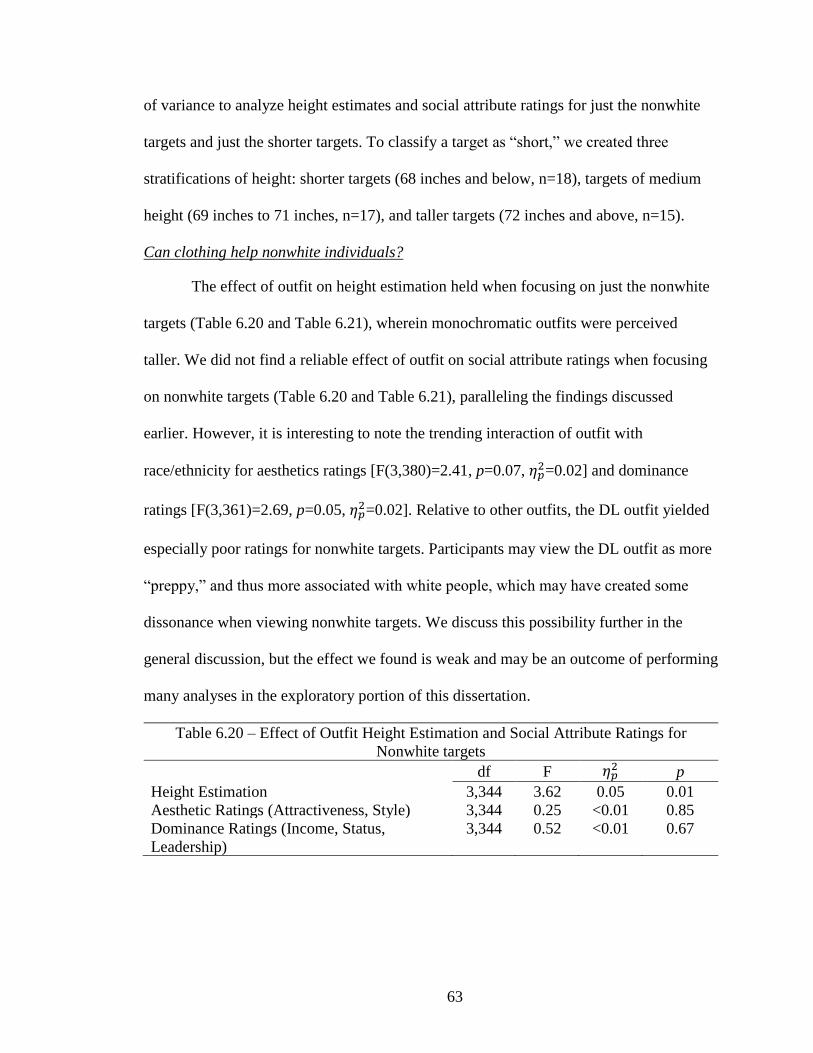
63
of variance to analyze height estimates and social attribute ratings for just the nonwhite
targets and just the shorter targets. To classify a target as “short,” we created three
stratifications of height: shorter targets (68 inches and below, n=18), targets of medium
height (69 inches to 71 inches, n=17), and taller targets (72 inches and above, n=15).
Can clothing help nonwhite individuals?
The effect of outfit on height estimation held when focusing on just the nonwhite
targets (Table 6.20 and Table 6.21), wherein monochromatic outfits were perceived
taller. We did not find a reliable effect of outfit on social attribute ratings when focusing
on nonwhite targets (Table 6.20 and Table 6.21), paralleling the findings discussed
earlier. However, it is interesting to note the trending interaction of outfit with
race/ethnicity for aesthetics ratings [F(3,380)=2.41, p=0.07, 𝜂𝑝2=0.02] and dominance
ratings [F(3,361)=2.69, p=0.05, 𝜂𝑝2=0.02]. Relative to other outfits, the DL outfit yielded
especially poor ratings for nonwhite targets. Participants may view the DL outfit as more
“preppy,” and thus more associated with white people, which may have created some
dissonance when viewing nonwhite targets. We discuss this possibility further in the
general discussion, but the effect we found is weak and may be an outcome of performing
many analyses in the exploratory portion of this dissertation.
Table 6.20 – Effect of Outfit Height Estimation and Social Attribute Ratings for
Nonwhite targets
df F 𝜂𝑝2 p
Height Estimation 3,344 3.62 0.05 0.01
Aesthetic Ratings (Attractiveness, Style) 3,344 0.25 <0.01 0.85
Dominance Ratings (Income, Status,
Leadership)
3,344 0.52 <0.01 0.67
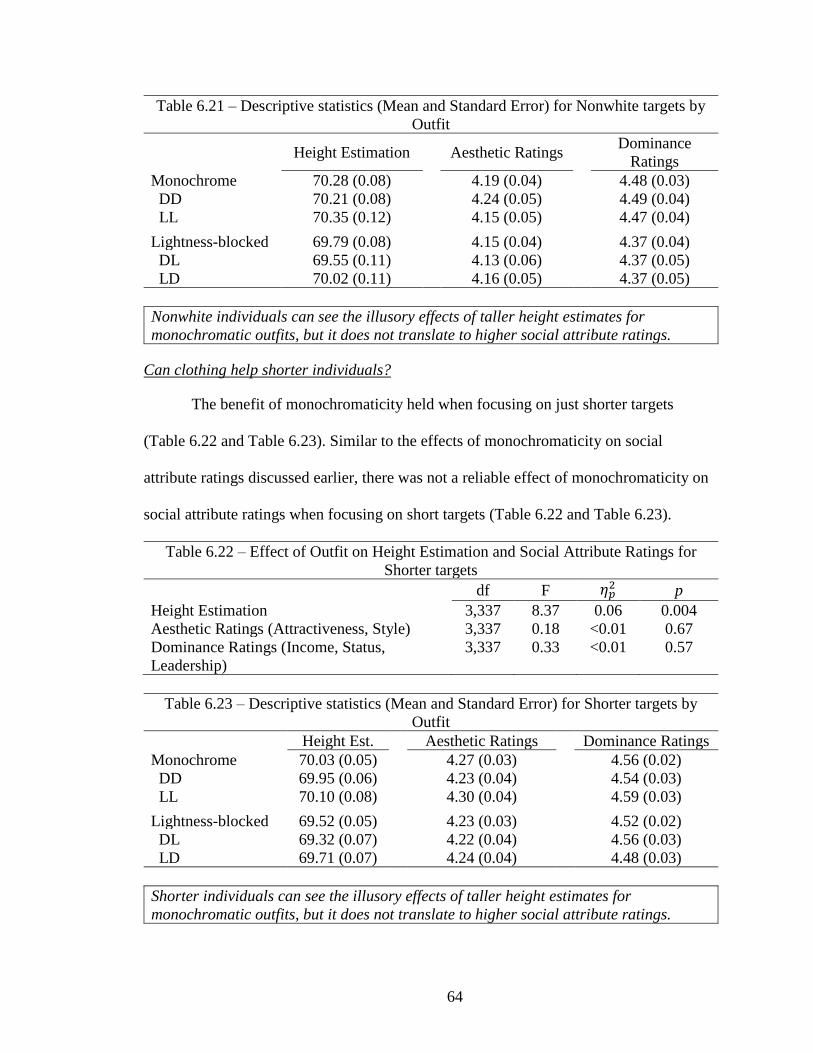
64
Table 6.21 – Descriptive statistics (Mean and Standard Error) for Nonwhite targets by
Outfit
Height Estimation Aesthetic Ratings Dominance
Ratings
Monochrome 70.28 (0.08)
4.19 (0.04) 4.48 (0.03)
DD 70.21 (0.08) 4.24 (0.05) 4.49 (0.04)
LL 70.35 (0.12) 4.15 (0.05) 4.47 (0.04)
Lightness-blocked 69.79 (0.08) 4.15 (0.04) 4.37 (0.04)
DL 69.55 (0.11) 4.13 (0.06) 4.37 (0.05)
LD 70.02 (0.11) 4.16 (0.05) 4.37 (0.05)
Nonwhite individuals can see the illusory effects of taller height estimates for
monochromatic outfits, but it does not translate to higher social attribute ratings.
Can clothing help shorter individuals?
The benefit of monochromaticity held when focusing on just shorter targets
(Table 6.22 and Table 6.23). Similar to the effects of monochromaticity on social
attribute ratings discussed earlier, there was not a reliable effect of monochromaticity on
social attribute ratings when focusing on short targets (Table 6.22 and Table 6.23).
Table 6.22 – Effect of Outfit on Height Estimation and Social Attribute Ratings for
Shorter targets
df F 𝜂𝑝2 p
Height Estimation 3,337 8.37 0.06 0.004
Aesthetic Ratings (Attractiveness, Style) 3,337 0.18 <0.01 0.67
Dominance Ratings (Income, Status,
Leadership)
3,337 0.33 <0.01 0.57
Table 6.23 – Descriptive statistics (Mean and Standard Error) for Shorter targets by
Outfit
Height Est. Aesthetic Ratings Dominance Ratings
Monochrome 70.03 (0.05) 4.27 (0.03) 4.56 (0.02)
DD 69.95 (0.06) 4.23 (0.04) 4.54 (0.03)
LL 70.10 (0.08) 4.30 (0.04) 4.59 (0.03)
Lightness-blocked 69.52 (0.05) 4.23 (0.03) 4.52 (0.02)
DL 69.32 (0.07) 4.22 (0.04) 4.56 (0.03)
LD 69.71 (0.07) 4.24 (0.04) 4.48 (0.03)
Shorter individuals can see the illusory effects of taller height estimates for
monochromatic outfits, but it does not translate to higher social attribute ratings.
65
Chapter 7: General Discussion
Outfits can impact the perceived height of an individual, specifically,
monochromatic outfits lead to estimates that individuals are taller than when they are
wearing non-monochrome outfits. Traditional suits with matching jackets and pants make
their wearers appear taller than would be the case with unmatched "separates." This
aligns with our prediction regarding monochromatic outfits based on the idea that fewer
edges in a stimulus may lead to fewer fixations (uninterrupted scan). Monochromatic
suits allow for uninterrupted attentional saccades similar to those discussed in the
inverted-T illusion (Chouinard et al., 2017; Kunnapas, 1955).
However, we found no evidence supporting our prediction regarding overall
lightness in an outfit. This suggests that the illusions relating to size-depth ambiguity,
such as size-lightness illusions, may not be as influential on body height perception as
illusions relating to segmentation along the dimension being estimated (vertical extent).
For the perceptual studies which were the basis of the “lightness” hypothesis, light (or
dark) stimuli were traditionally presented against a simple, solid background, often of the
opposite color (Coules, 1955; Kremkow et al., 2014; Westheimer, 2008). Given that
every C+ stimulus had a darker background than the C- counterpart and we did not find
an interaction of outfit lightness and context, it seems unlikely that we can attribute our
failure to replicate the earlier studies to lack of background contrast.
We did not find a main effect of context on height estimation, nor did context
interact with outfits for height estimations. However, context did affect the accuracy of
the estimates. As we hypothesized, the rich background information in the full context
66
(C+) condition provided many pictorial cues to assist in more accurate estimates than the
C- condition.
The social attribute ratings told a similar story to the height estimation results, but
with a few interesting differences. Overall, the relationship between the ratings and
estimated heights was moderate, and in the positive direction. This relationship between
dependent measures is replicated in most main effects we found within the non-outfit
image attributes of race/ethnicity, stance, location, and the presence of others. That is,
when these non-outfit factors caused an increase in social attribute ratings we also saw an
increase in the target's estimated height.
However, race/ethnicity told an interesting story. Height estimates were more
erroneous for non-white targets, but the cultural associations with white status prevailed
with white targets seen as taller, more dominant, and more aesthetically pleasing. The
more erroneous estimates for non-white targets may have been due to some “other-race”
effects. Other-race effects have found that sensitivity to relative spatial features in faces
(Kelly et al., 2007) or in bodies (Humphreys et al., 2005) vary depending on the match
between the viewer's and target's race. Although we did not collect the race/ethnicity of
the participants, the demographics of MTurk users skews white (Chandler & Shapiro,
2016). This means that many participants may have been less familiar with the
anthropometric proportions of nonwhite targets, yielding more erroneous estimates.
Furthermore, we found a marginal interaction of race/ethnicity and outfit. The
discrepancy in social ratings between white and non-white targets was greatest when the
target was wearing a dark jacket with light pants, which may convey a more “preppy”
aesthetic. Given the traditional English, “white” associations with “prep” attire dating
67
back to the late 1800s (Flusser, 2002), the higher ratings for white targets are even higher
when aligning with the prep uniform, while the lower ratings for nonwhite targets may
result from a mismatch between attire and racial stereotypes.
These “appropriateness” or “incongruence” explanations of these interactions of
outfit and race/ethnicity may be compatible with other clothing and social psychological
theories. Symbolic interaction theory, which largely stems from the philosopher George
Herbert Mead (reviews: Reilly, 2014, pgs: 47-49; Roach-Higgins & Eicher, 1992), posits
that viewers learn to associate meanings with objects, including clothing. “Context,”
which here includes anything from the social situation and the culture (review: Reilly,
2014, pgs: 38-39), helps to decipher ambiguous meanings from objects’ messages.
However, ambivalence occurs when there is conflict in messaging (Kaiser, Nagawasa, &
Hutton, 1997). In the results described above, there are conflicts in messaging: “white”
clothing on nonwhite people. Using the exemplar-based model of social judgment (Smith
& Zarate, 1992) suggests that this type of conflict is a conflict of stereotypicality which
can impact prejudice (Ramasubramanian, 2011), and prejudice in this dissertation comes
in the form of lower social attribute ratings.
Advice Revisited
This dissertation stemmed from observations that people, especially suit experts,
discuss aspects of clothing design in ways directly tied to basic, perceptual psychological
principles. We reviewed these illusion-inducing suggestions in Chapter 1. Our data
appear to support expert claims regarding monochromaticity, wherein monochromatic
suits yielded taller estimates than lightness-blocked suits by about half an inch on
average. Based on prior modeling of height-income relationships (Judge & Cable, 2004),
68
this half-inch difference translates to approximately $11,857.14 over the course of a 30-
year career. This effect of monochromaticity worked for all heights, including shorter
individuals. To that end, if someone wishes to appear shorter, then we would suggest
avoiding monochromatic outfits.
The current data seem to contradict other suggestions by experts. Specifically, the
overall lightness of a suit did not have an effect on estimates of height. Based on the
psychophysical literature, we would predict that people wearing lighter suits would
appear taller. Experts, on the other hand, suggest that wearing darker suits will provide
the illusion of greater height. Although there was no reliable difference in perceived
height as a function of suit lightness in our research, the trend was opposite that predicted
by the experts. There appears to be no reason for shorter individuals to favor darker suits.
It is important to note that, although we found an effect of monochromaticity on
height estimation, this did not translate into improvements in social attribute ratings. So,
while an individual may appear half an inch taller when wearing a monochromatic suit,
the benefits associated with increased height may not apply (e.g., will not appear more
attractive). Monochromaticity by itself may not create enough of a change in apparent
height to make others view the target more favorably during a limited exposure, but there
may be other benefits to a slight change in apparent height. For example, it might change
self-perception and self-confidence in the wearer. There might also be other design
features that might further amplify the illusion. In the present case, we simply find that
wearing a uniform color gives a person approximately an extra half inch in perceived
stature. Likewise, a taller person who wants to appear shorter may opt for a "separates"
look rather than a traditional monochromatic suit.
69
Limitations and Future Research
Experimental control is one of the apparent limitations in this study. One control
issue arises from utilizing a survey with the MTurk population. The unmoderated,
unsupervised nature of this methodology exposes the data collection to a great deal of
variability, such as variations in display size and resolution, environmental distractions,
and participant motivation. However, MTurk has been shown to be valid for graphical
perception research (Heer & Bostock, 2010), and, relative to traditional methods of
sampling and recruiting such as introductory psychology students, MTurk provides
additional benefits such as a more diverse population (Shapiro, Chandler, & Mueller,
2013).
Another example of a control limitation stems from how we did not manipulate
the contexts surrounding targets (other than the overall removal for the C- condition).
Future research should include actual manipulations of the background context. The
current study used Photoshop to manipulate the outfit of the target, and Photoshop can
similarly manipulate the background contextual information for the same interesting
comparisons, although some will be easier than others (e.g., removing a person in the
background vs. moving the target from outside to inside).
Future research should also explore other outfit manipulations. For a start, there
are other suit designs we discuss as potential advice or suggestions from experts and non-
experts alike (e.g., pinstripes with different orientations). Furthermore, researchers should
explore outfits beyond suits, especially since the formality of the suit has decreased its
popularity as a daily outfit in recent years (Guy, 2016). Researchers should also explore
dimensions other than height, such as weight or horizontal size.
70
Additionally, research should explore illusory effects of outfits on other types of
stimuli. Firstly, we compiled the targets in this study using existing images of men of
known heights, or at least assumed to be known based on internet sources for celebrities’
heights. This is a limitation in that participants may have recognized some targets despite
the obscured faces, and this knowledge might have biased there estimates in important
ways. Furthermore, future research should explore the effects on non-male targets. As
discussed in Chapter 3, the anthropometric proportions of a target can provide cues of
sex, but understanding the generalizability of the effects seen here are important.
Furthermore, outfits like dresses, rarely worn by men, may interact with illusory effects
in interesting ways due to their effects on the silhouette. To draw on the “geons” example
discussed in Chapter 2, suit trousers are bifurcated to match the geons of the prototypical
human form in matching two legs at a feature level. However, a non-bifurcated skirt may
obscure these presence of two, distinct legs which may impact the ways humans perceive
and interpret the bodies of others. Studying illusions of size in female targets may also be
a particular concern given our finding in Phase 1 that women appear to be more informed
about, and potentially influenced by, suggestions from experts.
Regardless of manipulations, all stimuli should include full contextual
information to maintain the stronger external validity by yielding more accurate height
estimates for targets than a target presented void of realistic contextual cues. Also, it is
critical that those interested in studying any social biases that may be associated with
height to measure perceived height rather than rely on objective height.
Future research should also consider other methodological changes. For example,
the current study did not collect race/ethnicity information from participants, so we are
71
unable to confirm any “other-race” effects. Another limitation may have been in the
ratings used to evaluate social attribute perceptions, which may not have been sensitive
enough to detect perceived differences. An additional scale of formality may have also
clarified the effects outfit design. However, an additional limitation in this dissertation is
the problem of alpha inflation. We ran many statistical analyses in the exploratory phases
of the research, increasing the likelihood of false positives. We feel relatively confident
in our primary finding that monochromatic suits make wearers appear slightly taller than
outfits that combine dark and light separates (e.g., jacket and pants). We predicted these
data based on the opinion of suit experts and the basic psychophysical data.
Conclusion
The scientific merit of this study results from its test of the generalizability of size
illusions found in simple, geometric stimuli to illusions induced by clothing design. In
particular, we focused on lightness and segmentation manipulations. The lightness
manipulation did not translate well to real-world stimuli (people’s clothes), but the
segmentation manipulation did. Research exploring illusions in clothing traditionally
ignored the influence of contextual cues and anthropometric cues, both of which could
constrain the impact of these illusions. Our findings also suggest that the presence of
context is more likely to affect the overall accuracy of height estimations rather than
directional bias in those estimations. Finding general rules that determine how variation
in clothing design influences body perception would provide a step toward predictively
modeling body perception in a variety of clothing contexts.
The broader impact of this study can be seen in any domain where perception of
height is critical. As discussed earlier, a person’s height can influence the amount of
72
income he or she earns and perception of important social attributes such as leadership
skills, attractiveness, and status. The accuracy of height estimation, if reliably influenced
by clothing choice, might also help forensic professionals obtain better descriptions of
perpetrators from eye witnesses. In short, the findings of this study may indicate that
clothing influences the variability of height estimates and perceptions in potentially
predictable ways.
73
Bibliography
Alley, T. R. (1983). Growth-Produced Changes in Body Shape and Size as Determinants
of Perceived Age and Adult Caregiving. Child Development, 54(1), 241–248.
https://doi.org/10.2307/1129882
Ashida, H., Kuraguchi, K., & Miyoshi, K. (2013). Helmholtz illusion makes you look fit
only when you are already fit, but not for everyone. I-Perception, 4(5), 347–351.
https://doi.org/10.1068/i0595rep
Bennett, C. A., Lee, H. B., Peterson, G. P., & Yoon, K. (1978). Three Studies of
Parameters of Consumer Products: Pillow Softness, Cup Handle Size and
Clothing Stripes. Proceedings of the Human Factors Society Annual Meeting,
22(1), 339–342. https://doi.org/10.1177/107118137802200191
Bian, X. P., Jiang, X. F., & Liu, Y. Q. (2013). Evaluation on Size-Illusion of Clothing
Color Based on Behavioural Measure. Advanced Materials Research, 796, 492–
496. https://doi.org/10.4028/www.scientific.net/AMR.796.492
Biederman, I. (1987). Recognition-by-components: a theory of human image
understanding. Psychological Review, 94(2), 115.
Bodenhorn, H., Moehling, C., & Price, G. N. (2012). Short Criminals: Stature and Crime
in Early America. The Journal of Law and Economics, 55(2), 393–419.
https://doi.org/10.1086/663347
Bogin, B., & Varela-Silva, M. I. (2010). Leg Length, Body Proportion, and Health: A
Review with a Note on Beauty. International Journal of Environmental Research
and Public Health, 7(3), 1047–1075. https://doi.org/10.3390/ijerph7031047
Boyer, G. B. (1990). Eminently Suitable (1 edition). New York: W W Norton & Co Inc.
Brown, M. B., & Forsythe, A. B. (1974). Robust Tests for the Equality of Variances.
Journal of the American Statistical Association, 69(346), 364–367.
https://doi.org/10.1080/01621459.1974.10482955
Bruce, V., Green, P. R., & Georgeson, M. A. (2000). Visual perception: physiology,
psychology, and ecology (3. ed, reprinted). Hove: Psychology Press.
Bruno, N., & Cutting, J. E. (1988). Minimodularity and the perception of layout. Journal
of Experimental Psychology: General, 117(2), 161.
Buchner, A., Brandt, M., Bell, R., & Weise, J. (2006). Car Backlight Position and Fog
Density Bias Observer-Car Distance Estimates and Time-to-Collision Judgments.
Human Factors: The Journal of the Human Factors and Ergonomics Society,
48(2), 300–317. https://doi.org/10.1518/001872006777724363
Bulatov, A., Bulatova, N., Surkys, T., & Mickienė, L. (2015). A quantitative analysis of
illusion magnitude changes induced by rotation of contextual distractor. Acta
Neurobiol Exp, 75, 238–251.
Cavallo, V., Colomb, M., & Dore, J. (2001). Distance Perception of Vehicle Rear Lights
in Fog. Human Factors, 43(3), 442–451.
Centeno, A. (2011a, June 4). 5 Suit Buying Tips for Short, Skinny, and Small Men.
Retrieved August 29, 2016, from http://www.realmenrealstyle.com/suit-buying-
tips-short-skinny-men/
Centeno, A. (2011b, June 7). Dressing Taller: 10 Tips for Short Men. Retrieved August
29, 2016, from http://www.artofmanliness.com/2011/06/07/dressing-taller-short-
men/
74
Chandler, J., & Shapiro, D. (2016). Conducting Clinical Research Using Crowdsourced
Convenience Samples. Annual Review of Clinical Psychology, 12(1), 53–81.
https://doi.org/10.1146/annurev-clinpsy-021815-093623
Chen, T. Y., & Peng, L. H. (2013). Zebra Effect in Fashion Design: Challenging
Consumer Stereotype on Striped Clothing. In 2013 Fifth International Conference
on Service Science and Innovation (pp. 100–107).
https://doi.org/10.1109/ICSSI.2013.29
Chouinard, P. A., Peel, H. J., & Landry, O. (2017). Eye-Tracking Reveals that the
Strength of the Vertical-Horizontal Illusion Increases as the Retinal Image
Becomes More Stable with Fixation. Frontiers in Human Neuroscience, 11.
https://doi.org/10.3389/fnhum.2017.00143
Christian, S. (2015, August 18). 7 Style Tips That Will Make All Men Look Taller.
Retrieved August 29, 2016, from http://www.esquire.com/style/mens-
fashion/a37254/7-style-tips-that-will-make-you-look-taller/
Coren, S., & Girgus, J. S. (1972). A comparison of five methods of illusion measurement.
Behavior Research Methods & Instrumentation, 4(5), 240–244.
https://doi.org/10.3758/BF03210006
Coules, J. (1955). Effect of photometric brightness on judgments of distance. Journal of
Experimental Psychology, 50(1), 19–25.
Cutler, B. L., Penrod, S. D., & Martens, T. K. (1987). The Reliability of Eyewitness
Identification: The Role of System and Estimator Variables. Law and Human
Behavior, 11(3), 233–258.
Davis, C. M., & Carlson, J. A. (1970). A cross-cultural study of the strength of the
Muller-Lyer illusion as a function of attentional factors. Journal of Personality,
16(3), 403–410.
Dragoi, V., & Lockhead, G. (1999). Context-dependent changes in visual sensitivity
induced by Müller–Lyer stimuli. Vision Research, 39(9), 1657–1670.
Dreyfuss, H. (1955). Designing for People. Simon and Schuster.
Duyar, I., & Pelin, C. (2003). Body height estimation based on tibia length in different
stature groups. American Journal of Physical Anthropology, 122(1), 23–27.
https://doi.org/10.1002/ajpa.10257
Eberts, R., & MacMillan, A. (1985). Misperception of Small Cars. Trends in
Ergonomics/Human Factors II, 33–39.
Esquire (Ed.). (2009). Esquire The Handbook of Style: A Man’s Guide to Looking Good.
New York, NY: Hearst.
Feldesman, M. R., & Fountain, R. L. (1996). “Race” specificity and the femur/stature
ratio. American Journal of Physical Anthropology, 100(2), 207–224.
https://doi.org/10.1002/(SICI)1096-8644(199606)100:2<207::AID-
AJPA4>3.0.CO;2-U
Flusser, A. (2002). Dressing the Man: Mastering the Art of Permanent Fashion (1st
edition). New York: HarperCollins.
Fry, G. A., Bridgman, C. S., & Ellerbrock, V. J. (1949). The effects of atmospheric
scattering on binocular depth perception. Journal of Optometry, 26(1), 9–15.
Gerstein, J. (2015, March 21). 21 Style Rules That’ll Help Any Guy Look Taller.
Retrieved August 29, 2016, from http://www.buzzfeed.com/juliegerstein/21-style-
rules-thatll-help-any-guy-look-taller
75
Gescheider, G. A. (1985). Psychophysics: method, theory, and application. L. Erlbaum
Associates.
Gescheider, G. A. (1988). Psychophysical Scaling. Annual Review of Psychology, 39(1),
169–200. https://doi.org/10.1146/annurev.ps.39.020188.001125
Gibb, R., Ercoline, B., & Scharff, L. (2011). Spatial Disorientation: Decades of Pilot
Fatalities. Aviation, Space, and Environmental Medicine, 82(7), 717–724.
https://doi.org/10.3357/ASEM.3048.2011
Gibson, J. J. (2014). The Ecological Approach to Visual Perception: Classic Edition.
Psychology Press.
Gillam, B. (1980). Geometrical Illusions. Scientific American, 242(1), 102–111.
Gillan, D. J., Schmidt, W., & Hanowski, R. J. (1999). The effect of the Müller-Lyer
illusion on map reading. Perception & Psychophysics, 61(6), 1154–1167.
https://doi.org/10.3758/BF03207620
Gregory, R. L. (1968). Perceptual Illusions and Brain Models. Proceedings of the Royal
Society of London. Series B, Biological Sciences, 171(1024), 279–296.
Guibal, C. R. C., & Dresp, B. (2004). Interaction of color and geometric cues in depth
perception: When does “red” mean “near”? Psychological Research, 69(1/2), 30–
40. https://doi.org/10.1007/s00426-003-0167-0
Gupta, D., & Zakaria, N. (2014). Anthropometry, Apparel Sizing and Design. Elsevier.
Guy, D. (2011, December 14). Understanding a Suit’s Silhouette. Retrieved September
16, 2016, from http://putthison.com/post/14219108518/understanding-a-suits-
silhouette-its-common-to
Guy, D. (2016, May 27). The End of Office Dress Codes? Retrieved March 5, 2018, from
http://putthison.com/post/144964888828/the-end-of-office-dress-codes-the-new-
york-times
Handel, S., & Imai, S. (1972). The free classification of analyzable and unanalyzable
stimuli. Perception & Psychophysics, 12(1), 108–116.
https://doi.org/10.3758/BF03212854
Heer, J., & Bostock, M. (2010). Crowdsourcing graphical perception: using mechanical
turk to assess visualization design. In Proceedings of the SIGCHI conference on
human factors in computing systems (pp. 203–212). ACM.
Horn, M. J., & Gurel, L. M. (1981). The second skin: an interdisciplinary study of
clothing. Houghton Mifflin.
Humphreys, G. W., Hodsoll, J., & Campbell, C. (2005). Attending but not seeing: The
“other race” effect in face and person perception studied through change
blindness. Visual Cognition, 12(1), 249–262.
https://doi.org/10.1080/13506280444000148
Johnson, K. L., & Tassinary, L. G. (2005). Perceiving Sex Directly and Indirectly:
Meaning in Motion and Morphology. Psychological Science, 16(11), 890–897.
Judge, T. A., & Cable, D. M. (2004). The Effect of Physical Height on Workplace
Success and Income: Preliminary Test of a Theoretical Model. Journal of Applied
Psychology, 89(3), 428–441. https://doi.org/10.1037/0021-9010.89.3.428
Kaiser, S. B., Nagawasa, R., & Hutton, S. (1997). Truth, Knowledge, New Clothes:
Responses to Hamilton, Kean, and Pannabecker. Clothing and Textiles Research
Journal, 15(3), 184–191.
76
Kelly, D. J., Quinn, P. C., Slater, A. M., Lee, K., Ge, L., & Pascalis, O. (2007). The
Other-Race Effect Develops During Infancy. Psychological Science, 18(12),
1084–1089. https://doi.org/10.1111/j.1467-9280.2007.02029.x
Kiire, S. (2016). Effect of Leg-to-Body Ratio on Body Shape Attractiveness. Archives of
Sexual Behavior, 45(4), 901–910. https://doi.org/10.1007/s10508-015-0635-9
Kosslyn, S. M. (2006). Graph Design for the Eye and Mind. Oxford University Press,
USA.
Kourtzi, Z., & Kanwisher, N. (2000). Activation in human MT/MST by static images
with implied motion. Journal of Cognitive Neuroscience, 12(1), 48–55.
Kremkow, J., Jin, J., Komban, S. J., Wang, Y., Lashgari, R., Li, X., … Alonso, J.-M.
(2014). Neuronal nonlinearity explains greater visual spatial resolution for darks
than lights. Proceedings of the National Academy of Sciences, 111(8), 3170–3175.
https://doi.org/10.1073/pnas.1310442111
Kunnapas, T. M. (1955). An analysis of the “vertical-horizontal illusion.” Journal of
Experimental Psychology, 49(2), 134–140.
Landy, M. S., Maloney, L. T., Johnston, E. B., & Young, M. (1995). Measurement and
modeling of depth cue combination: in defense of weak fusion. Vision Research,
35(3), 389–412. https://doi.org/10.1016/0042-6989(94)00176-M
Lindauer. (1973). Extent of illusory effects for 32 illusions. Perceptual and Motor Skills,
36(3), 887–894. https://doi.org/10.2466/pms.1973.36.3.887
Linkenauger, S. A., Wong, H. Y., Geuss, M., Stefanucci, J. K., McCulloch, K. C.,
Bülthoff, H. H., … Proffitt, D. R. (2015). The perceptual homunculus: The
perception of the relative proportions of the human body. Journal of Experimental
Psychology: General, 144(1), 103–113. https://doi.org/10.1037/xge0000028
Ludwig, Y. S., & Pollet, T. V. (2014). When men appear smaller or larger than they
really are: preliminary evidence that women are fooled by size illusions in
attractiveness judgment tasks. Anthropological Review, 77(3).
https://doi.org/10.2478/anre-2014-0023
Maisey, D. S., Vale, E. L. E., Cornelissen, P. L., & Tovee, M. J. (1999). Characteristics
of male attractiveness for women. Lancet, 353(9163), 1500–1500.
Marsh, A. A., Yu, H. H., Schechter, J. C., & Blair, R. J. R. (2009). Larger than Life:
Humans’ Nonverbal Status Cues Alter Perceived Size. PLOS ONE, 4(5), e5707.
https://doi.org/10.1371/journal.pone.0005707
Meissner, C. A., Sporer, S. L., & Schooler, J. W. (2013). Person descriptions as
eyewitness evidence. In Handbook of Eyewitness Psychology (Vol. 2).
Psychology Press.
Melamed, T., & Bozionelos, N. (1992). Managerial Promotion and Height. Psychological
Reports, 71(2), 587–593. https://doi.org/10.2466/pr0.1992.71.2.587
Miller, K. A. (1997). Dress: Private and Secret Self-Expression. Clothing and Textiles
Research Journal, 15(4), 223–234. https://doi.org/10.1177/0887302X9701500404
Morgan, M. J., Hole, G. J., & Glennerster, A. (1990). Biases and sensitivities in
geometrical illusions. Vision Research, 30(11), 1793–1810.
https://doi.org/10.1016/0042-6989(90)90160-M
Morikawa, K. (2003). An application of the Müller-Lyer illusion. Perception, 32(1), 121–
123.
77
Nicholson, S. G. (2013, May 31). The Suit Silhouette and the Cutter. Retrieved August
29, 2016, from https://parisiangentleman.co.uk/academy/the-suit-silhouette-and-
the-cutter/
Nicholson, S. G. (2015, January 5). 6 Ways Shorter Men Can Dress to Look Taller.
Retrieved August 29, 2016, from https://parisiangentleman.co.uk/academy/six-
ways-shorter-men-can-dress-to-look-taller/
Ninio, J. (2014). Geometrical illusions are not always where you think they are: a review
of some classical and less classical illusions, and ways to describe them. Frontiers
in Human Neuroscience, 8, 856. https://doi.org/10.3389/fnhum.2014.00856
Noguchi, K., Hilz, R., & Rentschler, I. (1990). The effect of grouping of adjacent
contours on the Oppel-Kundt illusion. The Japanese Journal of Psychonomic
Science, 8(2), 57–59. https://doi.org/10.14947/psychono.KJ00004406174
Oberfeld, D., & Hecht, H. (2011). Fashion Versus Perception: The Impact of Surface
Lightness on the Perceived Dimensions of Interior Space. Human Factors: The
Journal of the Human Factors and Ergonomics Society, 53(3), 284–298.
https://doi.org/10.1177/0018720811407331
Oberfeld, D., Hecht, H., & Gamer, M. (2010). Surface lightness influences perceived
room height. The Quarterly Journal of Experimental Psychology, 63(10), 1999–
2011. https://doi.org/10.1080/17470211003646161
Ojiro, Y., Gobara, A., Nam, G., Sasaki, K., & Kishimoto, R. (2015). Two replications of
“Hierarchical encoding makes individuals in a group seem more attractive (2014;
Experiment 4)”. Tutorials in Quantitative Methods for Psychology, 11(2), r8–r11.
Peacock, B. (2003). What Kind of Shape Are You In? Anthropometry and Appearances.
Ergonomics in Design: The Quarterly of Human Factors Applications, 11(1), 4–
31. https://doi.org/10.1177/106480460301100102
Pepperberg, I. M., Vicinay, J., & Cavanagh, P. (2008). Processing of the Müller-Lyer
illusion by a grey parrot (Psittacus erithacus). Perception, 37(5), 765–781.
Phillips, J. G., Triggs, T. J., & Meehan, J. W. (2003). Conflicting Directional and
Locational Cues Afforded by Arrowhead Cursors in Graphical User Interfaces.
Journal of Experimental Psychology. Applied, 9(2), 75–87.
https://doi.org/10.1037/1076-898X.9.2.75
Pierce, C. A. (1996). Body Height and Romantic Attraction: A Meta-Analytic Test of the
Male-Taller Norm. Social Behavior & Personality: An International Journal,
24(2), 143.
Porac, C., Coren, S., Girgus, J. S., & Verde, M. (1979). Visual-Geometric Illusions:
Unisex Phenomena. Perception, 8(4), 401–412. https://doi.org/10.1068/p080401
Poulton, E. C. (1979). Models for biases in judging sensory magnitude. Psychological
Bulletin, 86(4), 777–803.
Poulton, E. C. (1985). Geometric illusions in reading graphs. Perception &
Psychophysics, 37(6), 543–548. https://doi.org/10.3758/BF03204920
Proctor, R. W., & Proctor, J. D. (2012). Sensation and Perception. In G. Salvendy (Ed.),
Handbook of Human Factors and Ergonomics (pp. 57–94). John Wiley & Sons,
Inc. Retrieved from
http://onlinelibrary.wiley.com/doi/10.1002/9781118131350.ch3/summary
78
Rae, I., Takayama, L., & Mutlu, B. (2013). The influence of height in robot-mediated
communication. In 2013 8th ACM/IEEE International Conference on Human-
Robot Interaction (HRI) (pp. 1–8). https://doi.org/10.1109/HRI.2013.6483495
Raes, B. (2008). Style Rx: Dressing the Body You Have to Create the Body You Want.
New York, NY: Penguin Group.
Ramasubramanian, S. (2011). The Impact of Stereotypical Versus Counterstereotypical
Media Exemplars on Racial Attitudes, Causal Attributions, and Support for
Affirmative Action. Communication Research, 38(4), 497–516.
https://doi.org/10.1177/0093650210384854
Ramkumar, V., & Bennett, C. A. (1979). How Big is Dark? Proceedings of the Human
Factors Society Annual Meeting, 23(1), 116–118.
https://doi.org/10.1177/107118137902300129
Re, D. E., Dzhelyova, M., Holzleitner, I. J., Tigue, C. C., Feinberg, D. R., & Perrett, D. I.
(2012). Apparent Height and Body Mass Index Influence Perceived Leadership
Ability in Three-Dimensional Faces. Perception, 41(12), 1477–1485.
https://doi.org/10.1068/p7342
Reilly, A. (2014). Key Concepts for the Fashion Industry. Bloomsbury Publishing.
Reilly, A., & Cosbey, S. (2008). Men’s Fashion Reader. Bloomsbury Academic.
Ridgway, J. L., Parsons, J., & Sohn, M. (2016). Creating a More Ideal Self Through the
Use of Clothing An Exploratory Study of Women’s Perceptions of Optical
Illusion Garments. Clothing and Textiles Research Journal, 0887302X16678335.
https://doi.org/10.1177/0887302X16678335
Roach-Higgins, M. E., & Eicher, J. B. (1992). Dress and identity. Clothing and Textiles
Research Journal, 10(4), 1–8.
Robinette, K. M., & Veitch, D. (2016). Sustainable Sizing. Human Factors: The Journal
of the Human Factors and Ergonomics Society, 58(5), 657–664.
https://doi.org/10.1177/0018720816649091
Schvey, N. A., Puhl, R. M., Levandoski, K. A., & Brownell, K. D. (2013). The influence
of a defendant’s body weight on perceptions of guilt. International Journal of
Obesity, 37(9), 1275–1281. https://doi.org/10.1038/ijo.2012.211
Sethumadhavan, A. (2012, December 20). Human Factors Psychology Blog: Perceptual
Illusion and Fashion. Retrieved January 22, 2017, from
http://humanfactorspsych.blogspot.com/2012/12/perceptual-illusion-and-
fashion.html
Shapiro, D. N., Chandler, J., & Mueller, P. A. (2013). Using Mechanical Turk to Study
Clinical Populations. Clinical Psychological Science, 1(2), 213–220.
https://doi.org/10.1177/2167702612469015
Shaw, R. G., & Mitchell-Olds, T. (1993). ANOVA for unbalanced data: an overview.
Ecology, 74(6), 1638–1645.
Shinar, D., Rockwell, T. H., & Malecki, J. A. (1980). The effects of changes in driver
perception on rural curve negotiation∗. Ergonomics, 23(3), 263–275.
https://doi.org/10.1080/00140138008924739
Singh, D., Dixson, B. J., Jessop, T. S., Morgan, B., & Dixson, A. F. (2010). Cross-
cultural consensus for waist–hip ratio and women’s attractiveness. Evolution and
Human Behavior, 31(3), 176–181.
https://doi.org/10.1016/j.evolhumbehav.2009.09.001
79
Sloan, R. J. S. (2015). Virtual Character Design for Games and Interactive Media. CRC
Press.
Smith, E. R., & Zarate, M. A. (1992). Exemplar-based model of social judgment.
Psychological Review, 99(1), 3.
Stulp, G., Buunk, A. P., Verhulst, S., & Pollet, T. V. (2013). Tall claims? Sense and
nonsense about the importance of height of US presidents. The Leadership
Quarterly, 24(1), 159–171. https://doi.org/10.1016/j.leaqua.2012.09.002
Thompson, P., & Mikellidou, K. (2011). Applying the Helmholtz illusion to fashion:
horizontal stripes won’t make you look fatter. I-Perception, 2(1), 69–76.
https://doi.org/10.1068/i0405
Thorn, J. (2011, June 23). Put This On Episode 6: Body. Retrieved August 29, 2016,
from http://putthison.com/post/6824514250/put-this-on-episode-6-body-jesse-
thorn-visits
Tilley, A. R., & Associates, H. D. (2001). The Measure of Man and Woman: Human
Factors in Design (1 edition). New York: Wiley.
Troscianko, T., Montagnon, R., Clerc, J. L., Malbert, E., & Chanteau, P.-L. (1991). The
role of colour as a monocular depth cue. Vision Research, 31(11), 1923–1929.
https://doi.org/10.1016/0042-6989(91)90187-A
Twedt, E., Crawford, L. E., & Proffitt, D. R. (2015). Judgments of others’ heights are
biased toward the height of the perceiver. Psychonomic Bulletin & Review, 22(2),
566–571. https://doi.org/10.3758/s13423-014-0689-z
von Castell, C., Hecht, H., & Oberfeld, D. (2017). Measuring perceived ceiling height in
a visual comparison task. The Quarterly Journal of Experimental Psychology,
70(3), 516–532. https://doi.org/10.1080/17470218.2015.1136658
Vrij, A. (1997). Wearing Black Clothes: The Impact of Offenders’ and Suspects’
Clothing on Impression Formation. Applied Cognitive Psychology, 11(1), 47–53.
Walker, D., & Vul, E. (2014). Hierarchical Encoding Makes Individuals in a Group Seem
More Attractive. Psychological Science, 25(1), 230–235.
https://doi.org/10.1177/0956797613497969
Westheimer, G. (2008). Illusions in the spatial sense of the eye: Geometrical–optical
illusions and the neural representation of space. Vision Research, 48(20), 2128–
2142. https://doi.org/10.1016/j.visres.2008.05.016
Wickens, C. D., & Carswell, C. M. (2012). Information Processing. In G. Salvendy (Ed.),
Handbook of Human Factors and Ergonomics (pp. 117–161). John Wiley &
Sons, Inc. Retrieved from
http://onlinelibrary.wiley.com/doi/10.1002/9781118131350.ch5/summary
Zieber, N., Kangas, A., Hock, A., & Bhatt, R. S. (2015). Body Structure Perception in
Infancy. Infancy, 20(1), 1–17. https://doi.org/10.1111/infa.12064
80
Vita
Michael Patrick Lee Education
University of Kentucky:
- Ph.D., Experimental Psychology, Spring 2018 (expected)
- M.S., Experimental Psychology, August 2014
- Human-Technology Interaction Certificate, August 2014
- B.A., Psychology, May 2012, Summa Cum Laude
Selected Awards and Honors
2016 Outstanding Graduate Student in Cognition, Learning, and Performance
2012 Graduation- Departmental and University Honors
2012 Outstanding Psychology Major Award
2012 Oswald Research and Creativity Award
2012 Maurice A Clay Award for Outstanding Graduating Senior in College of Arts & Sciences
2011 Summer Research and Creativity Grant
Professional Experience:
Employment
2017 (fall) - present Senior User Researcher III at Bose Corporation
Manager: Polly Tandon ([email protected])
2017 (summer) User Researcher II (contractor) at Bose Corporation
Manager: Polly Tandon ([email protected])
Internships
2016 (summer) Usability Intern at Newell Brands
Manager: Noel Simpson, M.S. ([email protected])
2014 (fall) - 2016 (spring) Human Factors Intern at General Electric – Appliances and Lighting
Manager: Will Seidelman, M.S. ([email protected])
2012 (summer) Human Factors Intern at General Electric – Appliances and Lighting
Manager: Cathy Emery, Ph.D. ([email protected])
Research Assistant
2011- present University of Kentucky Center for Visualization and Virtual
Environments
Adviser: C. Melody Carswell, Ph.D. ([email protected])
Teaching Assistant
‘17(sp), ’16 (fa), ‘14(sp+su) Applications of Statistics in Psychology (PSY 216). University of
Kentucky. Professor: Steven Arthur, Ph.D.
‘16(sp), ’15(fa), ‘13(sp+fa) Cognitive Processes Advance Lecture/Lab (PSY 427). University of
Kentucky. Professor: Larry Gottlob, Ph.D. & Jonathan Golding,
Ph.D.
‘12 (fall) Introduction to Psychology (PSY 100). University of Kentucky.
Professor: Jonathan Golding, Ph.D.
81
Peer-Reviewed Publications
Popham, J., Lee, M., Sublette, M., Kent, T., & Carswell, C. M. (2017). Graphic vs. Text-Only
Résumés: Effects of Design Elements on Simulated Employment Decisions.
In Proceedings of the Human Factors and Ergonomics Society Annual Meeting (Vol. 61,
No. 1, pp. 1242-1246). Sage CA: Los Angeles, CA: SAGE Publications.
Kent, T. M., Carswell, C. M., Lee, M., & Sublette, M. A. (2017). Do Aesthetic Design Principles
Predict Visual Appeal of a Simple Control Panel?. In Proceedings of the Human Factors
and Ergonomics Society Annual Meeting (Vol. 61, No. 1, pp. 1414-1418). Sage CA: Los
Angeles, CA: SAGE Publications.
Chen, H. T., & Lee, M. (2017). Re-designing A Practice Test Into A Game. In Proceedings of the
Human Factors and Ergonomics Society Annual Meeting (Vol. 61, No. 1, pp. 1234-
1236). Sage CA: Los Angeles, CA: SAGE Publications.
Popham, J., Lee, M., Carswell, C.M., … (2016). Flashy or Functional: The Impact of Graphical
Content on the Effectiveness of Résumés. Proceedings of the 2016 International Annual
Meeting of the Human Factors and Ergonomics Society. Washington, DC
Kent, T. M., Fu, B., Walls, B. D., Seidelman, W., Sublette, M.A., Lee, M., Carswell, C. M.
(2016). Does an Abstract Weld Pool Visualization Help Novice Welders Assess the
Performance of a Weldbot?. Proceedings of the 2016 International Annual Meeting of the
Human Factors and Ergonomics Society. Washington, DC
Lee, M., Carswell, C. M., Miller-Spillman, K., & Sublette, M. (2015). Clothing & HF/E: A
Hedonomic and Eudaimonic Look at the Original Wearables. Proceedings of the 2015
International Annual Meeting of the Human Factors and Ergonomics Society, Los
Angeles, CA
Lee, M. P., Carswell, C. M., Seidelman, W., & Sublette, M. (2014). Environmental Control
Issues in a New Energy-Efficient Building. Ergonomics in Design: The Quarterly of
Human Factors Applications, 22(4), 8-14.
Lee, M. P., Kent, T., Carswell, C.M., Seidelman, W., & Sublette, M. (2014). Zebra-Striping:
Visual Flow in Grid-based Graphic Design. Proceedings of the 2014 International
Annual Meeting of the Human Factors and Ergonomics Society, Chicago, IL
Seidelman, W., Carswell, C. M., Kent, T., Lee, M., Fu, B., & Yang, R. (2014). User Centered
Design of a Hybrid-Reality Display for Weld Monitoring. CHI '14 Extended Abstracts on
Human Factors in Computing Systems. Toronto: ACM.
Seidelman, W., Carswell, C. M., Kent, T., Lee, M., Fu, B., & Yang, R. (2014). Development of a
Hybrid Reality Display for Welders through Applied Cognitive Task Analysis.
Proceedings of the Human Factors and Ergonomics Society 58th Annual Meeting.
Chicago, IL: Human Factors and Ergonomics Society.
Lee, M., Carswell, C.M., Seidelman, W., & Sublette, M. (2013). Green Expectations: The Story
of a Customizable Lighting Control Panel Designed to Reduce Energy Use. Proceedings
of the 2013 International Annual Meeting of the Human Factors and Ergonomics Society,
San Diego, CA: The Human Factors and Ergonomics Society
Sublette, M., Carswell, C.M., Seidelman, W., Lee, M., & Seals, W.B., (2013). Further
Explorations of the “White Space” Bias in Users’ Anticipation of Task Workload.
Proceedings of the Human Factors and Ergonomics Society 57th Annual Meeting. San
Diego, CA: Human Factors and Ergonomics Society.
82
Crouch, J., Lee, M., Carswell, C.M., Patrick, T., Seidelman, W., & Sublette, M., (2013). The
Impact of Aesthetic Design on Bus Shelter Usability. Proceedings of the Human Factors
and Ergonomics Society 57th Annual Meeting. San Diego, CA: Human Factors and
Ergonomics Society.
Lee, M., Carswell, C.M., Seidelman, W., & Sublette, M. (2012). The design of product
comparison tables and its effects on decision making. Proceedings of the 56th Annual
Meeting of the Human Factors and Ergonomics Society, Boston, MA: The Human
Factors and Ergonomics Society