exploring nasa’s harmonized landsat and sentinel-2 …
TRANSCRIPT
EXPLORING NASA’S HARMONIZED LANDSAT AND SENTINEL-2 (HLS) DATASET TOMONITOR DEFORESTATION IN THE AMAZON RAINFOREST
S. Lechler1 ∗, M. C. A. Picoli2, A. R. Soares2, A. Sanchez2, M. E. D. Chaves2, J. Verstegen1
1 Institute for Geoinformatics, University of Munster,Heisenbergstraße 2, 48149 Munster, Germany
(s.lechler, j.a.verstegen)@uni-munster.de2 General Coordination of Earth Observation - OBT
National Institute for Space Research (INPE)Av. dos Astronautas, 1758, Sao Jose dos Campos - SP, Brazil
(michelle.picoli,anderson.soares,alber.ipia, michel.chaves)@inpe.br
Commission III, WG III/7
KEY WORDS: HLS dataset, BFAST monitor, Random Forest, Brazilian Legal Amazon, Deforestation
ABSTRACT:
Deforestation is a threat to biodiversity and the world’s climate. As agriculture and mining areas grow, forest loss becomes unbear-able for the environment. Consequently, monitoring deforestation is crucial for decision makers to create polices. The most reliabledeforestation data about the Amazon forest is generated by the Brazil’s National Institute for Space Research (INPE) through itsPRODES project. This effort is labor and time intensive because it depends on visual interpretation from experts. Additionally,frequent Amazon’s atmospheric phenomena, such as clouds, difficult image analysis which induces alternative approaches such astime series analysis. One way to increase the number of images of an area consists of using images from different satellites. NASAprovides the Harmonized Landsat and Sentinel-2 (HLS) dataset solving spectral dissimilarities of satellite sensors. In this paper,the possibilities of HLS for forest monitoring are explored by applying two deforestation detection methods, Break Detection forAdditive Season and Trend (BFAST) monitor and Random Forest, over four different vegetation indices, NDVI, EVI, GEMI andSAVI. The SAVI index used as input for BFAST monitor performed the best in this data setup with 95.23% for deforested pixel,53.69% for non-deforested pixels. Although the HLS data is described as analysis ready, further pre-processing can enhance theoutcome of the analysis. Especially, since the cloud and cirrus cover in the Amazon causes gaps in the dataset, a best pixel methodis recommended to create patched images and thus a continuous time series as input for any land cover and land use classification.
1. INTRODUCTION
The Amazon rainforest is the largest rainforest in the world. Itis not only one of the largest and more diverse ecosystems butalso an important player in the South American hydrologicalcycle (Lovejoy and Nobre, 2019). The Amazon returns up to75% of its rainfall to the atmosphere. However, deforestationat large scale can transform it into a tropical Savannah, produ-cing a general loss of moisture and up to 50% of water run-off(Lovejoy and Nobre, 2019). Although, this fact is well-knownin the scientific literature, the deforestation rate in 2018–2019increased by 30% according to data collected by Brazil’s Na-tional Institute for Space Research (INPE) (INPE, 2019a), andthis current trend is to keep increasing during the future (Esco-bar, 2019).
The same Amazon characteristics of extent, diversity andabundant rain make it a difficult area for monitoring. Cloudcoverage is a significant problem when monitoring the forestthrough satellite images, and cloud cover persist during mostof both wet and dry seasons (Collow et al., 2016). Findingclear images for a specific date for the whole Amazon is incon-ceivable. For that reason, most analysis of Land Use and LandCover change over the Amazon forest use images of a few datesof the dry season into what is known as multi-temporal ana-lysis. One of the issues with this kind of analysis is the poten-tially long timespan between the deforestation and its detection,∗ Corresponding author
making it unsuitable for monitoring. The only viable alternat-ive are the time series analysis of images, where the persistentcloud coverage is counteracted by increasing the frequency ofthe images. However, the revisiting satellite time is measuredin weeks. To solve this problem, the National Aeronautics andSpace Administration (NASA) has recently developed a work-flow that harmonizes Landsat and Sentinel-2 images resultingin a high temporal resolution dataset, called the HarmonizedLandsat and Sentinel-2 (HLS) data.
In this paper, we explore the possibilities and restrictions ofusing HLS to assess deforestation in the Brazilian Amazon.Therefore, we compare four different spectral indices, NDVI,SAVI, GEMI and EVI. After calculating all indices for the giventime period, the images were stacked, creating time series as in-put for the two image classification methods: Break Detectionfor Additive Season and Trend (BFAST) monitor (Verbesseltet al., 2012) and Random Forest (Breiman, 2001) for SatelliteImage Time Series (SITS).
In the following sections, we review scientific literature, thenwe list the materials and the methods we used to test the HLSdataset. Later, we discuss the outcome of our experiments andfinally, we introduce some conclusions and recommendationsfor future works.
The International Archives of the Photogrammetry, Remote Sensing and Spatial Information Sciences, Volume XLIII-B3-2020, 2020 XXIV ISPRS Congress (2020 edition)
This contribution has been peer-reviewed. https://doi.org/10.5194/isprs-archives-XLIII-B3-2020-705-2020 | © Authors 2020. CC BY 4.0 License.
705

1.1 Background
The most important monitoring systems for the Brazilian LegalAmazon are the deforestation monitoring program (PRODES)and near real-time deforestation detection system (DETER);both of them are run by INPE. On the one hand, PRODESproduces a yearly report of deforestation since 1988 by visu-ally analysing large sets of Landsat, Sentinel, and CBERS im-ages (Souza et al., 2019). This labor-intensive task relies ontrained specialists to determine deforested areas based on threecriteria: Color, texture and context. On the other hand, theDETER alert system uses images from MODIS and CBERSsatellites (Souza et al., 2019). The images provided by thesensors aboard new CBERS-4A satellite will improve deforest-ation monitoring as they have a finer temporal resolution of twoor three days. The DETER system automatically analyses im-ages as soon as they arrive and then proceeds to immediatelyalert the authorities (the Brazilian Institute of Environment andRenewable Natural Resources) and to release a monthly reportof deforestation and forest degradation. Whereas the PRODESproject is more accurate, the DETER system is faster.
As the public awareness of deforestation rises, more researchis conducted and more projects on deforestation monitoring areinitiated (Grinand et al., 2013; Hamunyela et al., 2016; Brownet al., 2016; Cabral et al., 2018; Yang et al., 2019; Schultz et al.,2018). A variety of images from several earth observation pro-jects as well as different combinations of methods and indiceswere tested in these studies.
For example, Yang et al. (2019) analysed deforestation and itsdriving factors in Myanmar’s rainforest. To determine land useand land cover classifications, the authors analysed Landsat im-ages with 30m spatial resolution from 1988 to 2017. They ap-plied a linear decomposition method on the computed indexesNormalized Difference Soil Index (NDSI), the Normalized Dif-ference Vegetation Index (NDVI), and the Modified Normal-ized Difference Water Index (MNDWI). Later, they trained aDecision Tree using a sample dataset of land use and land covercollected through visual analysis. The results were used asthresholds for each land use and land cover category. Theyevaluated the accuracy of their results through a hybrid mat-rix precision authentication. After successfully extracting theraster values, they analysed the land cover classification andconducted a time change analysis of the forest. In this way,they successfully identified the areas of forest cover reductionand increase (average accuracy of ca. 88%) and the reasons ofthese change (e.g., cropland expansion).
Another example is Grinand et al. (2013), who identified de-forestation in the Madagascar wet forest using Landsat/TM im-agery. They calculated the NDVI and the Normalized InfraredIndex (NIRI). They did not remove the clouds from the imagesbut rather developed different strategies to handle no-data val-ues. For example, if a pixel was forested at date one and threebut cloudy at date two, it was considered as forested throughoutthe whole time period. Hence, using a cloud-mask was onlynecessary when a cloud or a shadow was observed at date two,while forest was observed at date one and deforestation at datethree. To determine the deforested areas, they applied RandomForest. Their validation revealed that 84.7% was stable landcover 60.7% was land cover change.
Deforestation in the Amazon was researched, among others,by Cabral et al. (2018). They used the Global Forest Change(HD) (Hansen et al., 2013) and PRODES datasets to determine
each type of protected area and to sample outside these areasto create forest loss maps from 2002 to 2016. They establisheda forest fragmentation model using ArcGIS Patch Analyst andVector-based Landscape Analysis Tools (V-LATE); later, theyevaluated the levels of fragmentation using Principal Compon-ent Analysis (Cabral et al., 2018). The outcome was an as-sessment of the deforestation dynamics in the Brazilian LegalAmazon.
Since the HLS dataset is fairly new, only a limited amount ofresearch has been conducted with it (Lei et al., 2018; Pasticket al., 2018; Franch et al., 2019; Zhou et al., 2019; Griffithset al., 2019; Torbick et al., 2018), especially in the context ofLand Use and Land Cover change. Zhou et al. (2019) invest-igated if the HLS dataset improves the accuracy of the assess-ment of grassland dynamics compared to the Landsat-8 data-set. Although running into difficulties like varying observationfrequency and spatial inconsistencies, the HLS dataset consist-ently lead to better results than using Landsat-8 data (Zhou etal., 2019). Others were also able to enhance their frameworks.Pastick et al. (2018) were able to create a continuous time serieswith HLS data by filling in gaps with additional satellite im-ages. Thus, their modelling framework was better able to mon-itor land-surface dynamics.
2. MATERIAL AND METHODS
Two case studies were conducted using the same dataset. Thetwo different approaches and the different use of data in thesemethods permits making concrete statements about the use ofthe data and whether or not it is Analysis-Ready Data (ARD)(Claverie et al., 2018).
2.1 Study Area
The Amazon forest is the largest rainforest in the world andspreads across several countries with its biggest area located innorth-west Brazil. It is home to over 14,000 species, of which6,727 are trees (Cardoso et al., 2017). The Mato Grosso State issituated in the Brazilian Legal Amazon region and is the third-largest state of Brazil. The study area lies south-west of the
Figure 1. HLS tiles used in this study.
The International Archives of the Photogrammetry, Remote Sensing and Spatial Information Sciences, Volume XLIII-B3-2020, 2020 XXIV ISPRS Congress (2020 edition)
This contribution has been peer-reviewed. https://doi.org/10.5194/isprs-archives-XLIII-B3-2020-705-2020 | © Authors 2020. CC BY 4.0 License.
706

capital Cuiaba next to the Xingu Indigenous Park, see Figure 1.From 1988 to 2019, around 33% of the forest has been cut inMato Grosso State (TerraBrasilis, 2019), recently getting closerto the border of the park.
2.2 Orbital data
As deforestation often does not occur on a large scale at onesingle location, high spatial resolution data is needed to accur-ately detect it (Kalamandeen et al., 2018). Additionally, hightemporal resolution helps when dealing with areas with cloudcoverage because it increases the chances of acquiring cloud-free pixels. Thus, in this study, data from the HLS project isused.
The HLS project produces long-term surface reflectance datawith high temporal and spatial resolutions so users can exploreeach pixel through time (Claverie et al., 2018). Hereto, im-ages from the European Unions Copernicus project from theSentinel-2 satellite are harmonized with images from the Land-sat program and provided through their website. The resultingimages have a spatial resolution of 30m, are atmosphericallycorrected (Claverie et al., 2018) and have a temporal resolutionof two to three days. Additionally, this data provides a qualityanalysis layer where each pixel is evaluated and characterizedby the presence of cloud, cirrus, cloud-shadow, water or with aaerosol quality (Masek et al., 2018). For the case study, the tiles21LYG and 21LYH were used.
2.3 Training data
The training data for the Random Forest algorithm belongs tofour categories: Agriculture, Pasture, Forest, Deforestation. Forthe first three categories, samples were collected visually fromhigh resolution satellite images by specialists being careful thatthe land cover was not changing over the monitoring period.The deforestation samples were collected from the PRODESdataset, where the centroids of the polygons were calculated toavoid border confusion. These points were labeled accordingto the years that the deforestation happened. For example, in2018, a total of 266 samples were used for tile 21LYG and 428for tile 21LYH. With this point layer and the time series for theconcerning PRODES year, a matrix with training values wascreated.
2.4 Validation data
The most accurate data concerning deforestation in Brazil canbe acquired from the TerraBrasilis platform (INPE, 2019b).Thus, to validate the results of the analysis, the shapefile”Yearly deforestation increments - Shapefile (2008/2018)” wasdownloaded. It shows the yearly deforestation polygons from2008 until 2018 with sublayers for each year and was producedby the PRODES project.
2.5 Image Pre-processing and calculation of indices
Trying to avoid the problems of different data frequency asdescribed by Zhou et al. (2019), only one image per monthis selected for creating a time series. To pick the best suitedimage for ever month from 2013 to 2018, the images wereranked based on their cloud cover and spatial coverage of thetile. The best ranked image, meaning the least cloud cover-age and the highest spatial coverage, was then further processedfor calculations. The first processing step was extracting cloudmasks from the quality assessment layer to, then, replace the
cloud pixels with a no-data value. Secondly, indices for theanalysis were calculated with these cloud free images. Theindices tested were selected based on the performance evalu-ation from Schultz et al. (2016a). Accordingly, the normalizeddifference vegetation index (NDVI) a measurement to evalu-ate photosynthetic activity Tucker (1979), the enhanced vegeta-tion index (EVI) adjusting the vegetation index in high biomassregions (Huete et al., 1994), the global environment monitor-ing index (GEMI) enabling large-scale monitoring (Pinty, Ver-straete), and the soil-adjusted vegetation index (SAVI) describ-ing dynamic soil-vegetation systems (Huete, 1988). Whilst cal-culating, all values were compressed to the indices ranges if nota no data value to reduce later confusions when running the al-gorithms. Lastly, the index images were stacked in temporalorder to create a time series as input for the BFAST monitorand the Random Forest algorithms.
2.6 Deforestation detection using BFAST monitor
Break Detection for Additive Season and Trend (BFAST) mon-itor is an algorithm that enables near real-time disturbancemonitoring and includes a BFAST seasonal model approach(Verbesselt et al., 2012). It makes use of a history monitoringperiod to create a stable model, thus having the ability to dis-regard gaps int the time-series. With this model disturbances ina time-series can be detected during the monitoring period andin newly arrived data. The most important advantages for thisstudy are that it can deal with gaps in the time series and that ittakes the full details of the whole time series into account.
BFAST monitor version 0.3 in Python (Gieseke et al., 2019)was used to detect breaks and in the created time series. It is ac-knowledged that BFAST and BFAST monitor are meant to de-tect breaks in the established behavior of time series. However,in this case it was used as a satellite image classifier taking intoaccount that PRODES provides masks of primary forest, that is,forest that remains intact since the beginning of the PRODESproject. Any change to that forest is considered as deforesta-
Figure 2. PRODES and BFAST monitor breaks with indicesNDVI (top-left), GEMI (top-right), EVI (bottom-left) and SAVI
(bottom-right) at tile 21LYH from August 2016 to July 2018
The International Archives of the Photogrammetry, Remote Sensing and Spatial Information Sciences, Volume XLIII-B3-2020, 2020 XXIV ISPRS Congress (2020 edition)
This contribution has been peer-reviewed. https://doi.org/10.5194/isprs-archives-XLIII-B3-2020-705-2020 | © Authors 2020. CC BY 4.0 License.
707

Figure 3. PRODES and BFAST Break Detection with SAVIIndex for 2017-2018 at tile 21LYH.
tion. Even if the forest is removed and it grows again is con-sidered as secondary forest. Under this premise, any change toprimary forest is deforestation. Since BFAST is able to detectchanges in time series of vegetation indices, it can be assumedthat any disturbance to the regular phenological cycle of thePRODES’ primary forest is deforestation. Under the aforemen-tioned assumptions, BFAST can be used as a satellite imageclassifier instead of its traditional use as a time series break de-tector.
For the initial runs, monthly data from 2016 until 2018 wasused. For these runs, the history period was set from Janu-ary 2016 to December 2017 and the monitoring period, con-sequently, set from January 2018 until December 2018. Theresults of these runs were not meaningful since the algorithmdetected breaks in nearly all pixels. Therefore, different com-binations of parameters have been tried which, neither, led tomeaningful results. So, data from 2013 until 2015 was ad-ded and the history period was changed to January 2013 untilJuly 2016 and, consequently, the monitoring period from Au-gust 2016 to July 2018 to fit the PRODES year (from Augustto July). After several cycles with adjusted parameters and nosignificant improvement, the results of the run with the defaultvariables, k = 3, trend = True, hfrac = 0.25 and level = 0.05 areevaluated.
2.7 Deforestation detection using Random Forest for SITSclassification
Random Forest is a machine learning algorithm, that randomlyselects a set of training data observations and variables and cre-ates decision trees (Breiman, 2001). With aggregation and ap-plying a majority vote rule, the final class for each pixel is es-tablished.
For this study, the Random Forest algorithm of the sklearn Py-thon library, version 0.21.3, was used. With the prepared train-ing matrix, described in section 2.3, and an array containingthe labels for each pixel a Random Forest classifier was created
with 500 trees, default, and using out-of-bag samples to estim-ate the generalization accuracy. After fitting it to the trainingdata the time series was classified.
3. RESULTS AND DISCUSSION
The results were evaluated in three steps. Firstly, the deforest-ation detection layer were visually compared to the PRODESlayer. Secondly, the percentage of correctly classified pixelswere calculated and lastly the Kappa index was determined.
BFASTmonitorIndex Deforested Other Kappa IndexNDVI 0.34% 99.69% 0.0005GEMI 80.15% 60.16% 0.0236SAVI 95.23% 53.69 0.0247EVI 97.84% 5.07% 0.0007
RFIndex Deforested Other Kappa IndexNDVI 14.43% 99.76% 0.2020GEMI 3.58% 99.25% 0.0341SAVI 22.97% 99.59% 0.2868EVI 11.12% 98.97% 0.1028
Table 1. Correctness assessment of pixel classification.
3.1 BFAST monitor
The resulting break detection layer was firstly visually analysedand compared with the results of PRODES from the concerningyears in a validation process. As seen in Figure 2 and Figure3, detected changes intersect with the results from PRODES.Unfortunately, the algorithm not only results in abrupt breaksof forest land cover and land use but in a lot of noise and alsofalse positives.
Additionally, the algorithm performed differently with the dif-ferent indices. Using the NDVI index as input, barely anybreaks were detected, see Figure 2 top left. With the EVI in-dex, BFAST monitor identified breaks nearly everywhere evenin the regions where forest covers the land throughout the wholemonitoring period. The GEMI and SAVI indices detected, ad-ditional to deforestation, changes in most areas that are agricul-tural used.
Comparing the detected deforestation from PRODES to the de-tected breaks by calculating the Kappa index and the percent-age of correctly classified pixel, one can find additional evid-ence on how differently the indices performed. Only 0.34% ofthe deforestation pixels were classified correctly as deforesta-tion when using the NDVI index, as seen in Table 1. In com-parison to the NDVI the EVI index performed opposite with ahigh accuracy in deforested pixels (97.84%) but low accuracy inother pixel (5.07%). Comparing the Kappa index, it shows littledifference, with 0.0005 for NDVI and 0.0007 for EVI. Notice-able is, that the GEMI index detects deforestation more accuratethan the NDVI and EVI, which contrasts the results of Schultzet al. (2016). The GEMI index showed 80.15% accuracy fordeforested pixel, 60.16 % for non-deforested pixel and a Kappaindex of 0.0236. But, agreeing with Schultz et al.(2016), theSAVI index resulted in the highest accuracy levels with 95.23%for deforested pixel, 53.69 % for non deforested pixels and aKappa index of 0.0247. The GEMI index turned out to be a lessaccurate .
The International Archives of the Photogrammetry, Remote Sensing and Spatial Information Sciences, Volume XLIII-B3-2020, 2020 XXIV ISPRS Congress (2020 edition)
This contribution has been peer-reviewed. https://doi.org/10.5194/isprs-archives-XLIII-B3-2020-705-2020 | © Authors 2020. CC BY 4.0 License.
708
With the SAVI and the GEMI, indices one can find correlationswith the temporal extent of their detection. As seen in the de-tail view of Figure 3, it is also noticeable that the detectiontime of the BFAST monitor method does not always intersectwith the detecting time of PRODES. The difference betweenthe PRODES deforestation layer and BFAST monitor detectedbreaks is also seen in assessing the correctness of the classi-fied pixel, see Table 1. Thus, detecting deforestation was notsuccessful with these settings and indices.
3.2 Random Forest
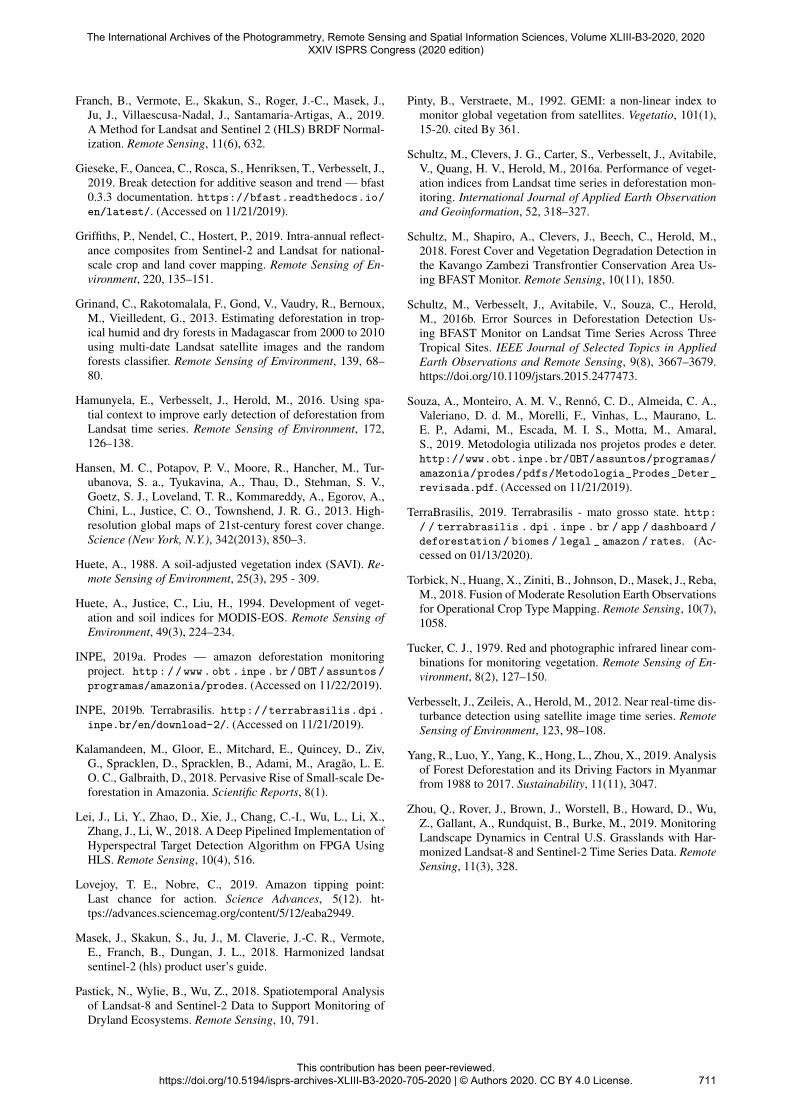
Running the Random Forest Classification with the same datathan BFAST monitor results in less noise and false positives.As seen in Figure 4, the four indices still performed differently.For the analysis the Agriculture, Pasture and Forest classesare summarized as non-deforested. A visual comparison onthe whole classified image rules out the GEMI index due totoo much noise and foggy outlines. This conjecture gets con-firmed when calculating the accuracy. For deforested pixels,only 3.58% were detected. A thorough analysis of the distinctfeature showed in the detailed view in Figure 4 leads to the be-lief that the NDVI index performs the best in combination withthe Random Forest algorithm in this area. Assessing the accur-acy statistically, it becomes apparent, that the SAVI index cre-ated slightly better results than the NDVI index, with a Kappaindex of 0.2868 for SAVI and 0.2020 for NDVI, see Table 1 .
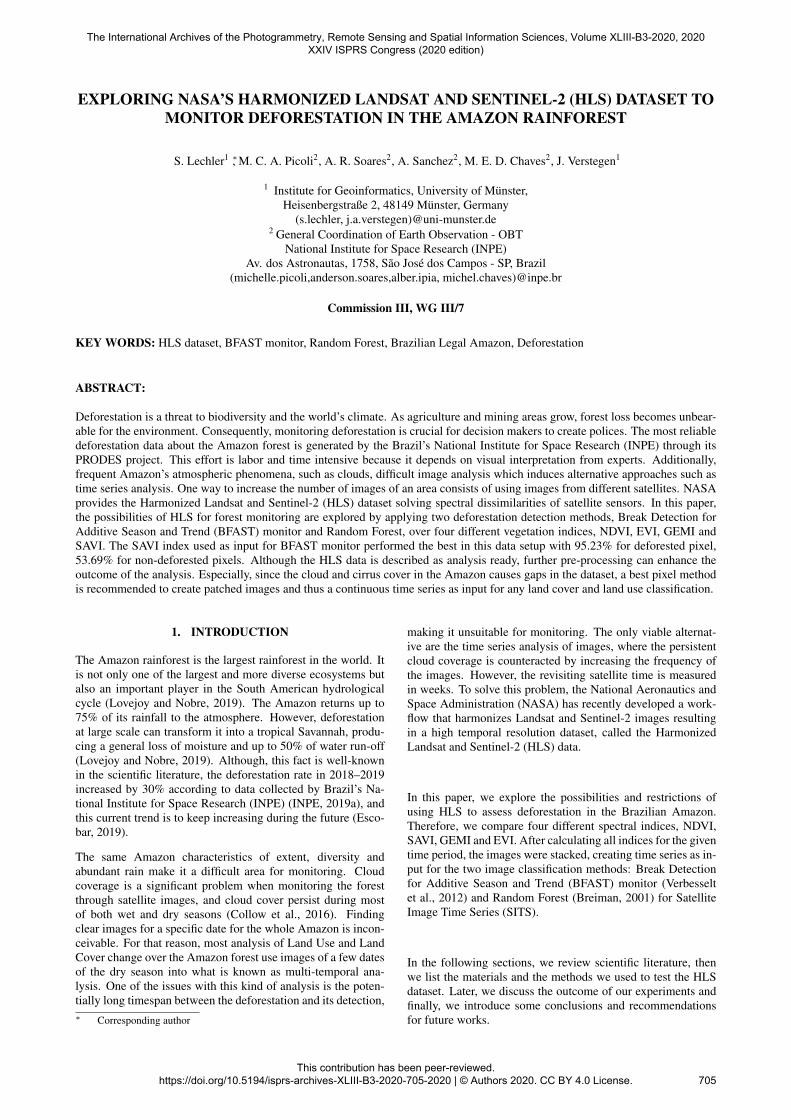
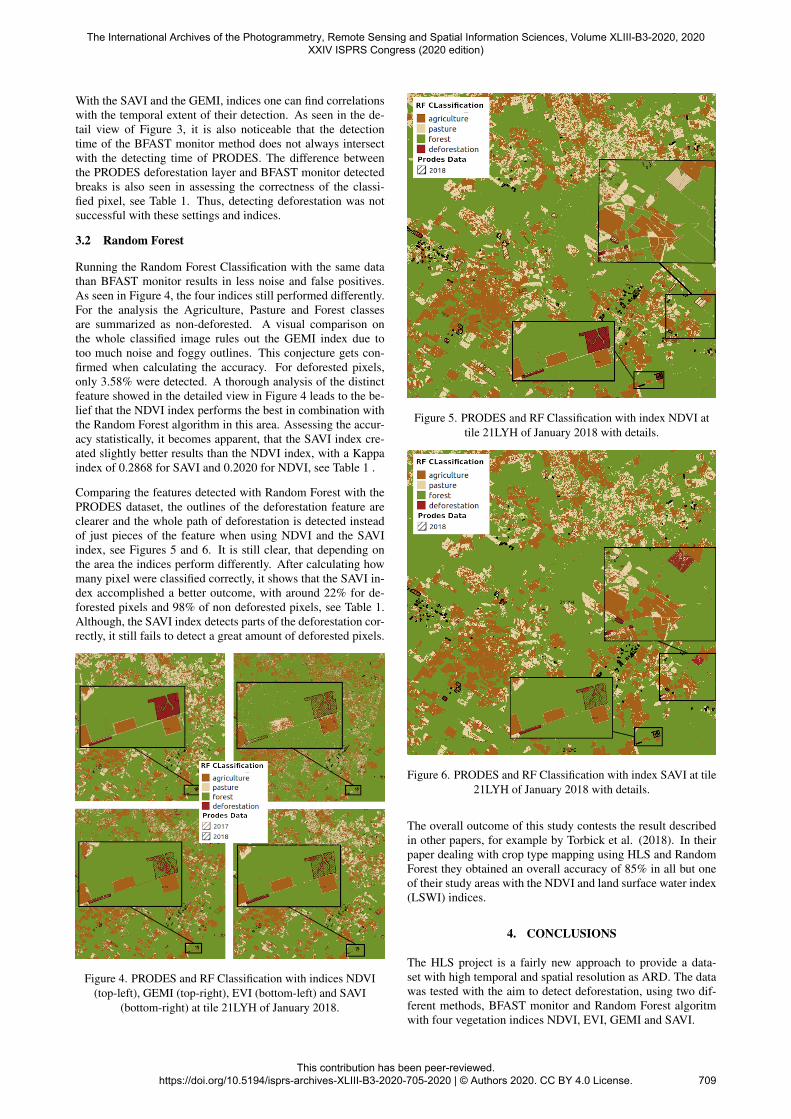
Comparing the features detected with Random Forest with thePRODES dataset, the outlines of the deforestation feature areclearer and the whole path of deforestation is detected insteadof just pieces of the feature when using NDVI and the SAVIindex, see Figures 5 and 6. It is still clear, that depending onthe area the indices perform differently. After calculating howmany pixel were classified correctly, it shows that the SAVI in-dex accomplished a better outcome, with around 22% for de-forested pixels and 98% of non deforested pixels, see Table 1.Although, the SAVI index detects parts of the deforestation cor-rectly, it still fails to detect a great amount of deforested pixels.
Figure 4. PRODES and RF Classification with indices NDVI(top-left), GEMI (top-right), EVI (bottom-left) and SAVI
(bottom-right) at tile 21LYH of January 2018.
Figure 5. PRODES and RF Classification with index NDVI attile 21LYH of January 2018 with details.
Figure 6. PRODES and RF Classification with index SAVI at tile21LYH of January 2018 with details.
The overall outcome of this study contests the result describedin other papers, for example by Torbick et al. (2018). In theirpaper dealing with crop type mapping using HLS and RandomForest they obtained an overall accuracy of 85% in all but oneof their study areas with the NDVI and land surface water index(LSWI) indices.
4. CONCLUSIONS
The HLS project is a fairly new approach to provide a data-set with high temporal and spatial resolution as ARD. The datawas tested with the aim to detect deforestation, using two dif-ferent methods, BFAST monitor and Random Forest algoritmwith four vegetation indices NDVI, EVI, GEMI and SAVI.
The International Archives of the Photogrammetry, Remote Sensing and Spatial Information Sciences, Volume XLIII-B3-2020, 2020 XXIV ISPRS Congress (2020 edition)
This contribution has been peer-reviewed. https://doi.org/10.5194/isprs-archives-XLIII-B3-2020-705-2020 | © Authors 2020. CC BY 4.0 License.
709

Masking out the clouds based on the quality assessment layerturned out to be rather inaccurate, which was also described byPastick et al. (2018). A visual analysis of a random selection ofcloud-free images showed some fuzzy edges, where either toomuch cloud or too little was detected. On other images wholeclouds were not detected at all. This inaccuracy might have ledto inaccuracies in the later analysis.
In the conducted studies, BFAST monitor and Random Forestwere tested under the same conditions. At first glance, thevisual analysis showed that the results of the Random Forestalgorithm were more precise than the results from BFAST mon-itor. When calculating the fractions of the correctly calculateddeforested pixels, it becomes apparent, that overall the SAVI in-dex lead to the best results in this study area with the HLS data-set with both methods. The NDVI, which resulted in secondbest results with Random Forest, performed the worst withBFAST monitor. Besides, the GEMI index generated better res-ults using BFAST monitor than NDVI and EVI but producedthe most noise using Random Forest. The EVI index resultedin low performance in both algorithms although seeing overallbetter outcomes with the Random Forest algorithm.
Still, the results of the study using BFAST monitor are overallunsatisfying. This might be due to the holes in the time-seriesdue to high cloud coverage especially during the months of therain season from December to May, although Verbesselt et al.(2012) describe that data gaps will not effect the outcome. In anewer paper Schultz et al. (2016b) describe the impact of obser-vation frequency when using BFAST monitor. They concludethat data availability is highly correlated to error omission. Ad-ditionally, the inaccuracy might also be because of other at-mospheric disturbance. The original study of BFAST monitorwas conducted in Somalia, an area with semi-arid tropical cli-mate and little seasonal change in temperature (Verbesselt etal., 2012). Thus, it is possible that the constant air humidity inthe Amazon can create disturbance that is not accounted for inthe BFAST monitor algorithm(Collow et al., 2016). Moreover,the seasonal change in Mato Grosso State is significantly higherthan in Somalia, in function of the agricultural dynamics. Theagriculture plays not as an important role in Somalia as it doesin the Amazon region.
5. FUTURE WORK
Further investigations of the use of this dataset, especially inthe Brazilian Legal Amazon, should take different aspects intoaccount. First of all, a more precise cloud mask needs to becreated thus ensuring an accurate time series. An evaluationof different cloud masks was for example done by Beatens etal. (2019). Additionally, to fill the wholes in the time seriesarising from masking out the clouds, a best pixel method, asfor example described by Griffiths et al. (2019), should be es-tablished. Evaluating each pixel based on a variety of features,for example the spatial distance to the next cloud or the tem-poral distance to the target date, facilitates an image aggrega-tion based on the best rated pixel. This results in a high qualitypatched image, easier processable in time series analysis.
As especially BFAST monitor detected more seasonal changenot only in EVI index but also in GEMI and SAVI indices it isfurther to investigate if removing seasonal variance can enhancethe performance of detecting breaks only in the forest region.Hence, methods like Hamunyela et al. (2016) can be applied
to this dataset. They developed a method to integrate the spa-tial context into an early deforestation detection method. TheNDVI index derived from Landsat-5/TM and Landsat-7/ETM+was used in their study case that analyzed dry forest in Boliviaand wet forest in Brazil. They reduced seasonal variance basedon their spatial context with a moving window approach. Com-paring their method to a season model-based approach, usingthe spatial context resulted in higher accuracy and less temporaldelay.
6. ACKNOWLEDGEMENTS
The authors thank the Amazon Fund through the financial col-laboration of the Brazilian Development Bank (BNDES), theFoundation for Science, Technology and Space Applications(FUNCATE) no. 17.2.0536.1 (Brazil Data Cube project) andthe PROMOS mobility programme (DAAD).
References
Baetens, L., Desjardins, C., Hagolle, O., 2019. Validation ofCopernicus Sentinel-2 Cloud Masks Obtained from MAJA,Sen2Cor, and FMask Processors Using Reference CloudMasks Generated with a Supervised Active Learning Proced-ure. Remote Sensing, 11(4), 433.
Breiman, L., 2001. Random Forests. Machine Learning, 45(1),5–32.
Brown, D. S., Brown, J. C., Brown, C., 2016. Land occupationsand deforestation in the Brazilian Amazon. Land Use Policy,54, 331–338.
Cabral, A. I., Saito, C., Pereira, H., Laques, A. E., 2018. Defor-estation pattern dynamics in protected areas of the BrazilianLegal Amazon using remote sensing data. Applied Geo-graphy, 100, 101–115.
Cardoso, D., Sarkinen, T., Alexander, S., Amorim, A. M., Bit-trich, V., Celis, M., Daly, D. C., Fiaschi, P., Funk, V. A., Gi-acomin, L. L., Goldenberg, R., Heiden, G., Iganci, J., Kelloff,C. L., Knapp, S., de Lima, H. C., Machado, A. F. P., dos San-tos, R. M., Mello-Silva, R., Michelangeli, F. A., Mitchell, J.,Moonlight, P., de Moraes, P. L. R., Mori, S. A., Nunes, T. S.,Pennington, T. D., Pirani, J. R., Prance, G. T., de Queiroz,L. P., Rapini, A., Riina, R., Rincon, C. A. V., Roque, N.,Shimizu, G., Sobral, M., Stehmann, J. R., Stevens, W. D.,Taylor, C. M., Trovo, M., van den Berg, C., van der Werff,H., Viana, P. L., Zartman, C. E., Forzza, R. C., 2017. Amazonplant diversity revealed by a taxonomically verified spe-cies list. Proceedings of the National Academy of Sciences,114(40), 10695–10700.
Claverie, M., Ju, J., Masek, J. G., Dungan, J. L., Vermote, E. F.,Roger, J.-C., Skakun, S. V., Justice, C., 2018. The Harmon-ized Landsat and Sentinel-2 surface reflectance data set. Re-mote Sensing of Environment, 219, 145–161.
Collow, A. B. M., Miller, M. A., Trabachino, L. C., 2016.Cloudiness over the Amazon rainforest: Meteorology andthermodynamics. Journal of Geophysical Research: Atmo-spheres, 121(13), 7990–8005.
Escobar, H., 2019. Brazil’s deforestation is exploding—and2020 will be worse. Science.
The International Archives of the Photogrammetry, Remote Sensing and Spatial Information Sciences, Volume XLIII-B3-2020, 2020 XXIV ISPRS Congress (2020 edition)
This contribution has been peer-reviewed. https://doi.org/10.5194/isprs-archives-XLIII-B3-2020-705-2020 | © Authors 2020. CC BY 4.0 License.
710
Franch, B., Vermote, E., Skakun, S., Roger, J.-C., Masek, J.,Ju, J., Villaescusa-Nadal, J., Santamaria-Artigas, A., 2019.A Method for Landsat and Sentinel 2 (HLS) BRDF Normal-ization. Remote Sensing, 11(6), 632.
Gieseke, F., Oancea, C., Rosca, S., Henriksen, T., Verbesselt, J.,2019. Break detection for additive season and trend — bfast0.3.3 documentation. https://bfast.readthedocs.io/en/latest/. (Accessed on 11/21/2019).
Griffiths, P., Nendel, C., Hostert, P., 2019. Intra-annual reflect-ance composites from Sentinel-2 and Landsat for national-scale crop and land cover mapping. Remote Sensing of En-vironment, 220, 135–151.
Grinand, C., Rakotomalala, F., Gond, V., Vaudry, R., Bernoux,M., Vieilledent, G., 2013. Estimating deforestation in trop-ical humid and dry forests in Madagascar from 2000 to 2010using multi-date Landsat satellite images and the randomforests classifier. Remote Sensing of Environment, 139, 68–80.
Hamunyela, E., Verbesselt, J., Herold, M., 2016. Using spa-tial context to improve early detection of deforestation fromLandsat time series. Remote Sensing of Environment, 172,126–138.
Hansen, M. C., Potapov, P. V., Moore, R., Hancher, M., Tur-ubanova, S. a., Tyukavina, A., Thau, D., Stehman, S. V.,Goetz, S. J., Loveland, T. R., Kommareddy, A., Egorov, A.,Chini, L., Justice, C. O., Townshend, J. R. G., 2013. High-resolution global maps of 21st-century forest cover change.Science (New York, N.Y.), 342(2013), 850–3.
Huete, A., 1988. A soil-adjusted vegetation index (SAVI). Re-mote Sensing of Environment, 25(3), 295 - 309.
Huete, A., Justice, C., Liu, H., 1994. Development of veget-ation and soil indices for MODIS-EOS. Remote Sensing ofEnvironment, 49(3), 224–234.
INPE, 2019a. Prodes — amazon deforestation monitoringproject. http://www.obt.inpe.br/OBT/assuntos/
programas/amazonia/prodes. (Accessed on 11/22/2019).
INPE, 2019b. Terrabrasilis. http://terrabrasilis.dpi.
inpe.br/en/download-2/. (Accessed on 11/21/2019).
Kalamandeen, M., Gloor, E., Mitchard, E., Quincey, D., Ziv,G., Spracklen, D., Spracklen, B., Adami, M., Aragao, L. E.O. C., Galbraith, D., 2018. Pervasive Rise of Small-scale De-forestation in Amazonia. Scientific Reports, 8(1).
Lei, J., Li, Y., Zhao, D., Xie, J., Chang, C.-I., Wu, L., Li, X.,Zhang, J., Li, W., 2018. A Deep Pipelined Implementation ofHyperspectral Target Detection Algorithm on FPGA UsingHLS. Remote Sensing, 10(4), 516.
Lovejoy, T. E., Nobre, C., 2019. Amazon tipping point:Last chance for action. Science Advances, 5(12). ht-tps://advances.sciencemag.org/content/5/12/eaba2949.
Masek, J., Skakun, S., Ju, J., M. Claverie, J.-C. R., Vermote,E., Franch, B., Dungan, J. L., 2018. Harmonized landsatsentinel-2 (hls) product user’s guide.
Pastick, N., Wylie, B., Wu, Z., 2018. Spatiotemporal Analysisof Landsat-8 and Sentinel-2 Data to Support Monitoring ofDryland Ecosystems. Remote Sensing, 10, 791.
Pinty, B., Verstraete, M., 1992. GEMI: a non-linear index tomonitor global vegetation from satellites. Vegetatio, 101(1),15-20. cited By 361.
Schultz, M., Clevers, J. G., Carter, S., Verbesselt, J., Avitabile,V., Quang, H. V., Herold, M., 2016a. Performance of veget-ation indices from Landsat time series in deforestation mon-itoring. International Journal of Applied Earth Observationand Geoinformation, 52, 318–327.
Schultz, M., Shapiro, A., Clevers, J., Beech, C., Herold, M.,2018. Forest Cover and Vegetation Degradation Detection inthe Kavango Zambezi Transfrontier Conservation Area Us-ing BFAST Monitor. Remote Sensing, 10(11), 1850.
Schultz, M., Verbesselt, J., Avitabile, V., Souza, C., Herold,M., 2016b. Error Sources in Deforestation Detection Us-ing BFAST Monitor on Landsat Time Series Across ThreeTropical Sites. IEEE Journal of Selected Topics in AppliedEarth Observations and Remote Sensing, 9(8), 3667–3679.https://doi.org/10.1109/jstars.2015.2477473.
Souza, A., Monteiro, A. M. V., Renno, C. D., Almeida, C. A.,Valeriano, D. d. M., Morelli, F., Vinhas, L., Maurano, L.E. P., Adami, M., Escada, M. I. S., Motta, M., Amaral,S., 2019. Metodologia utilizada nos projetos prodes e deter.http://www.obt.inpe.br/OBT/assuntos/programas/
amazonia/prodes/pdfs/Metodologia_Prodes_Deter_
revisada.pdf. (Accessed on 11/21/2019).
TerraBrasilis, 2019. Terrabrasilis - mato grosso state. http:/ / terrabrasilis . dpi . inpe . br / app / dashboard /
deforestation / biomes / legal _ amazon / rates. (Ac-cessed on 01/13/2020).
Torbick, N., Huang, X., Ziniti, B., Johnson, D., Masek, J., Reba,M., 2018. Fusion of Moderate Resolution Earth Observationsfor Operational Crop Type Mapping. Remote Sensing, 10(7),1058.
Tucker, C. J., 1979. Red and photographic infrared linear com-binations for monitoring vegetation. Remote Sensing of En-vironment, 8(2), 127–150.
Verbesselt, J., Zeileis, A., Herold, M., 2012. Near real-time dis-turbance detection using satellite image time series. RemoteSensing of Environment, 123, 98–108.
Yang, R., Luo, Y., Yang, K., Hong, L., Zhou, X., 2019. Analysisof Forest Deforestation and its Driving Factors in Myanmarfrom 1988 to 2017. Sustainability, 11(11), 3047.
Zhou, Q., Rover, J., Brown, J., Worstell, B., Howard, D., Wu,Z., Gallant, A., Rundquist, B., Burke, M., 2019. MonitoringLandscape Dynamics in Central U.S. Grasslands with Har-monized Landsat-8 and Sentinel-2 Time Series Data. RemoteSensing, 11(3), 328.
The International Archives of the Photogrammetry, Remote Sensing and Spatial Information Sciences, Volume XLIII-B3-2020, 2020 XXIV ISPRS Congress (2020 edition)
This contribution has been peer-reviewed. https://doi.org/10.5194/isprs-archives-XLIII-B3-2020-705-2020 | © Authors 2020. CC BY 4.0 License.
711