exploring safran riskdownload.safran.no/.../doc/risk/version7.1.5/exploring_safran_risk.pdf ·...
TRANSCRIPT

Exploring Safran Risk
Safran RiskTM
Copyright © 1999 - 2017, Safran Software Solutions. All Rights reserved.
Accuracy
Although every effort has been made to ensure the accuracy and completeness of this document, no
warranty, expressed or implied, is made by Safran Software Solutions as to the accuracy of this
publication and the features or the applicability of techniques suggested.
Copyright Notice
The information provided in this manual is for informational purposes only. It may be changed without
notice, and does not represent a commitment as to merchantability or fitness for a particular purpose by
Safran Software Solutions.
The software described in this manual is provided by Safran Software Solutions under a Safran License
Agreement. The software may be used only in accordance with the terms of the license agreement. No
part of this manual may be reproduced or transmitted in any form or by any means, electronic or
mechanical, including photocopying and recording, for any purpose without the express written
permission of Safran Software Solutions.
Safran is a registered trademark of Safran Software Solutions. Safran Project, Safran Details, Safran
Enterprise Developer, Safran Planner, Safran for the Microsoft Project Platform, Safran for Microsoft
Project, Safran Web Access and Working Smarter are trademarks of Safran Software Solutions. All other
brands and product names are trademarks or registered trademarks are property of their respective
holders.
Installation note: when installing Safran Risk, if you already have a Safran Project license in your
computer, you will get the full version of scheduling capability; otherwise, the standard scheduling
module will be installed for your Safran Risk.
Document version history
Safran Risk version 1 – March 2015 - Draft 1
Safran Risk version 1 – April 2015 - Draft 2
Safran Risk version 1.1 – June 2015 - Final version
Safran Risk version 1.5 – October 2015 - Draft
Safran Risk version 1.5 – November 2015 – Final version
Safran Risk version 1.6 – January 2016 – Final version
Safran Risk version 7.0 - April 2016 – Final version
Safran Risk version 7.1 - September 2016 – Final version
Safran Risk version 7.1.5 - May 2017- Final version

Safran RiskTM
I
Table of Contents Chapter 1 - Introduction ..................................................................................................................... 1
Audience .................................................................................................................................................... 1
How this book is organized ....................................................................................................................... 1
Chapter 2 - User interface and navigation ........................................................................................... 3
Tabs ........................................................................................................................................................... 3
Home Screen ............................................................................................................................................. 3
Ribbons ...................................................................................................................................................... 3
Quick Access Toolbar ................................................................................................................................. 4
Customizing Quick Access Toolbar ........................................................................................................ 4
View Icon Description ................................................................................................................................ 4
Shortcut menus ......................................................................................................................................... 5
Keyboard shortcuts ............................................................................................................................... 6
Wizards ...................................................................................................................................................... 6
Printing ...................................................................................................................................................... 6
Getting help in Safran Risk ........................................................................................................................ 7
Chapter 3 - Global Risks ...................................................................................................................... 8
Defining New Global Risks (Risk register) .................................................................................................. 8
The Global Risk Impact Table .................................................................................................................... 9
Delete Global Risks and Impacts ............................................................................................................. 10
Copy and Paste Global Risks .................................................................................................................... 10
Import and Export Global Risks ............................................................................................................... 11
Chapter 4 – Risk Calendars ................................................................................................................ 12
Generating Risk Calendars ....................................................................................................................... 12
Generating Risk Calendars from Template .......................................................................................... 12
Generating Risk Calendars from Time Series ...................................................................................... 15
Chapter 5 – Schedules ...................................................................................................................... 19
Defining Projects ..................................................................................................................................... 19
Creating a new project ............................................................................................................................ 19
Schedule Options ................................................................................................................................. 21
Subprojects .......................................................................................................................................... 23
Pictures and Texts ............................................................................................................................... 24

Safran RiskTM
II
Access .................................................................................................................................................. 24
User Defined Data (Userfields) ............................................................................................................ 24
Adding Userfields ................................................................................................................................ 26
Deleting a Userfield ............................................................................................................................. 26
Creating Value Lists for userfields ....................................................................................................... 26
Importing Reference Fields from File .................................................................................................. 27
Assigning Reference fields & codes from foreign tables ..................................................................... 27
Outline Codes ...................................................................................................................................... 28
Building Outline Codes from Reference Fields .................................................................................... 29
Formulas for User Defined fields ......................................................................................................... 29
Computed Fields .................................................................................................................................. 30
Resources and Costs ............................................................................................................................ 30
Adding Resource Definitions ............................................................................................................... 31
Deleting a Resource Definition ............................................................................................................ 32
Opening Existing Projects ........................................................................................................................ 32
Opening recent projects .......................................................................................................................... 33
Importing and Exporting Projects............................................................................................................ 33
Importing Safran Risk Data .................................................................................................................. 33
Importing Microsoft Project Data ....................................................................................................... 35
Importing Primavera XER data ............................................................................................................ 36
Exporting Data from your Safran Project Database ................................................................................ 38
Exporting to Safran Project Formats (V.5 & V.7) ................................................................................. 38
Exporting to Microsoft Project ............................................................................................................ 39
Exporting to Primavera ........................................................................................................................ 40
Project Properties .................................................................................................................................... 42
The Barchart Editor ................................................................................................................................. 42
Barchart Editor Workspace ................................................................................................................. 43
Choosing a View .................................................................................................................................. 44
Selecting Information Panes................................................................................................................ 44
Working with the Barchart Editor ........................................................................................................... 47
Setting the Barchart Editor Options .................................................................................................... 48
Adding and Editing Activities ............................................................................................................... 49
Easy Click and Drag Scheduling ........................................................................................................... 50

Safran RiskTM
III
To Change Activity IDs ......................................................................................................................... 50
Entering Activity Description ............................................................................................................... 50
Enter Activity Duration ........................................................................................................................ 50
Deleting Activities ................................................................................................................................ 51
Copy, Cutting and Pasting Activities .................................................................................................... 51
The Paste Special Option ..................................................................................................................... 52
Automatically Fill in Data Based on the Above Cell............................................................................. 53
To Automatically Link a Series of Activities ......................................................................................... 53
Stretching and Moving Activities on Screen ........................................................................................ 56
Assign Fields & Update of Activity Data .............................................................................................. 56
Adding Annotation Bars - Multiple Bars on a Single Row ................................................................... 57
Position the mouse pointer over the annotation bar, then press the right mouse button and select
the delete option. ................................................................................................................................ 57
Zooming the Content of the Barchart ................................................................................................. 58
Layouts .................................................................................................................................................... 59
What are Layouts? ............................................................................................................................... 59
Working with Layouts .......................................................................................................................... 59
Layouts and Summaries ...................................................................................................................... 64
Customizing the Barchart View ............................................................................................................... 66
Formatting the Columns Area ............................................................................................................. 66
Choosing Font and Color ..................................................................................................................... 69
Controlling Page Breaks ....................................................................................................................... 70
Formatting the Gantt area .................................................................................................................. 71
Customizing Bars and Symbols ............................................................................................................ 76
Sorting and Selecting ............................................................................................................................... 78
Sorting Data ......................................................................................................................................... 78
Selecting Data ...................................................................................................................................... 78
Grouping, Summarizing and Organizing the Schedule ............................................................................ 80
Define Group Levels ............................................................................................................................ 81
Creating an Outline.............................................................................................................................. 84
Customizing the Barchart Print Layout ................................................................................................... 85
Page Setup ........................................................................................................................................... 85
Print Preview ....................................................................................................................................... 85

Safran RiskTM
IV
Print Setup ........................................................................................................................................... 86
Calculation ............................................................................................................................................... 86
Global Change - Assign Fields .............................................................................................................. 86
Using Date Arithmetic ......................................................................................................................... 86
Deleting Data values ............................................................................................................................ 87
Assigning string Characters ................................................................................................................. 87
Assigning Duration fields ..................................................................................................................... 88
Assigning Reference fields ................................................................................................................... 88
Assigning Outline Codes ...................................................................................................................... 88
Changing Calendar Assignment ........................................................................................................... 88
To Run the Global Change ................................................................................................................... 88
Specify a Selection ............................................................................................................................... 88
Storing and using Assign Fields Expressions ........................................................................................ 88
Date calculator .................................................................................................................................... 89
ID Renumbering ................................................................................................................................... 90
Assign Link Fields ................................................................................................................................. 91
Project setup ........................................................................................................................................... 91
Calendars ............................................................................................................................................. 91
Profiles ................................................................................................................................................. 94
Resources ............................................................................................................................................ 96
Userfields ............................................................................................................................................. 97
Symbols ............................................................................................................................................... 97
Globals ............................................................................................................................................... 103
Rules .................................................................................................................................................. 104
Complex Rates ................................................................................................................................... 105
Database Support tools ..................................................................................................................... 106
Access Levels ..................................................................................................................................... 107
User Locking ...................................................................................................................................... 107
Project Schedule Options ...................................................................................................................... 108
To Modify the Analysis Options......................................................................................................... 108
Project Summary ............................................................................................................................... 109
Loop Check ........................................................................................................................................ 110
Out of Sequence ................................................................................................................................ 110

Safran RiskTM
V
Automatic Calculation ....................................................................................................................... 110
Chapter 6 - Schedule Warnings ....................................................................................................... 111
Open Items ............................................................................................................................................ 111
Accepted Items ...................................................................................................................................... 111
Exporting the Schedule Warning ........................................................................................................... 112
Chapter 7 - Project Risks ................................................................................................................. 113
Adding a New Project Risk ..................................................................................................................... 113
Risk Impact for Standard Risks .............................................................................................................. 114
Impact Activities Independently............................................................................................................ 115
Estimate Uncertainty Risks .................................................................................................................... 116
Risk Impact for Calendar Risks .............................................................................................................. 117
Mitigation .............................................................................................................................................. 117
Export and Import Project Risks ............................................................................................................ 118
XML .................................................................................................................................................... 118
Excel ................................................................................................................................................... 118
Delete Project Risks and impacts .......................................................................................................... 119
Chapter 8 - Correlation ................................................................................................................... 120
The Correlation Matrix .......................................................................................................................... 120
Inconsistent Matrix................................................................................................................................ 120
Chapter 9 - Risk Mapping ................................................................................................................ 122
What is Risk Mapping? .......................................................................................................................... 122
Assigning Risks ....................................................................................................................................... 122
Estimate Uncertainty Risks .................................................................................................................... 125
Activity Uncertainty ............................................................................................................................... 126
Converting Activity Uncertainty to Estimate Uncertainty Risks ............................................................ 126
Chapter 10 - Analyze Risks .............................................................................................................. 128
The Analyze tab ..................................................................................................................................... 128
Included Risks .................................................................................................................................... 128
Analysis Options ................................................................................................................................ 128
Focus Activities .................................................................................................................................. 130
Chapter - 11 Result Summary .......................................................................................................... 131
Chapter - 12 Distribution Graph ...................................................................................................... 132
Activity Tree ....................................................................................................................................... 135

Safran RiskTM
VI
Focus Percentiles ............................................................................................................................... 135
Graph Options ................................................................................................................................... 136
Graph Annotations ............................................................................................................................ 136
Data View and Post Analysis ............................................................................................................. 136
Chapter 13 - Drivers ........................................................................................................................ 138
Driver Options ................................................................................................................................... 139
Chapter 14 - Sensitivity Analysis ..................................................................................................... 140
Multiple Passes .................................................................................................................................. 142
Tornado View .................................................................................................................................... 143
Chapter 15 - Scatter Plot ................................................................................................................. 144
X and Y Axis ........................................................................................................................................ 144
Target Values ..................................................................................................................................... 145
JCL Bands ........................................................................................................................................... 145
Chapter 16 - Distribution Comparison ............................................................................................. 147
Reports .............................................................................................................................................. 148
Trending............................................................................................................................................. 148
Chapter 17 - Critical Path Map ........................................................................................................ 150
‘P’ Dates and Durations ......................................................................................................................... 151
Appendix A – Constraints................................................................................................................ 153
Logic ....................................................................................................................................................... 153
The start of an activity depends on the finish of the preceding one. ................................................... 153
Date Constraints .................................................................................................................................... 154
Target Start Early ............................................................................................................................... 155
Target Start Late ................................................................................................................................ 155
Target Complete Early ....................................................................................................................... 155
Target Complete Late ........................................................................................................................ 155
Fixed Start .......................................................................................................................................... 155
Fixed Finish ........................................................................................................................................ 155
As Late As Possible ............................................................................................................................ 155
Split Targets ....................................................................................................................................... 156

Safran RiskTM
1
Chapter 1 - Introduction
Audience Exploring Safran Risk documents features and techniques on how to use Safran Risk in order to identify,
map, analyze and manage associated risks in your project. It is assumed that the user understands the
basics of Project Management. It is further assumed that the user knows how to perform basic user
operations in the Windows environment. Exploring Safran Risk is aimed at both beginners and those who
already have experience in Risk analysis.
How this book is organized The following provides a brief overview of each section in the Exploring Safran Risk user guide.
User interface and navigation
Chapter 2 explains the user interface, introduces the functions of the Safran Risk windows, and briefly
describes how to navigate, use the keyboard, mouse and screen controls to use the application
effectively.
Global Risks
Chapter 3 describes how users can define global or common risks and how they can be shared across
your projects. Defining global risks will help you build a corporate risk structure for your projects. Global
Risks may be assigned to any project.
Risk Calendars
Chapter 4 delivers detail information on how to create and use risk calendars in your projects. Using risk
calendars allows you to model situations where there may be an uncertain amount of downtime, for
example due to adverse weather conditions.
Schedules
Chapter 5 explains how to create a project, add activity information, to work with logic and how to
define Resource requirements. In this chapter, you will get detailed instructions on setting up the
project’s calendars, profiles, userfield and rules. In addition, you will learn how to import and export
your projects.
Schedule warnings
Chapter 6 provides you with information on how the project analysis tool can give you detailed insight
into your schedule quality and pays particular attention to any areas that could present an issue when
running a risk analysis. You can use the schedule warning for assessing your schedule’s integrity and
credibility.
Project Risks
Chapter 7 will guide you through how to define the risks and impacts that will be applied to your project.
Correlations

Safran RiskTM
2
Chapter 8 explains why the correlation matrix is important for risk calculation and how you can correlate
the risks that you have identified in your project.
Risk Mapping
Chapter 9 will guide you through mapping the potential risks within your project.
Risk Analysis
Chapter 10 provides a complete overview of running the risk analysis and interpreting the results
including distribution graphs, sensitivity analysis and critical path maps.

Safran RiskTM
3
Chapter 2 - User interface and navigation The user interface and navigation chapter introduces the functions of the Safran Risk windows and
briefly describes how to navigate, use the keyboard, mouse and screen controls to use the application
effectively.
Tabs Tabs make it easy to organize and manage larger volumes of information. In addition to this, tabs also
assist and lead you through all the steps in a procedure. Safran Risk provides an easy access to its
powerful functions simply through navigation between tabs. The Safran Risk view is designed to
configure the functional tabs available based upon the ‘active’ project.
Detailed instructions on using these tabs is described in the following chapters.
Home Screen The first screen you see when you open Safran Risk is the home screen. Here you will find some
shortcuts that let you quickly open, create or import a project. In here you can also access two sections
that are hidden by default, Global Risks and Risk Calendars.
Also available on the home screen is ‘Save As’, this allows you to take a copy of currently open project
and all the associated risks and mappings. This can be very useful when you want to evaluate a number
of different scenarios / mitigation strategies.
Ribbons Each tab in Safran Risk, depending on its functionality, consists of a ribbon, which combines simplicity
with practicality. Ribbons provide a user-friendly interface, which makes an easy access to the
commands you need for working on your project. The ribbon in Schedule Tab has the familiar view of
Safran Project 7, which includes both the Quick Access Toolbar and the scheduling tabs.
Quick Access Toolbar
Scheduling tabs

Safran RiskTM
4
Quick Access Toolbar The Schedule tab in Safran Risk contains a Quick Access Toolbar, which is a small, customizable toolbar
that is independent of the tabs within the schedule area.
Customizing Quick Access Toolbar
You may choose to create your own specific toolbar. The Quick Access Toolbar includes a customizable
drop-down menu that contains the complete set of Quick Access Toolbar commands. You can select the
command you need to appear in the Quick Access Toolbar by clicking the left hand side of the command
in the drop-down menu.
View Icon Description To display a helpful description of the action an icon performs, let the mouse pointer hover over the
icon. A short description appears in a note below the icon.

Safran RiskTM
5
Shortcut menus When you are working with Safran Risk, right-clicking the mouse provides you with a menu containing
the most commonly used options. The shortcut menu is specific for each tab. For example, when working
with the Barchart-Editor in the Schedule tab, click the right mouse button in the bar area to display the
following shortcut menu:

Safran RiskTM
6
Keyboard shortcuts
Similar to the common shortcuts in windows, Keyboard shortcuts in Safran Risk may be accessed by
pressing the Ctrl key together with the designated letter key. When available, keyboard shortcuts are
shown to the right of the corresponding menu item.
Wizards Depending on the area of the application, you will be guided through step by step instructions, an
Import/export function, or steps for creating a new project.
Printing Select the File>Print menu to print the contents of the current screen. Based on the printed layout
restrictions, the printout will include both visible and non-visible data.

Safran RiskTM
7
Getting help in Safran Risk Click on the Help Icon in the upper right hand side of the menu bar to open the help screen. Here you
will find valuable details on how to operate all Safran Risk Functions.

Safran RiskTM
8
Chapter 3 - Global Risks Global Risks are common risks that may be assigned to more than one project. Defining Global Risks will
help you build a corporate Risk structure to support your entire portfolio. The global risks tab is hidden
by default. In order to see it you go to the Home screen and click “Edit Global Risks”. To close it down
you can click the x on the tab.
Defining New Global Risks (Risk register) To add a new Global Risk navigate to the Global Risks Tab and click on the ‘New Global Risk’ icon:
When a new global risk is added the following default values are assigned:
▪ Name - an initial unique value
▪ Description – blank
▪ Risk Type – Standard
▪ Probability – 100%
▪ Color – default risk color
All of these values can then be modified as necessary.
In the Risk Type field, you may choose between Standard and Calendar option. The risk calendars will be
explained in the next chapter. The probability column identifies the likelihood each risk will occur; the
color column is used to further identify the risks. The color is also seen in other parts of the application,
most notably in reporting. You are allowed to define as many Global Risks as required.
For any Global Risk you can define risk impacts for either the schedule or the cost or for both.
Safran RiskTM
9
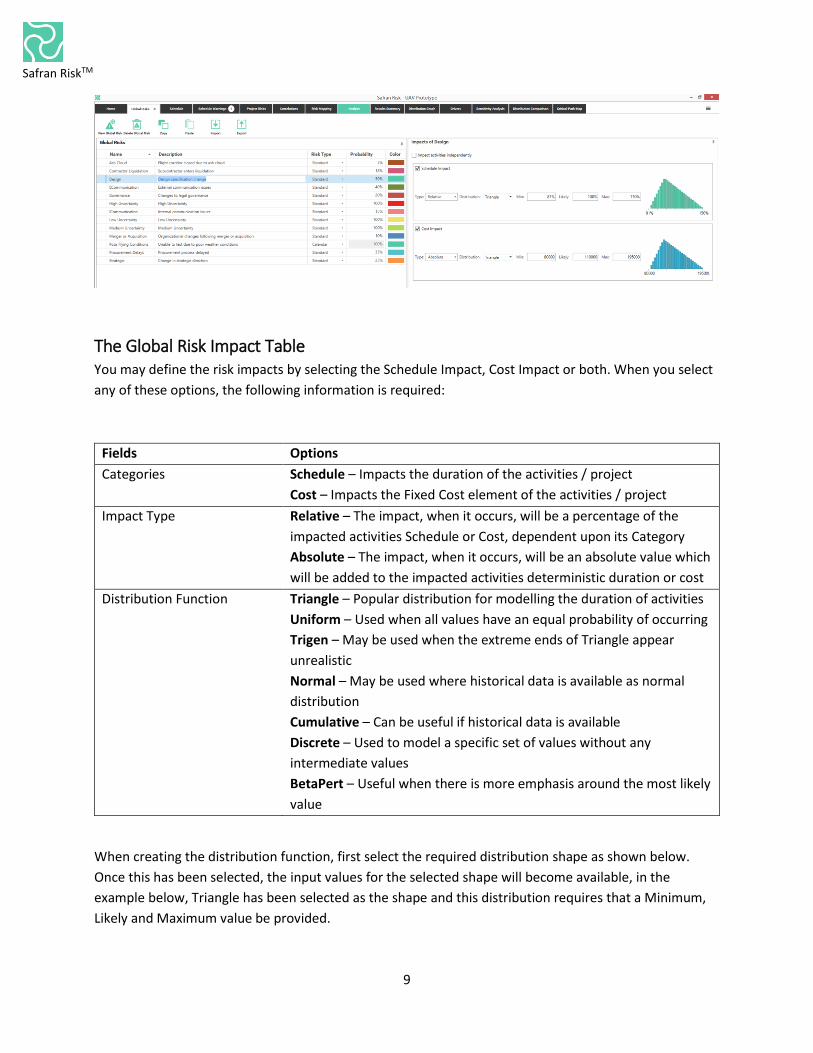
The Global Risk Impact Table You may define the risk impacts by selecting the Schedule Impact, Cost Impact or both. When you select
any of these options, the following information is required:
Fields Options
Categories Schedule – Impacts the duration of the activities / project
Cost – Impacts the Fixed Cost element of the activities / project
Impact Type Relative – The impact, when it occurs, will be a percentage of the
impacted activities Schedule or Cost, dependent upon its Category
Absolute – The impact, when it occurs, will be an absolute value which
will be added to the impacted activities deterministic duration or cost
Distribution Function Triangle – Popular distribution for modelling the duration of activities
Uniform – Used when all values have an equal probability of occurring
Trigen – May be used when the extreme ends of Triangle appear
unrealistic
Normal – May be used where historical data is available as normal
distribution
Cumulative – Can be useful if historical data is available
Discrete – Used to model a specific set of values without any
intermediate values
BetaPert – Useful when there is more emphasis around the most likely
value
When creating the distribution function, first select the required distribution shape as shown below.
Once this has been selected, the input values for the selected shape will become available, in the
example below, Triangle has been selected as the shape and this distribution requires that a Minimum,
Likely and Maximum value be provided.

Safran RiskTM
10
A visual representation of the entered distribution function is dynamically displayed on the right-hand
side.
You can also enter the desired values for Min, Likely and Max and see the changes instantly in Risk
Diagram.
Delete Global Risks and Impacts You can delete global Risks either by clicking ‘Delete Global Risk’ icon or by using the Del key on your
keyboard. When you delete a Global Risk, all the related risk impacts will be also deleted. You can delete
additional risk impacts in the same way. You are not permitted to delete global risks that have been
included in a project without first deleting the relevant project risks.
Copy and Paste Global Risks Using the Copy and Paste icons, you can select the desired risks and copy / paste them to / from other
applications such as Microsoft Excel or simply duplicate them within Safran Risk. This will only copy the
risks, not their impacts.

Safran RiskTM
11
Import and Export Global Risks When you export a risk, all the related information to that risk e.g. risk impacts, calendars etc. will be
saved to an XML file. This function is very useful when you need to exchange risks between various
projects in different locations.

Safran RiskTM
12
Chapter 4 – Risk Calendars Risk Calendars can be used to establish periods of uncertain downtime throughout the duration of a
project, they can be used to model various situations including seasonal storms, frozen sea etc. The Risk
Calendars tab is hidden by default. In order to see it you go to the Home screen and click “Edit Global
Risk Calendars”. To close it down you can just click the x on the tab.
For example, a risk calendar may indicate that every December the risk of a heavy storm occurring in the
North Sea is around 80 percent.
Risk Calendars allow you to create periods of uncertain downtime and show the generated downtime in
a way that provides a visual validation of the expected downtime.
Generating Risk Calendars You can generate risk calendars in two ways:
▪ Generate from template
▪ Generate from time series
Generating Risk Calendars from Template When generating a template for the first time, there are a number of properties that need to be defined
including description, start and finish, number of samples etc.
Clicking the Generate from Template icon will open a new window where you can to define and create
your risk calendar.

Safran RiskTM
13
For each template, you may define the following information:
Fields Options
Name Assign a calendar name
Description Describe the purpose of creating the calendar
Group Specify the calendar group
Number of Samples Specify the number of samples you want to create
Start and End Start and finish of the period you would like to create a calendar for
Downtime in whole days Uses complete days when generating the calendar data
Periods with blocks of
downtime
Name – Period name
Year – Select either a year or all years of the calendar span
Earliest Start – Specify the earliest start date of the period
Latest Start – Specify the latest start date of the period
Block Size – Select the distribution method or use fixed numbers
Nbr of Blocks - Select the distribution method or use fixed numbers
Windows of downtime Name – Window name
Year – Select a year or all years of the calendar span
Early Start – Specify the early start date of the window
ML Start – Specify the most likely start date of the window
Late Start – Specify the late start date of the window
Early End – Specify the earl end date of the window
ML End – Specify the most likely end date of the window
Late End – Specify the late end date of the window

Safran RiskTM
14
Note that the ‘Periods with blocks of downtime’ is used for showing several downtimes in different
period blocks which may happen across the calendar time span. You should use ‘Windows of downtime’
when you want to show typically larger periods of downtime where there is some uncertainty on the
start and end of these periods e.g. the period a canal may freeze over each year.
In periods with blocks of downtime option, the uncertainty is on the number of blocks and their sizes,
while in windows of downtime the uncertainty is on the start and end of this block.
After specifying the necessary information, click on the Generate Calendar icon and your template will
be added to the risk calendars.
Now your template is visible in the calendar tree and you can choose to see all samples or only a specific
sample number. You can also add notes or a geographical location to the generated calendar.

Safran RiskTM
15
Generating Risk Calendars from Time Series Time Series weather data is available from many different sources and can provide detailed information
on weather conditions historically for a given location, this information can include factors such as wave
height, wind speed, rain etc.
This information is often received in a spreadsheet format, Safran Risk can use this historical time series
data to generate your risk calendar.
To enable Safran Risk to understand the time series information it must be transformed into a format
that Safran Risk can understand.

Safran RiskTM
16
In order to create a useable risk calendar from time series, we need to select and import two columns,
one with dates and the other one indicating whether this date represents a working or non-working
period.
In the second column, you should transform the desired data into 0 and 1, for example, if waves higher
than 7 meters will influence the project downtime, you can use 1 for the values more than 7 and use 0
for the smaller values.
An example of a typical spreadsheet, including the transformation of this data into a format Safran Risk
can read is included in the installation folder (Time Series Sample Data.xlsm).

Safran RiskTM
17
When these two columns are ready in your spreadsheet, copy them in the clipboard, then in Safran Risk,
click on Generate from Time Series icon and in the opened window, click on Paste Time Series.
The copied data in clipboard will be transferred into Safran Risk. In the imported table, the downtime
dates are blue.

Safran RiskTM
18
You can see some information about the imported time series on the right-hand side of the table e.g. the
number of items, span etc.
In the Calendar Generation Setting window, you can assign the calendar information and select the style
of sample you want from the two available options. If you select the Consecutive Years option, the taken
samples will include continual years such as 2011, 2012, 2013, while the samples years in the other
option will be randomly selected from the available data. When you are done with setting the new
calendar, you can click on the Generate Calendar icon, this will create a new calendar which will appear
in the list of probabilistic calendars.
Safran RiskTM
19
Chapter 5 – Schedules A well-established project plan is crucial for accurate Risk Analysis. This chapter guides you through
establishing your project plan and the ways that you can manage the schedule.
Defining Projects The first step in organizing a project is to define it. Initially this definition is likely to consist of:
▪ A project Identification, a name for your project
▪ A project Title
▪ Expected project start and end date
During project configuration, Safran Risk sets up the basic information regarding each of your projects. A
project definition contains a number of input fields that you may use for identification and reporting.
You may add or change these values throughout your project life cycle.
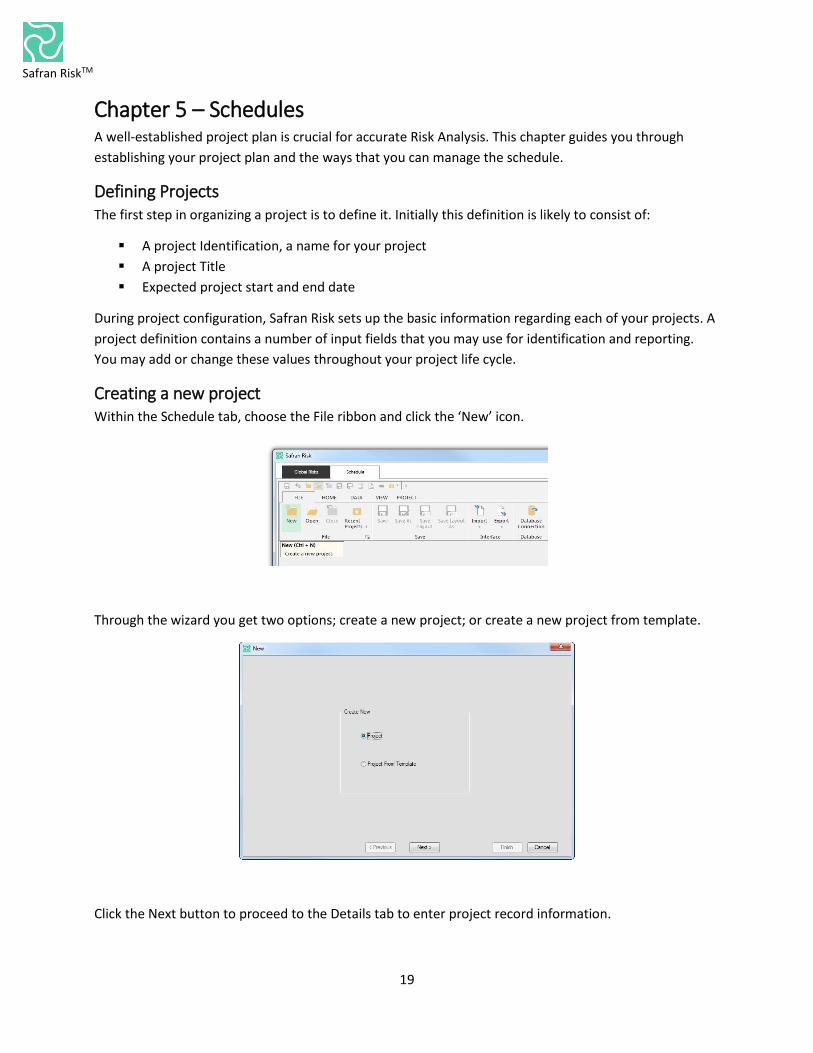
Creating a new project Within the Schedule tab, choose the File ribbon and click the ‘New’ icon.
Through the wizard you get two options; create a new project; or create a new project from template.
Click the Next button to proceed to the Details tab to enter project record information.

Safran RiskTM
20
Note: If Data Sets have not previously been created you may need to create them before proceeding
through this wizard.
Field Description
Name Project name
Description Briefly describe the scope of the project
Calendar set From the dropdown list, select the calendar set that should be used as
default project calendar
Profile set From the dropdown list, select the profile set that should be used as
default project profile
Userfield set From the dropdown list, select the Userfield set that should be used as
default project Userfield
Resource set From the dropdown list, select the Resource set that should be used as
default project Resource
Rule set From the dropdown list, select the Rule set that should be used as default
project Rule
Global set From the dropdown list, select the Global set that should be used as
default project Global
Publish as Template Select this project configuration as template
Locals From the dropdown list, select the Symbol set that should be used as
default project Symbols
Inherits From Select the symbol sets you want to inherit from other projects
Rates Specify the Simple or Complex rate for your project

Safran RiskTM
21
Schedule Options
In The Schedule Options, you can change settings that affect how the project is scheduled. Safran Risk
uses Critical Path Method (CPM) to calculate activity dates. A project schedule is dynamic: when you
make changes to activities or logic, Safran Risk reschedules the plan taking into account these changes.
Safran Risk allows you to modify the Schedule options. In most cases, the default configuration should be
sufficient, but if however, this is not the case, they are easy to change.

Safran RiskTM
22
Field Description
Duration Stretch1 Specify whether the analysis process may stretch an activity duration. Default
is No Stretch
Backward Pass2 Influences the project finish date. Default is No Longest Path
Float3 Specifies how to calculate total float on activities. Default is Minimum
Progress Specifies whether the incomplete part of an activity may be split from the
complete part. Default is Use Logic From Predecessors
Progress out of
sequence4
Specify whether the incomplete part of an activity can be completed after the
last predecessor or after all predecessors
Timenow Enter current time now date for the time analysis
Include Split Targets This option allows you to run a CPM network time analysis either using the
split target information or disregard the split target constraint. (See Appendix
A - Constraints for details about Split target)
Save Calculated dates
to database
Mark this check box to save calculated results to database. Default is On
Save resource dates to
database
Mark this check box to save corresponding resource dates to database.
Default is Off
After creating your new project, you still have the ability to modify the Schedule Options by clicking the
small arrow in the Project > Schedule ribbon.
1 The standard time analysis calculation allows the duration of an activity to be stretched by the constraints leading
to and from the activity. The stretch option allows activities to be stretched on the forward pass by preceding SF or
FF constraints and stretched on the backwards pass by succeeding SF or SS constraints. If the option “No Stretch” is
chosen, the start dates are placed as late as possible, compatible with project logic, on the forward pass and their
finish dates are placed as early as possible on the backwards pass.
2 The backward pass calculates the late start and the late finish dates, total float and free float for each activity and
constraint. Calculations regarding hammocks and resources are also performed during the backward pass. By
default, the time analysis process bases each activity's late dates on the early finish dates for each finish activity.
You may use the “longest path” option to change the calculation. By doing this, all late dates are based on the finish
activity found at the end of the longest path through the project. If your project has multiple “finish” activities, the
analysis, while the longest path is chosen, will use latest Early Finish as start for backward pass for all finish
activities. “No Longest Path” uses the individual finish activity’s early finish as start for backward pass.
3 Safran Project calculates Total Float based on either the start or the finish dates for the activity, or as the minimum of these two values, i.e. the most critical dates. By choosing “Start”, float is calculated as difference between LS and ES of the activity. By choosing “Late”, float is calculated as the difference between LF and EF of the activity. 4 Progress out of sequence refers to an activity that is in progress or has completed earlier than one or more of their predecessors.

Safran RiskTM
23
Subprojects
About Subprojects
Your project may be divided in several subprojects. A subproject is a part of a project possibly sharing a
common code value. It may be accessed and worked on as a separate entity. This philosophy supports
both individual project responsibility and multi-user project development and analysis functionality.
When dealing with larger projects consisting of, multiple project phases, single discipline activities etc., it
is often recommendable to divide the project into smaller parts. In addition to controlling multiple sub-
project, Safran Risk allows you to add logic between sub-projects, as well as giving support for activities
belonging to different sub-projects.
Adding Subprojects
In the Subprojects tab, press the ‘New’ button to add a subproject.
Field Description
Name Enter subproject name. This name will be displayed in the screen title bar
and as a reference to the project throughout the application
Description Subproject description
Owner Project owner. Output field showing user name

Safran RiskTM
24
Removing Subprojects
To remove a subproject select it first and then press the delete button. The highlighted line (subproject)
will be deleted.
Pictures and Texts
Safran Risk supports graphics in the report header area. You can include multiple logos in your project.
You may want to include one logo for your company and another for your Client. Logo images will be
placed on the right and left side of the header area. The image must be saved as a BMP, JPG or PNG file
type. You can also add a Title and additional text to your project which will be visible in your reports.
Access
Access to your projects may be assigned to specific individuals and to groups. Use the two tabs to switch
between User and Group access.
There are three levels of access to your projects: Read, Update and Exclusive. To add users to your access
list highlight the list of users and select <Give Access> from the shortcut menu. To remove users from the
access list, highlight the username in the access list and select Remove Access from the shortcut menu.
User Defined Data (Userfields)
Often you need to extend the default information provided with the scheduling software to track
additional data such as purchase dates, delivery dates, purchase-order numbers, work orders, Work
Breakdown Structures, responsibility and other codes and references. Safran Risk holds a set of
predefined fields that can be labelled to suit your requirements. These fields are available for storing the
unique data plus the ability to perform computations and conditional tests on the data to generate the
desired results. In short, the userfields enable you to add your own fields and values for activities. Once
defined in the userfield data items dictionary, the userfields are available in the Activity Columns, the

Safran RiskTM
25
Activity Details Information Form and for reporting. The computed fields are only available in the
Barchart and not stored as ordinary fields or columns in the database.
You can add up to 200 userfield items for each activity. Safran Project supports the following user
defined field types.
Field Short How many Description
Date Time D 20 Dates
String F 20 Text
Integer I 10 Numbers
Flag L 20 Checkbox, single character
Decimal N 10 Decimal
Reference R 30 Codes and defined list values
Outline
Codes
O 30 Custom codes or tags that allow you to show a
hierarchy of activities in your project
Duration U 10 Duration
Computed C 50 Computed/calculated display fields
Reference fields and outline codes holds predefined values and references. You can use the reference
fields, to define a named list of allowable values for the type and an associated text description. For
example, you might define a Reference field called “DEPARTMENT” that is made up of the following
items:
Value/Short Code Description
MNGMT Management
ENG Engineering
PREFAB Prefabrication
STRUCT Structural Steel
When you enter data into the Reference field or as in the above example, the Department field, Safran
Risk makes sure the value entered is in the list. As a help for quick and efficient data entry and validation,
Safran Risk provides a pick list of defined values. Importantly, the text description in the list is used by
Safran Risk for the summary titles whenever you summarize your schedule. Examples of reference field
usage includes WBS, Discipline, Contractor code, sub-contractor, Level 4 code, System, Department,
Section, Area, Phase and more. For any of the Reference fields you may enter an unlimited number of
codes and descriptions. You can use the Outline Codes to build or create a hierarchical structure for your
project that you can use to sort, select and group activities. When you create an outline code, you define
the number of levels in your structure and the coding for each level. The outline codes allow you to show
a hierarchy of activities that is different from the reference codes or the dynamic grouping by reference
codes. You can create 30 sets of outline codes. Typically, the outline code can be used for WBS, OBS or
other fixed breakdown structures, such as AA.BBB.C01.DD, AA.BBB.C02.DD, AB.BBB.C01.DD etc.
Safran RiskTM
26
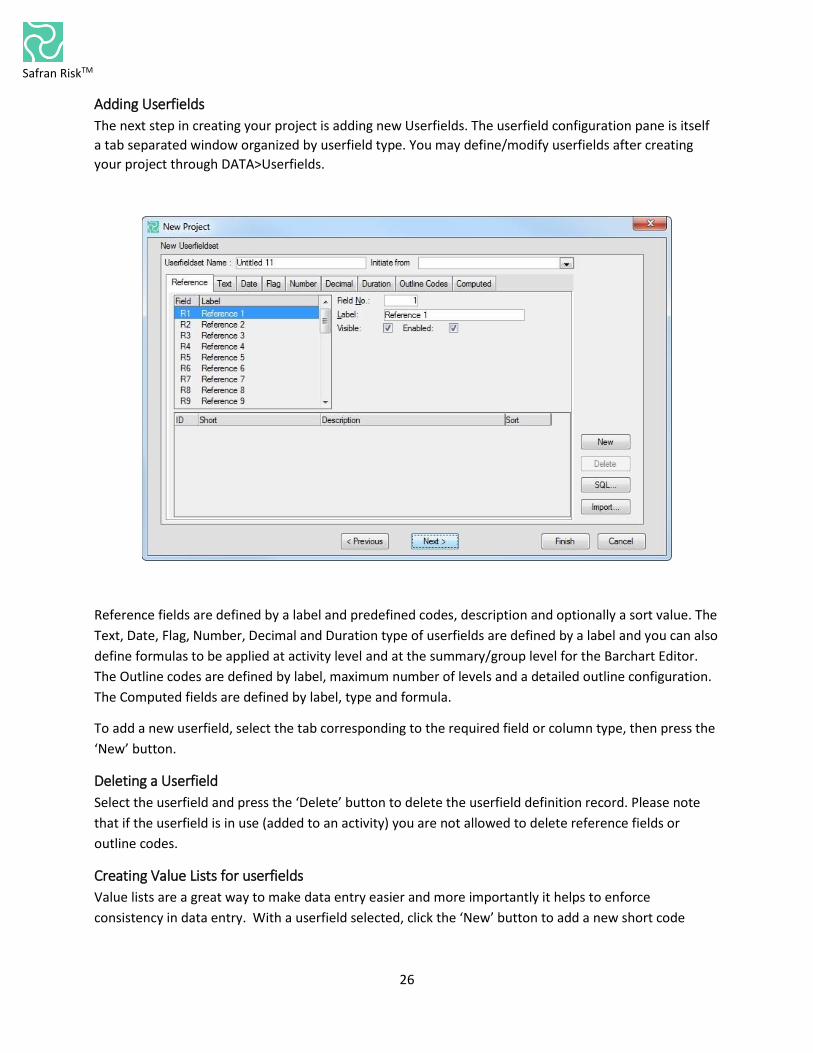
Adding Userfields
The next step in creating your project is adding new Userfields. The userfield configuration pane is itself
a tab separated window organized by userfield type. You may define/modify userfields after creating
your project through DATA>Userfields.
Reference fields are defined by a label and predefined codes, description and optionally a sort value. The
Text, Date, Flag, Number, Decimal and Duration type of userfields are defined by a label and you can also
define formulas to be applied at activity level and at the summary/group level for the Barchart Editor.
The Outline codes are defined by label, maximum number of levels and a detailed outline configuration.
The Computed fields are defined by label, type and formula.
To add a new userfield, select the tab corresponding to the required field or column type, then press the
‘New’ button.
Deleting a Userfield
Select the userfield and press the ‘Delete’ button to delete the userfield definition record. Please note
that if the userfield is in use (added to an activity) you are not allowed to delete reference fields or
outline codes.
Creating Value Lists for userfields
Value lists are a great way to make data entry easier and more importantly it helps to enforce
consistency in data entry. With a userfield selected, click the ‘New’ button to add a new short code

Safran RiskTM
27
value, description and sort number. Pressing the ‘Delete’ button allows you to delete a single code or all
codes for the value list. If the code is in use by an activity, you will not be allowed to delete it.
Importing Reference Fields from File
Reference field values may be imported from a file. The file must be a tab separated text file with the
following format: CODE <tab> DESCRIPTION. Do not include a title row. To import the file click on the
import button, select the file and then press the ‘Import’ bottom.
Assigning Reference fields & codes from foreign tables
It is quite common for larger organizations to keep such information in a data repository. To save
repetitive data entry and prevent duplicating information, Safran Risk allows you to assign your Code
values from tables beyond the code sets in the Safran data structures. To make use of this feature you
must have a proper knowledge of the Safran Risk data structure and should also be familiar with SQL.

Safran RiskTM
28
The codes may be assigned from other Safran Project tables or from foreign tables. Press the ‘SQL’
button and within the ‘Table Select’ window you may edit or write your own SQL select statement.
In the above figure, the default select statement generated by Safran Risk is shown. This statement
corresponds to the definitions entered. You may edit or overwrite this statement to allow for other
references.
Outline Codes
Outline Codes allows you to build or create corporate, project specific and user defined hierarchy of
activities and structure for your project. The breakdown structures by work, cost, organization, physical
or other all illustrates the division of your project in successively greater levels of detail. You can create
multi-level codes consisting of uppercase or lowercase letters, numbers or characters that you specify.
As you define your outline codes, you create a lookup table that makes assigning outline codes to each
activity easier.

Safran RiskTM
29
First, you have to set the maximum number of levels in your code structure. The size of the project and
the degree of control required will in most cases determine the appropriate number of levels defined.
The maximum number of levels allowed in Safran Risk is 10. The copy and paste functions ease the entry
of identical nodes and saves you time from entering data manually. Select a node, press the ‘Copy Node’
button, then select where to add this node, including all child nodes, and press the paste button. The
configuration tab lets you specify code setup by character type length, separator and a label for each of
your levels.
Building Outline Codes from Reference Fields
You may want to build an outline or a hierarchical structure from data already defined for two or more
reference fields. As an example, you may have reference fields for project phase, discipline and sub
phase. Now you want to structure this into an outline. First you define the new outline code, then you
open your barchart editor and group your Gantt according to the desired structure, add the new outline
code to your columns and select ‘Convert To Outline Structure’ from DATA > Userfields.
As the outline code levels can be used just as flexibly as
individual reference fields for grouping and sorting data,
converting reference fields into outline structures allows
you to add new and other information into reference
fields, using the outline codes where structures are in
place.
Formulas for User Defined fields
For the String, Dates, Flag, Number, Decimal and Duration type userfields, Safran Risk lets you specify
formula and filter expressions. Using the formula feature you can specify a summary level display for this
field and if this particular field should be automatically updated as you enter other information, or if
manual input is required.

Safran RiskTM
30
Functions at summary level include, Min., Max., Average, Sum, Count, First, last and calculate. The
default definition for all userfields is the manual input option. When you choose the ‘Calculated Value’
option, you will be able to specify the update formula and by applying a filter that gives you the
possibility of restricting the calculation to a selected range of activities only. The userfield formula dialog
box allows you to build multi-line expressions together with conditional computing using all, where, then
where and remaining conditions together with user defined filters for each of these conditions and their
own formula.
Computed Fields
Computed userfields are used to store formulas for computed values. Unlike the other userfields, you
cannot manually input data into the computed field. Computed fields are similar to the decimal, date,
text, flag and integer and duration userfields when these are defined to be calculated using formulas and
not used as input fields. You can use the Userfield formula window to add multiline expressions together
with conditions, filters and formulas for each line. The computed fields are not stored as fields or
columns in your Safran Risk database, but their label and expressions are.
Resources and Costs
You can develop a Critical Path Network that integrates activities, logic, resources and cost so that you
can effectively control your project. Activity durations and their logical constraints are the basis for a
CPM network; however, the resulting schedule does not take into account resource requirements and
their availability. Your plan may not be regarded as complete until you consider the question of
resources. Resources are the physical elements needed to perform the work. They normally extend
across activities and projects. Each resource can be assigned a calendar and a cost over time. To

Safran RiskTM
31
minimize the time and cost of a project, resources must be effectively controlled - particularly manpower
or human resources.
The resources required by each activity and the quantities available over the relevant period will
determine whether each activity can still be scheduled at its earliest possible dates, or whether it needs
to be delayed to a time when the required amount of resources are available.
When it comes to working with resources, the following tasks and issues should be considered:
▪ What resources are required?
▪ When will the resources be required?
▪ Definition of the individual resources required
▪ The availability of each resource over time during the life of the project
▪ The unit cost of the resource. Does the contract allow for single constant cost rates throughout
the life of the project or are complex rates with escalation tables and overheads required?
▪ An estimation of the resource(s) required for each individual activity in the project.
▪ Are the resources to be linearly spread or as profiles over the resource or activity duration?
Adding Resource Definitions
Adding a resource definition assists in both data consistency and ease of data input for projects. Press
the ‘New’ button (DATA> Resources) and a new line will be added to the list of resource definition sets.
Enter the name of your new resource definition set.

Safran RiskTM
32
Field Description
Short Name Enter the resource short code. This code is used by the
application in the list box
Description Enter a long description for the resource
Type Specify the Resource type. Available options are QTY or
Cost. Only resources of type QTY will be considered in a
resource leveling process
Units Rate Specify the unit of the selected resource
Deleting a Resource Definition
Presuming a resource definition is not in use, i.e. associated with any resources requirements, you are
allowed to delete it from your resource definition set. Highlight the resource definition to be deleted and
press the delete button on the sheet toolbar. You will be prompted by Safran Risk to confirm deletion of
the resource definition.
Opening Existing Projects In order to work with a project, adding or modifying the project data, you first have to select the project
you wish to edit. Press the ‘Open’ icon in the file tab where you can view information for each of your
projects in the database. You can filter the projects list to contain only projects created by yourself or
show all projects that you have been given access to. You can use the ‘Find’ box search for a project by
typing in the project name. Clicking a field header performs an automatic sort by this field.

Safran RiskTM
33
At the bottom of the window, you can also press the “Open From File” button which allows you to open
an external project through a browsing window. The supported project file types are:
▪ Safran project (*.SP)
▪ Safran Planner (*.SPP)
▪ MS Project 2000 Database (*.MPD)
▪ MS Access Database (*. MDB)
▪ Microsoft Project XML (*.XML)
▪ Primavera Enterprise (*.XER)
Once a project is selected, the project name will be displayed at the top of the Safran Risk Window.
You may delete an existing project by pressing the ‘Delete Project’ button at the bottom of the window.
Opening recent projects You may easily find and open the projects you have been recently working with by pressing ‘Recent
Projects’ button in the file tab ribbon.
Importing and Exporting Projects Safran Risk includes an import and export function that allows you to share data with other applications
or other users or systems or other Safran Risk projects. You can use the import utilities to receive
information from other users or applications to help construct or update your project.
Safran Risk has an open database definition, which makes it easy to interface including two- way
communication. If you are familiar with SQL, you can also use the Database queries window to extract
data from the database or database tables, and then export these data to Microsoft Excel type files.
Please also note that if you are a system administrator or have access to the Safran Risk Sys. Adm.
application, you can also export data by selecting tables to back up to file.
Importing Safran Risk Data
Project data can be transferred between Safran Risk and other planning and scheduling software
packages. The Import and Export project options allows you to schedule data together with shared data
such as user defined fields, codes structures, calendars and more. The Safran Import/Export feature
contains intelligence that looks for the format you are either importing from or exporting to, and then
provides you with different options based on the selected format. The Import and Export feature
provides you with a wizard type interface leading you through the options step by step.

Safran RiskTM
34
The Import project option allows you to import schedule data from the following formats:
▪ Safran project (*.SP)
▪ Safran Planner (*.SPP)
▪ MS Project 2000 Database (*.MPD)
▪ Microsoft Project XML (*.XML)
▪ Primavera Enterprise (*.XER)
Project data imported from a file may be saved to a new project or to an existing project. When saving to
an existing project, you may choose either to overwrite any existing data or to append the imported data
to the existing data.
Click ‘Import’ from the ‘File’ ribbon and then Safran Risk prompts for both the import file name and file
type.
Once the file and file type is selected you will be presented with a project import wizard that lets you
select data elements to import and give the new schedule a project name in the Safran database. You
can use the import feature to overwrite an existing project, to append data and to update. Pressing the
Read button reads data and presents the number of data elements on the file. When you press the Save
button, Safran Risk saves your data to the Safran Risk database.

Safran RiskTM
35
Set Calendar Units Option
Different schedules and different planning packages may have different calendar units as their base.
When importing a schedule you can choose to convert this to another unit. This can be especially useful
if you receive a schedule with base calendar unit of hours and you would like to convert this to a
calendar unit of days.
The Overwrite Option
If you choose the ‘Overwrite’ option, you can choose a project from the list, or input a new name for the
imported project. If you choose a non-existing name, a new project with that name is created. If you
select an existing project, the project is replaced with the project and the data from the import file,
keeping the project ID as it is. The imported calendar is always created as a new calendar, and the old
calendar is kept in the database if it is an existing project. The same goes for the userfield set and the
symbol set.
The Append Option
If you choose the ‘Append’ option, you will be given an option to select an existing Change Order or
Variation Order (VO), for all appended resources.
The Update Option
The ‘Update’ option is intended for use in situations where all activities in the import file exist in the
target project, or where the target project is a copy of the source for the import, meaning that no new
activities/resources/changes are added to the target project between imports. This is because the import
uses the sequence numbers to identify these. Adding (different) activities in both the import source and
the target would result in ‘wrong’ activities being updated by the import. Choosing the ‘Update’ option
will enable the ‘Deleted Flag’ drop-down. This lets you select which of the flagged userfields should be
used for marking activities no longer present in the import file. This is instead of an automatic deletion
(which would disable updated on part of the project, enabling selection of all flagged activities so that
these can be manually deleted later, keeping you in control. The ‘Update’ option will add new calendars,
profiles, resources etc. to their respective sets, however information that is no longer in use will not be
deleted.
Importing Microsoft Project Data
Through selecting file type XML, Safran lets you map Microsoft project user data to Safran userfields and
map Microsoft project data to Safran quantities, cost, expended and actual data before presenting the
pane to read and save data to the Safran Risk database.

Safran RiskTM
36
Importing Primavera XER data
Select the file type .XER and follow the instructions in the import wizard to import data from a Primavera
Enterprise XER file.

Safran RiskTM
37
Having selected the correct input file, the wizard asks for a target project to save the data in. By default,
the project name embedded in the file will be suggested as the target. If a corresponding project doesn't
already exist, a new project will be created automatically. Selecting an existing project, the users can
choose whether to append the incoming activities as new activities or to update the existing activities
with new information. If the append option is used, any activity numbers which conflict with existing
numbers will get a suffix to make it unique. For the update option, any activities that are not identified as
existing activities will be regarded as new and be added to the project.
Press the ‘Read’ button to read data on file and prepare for the Safran database. Then press the ‘Next’
button to start mapping Primavera user codes. The Primavera WBS structure and any Primavera Project
Codes, Activity Codes or User Defined Fields found in the file will be picked up and presented as possible
userfields in Safran Project. All Primavera fields with a hierarchical structure will be presented as Outline
Fields, and all Primavera fields with a list structure will be presented as Reference Field. All other codes
will be introduced as Text, Date, Decimal, Number or Flag Fields depending on their data types. The
import wizard automatically suggests positions in the target Userfield Set for each field. The user can tick
off which fields to use or not by checking in or out the ‘in use’ check boxes. If the source project contains
any 3 point estimates these can also be imported and mapped into Safran fields.
The wizard will remember the map settings for the same database and target network.

Safran RiskTM
38
Finally press Next and then Save to submit the data to the Safran Risk database. By default, the user will
be taken directly to the target project afterwards (controlled by the 'Open imported project' check box,
available for all the wizard steps). Please note that only one project can be imported at the time. If the
Primavera XER file contains more than one project, these must be separated prior to the Safran Risk
import.
The target Safran Risk project will always use an hourly based calendar, as Primavera Enterprise uses
hours as the duration unit. Pressing the Back button takes the user to the previous step in the wizard,
allowing for change of target projects or import files.
Exporting Data from your Safran Project Database As with import, Safran Risk supports several formats for exchanging project and schedule information.
The project Export Wizard allows you to export Safran Risk data to the following file types:
▪ Safran project v7.0 (*.SP)
▪ Safran Planner v5.0(*.SPP)
▪ MS Project Database (*.MPD)
▪ Microsoft Project XML (*.XML)
▪ Primavera (*.XER)
The network Export features provides you with a wizard type interface, with options and features
suitable for the selected format.
Exporting to Safran Project Formats (V.5 & V.7)
Safran Risk lets you export project data and associated data to be read by other Safran Risk and Safran
Project/Planner installations. The format for this is the Safran Project text file format *.SP. Both Safran
Project and Safran Planner can read this format. During the export process, you can determine what
schedule data elements you want to include, e.g. activities, resources and resource availabilities. The
export always includes user-defined data associated with the projects such as calendar sets and calendar
definitions, resource sets, profile sets, etc. You can also apply a filter to export only parts of your
Schedule.

Safran RiskTM
39
Once you have entered your export file name and press the Next button, Safran provides the check panel
to determine what data element you are to export. Once this is done and you press the Export button,
Safran creates the *.SP export file.
Exporting to Microsoft Project
Once you have selected the export format and press the next button Safran Risk will provide you with
the wizard type export pane that leads you through the export options and allows you to set up mapping
between your Safran Risk project, its data and the Microsoft Project export file. The MPD and XML
export options allow a richer data mapping compared to the MPX option. Data mapping allows you to
transfer user-defined data from Safran to the Microsoft Project file. You can also apply filters to select
only parts from your schedule. Add your own selection criteria or apply an already defined filter.

Safran RiskTM
40
Exporting to Primavera
Safran Project is capable of transferring schedule data and information to Primavera using the XER file
format.
Exporting data to Primavera Enterprise XER format
XER is the Primavera Enterprise proprietary exchange format. You can create XER data files from the
Safran Risk export option to ease data transfer from Safran Risk to a Primavera Enterprise installation.
Each file will contain all the necessary data for reconstructing one selected Safran Risk Project with
associated calendar definitions, user codes and other information. For using the Project Export option,
choose the Primavera *.XER File Type to invoke the wizard in XER mode.
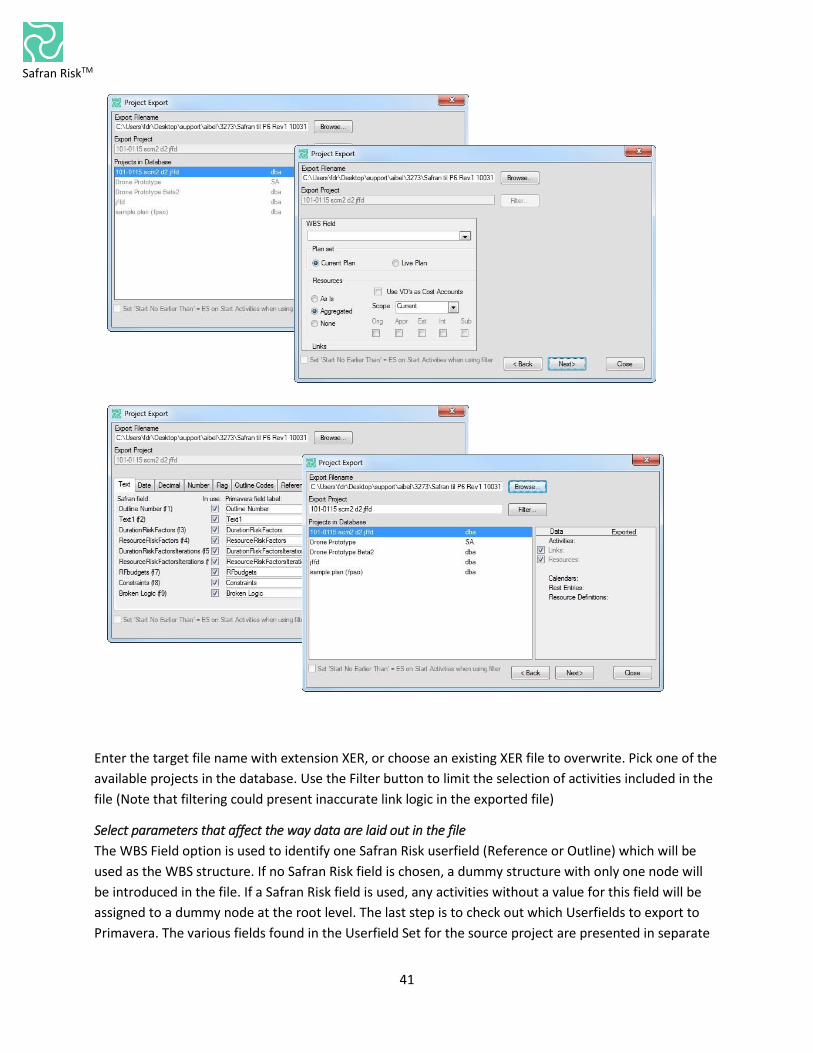
Safran RiskTM
41
Enter the target file name with extension XER, or choose an existing XER file to overwrite. Pick one of the
available projects in the database. Use the Filter button to limit the selection of activities included in the
file (Note that filtering could present inaccurate link logic in the exported file)
Select parameters that affect the way data are laid out in the file
The WBS Field option is used to identify one Safran Risk userfield (Reference or Outline) which will be
used as the WBS structure. If no Safran Risk field is chosen, a dummy structure with only one node will
be introduced in the file. If a Safran Risk field is used, any activities without a value for this field will be
assigned to a dummy node at the root level. The last step is to check out which Userfields to export to
Primavera. The various fields found in the Userfield Set for the source project are presented in separate

Safran RiskTM
42
tabs for each data type. The user can select which fields to include in the file by ticking off the in-use
check boxes. This field map will be remembered by the wizard for each source network in the database
and be used as default values for any succeeding exports. The wizard is now ready to write the data to
the file, and uses the final step to summarize a count of statistics for the whole operation. The Back
button can be used at all times to go back to the previous step and make changes to the export
parameters.
Project Properties Safran Risk allows you to update all attributes you set in your projects (for more information please see
the section ‘Creating a New Project’ in page xx). For instance, you may modify the project details, add
subprojects or give access to other users. Click on ‘Properties’ icon on the File ribbon to open and modify
the information.
The Barchart Editor The Safran Risk Barchart editor is a feature-rich interactive Gantt entry/review screen with full, real-time
CPM analysis. Activities may be moved and durations may be changed interactively. The schedule impact
of such changes and its changes to resource loading are visible immediately. Among the editor’s facilities
is the ability to create and delete activities, to move and stretch them, add or modify logic, add, modify
and delete resource requirements. You can also customize the Barchart editor to display detailed activity
information, Resource entry and load information, logic information and a customizable user definable
histogram.

Safran RiskTM
43
Data may be copied within the editor itself or added by copy and paste from other software such as
Microsoft XL, Microsoft Project, and other scheduling tools. Safran Risk gives you control over the
Barchart layout and presentation display. Configurable symbol options and activity annotation may be
added to your layout. You can configure the size, format, color, start and end symbols and the connector
bars for each activity. You can draw multiple bars for each activity, as well as define conditional bars.
Safran Risk also allows you to flexibly define summaries, grouping and outlining to let you organize your
schedule in the way that best suits your needs. All your customizations can be saved to named layouts
for re-use, and you may switch between different layouts to display different highlights.
You can use the Barchart Editor together with the Alternative scheduling feature of Safran Risk to
evaluate different scenarios, alternative schedules, what if analyses, and schedule impact analyses. The
Barchart View is not only a means of adding, updating and viewing project information. Due to its
extensive flexibility and formatting and printing capabilities, it may also serve as your favorite schedule
reporting tool. The Barchart Editor contains a complete Page Setup utility that allows you to format the
pages of a professional looking report, together with the formatting capabilities of the editor workspace
and layouts. This gives you complete control over the Barchart Editor reporting tool. The Barchart Editor
Layouts and the layouts for the customizable Editor Histogram may be included in the Report Package
tool. The Barchart Editor may also be used to update Actual Progress and Expenditure. When studying
this section you should also look to the “Working with Logic” and “Specifying Resource Requirements”
section for details on adding logic and relations. For details on the histogram view and its features you
should also study the “Customizing and Printing Barchart Editor Histograms and S-Curves” section.
Barchart Editor Workspace
When you open a project, Safran Risk automatically directs you to the Barchart Editor’s working
environment.
The Barchart Editor Work Space contains a quick access bar, toolbar, sheet bar, shortcut menus, layout
options, a columns or table area, a Gantt area, four different information panes and two Barchart Editor
Views.
The four information panes allow you to view, enter and update detailed activity information, link
information and resources with a graphical display, and define a histogram display or report. Use the
Information options from the View ribbon, or select any of the information panes from the short- cut
menu.
The Activity Information, the Link Information, Resources, and Histogram panes allow you to review
detailed activity and network information in subsidiary windows. Once a subsidiary window is displayed,
the information shown is synchronized with the activity selected in the Barchart. The subsidiary windows
may be used not only to display data but as a means of updating or adding information. This style of
operation means that a user wishing to query network data need only select the appropriate information
pane, select the windows containing the required data and 'browse' through the plan by pointing and
clicking on the relevant activities. The detailed information pane selected with your Barchart Editor view
is part of your layout, and layouts may be saved with a unique name and later be used again. Please see
later in this chapter for more details on the Barchart Editor layouts. The detailed panes are not part of

Safran RiskTM
44
the Barchart Editor preview and printout, but both the resource pane and histogram pane allow you to
configure and preview and print histograms on its own. The Histogram pane even lets you save its own
layouts as reports.
Choosing a View
The two views available for the Barchart Editor are the Group View and the Outline View.
These two views share most of the functionality available for the Barchart Editor. However, they differ in
two areas: how the schedule is organized and how logic can be added and displayed.
Using the Group View in Safran, you can organize and group activities by common code. Grouping
enables you to focus on activities that have something in common. The activities within each group are
organized into clusters. Organizing activities is useful while you are creating the project, as well as later
for project analysis and reporting. By changing the way activities are grouped and sorted, you can focus
on different but equally important aspects of a project.
Using the outline view, you can build a non-coded hierarchy into your schedule. An outline subdivides
your schedule into increasingly smaller amounts of work. The groups of work segments can represent
phases in a project, rooms within a building, or specific buildings in a large construction site. When you
outline a schedule, the Barchart schedule becomes easier to read, and you can locate individual activities
quicker. An outline looks similar to Activity Grouping because it is hierarchical. However, unlike grouping
no codes are associated with titles or descriptions, and real activities are used. In addition, you do not
specifically assign outline codes to activities in an outline.
Selecting Information Panes
You may alternate between any of the four available information panes at
any time by simply selecting the desired information from the ‘Information’
options in the View ribbon, or from the shortcut menu at the legends area.
The Activity Information
Activity Details is deployed in the bottom of your Barchart Editor workspace. The Activity information
pane is a tab-separated window that allows you to view, add and modify an activity’s information.

Safran RiskTM
45
Tab Description/data
General Activity ID, Duration, Calendar and Description data
Constrains Start, Complete and Fixed Early/late date constraints
Progress Network time progress fields
Scheduled Time analysis result data- output fields only (cannot be edited or modified)
Reference Userfield data: displays defined reference fields for this network
Text Userfield data: displays defined text fields for this network
Data Userfield data: displays defined date fields for this network
Flag Userfield data: displays defined flag fields for this network
Number Userfield data: displays defined integer fields for this network
Decimal Userfield data: displays defined decimal fields for this network
Duration Userfield data: displays defined duration fields for this network
Outline Codes Userfield data: displays defined outline codes for this network
Computed Userfield data: displays defined computed fields for this network
Link Information
Safran Risk can also present predecessor and successor information along with the Gantt view. By
double-clicking one of the predecessor or successor links a Go-to operation is performed. Keep in mind
that the requested activity must be included in selection criteria if this is used.
Tab Description/data
Activity ID Activity ID for the preceding/succeeding activity
Type Select type of link from the drop down list box. Available types are SS, SF,
FS, FF. Default link type is FS
Delay A lag to delay the start of succeeding activity, may also be entered as a
negative value to support overlap

Safran RiskTM
46
Calendar Specific Calendar no. for link5
Split target Date to impose a start date on any succeeding activity. Overrides start
dates computed by logic
EFC/LSC Output field - Computed early finish for preceding link and late start for
succeeding link
TFC – Total Float Link Output Field - Computed Total Float for the link
Resources
Displays a two-paned window with resource records for the selected activity in the left part and a
configurable resource histogram in the right part. The resource histogram dynamically displays the
current resource requirements loading. The histogram may be configured to show the entire schedule
span, a shorter span by adding user-defined dates, or for a single activity only. You can apply a filter and
select to display quantities, cost or manpower.
Resource Fields Description
Resources Specify resource type
Pl. Qty Planned resource requirement
Unit Rate If the selected resource is defined as type Qty - related, the Unit Rate field is enabled.
The rate defaults to the value specified in the resource definition window, although
this may be modified by the user. For Qty-based resources, the Cost field will be
calculated as (Cost = Qty * Unit Rate), while the Contract Cost field will be calculated
as (Contract Cost = Contract Qty * Unit Rate). For Cost-based resources this field is
disabled.
Planned Cost For Qty-based resources, this field is disabled for manual modifications, but is
calculated as (Cost = Qty * Unit Rate). For Cost-based resources this field may be
altered.
Delay Time Delay indicating that the selected resource is not required from start of activity,
but will be delayed by the number of days entered. The 'Delay' may not exceed the
'Activity Duration'
Duration Resource Duration indicating that the selected resource is not required for the full
'Activity Duration', only for the duration entered. The value of 'Duration' may not
5 Select the Barchart Editor Options window (Project tab > Options) to check if the ‘Use default calendar on new links’ has been marked.

Safran RiskTM
47
exceed the 'Activity Duration.' 'Duration' may be used in combination with 'Delay;'
The total value of 'Delay' and 'Duration' may not exceed the 'Activity Duration.'
Profile Enter profile for non-linear resource distribution.
Calendar Specify a Calendar for the resource to follow.
Displaying the User Configurable Histogram
If you select View>Histogram, Safran provides you with a flexible and configurable histogram in the
lower pane. Using the Histogram view, you are provided with more flexibility to customize and prepare
striking presentation graphs. You cannot use the Histogram pane for data entry. It is an interactive
graphical view of periodic and cumulative data. For printed output, the Histogram includes page setup
features similar to the Barchart editor page setup. As such, it is a powerful reporting tool. You can save
your definitions as unique report names for use later. The Histogram graphs also lets you create curves
and bars for other numerical values than Quantity or Cost. This allows you to create histograms and
curves from user-defined data.
Details on how to configure and customize the Barchart Editor Histogram can be found in the
“Customizing and Printing Barchart Editor Histograms and S-Curves” section.
Working with the Barchart Editor The Barchart Editor combines the Activity Columns area with the Bar Area, allowing you to use both
panes to add, edit or view activity information. There are a number of ways to add an activity using the
Barchart Editor. Some options include:
▪ Add Activity option in Home > Rows > Insert
▪ Shortcut-menu displayed by a click with the right mouse button
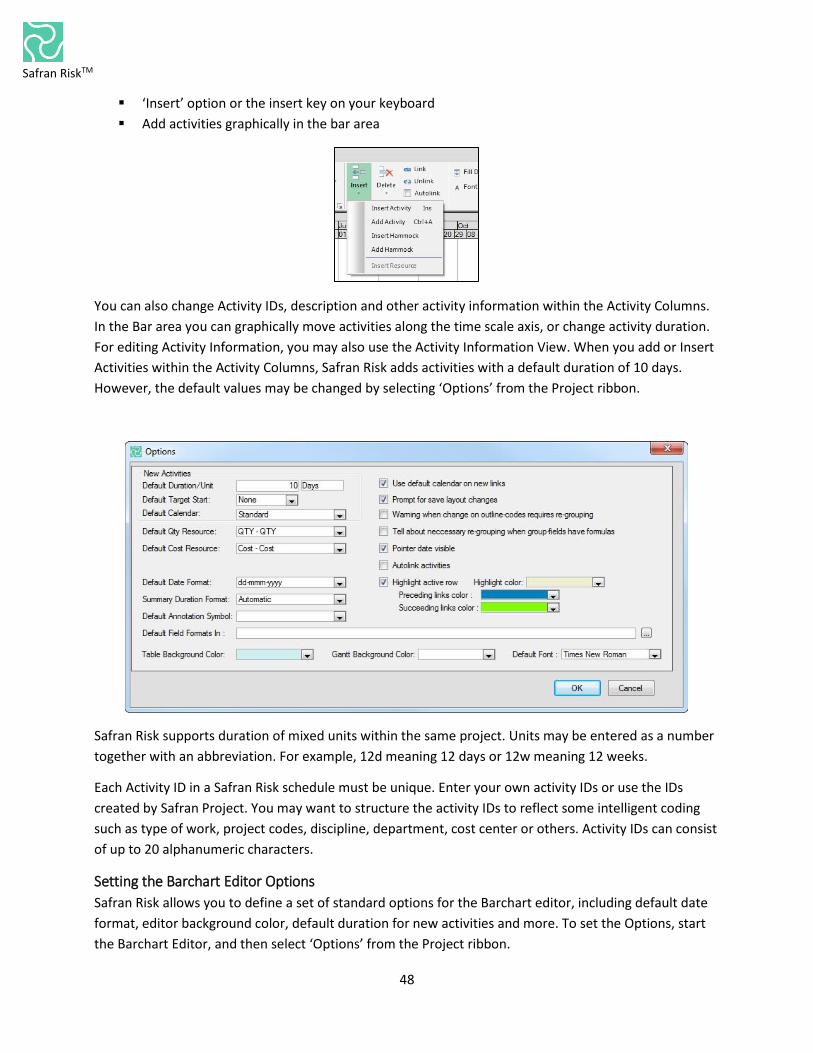
Safran RiskTM
48
▪ ‘Insert’ option or the insert key on your keyboard
▪ Add activities graphically in the bar area
You can also change Activity IDs, description and other activity information within the Activity Columns.
In the Bar area you can graphically move activities along the time scale axis, or change activity duration.
For editing Activity Information, you may also use the Activity Information View. When you add or Insert
Activities within the Activity Columns, Safran Risk adds activities with a default duration of 10 days.
However, the default values may be changed by selecting ‘Options’ from the Project ribbon.
Safran Risk supports duration of mixed units within the same project. Units may be entered as a number
together with an abbreviation. For example, 12d meaning 12 days or 12w meaning 12 weeks.
Each Activity ID in a Safran Risk schedule must be unique. Enter your own activity IDs or use the IDs
created by Safran Project. You may want to structure the activity IDs to reflect some intelligent coding
such as type of work, project codes, discipline, department, cost center or others. Activity IDs can consist
of up to 20 alphanumeric characters.
Setting the Barchart Editor Options
Safran Risk allows you to define a set of standard options for the Barchart editor, including default date
format, editor background color, default duration for new activities and more. To set the Options, start
the Barchart Editor, and then select ‘Options’ from the Project ribbon.

Safran RiskTM
49
Fields Description
Use Default Calendar on New
Links
By marking this checkbox, Safran adds the default Calendar to all new
links. As some users may not want default calendar on Link, you have
the option to set this.
Prompt for save layout changes When checked, Safran asks you to save changes to your project when
you change layout, save data, or close the project
Warning when change on an
outline code requires regrouping
If this check box is marked, Safran will give you a warning if you
change an outline value so that the activity “moves” to another node
in your group structure.
Tell about necessary regrouping
when group fields have formulas
If you mark this check box, Safran will give a warning if editing or
modifying a value results in value change of the field specified for one
of the group levels.
Pointer Date Visible If this checkbox is marked the pointer date note shows in the lower
right corner of the Gantt area when you add or modify activities
interactively.
Expanded Row height Mark this checkbox if you want your rows to be displayed with an
expanded row height. This option does not affect the printed output.
To adjust the row height for printed outputs you will need to adjust
the Table row height value on the page setup pane.
Highlight active Row Check to highlight the selected row with specified color to be drawn
across the column and Gantt areas.
Preceding links color If you have selected the Highlight active row options, you can also
display the preceding links by a specific, user-selected color. Note that
this only applies to the Barchart editor workspace.
Succeeding links color If you have selected the Highlight active row options, you can also
display the succeeding links a specific, user selected color. Note that
this only applies to the Barchart editor workspace
Adding and Editing Activities
To add an activity in the Barchart Editor
The Barchart Editor provides a spread-sheet-like method to add activities to your schedule. When you
add an activity using the Barchart and specify only the data that appears in the Activity Columns, Safran
will automatically generate the bar in the calendar area of your Barchart.
To Insert a new activity in the Barchart View
Click ‘Insert’ button in HOME ribbon, Safran adds a new activity with a default duration above the
current selected activity. Safran automatically assigns the Activity ID and places the activity at the
Timenow (defaults to today’s date when you create a new schedule).
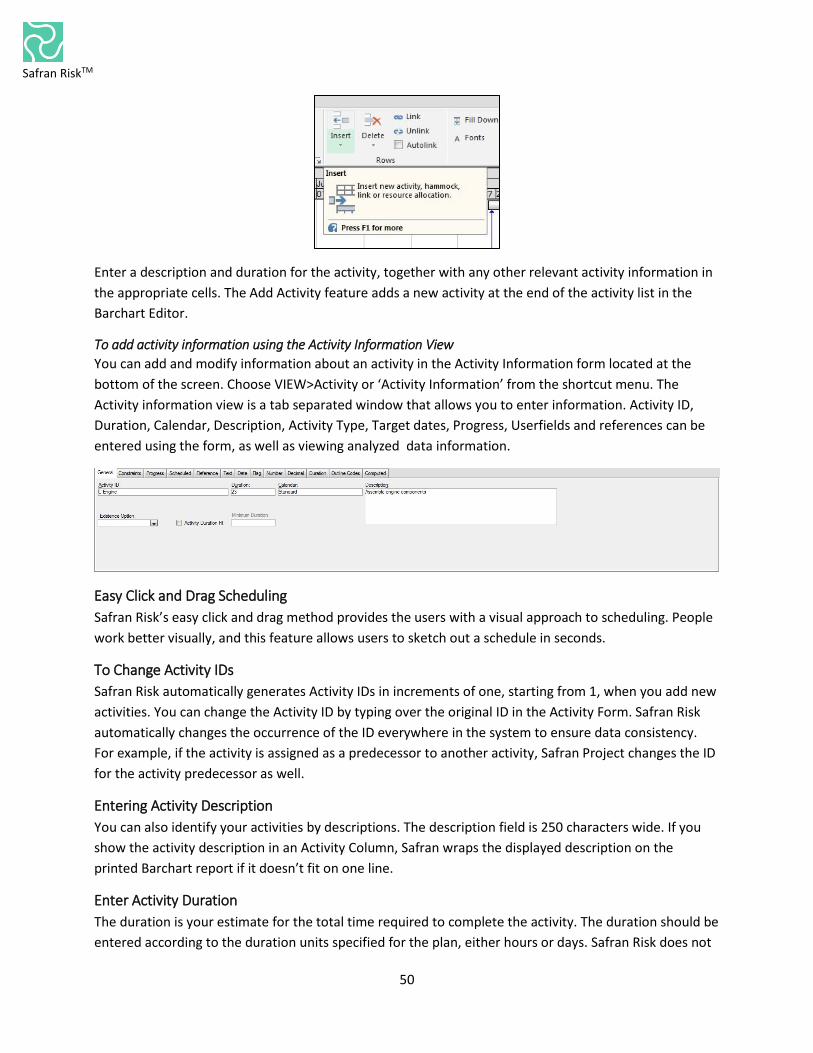
Safran RiskTM
50
Enter a description and duration for the activity, together with any other relevant activity information in
the appropriate cells. The Add Activity feature adds a new activity at the end of the activity list in the
Barchart Editor.
To add activity information using the Activity Information View
You can add and modify information about an activity in the Activity Information form located at the
bottom of the screen. Choose VIEW>Activity or ‘Activity Information’ from the shortcut menu. The
Activity information view is a tab separated window that allows you to enter information. Activity ID,
Duration, Calendar, Description, Activity Type, Target dates, Progress, Userfields and references can be
entered using the form, as well as viewing analyzed data information.
Easy Click and Drag Scheduling
Safran Risk’s easy click and drag method provides the users with a visual approach to scheduling. People
work better visually, and this feature allows users to sketch out a schedule in seconds.
To Change Activity IDs
Safran Risk automatically generates Activity IDs in increments of one, starting from 1, when you add new
activities. You can change the Activity ID by typing over the original ID in the Activity Form. Safran Risk
automatically changes the occurrence of the ID everywhere in the system to ensure data consistency.
For example, if the activity is assigned as a predecessor to another activity, Safran Project changes the ID
for the activity predecessor as well.
Entering Activity Description
You can also identify your activities by descriptions. The description field is 250 characters wide. If you
show the activity description in an Activity Column, Safran wraps the displayed description on the
printed Barchart report if it doesn’t fit on one line.
Enter Activity Duration
The duration is your estimate for the total time required to complete the activity. The duration should be
entered according to the duration units specified for the plan, either hours or days. Safran Risk does not

Safran RiskTM
51
allow mixed durations in a single schedule. Every activity has an original and a remaining duration (the
time left to accomplish the activity). When you update an activity, you can change the remaining
duration, or have Safran recalculate it based on progress input.
Enter Activity Duration in the Activity Columns
When you enter a value in the duration field and press Tab or Enter, Safran Risk automatically
recalculates the early and late start and finish dates for the activity and draws the corresponding bar in
the calendar area of the Barchart editor.
Enter Activity Duration in the Activity Information View
Choose View>Information> Activity. In the duration field, enter the amount of time needed to complete
the defined scope of work for the activity.
Deleting Activities
When you delete an Activity from your schedule, Safran Risk also removes associated resources and its
relationship to other activities, both predecessors and successors. It is a clean sweep. You should check
the Activity’s predecessor and successor activities to ensure that they are correctly linked to other
activities in the schedule after you delete an activity. In many cases, the Activity needs to be retained in
your schedule due to requirements for tracking the project history. You may use the Cancel Activity
feature instead.
To Delete Activities
Select an activity or group of activities in the Activity Columns, choose ‘Delete’ in the HOME ribbon and
confirm that you want to delete the activity or activities. You may also use the keyboard shortcut
CTRL+DEL to remove activities from your schedule. When you delete an activity, any associated
annotations are removed as well.
Copy, Cutting and Pasting Activities
Use Safran Risk’s copy and paste functions to duplicate one or more activities. You may also use the cut
and paste function to move activities within your schedule. You can easily copy activity information from
one schedule to another. You can also specify where Safran is to place the copied activities, which is
especially helpful when you work with summarized schedules. The copied activities automatically take
on the look of the current schedules layout, bars and symbols definitions.
To Cut and Paste Activities
Use the Cut Activity to remove an activity or group of activities from the Schedule window. Select the
activity that you want the copied activity or range of activities to appear above and select the ‘Paste’
option. Safran Risk then inserts the activity or activities into your schedule, and updates any reference
field information if you are working in a summarized schedule.
To Copy and Paste Activities
Use the Copy and Paste Activities option to save data-entry time when you need to duplicate one or
more activities. When you paste the activity or activities, Safran Risk automatically assigns new unique
Activity IDs for the new activity or activities. You may overwrite these IDs to conform to any company
standards. Highlight the activity you want to copy and choose ‘Copy’ in the Home ribbon. Then mark the

Safran RiskTM
52
activity you want the copied activity to appear above and select the ‘Paste’ option to insert the activity. If
you are working in a summarized schedule, Safran Risk updates the reference fields automatically.
The Paste Special Option
The Paste Special option allows you to specify that the resource requirements should be copied as well.
First mark the Activity or a selection of activities, and then choose ‘Copy’ from the shortcut menu. To
paste activities and their requirements select the ‘Paste Special’ option and mark the ‘Include Resources’
checkbox.
Use the ‘Paste Special’ to include activity relationships when you copy activities. You can include all
predecessors, successors and all internal logic within a group when you copy more than a single activity.
Before pasting, you may also modify the relationship data. Press the VIEW>Link button to view selected
links.

Safran RiskTM
53
Automatically Fill in Data Based on the Above Cell
By using the ‘Fill Down’ option you can have Safran Risk automatically repeat the content of a cell to a
selected number of rows. For example, if the cell contains the duration of 40 days, you can quickly fill in
other cells in that row with 40.
Position your cursor at the cell containing the content to be repeated. Then select the numbers of rows
you want this value to be repeated for, by pressing the Shift key and pressing the left button on your
mouse anywhere on the last row and press CTRL+D.
To Automatically Link a Series of Activities
You may quickly add a chain of related activities. The Link feature creates a chain of linked activities with
default finish-to-start relationship. The start of each activity depends on the completion of the previous
activity.
To Automatically Link Activities in the Barchart
Select a range or series of activities, then select ‘Link’ in the Home tab ribbon and Safran automatically
adds finish-to-start dependencies.
The activities are linked in the same sequence as they appear in the Activity Columns or in the order you
select the activities to be linked.

Safran RiskTM
54
To link non-continuous activities select the first activity to be linked. Press CTRL and select activities in
the order they are to be linked. Then press the ‘Link Activities’ button on the toolbar.
Link Activities With the Mouse: One-to-One Connections
In Safran Risk, you can use your mouse to draw a connection from one activity to another. To draw the
link, place your cursor on the predecessor activity and press down the left mouse
button. Now, drag the cursor towards the succeeding activity, the cursor changes to a
chain with an elastic band indicating the ability to draw the link.
Move this cursor onto the activity you consider to be it’s successor, then release the mouse button to
create the dependency. Once released, Safran updates the schedule accordingly. Make sure that the
links option is set to visible. As you move your chain cursor, Safran displays a new link information
message.
Linking One-to-Many and Many-to-One
If you want to link a single activity to a group of successors do as follows: first select the group of
activities in the columns area. If it is an entire group, click the first activity row, then press down Shift
and click the last row of the group to select. If it is several individual activities, hold down the CTRL key as
you select them with your mouse one by one, then put your cursor on the bar of the from activity and
drag it across to one of the activities in the Group. Safran will then ask if you want to make all selected
activities as successors for the activity. To link many to one activity, drag the cursor from one activity in
the selected group to the succeeding activity. Safran will then ask if you want to make all selected
activities as predecessors to the activity.
To Unlink Activities
Select a range of activities, then select ‘Unlink’ in the Home ribbon to remove all dependencies.
Modifying links
By double clicking on a link, Safran Risk opens a window that allows you to update logic information.
When using this window you may modify or even add new links or delete existing links by clicking on the
appropriate button.
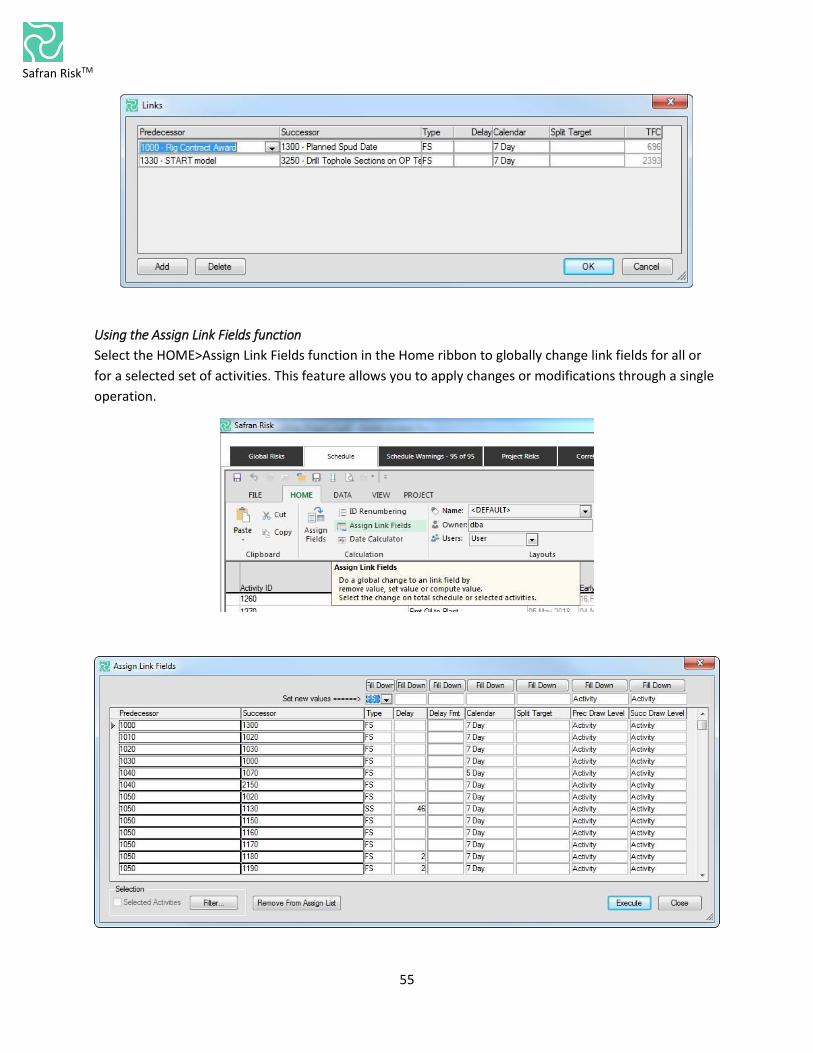
Safran RiskTM
55
Using the Assign Link Fields function
Select the HOME>Assign Link Fields function in the Home ribbon to globally change link fields for all or
for a selected set of activities. This feature allows you to apply changes or modifications through a single
operation.

Safran RiskTM
56
Stretching and Moving Activities on Screen
Safran Risk allows you to work interactively with activities by using the mouse. When you stretch or
move a bar, you work with the "Early Bar." Changes to the activity dates and durations are shown in real
time with a full CPM analyses and resource aggregation running in the background. This ensures that you
can immediately spot the impact of your latest modification to your schedule and resource
requirements. In addition, it helps you keep the project plan constantly valid and to assess if it can be
completed within the schedule boundaries of your project contract.
Modifying Activity Duration
This is done first by selecting the activity and then positioning the mouse pointer at the left or right end
of the activity bar and "dragging" in either direction to increase or decrease an activity's duration. When
the mouse pointer is moved over the hot spot at either end of the activity bar, Safran Risk indicates that
the system is in duration modification mode by changing the pointer to a right-left (<->) arrow. As an
activity's duration is modified, the Early Bar note continuously shows adjusted start/finish dates and
duration.
Assign Fields & Update of Activity Data
The Global 'Assign Fields' feature is a powerful tool that allows you to change data for some or all
activities in a single process. Among the things you can do with the global Assign Fields option is to
compute fields, remove item values, replace data, use date arithmetic and assign or change text and
data strings. The assign field specification consists of a change statement and selection criteria. Either
the selection criterion is entered as a filter, or you may specify to run the Assign Fields for selected rows.
Your Assign Fields statements may be saved for reuse.

Safran RiskTM
57
See the Calculation chapter for details on the Assign Fields function.
Adding Annotation Bars - Multiple Bars on a Single Row
Unlike other project management software, Safran Risk schedules can have multiple bars and symbols
per activity row. This flexible feature extends a user’s visual approach to schedule creation and allows
you to make exciting Gantt/Bar Charts. This flexibility extends the feature of displaying multiple bars
representing the significant activity dates such as early start date, early finish date, late start, late finish,
baseline early start, baseline early finish, current early start, current early finish, and so on. Safran Risk
lets users have as many annotation bars and symbols as they need. These annotation bars and symbols
can be used to mark any significant date or time span. The Annotation Bar is an interactive bar that can
be moved, stretched, or shortened. There is however, no date logic between the activity bar itself and
the annotation bar. When you create a new schedule, Safran Risk supports you with a default annotation
bar. You may, however, change this default setting by selecting PROJECT>Options. You may use any of
the defined symbols or bars to be your annotation bar.
To Create an Annotation Bar Using the Mouse
Position your mouse pointer on a row of an existing activity and use the click and drag technique to
create the desired start and finish date for the annotation bar (Note: to use this technique on the desired
bar, the Default Annotation Symbol in Project>Options should be selected). Annotation bars can be
added both in front of and after the Activity itself. You may also add associated text for the annotation
bar.
To Remove Annotation Bars
Position the mouse pointer over the annotation bar, then press the right mouse button and select the
delete option.
To Edit the Annotation Bar Properties
Position your mouse pointer on any of the Annotation bars to edit it, and press the right mouse button
and select the ‘Properties’ button. This is a tab-separated window. Selecting the general tab can change

Safran RiskTM
58
the symbol for the selected annotation, modify the start and end date and add text to be displayed at
the right of the annotation. The Symbol tab lets you detail a specific symbol fort the selected bar with
color, pattern frame, frame style, size etc. The special features of this symbol can later be reset by using
the Reset symbol option.
Zooming the Content of the Barchart
Especially when you present your schedule on a big screen or use a projector in a meeting room to
present details about your schedule it is ideal to have the ability to enlarge graphics and text in the table
area.
Safran Project supports both Ctrl+ scroll to zoom in and out and zoom steps by pressing the magnifying
glass at the bottom of the pane, or selecting zoom steps from the menu. Holding down the Shift button
while clicking on the magnifying glass zooms out.
Another feature that can also help readability when you present using Safran Risk is the ability to display
columns using only the standard text color (by default, read-only fields are greyed-out). You use the
shortcut menu in the columns area and select the Show Disabled Rows/Columns as Enabled.

Safran RiskTM
59
Layouts One of the features of Safran Risk that you will learn to appreciate is the level of customizing and
flexibility making it possible to adapt to company-wide standards or even your personal style of
management and presentation layouts. The Basic Default View is perfect for many of the Safran Risk
users because of it’s a simple and uncluttered Barchart, which contains the most basic information
needed. Others might prefer to have more information displayed and more symbols and attributes
added to the Barchart.
Safran Risk lets you customize and store an unlimited number of layouts. Each layout stores a variety of
color, symbol, field selection, sort, summary and formatting preferences. Customizable layouts offer you
complete control over the appearance of on screen displays and the printed output.
What are Layouts?
A layout is the combination of visual elements that appear in the Barchart Editor View and the select
statements or filters applied to the project. These elements include the activities, their organization, bar
configuration visibility, the appearance of relationship, color settings, grid lines, time line span, fields
selected in the Activity Columns and their order. Layouts enable you to design the way a project is
displayed on screen. You can save a layout and use it again later, with the project for which it was
created or with another project. There is always a layout in control of the display. When you change
formatting of any kind, you are changing the current layout.
Working with Layouts
The appearance of the two parts of the Barchart Editor View is always controlled by a layout. When you
first open the Barchart editor, Safran Risk provides a basic <Default> layout. You can change any of its
specifications or add new ones overwriting the original layout, or you can create a new layout and add it
to a list of available layouts. A layout is a view of your data. You can save your layout specifications, and
use them again, fine tune and modify them at a later time, or invent new ones. When you select layouts,
you can specify to select from your own layouts or select defined layouts from other users. The Default
Layout for the Barchart Editor includes the Activity Columns and a Bar Area. The Activity Columns show
Activity ID, Descriptions, Early Dates and Activity Duration. The Barchart contains bars for early dates. If
you switch between layouts, Safran prompts you to save any changes to the current layout. If you do not

Safran RiskTM
60
want to save your latest tailoring to the current layout, but still want to keep this display, you should
save the current layout using the Save As option.
To Create a New Layout
In HOME ribbon, click the down arrow in the Layouts section.
The default listing will contain your own layouts. You can choose to view layouts by all users, project
users and report groups. You can also use the Layout Selection feature to narrow the selection list by
adding a text filter on the layout name.
Select the ‘New’ option, enter a unique name for your layout, Press OK, and then select this layout. Now
you can start customizing the Layout by selecting Activity Columns, setting colors for symbols, creating
new symbols, defining summaries, setting sort criteria and editing the appearance of the bar area. The
New option lets you start with a layout identical to the initial default layout or from a selected layout.

Safran RiskTM
61
Any changes to the activity columns or the presentation in the Bar area will be saved to the currently
selected layout. This also applies to the default layout.
To Save a Copy of a Layout
Use the Save As option to make a copy of an existing Layout. Select an existing layout from the menu,
then select the Save As option and enter a name for the new layout.

Safran RiskTM
62
An unlimited number of layouts may be created and saved so that you can create a library of layouts and
apply them as required.
Opening and Using a Layout
Use the Quick Access to Layouts on the toolbar menu. Select a layout from the drop down and Safran
redraws your screen.
Changing between layouts is a powerful tool when you want to see your project from different
perspectives, pinpointing or highlighting specific areas. If you want to use a layout specified by another
user choose ‘Users’ and select one of the options available for Choose Layouts from All Users or Project
Users. You are not allowed to save changes to other users’ layouts or delete any of these.
To Rename a Layout Use the rename button to give your layout a new name
To Delete a Layout Select the layout from the drop down list of available layouts and press the delete
button to delete and press OK to confirm deletion.

Safran RiskTM
63
Add Comments to a Layout
As layouts can be used in reports and be executed from the Safran Web Access (SWA) client, you may
want to add comments or a description to the layouts. When using the SWA client, the comments are
displayed as descriptions for the layouts.

Safran RiskTM
64
Set Layout Attributes
You can use the Quick Set features of the layout window to set attributes from the open layout to all
layouts selected in the Layout window. If you do not want the Quick Set to update all your layouts, you
should first select the layouts by using the quick filter, and then pressing the Quick Set button to specify
attributes to be set.
Layouts and Summaries
Safran Risk lets you group and view your project data in an unlimited number of ways. To define a
summary structure, referred to as Group Properties, choose Group Properties in the View toolbar.

Safran RiskTM
65
You may also select Group Properties by right-clicking the mouse anywhere on the Barchart editor.
You can select from any Userfield in any of the five group levels. When you add fields to the group
properties definition, you build a virtual structure into your project that is part of your layout. Defining
layouts with different group properties is a valuable tool to switch between different views of your
project.
For example, you may define one layout that groups your project according to the resource assigned,
another according to project phases and a third that groups your project according to discipline or
department. When you switch between the views Safran Risk automatically - in real time- rearranges
activity data, and groups and summarizes data according to the group definition.

Safran RiskTM
66
Customizing the Barchart View The Barchart Editor window consists of an editable activity field portion and a time scaled Barchart. You
may choose the fields that should be presented, in addition to configuring activity bars and modifying
the various elements of the Barchart. If you prefer to work in a graphic environment, you can display
more of the Barchart and fewer of the activity columns. If you like to work in a spreadsheet like
environment you can choose to display a small portion of the Barchart. The configurable Barchart
elements are found under the main menu options Edit, View and Tools. Sensitive shortcut menus for
configuration of the Barchart Editor can be accessed by a right button mouse click.
Formatting the Columns Area
Formatting or customizing the Activity columns area involves selecting fields or columns to be displayed,
define their headers, size the column width, specify column alignment and set row and header font
attributes.
Default Field Formats
By using the Default Fields Formats option (VIEW>Columns>Default
Fields Formats) you can specify default formats to be used for the
columns when included into columns area. These may be overwritten
as described below.
The default field format window is a tabbed window organized by field or column type. The values you
enter into this pane will be applied whenever you add or insert the column into your Barchart editor. For
special purposes, you may want to overwrite these defaults in your layout.

Safran RiskTM
67
Selecting Information for the Tabular Columns
Use the Columns Option under View on the main menu to specify activity fields to be displayed in the
tabular columns. Press the new button to add a new field to the columns area, specify your own columns
header, choose alignment, set column width if other than default values are to be used, and specify field
to be indented if the Barchart is organized by summary groups. The left to right order of columns can be
changed by using the move up or move down buttons. Remove columns by first selecting a column and
then pressing the Delete button. The order of columns presented, left to right, is the same as their order
in the list, top to bottom. You may also specify color for column text and background color to highlight
columns of special interest.
The column header automatically wraps as you shorten the column width.

Safran RiskTM
68
When arranging the Tabular area of the Barchart Editor, options are
available from a shortcut menu. The menu is accessed by positioning the
cursor in the heading area in the Tabular columns and clicking the right
mouse button. The following options are available:
Columns: Selects the Columns window. Please see above.
Align Column: Used to specify the column data placement. Options are Left, Center or Right. The Align
Column option adjusts both the column heading and column data content.
Insert Column: The Insert Column option inserts a new column to the left of the column pointed at in
the header area. The data field to be inserted is selected from a drop down list box, and the column
properties can be specified such as header, color, background color, alignment and column width. By
choosing the Best Fit option, the column width will be sized to fit the maximum number of characters
entered for the data field selected.
Hide Column: To remove a column from the Tabular area, select the column by clicking the columns
header and then select the Hide Columns option from the shortcut menu.
Properties: To specify column properties for a single column, such as header, alignment, colors, column
width or a Best Fit option. The features available in this window depend on the type of field you are
setting the properties for.
Date Format: If you select a date field, you can set the date format to be used. This could be the default
date format that you specified in the options pane (see Options in Project toolbar) or any of the formats
in the drop down list.

Safran RiskTM
69
To Rearrange Columns Using the Mouse
You can also use drag and drop in the tabular area to rearrange the field or column order of the selected
fields. Position the cursor in the field header and press the left mouse button to select the column and
drag the column to its new position.
Resizing Columns Using the Mouse
Point to the vertical line on the right side of the column header. When the pointer changes to a double
arrow, drag the line to the left or right to adjust the width. You can hide a column by dragging the
vertical line all the way to the left, which sets the width to zero. To show the column again, choose
Columns and change the width. To size a column to fit the widest column data entered, point to the
vertical line at the right side of the column and double click with the left mouse button.
Choosing Font and Color
Choose Fonts to change color and fonts for table rows and column headers.

Safran RiskTM
70
Select font names and colors from the drop down list boxes, and press the font attributes buttons to
specify bold, italic and underline. Attributes selected for the headings also applies to the time line.
Conditional Coloring and formatting of rows.
Using the Table Rows deviation feature, you can specify special font and coloring to highlight activities by
conditions. Use the Filters button to specify conditions for conditional character and color formatting.
Font Properties for Groups
If you are using a summarized layout, i.e. group properties are defined, you may also define colors and
fonts for the summary rows /group levels. You may add background colors to Summary Rows or Groups
to separate group information from activity rows and enhance the output from the Barchart Editor.
When you specify Group properties, you can also specify a line style and the line thickness as final line
for the summarized group.
Controlling Page Breaks
Safran lets you control page breaks for printed output by either applying a page break for level one of
your group properties or by applying a page break insertion between two activities. To apply a page
break by level one in your group structure, mark the Page Break checkbox in the Group properties
window. To insert a page break between two activities, position your cursor in one of the displayed
columns for the lowest of the two activities and press CTRL+B, or select the Page Break option from the
Edit Menu. Safran inserts a page break above or before this activity. The page break is shown as a dotted
line. Page breaks may be removed by selecting remove Page Break (CTRL+B), or by unchecking the tick
mark in the group properties window.

Safran RiskTM
71
Formatting the Gantt area
The Gantt area is the graphical part of the Barchart editor. Safran Risk lets you add a companywide
standard or a personal style to the look and appearance of the editor. Formatting includes symbols
definition and visibility, calendar time line, grid lines, rest periods, logic display and more.
Adjusting Timeline Scale
The timeline is the calendar heading that appears at top of the Barchart. The timeline includes three
lines usually used to identify the major timeline through to the minor timeline. The major timeline
displays larger units of time, while the minor would display smaller units of time. For example, if the
major timeline displays years, the second line would display project or calendar months and the minor
timeline would display the dates or days of week. Changing the time scale density only affects the
information displayed on the Barchart; it does not affect the schedule or activity durations.
To adjust the Timeline scale, choose Timeline in View toolbar or point at the timeline and press the right
mouse button to access the shortcut menu.
Control the total time span of the Barchart view by specifying start and end dates. You use the entries for
line one through to three to specify visibility, units and label for the calendar lines and marks for timeline

Safran RiskTM
72
units. The overview option sets the timespan for the Barchart editor view to fit with your project. Please
keep in mind however that choosing the "Overview" option also switches off the Barnhart’s interactivity;
you will not be able to modify activity duration or start/end dates graphically on screen. The Best Fit
option sets the calendar line for your output to fit with the total span for your project. It is a useful
feature when you want to adjust the output according to the actual amount of time spanned by your
schedule.
Showing Timenow
Safran Risk allows you to add a Timenow dateline to your Barchart view. To specify color and line style
etc., use the Timenow option in View toolbar, or from shortcut menu in bar area.
Formatting Grid Lines
Grid lines are vertical and horizontal lines that improves readability of your Barchart. Vertical grid lines
may be displayed for year, month, week and days. Horizontal grid lines are drawn across the barchart to
separate each row. To specify grid lines, use the Grid option under View from the main menu, or from
the shortcut menu in bar area.
Safran also lets you add user defined datelines to be drawn as vertical lines across the Barchart. From the
Grid window choose the Others tab and specify a date, the text label and choose color, line style and line
thickness.
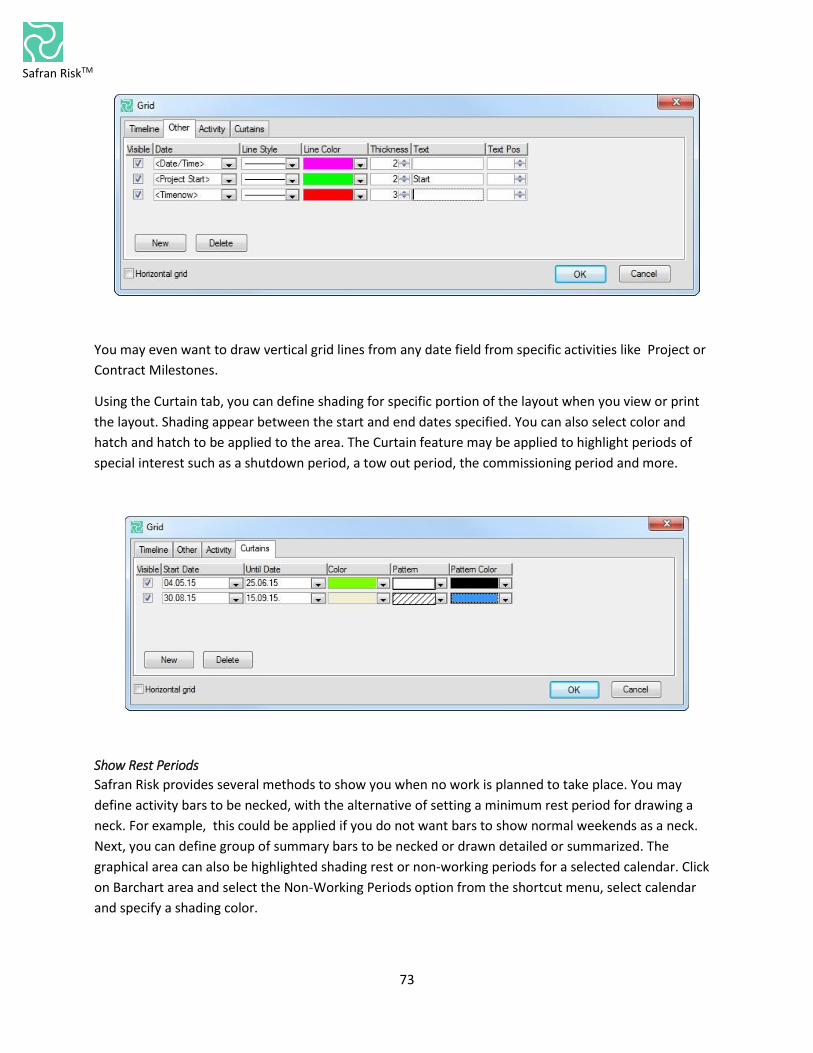
Safran RiskTM
73
You may even want to draw vertical grid lines from any date field from specific activities like Project or
Contract Milestones.
Using the Curtain tab, you can define shading for specific portion of the layout when you view or print
the layout. Shading appear between the start and end dates specified. You can also select color and
hatch and hatch to be applied to the area. The Curtain feature may be applied to highlight periods of
special interest such as a shutdown period, a tow out period, the commissioning period and more.
Show Rest Periods
Safran Risk provides several methods to show you when no work is planned to take place. You may
define activity bars to be necked, with the alternative of setting a minimum rest period for drawing a
neck. For example, this could be applied if you do not want bars to show normal weekends as a neck.
Next, you can define group of summary bars to be necked or drawn detailed or summarized. The
graphical area can also be highlighted shading rest or non-working periods for a selected calendar. Click
on Barchart area and select the Non-Working Periods option from the shortcut menu, select calendar
and specify a shading color.

Safran RiskTM
74
Formatting Activity Relationship Lines
By default, Safran Risk draws the logical link between activities. If you for some reason do not want to
show activity logic or dependencies, you can switch this by selecting the Links option and removing the
visible tick mark. Safran lets you draw the logic from any combination of activity dates, provided a
corresponding bar symbol is defined. That is, if you specify logic using the Baseline Early Start date as the
Start field and the Baseline Early Finish as the Finish field, a symbol spanning the same two dates must
be defined and made visible.
The color used for drawing links may also be modified and chosen to suite your standards. By marking
the Passing Link check box, links to off page activities will be shown. For printed display, annotation (FS,
SS, SF, FF) may also be specified by marking the Annotation check box. Please note that the Options
dialogue window lets you specify different highlight colors for predecessors and successors for activities.
This gives you the effect that when scrolling down your Barchart the color for links may change as you
move from one activity to the next in the columns area.

Safran RiskTM
75
Displaying Links in Outline View
If you are working in Outline View, Safran lets you add logic between a summary bar and an activity
outside this summary. Using this option, Safran allows you to display links from all activities within this
summary group to the activity within another summary level. To do so, you mark the “Summary Forced”
checkbox and select a color for these links.
Displaying Links in Group View
Using Group View, Safran allows you to specify at what level you want to display the logic. Default is
activity level. Displaying logic at a higher level does not affect the network time analysis. It serves as
illustration and information only.
Highlighting Critical Activities
You may choose a color to distinguish critical activities from non-critical activities. This is done by
choosing the Critical option.
Critical activities are highlighted with a red border and critical logic is shown in red. By default, Safran
deems an activity critical when its total float is equal to or less than zero. The level of criticality may be
lowered to also include less-critical activities by entering a number of days float in the "Critical at" field.
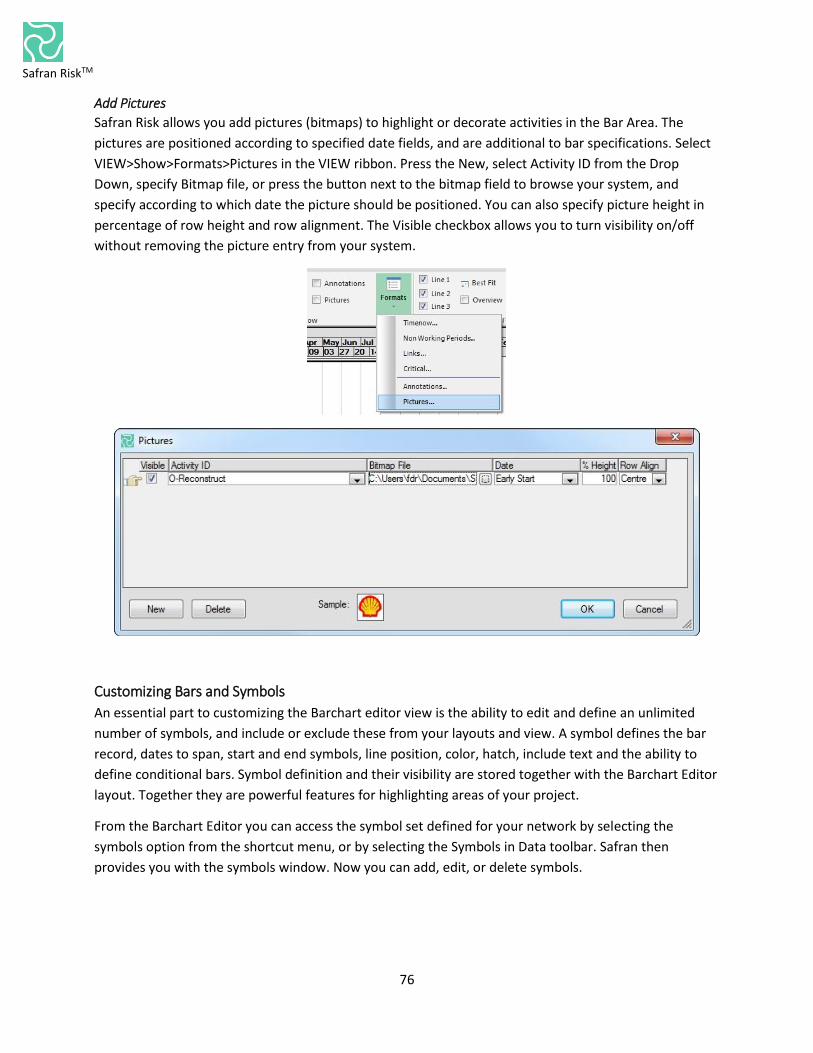
Safran RiskTM
76
Add Pictures
Safran Risk allows you add pictures (bitmaps) to highlight or decorate activities in the Bar Area. The
pictures are positioned according to specified date fields, and are additional to bar specifications. Select
VIEW>Show>Formats>Pictures in the VIEW ribbon. Press the New, select Activity ID from the Drop
Down, specify Bitmap file, or press the button next to the bitmap field to browse your system, and
specify according to which date the picture should be positioned. You can also specify picture height in
percentage of row height and row alignment. The Visible checkbox allows you to turn visibility on/off
without removing the picture entry from your system.
Customizing Bars and Symbols
An essential part to customizing the Barchart editor view is the ability to edit and define an unlimited
number of symbols, and include or exclude these from your layouts and view. A symbol defines the bar
record, dates to span, start and end symbols, line position, color, hatch, include text and the ability to
define conditional bars. Symbol definition and their visibility are stored together with the Barchart Editor
layout. Together they are powerful features for highlighting areas of your project.
From the Barchart Editor you can access the symbol set defined for your network by selecting the
symbols option from the shortcut menu, or by selecting the Symbols in Data toolbar. Safran then
provides you with the symbols window. Now you can add, edit, or delete symbols.

Safran RiskTM
77
You can check the Show Visible Symbols Only checkbox to limit the number of symbols in the
configuration pane while working in the Barchart editor. You can also mark a specific symbol to be visible
for your current layout on the current network only.
Changing Single Bar Properties
Safran Risk allows you to edit properties for a single activity bar. Highlight the bar in the Gantt area and
press the right mouse button. Now select the Properties option to edit the bar properties for the
selected activity. Safran lets you change any of the attributes for this single bar.
Change attributes as desired to highlight this single activity and press OK. Now Safran redraws the bar for
this activity using these attributes. Attributes may be reset by selecting the Reset option.

Safran RiskTM
78
Sorting and Selecting You can sort your schedule in ascending or descending order by any data field. Sort activities into a
specific order by one or more Safran data fields. A simple sort is based on one field; for example, sort by
early start for chronological order, or sort by total float to display the most critical activities at the top of
the list. You can use filters to focus on specific areas of a project by displaying only activities that match
criteria you specify. By using the filter, you control the activities that appear in a layout. You can specify
criteria for several fields at once.
Sorting Data
Sorting in the Barchart editor involves two steps; define sort and execute the sort.
To define sort criteria
Select the Define Sort option from the Home ribbon.
Select the field that matches your sorting criteria and drag this across to the sort by column and specify
ascending or descending order. You can add multiple fields as sorting criteria, and their order in the sort
by list determines the sort order. Click OK. Safran now rearranges the display matching your sort criteria.
The ‘Always sort groups alphabetically by ID’ checkbox allows you to order your grouped data by
ascending order.
Selecting Data
While working in the Bar Chart Editor, Safran Project provides two features for narrowing down the
amount of activities presented.
1. Applying a filter
2. Using Auto filter on displayed columns

Safran RiskTM
79
Specifying Activity Selection Criteria
To select a group of data, you must specify criteria common to all the entries in the group. Your selection
criteria can be saved as named filters for later reuse. By choosing Filters from the Home toolbar, you are
presented with a window for selecting the activities to appear on the Barchart Editor. If no selection
criteria are entered, all activities in the project are included.
Naming Filter Expressions
Selection criteria and filter expressions may get complicated and cumbersome to enter, so you may find
it helpful to name and store your expressions for future use. To select an existing filter, choose from the
Filter drop down box.
The Save As option allows you to modify an existing filter, and save it under a new name.
To remove a filter expression from the list of filters, select the filter from the drop down box and press
the Delete button.
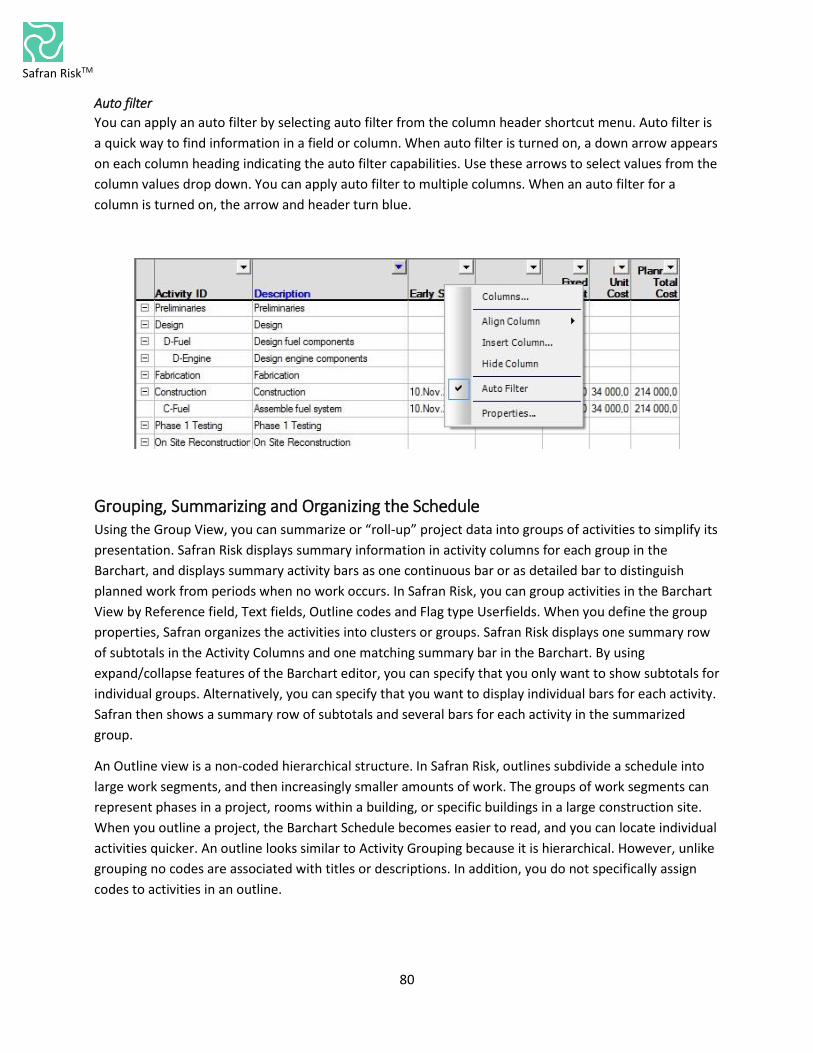
Safran RiskTM
80
Auto filter
You can apply an auto filter by selecting auto filter from the column header shortcut menu. Auto filter is
a quick way to find information in a field or column. When auto filter is turned on, a down arrow appears
on each column heading indicating the auto filter capabilities. Use these arrows to select values from the
column values drop down. You can apply auto filter to multiple columns. When an auto filter for a
column is turned on, the arrow and header turn blue.
Grouping, Summarizing and Organizing the Schedule Using the Group View, you can summarize or “roll-up” project data into groups of activities to simplify its
presentation. Safran Risk displays summary information in activity columns for each group in the
Barchart, and displays summary activity bars as one continuous bar or as detailed bar to distinguish
planned work from periods when no work occurs. In Safran Risk, you can group activities in the Barchart
View by Reference field, Text fields, Outline codes and Flag type Userfields. When you define the group
properties, Safran organizes the activities into clusters or groups. Safran Risk displays one summary row
of subtotals in the Activity Columns and one matching summary bar in the Barchart. By using
expand/collapse features of the Barchart editor, you can specify that you only want to show subtotals for
individual groups. Alternatively, you can specify that you want to display individual bars for each activity.
Safran then shows a summary row of subtotals and several bars for each activity in the summarized
group.
An Outline view is a non-coded hierarchical structure. In Safran Risk, outlines subdivide a schedule into
large work segments, and then increasingly smaller amounts of work. The groups of work segments can
represent phases in a project, rooms within a building, or specific buildings in a large construction site.
When you outline a project, the Barchart Schedule becomes easier to read, and you can locate individual
activities quicker. An outline looks similar to Activity Grouping because it is hierarchical. However, unlike
grouping no codes are associated with titles or descriptions. In addition, you do not specifically assign
codes to activities in an outline.

Safran RiskTM
81
Define Group Levels
To define the summary structure and properties choose Group Properties from the View toolbar, or
select the option from the shortcut menu in the Barchart area. The Group Properties window is a tab-
separated window that lets you define group field and levels, appearance and font, text color, row
background color and size. The general tab provides a panel to define five group levels by selecting
summary or level fields from Project, Reference fields, Outline Codes, Text (string fields) and Flag fields.
It is a powerful feature. For the Outline codes, you can select code level. You may specify a page break or
page throw for the highest summary level, and you may specify final horizontal lines to be drawn. You
can also control indentation and specify to sort summaries alphabetical by ID.
By marking ‘Create <NONE> groups Safran sorts activities without any values specified for a subset into
<NONE> groups. This advantageous feature improves readability and helps to structure the project.
The Fonts tab allows you to specify summary row attributes for text: font, font size, color and background
color.
To Configure Summary Appearance.
Choose the Appearance tab from the group properties window and specify the appearance of each
summary. Attributes include how the layout should be opened in terms of showing groups or details, or if

Safran RiskTM
82
dates, numbers, Frontline drawing and visibility of Reference fields are to be summarized and displayed
on the different levels as well as the option to add final horizontal lines.
To Configure the Summary Row Fonts and Colors
Choose the Fonts tab from the group properties window and select the summaries tab to select color,
font and other font attributes.
Configuring Summary Symbol Attributes
After the summary and grouping levels are defined, you can define or customize your summary bars.
Select the Symbols window, select the summary symbol, and choose the Group tab to define the
summary bars attributes. Normally you would define a summary bar to have a different look than the
activity bar. The summary bar spans a group of activities from the earliest early start to the latest early
finish of the activities within the group.
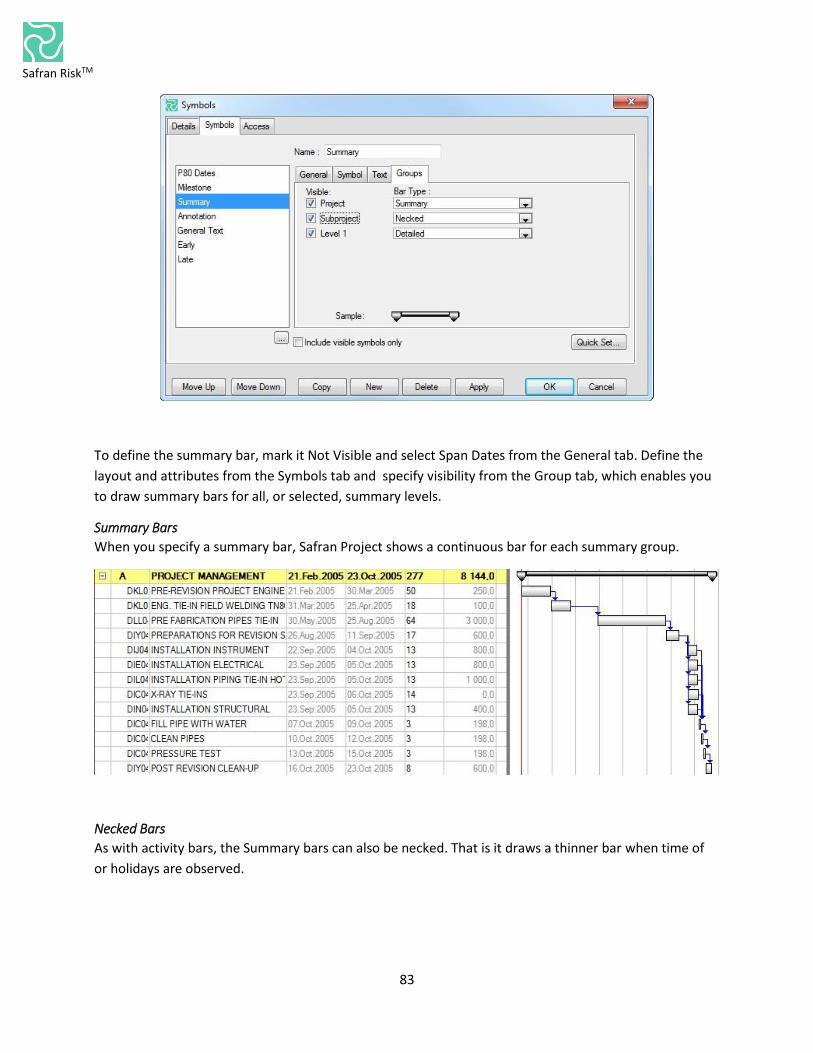
Safran RiskTM
83
To define the summary bar, mark it Not Visible and select Span Dates from the General tab. Define the
layout and attributes from the Symbols tab and specify visibility from the Group tab, which enables you
to draw summary bars for all, or selected, summary levels.
Summary Bars
When you specify a summary bar, Safran Project shows a continuous bar for each summary group.
Necked Bars
As with activity bars, the Summary bars can also be necked. That is it draws a thinner bar when time of
or holidays are observed.

Safran RiskTM
84
Hide or Show Details
Details of the grouped schedule can be hidden or shown by using the Group Explode and Group Collapse
options or by using the equivalent symbols next to each summary level. You can collapse or explode any
of the summary levels individually. Click the outlining symbols (+/-) to expand or collapse any section or
rows. The plus sign (+) represents a collapsed level or section and the minus sign (-) tells you it is an
expanded section or group.
You may also collapse or expand entire groups by selecting
the Explode/Collapse Options from the View toolbar or by
choosing Group Explode or Group Collapse from the right-
click shortcut menu.
This menu option allows you to show or hide entire groups with a single click. If you want to group and
order your plan in a different way, select the Group Properties option again and change the Group by
Fields to suit your new requirement. Safran Project redraws the Barchart and rearranges your plan in
real-time.
As group definitions are stored as part of Safran Risk layouts, shifting between layouts with different
summary structures is a quick, powerful and convenient way to view your project from different
perspectives.
Creating an Outline
Creating an outline organizes the project activities into groups of activities. Each group is preceded by a
summary task, which describes the tasks within the group. Each level provides information of greater
detail. Using Safran Risk, you can build a non-coded structure into your project by creating a hierarchical
structure as you go. The process of structuring the activity list is called outlining. The groups created in
the activity list can represent phases, areas, construction site, performing company, or any other
common feature.
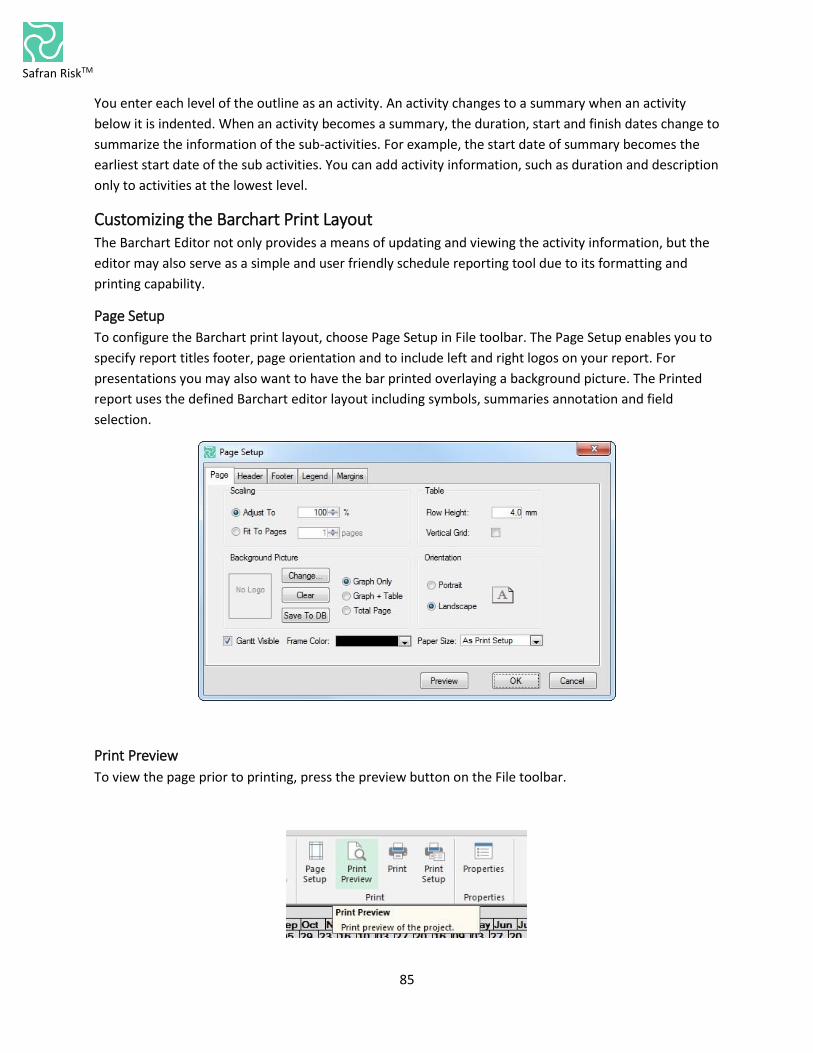
Safran RiskTM
85
You enter each level of the outline as an activity. An activity changes to a summary when an activity
below it is indented. When an activity becomes a summary, the duration, start and finish dates change to
summarize the information of the sub-activities. For example, the start date of summary becomes the
earliest start date of the sub activities. You can add activity information, such as duration and description
only to activities at the lowest level.
Customizing the Barchart Print Layout The Barchart Editor not only provides a means of updating and viewing the activity information, but the
editor may also serve as a simple and user friendly schedule reporting tool due to its formatting and
printing capability.
Page Setup
To configure the Barchart print layout, choose Page Setup in File toolbar. The Page Setup enables you to
specify report titles footer, page orientation and to include left and right logos on your report. For
presentations you may also want to have the bar printed overlaying a background picture. The Printed
report uses the defined Barchart editor layout including symbols, summaries annotation and field
selection.
Print Preview
To view the page prior to printing, press the preview button on the File toolbar.

Safran RiskTM
86
Print Preview is a quick and convenient way to view the current layout, page breaks, margins, headers
and footers. By previewing your report, you can make sure the report prints the way you want, and you
can make any necessary adjustments so that you will only have to print once. Print Preview displays each
page of the report as it will look when printed. The preview window initially displays the first page of the
printout. The current page number and the total number of pages appear at the lower right end of the
report page. To move from page to page in the print preview click the Next Page, Prior page, First page
or Last Page buttons. You can also zoom in to view details of a page by clicking the Zoom icon.
The Safran Risk Print Preview option lets you save your schedule to different graphical formats. The
images looks just like the report on screen. Saving a schedule to a graphical file allows you to paste the
saved file into files created by other Windows applications such as spreadsheets and word processor
documents.
Print Setup
The print setup dialog box allows you to select your default printer, page orientation and paper size. The
printer properties may vary in different printers; please use the printer’s user manual for configuring the
printer properties.
Calculation The Calculation options of Safran Risk provide you with powerful and user friendly tools for
changing/updating large numbers of information in your scheduled plan. You may assign various
calculations to the entire plan or a selected group within your plan.
Global Change - Assign Fields
The Assign fields feature lets you change data for some or all activities in a single process. The Assign
Field feature can be accessed from the HOME ribbon or by right-clicking in the Barchart area. Among the
things you can do with the global Assign Fields option is to compute fields, remove item values, replace
data, use date arithmetic and assign or change text and data strings. The assign field specification
consists of a change statement and selection criteria. The selection criteria are either entered as a filter,
or you may specify to run the change & update for selected rows. To globally change the Activity ID, you
should use the Permanent Renumber feature described earlier in this chapter. Depending on data type
you may use the arithmetic operators plus (+), minus (-), divide (/) and multiply (*) to compute new
values. The integer and decimal field types support all operators. Date Time fields support plus (+) and
minus (-). The flag fields may only be set to 0 (zero) or 1 (one). Text and string fields support the operator
plus add characters from the item information. The Assign Fields feature contains similar functionality to
the userfield’s formula described in the Userfield’s chapter. Using the formula feature may be an
alternative if updates are to be set regularly.
Using Date Arithmetic
The Assign Fields feature can perform addition and subtraction operations on dates. Subtracting one
date from another results in the number of work periods between the two dates. Adding or subtracting a
number to a date results in a new date.
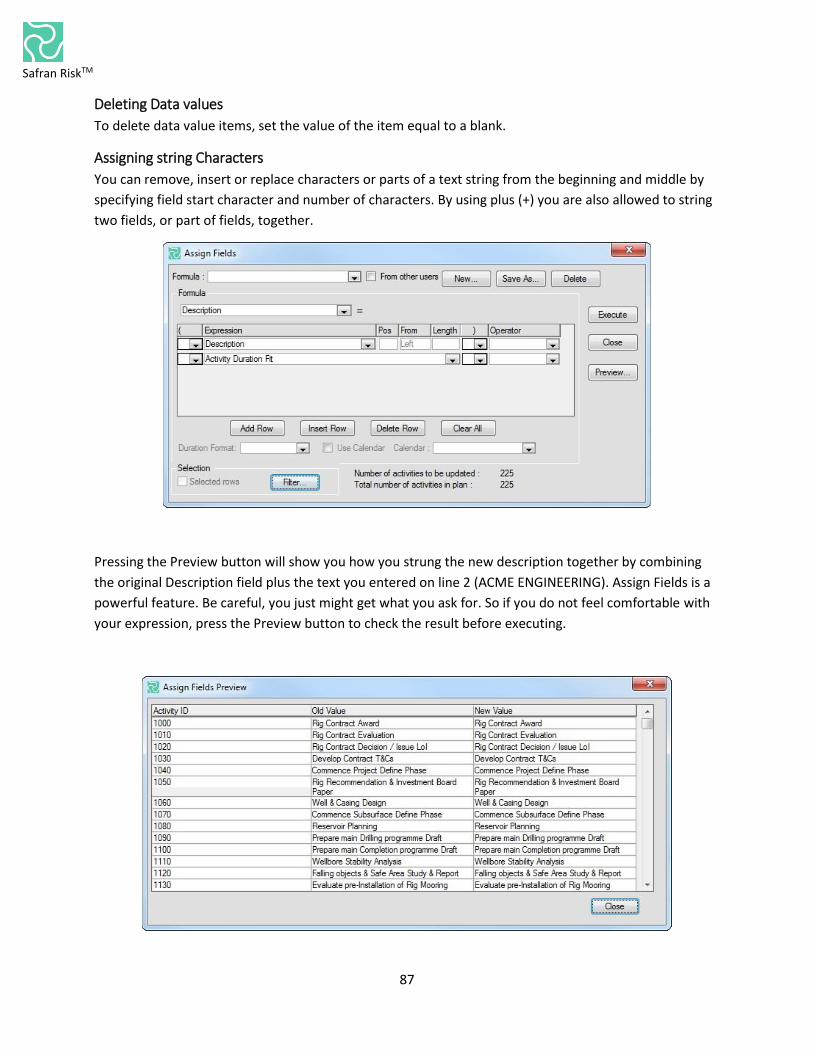
Safran RiskTM
87
Deleting Data values
To delete data value items, set the value of the item equal to a blank.
Assigning string Characters
You can remove, insert or replace characters or parts of a text string from the beginning and middle by
specifying field start character and number of characters. By using plus (+) you are also allowed to string
two fields, or part of fields, together.
Pressing the Preview button will show you how you strung the new description together by combining
the original Description field plus the text you entered on line 2 (ACME ENGINEERING). Assign Fields is a
powerful feature. Be careful, you just might get what you ask for. So if you do not feel comfortable with
your expression, press the Preview button to check the result before executing.
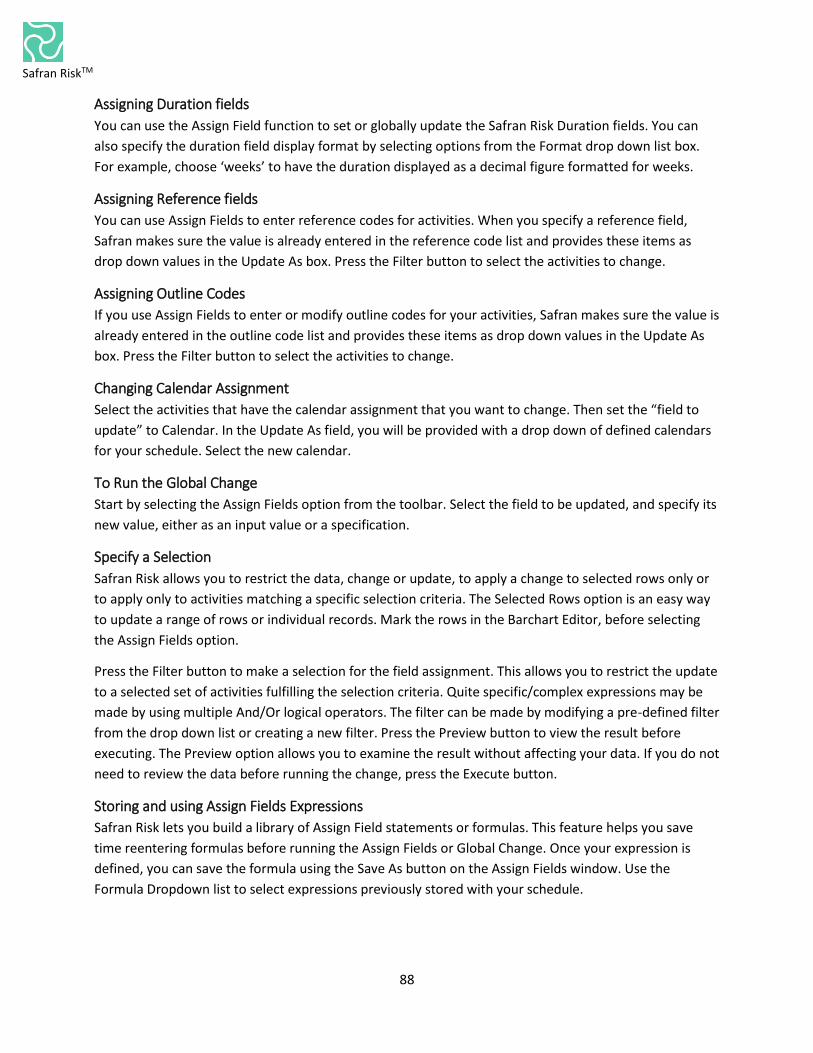
Safran RiskTM
88
Assigning Duration fields
You can use the Assign Field function to set or globally update the Safran Risk Duration fields. You can
also specify the duration field display format by selecting options from the Format drop down list box.
For example, choose ‘weeks’ to have the duration displayed as a decimal figure formatted for weeks.
Assigning Reference fields
You can use Assign Fields to enter reference codes for activities. When you specify a reference field,
Safran makes sure the value is already entered in the reference code list and provides these items as
drop down values in the Update As box. Press the Filter button to select the activities to change.
Assigning Outline Codes
If you use Assign Fields to enter or modify outline codes for your activities, Safran makes sure the value is
already entered in the outline code list and provides these items as drop down values in the Update As
box. Press the Filter button to select the activities to change.
Changing Calendar Assignment
Select the activities that have the calendar assignment that you want to change. Then set the “field to
update” to Calendar. In the Update As field, you will be provided with a drop down of defined calendars
for your schedule. Select the new calendar.
To Run the Global Change
Start by selecting the Assign Fields option from the toolbar. Select the field to be updated, and specify its
new value, either as an input value or a specification.
Specify a Selection
Safran Risk allows you to restrict the data, change or update, to apply a change to selected rows only or
to apply only to activities matching a specific selection criteria. The Selected Rows option is an easy way
to update a range of rows or individual records. Mark the rows in the Barchart Editor, before selecting
the Assign Fields option.
Press the Filter button to make a selection for the field assignment. This allows you to restrict the update
to a selected set of activities fulfilling the selection criteria. Quite specific/complex expressions may be
made by using multiple And/Or logical operators. The filter can be made by modifying a pre-defined filter
from the drop down list or creating a new filter. Press the Preview button to view the result before
executing. The Preview option allows you to examine the result without affecting your data. If you do not
need to review the data before running the change, press the Execute button.
Storing and using Assign Fields Expressions
Safran Risk lets you build a library of Assign Field statements or formulas. This feature helps you save
time reentering formulas before running the Assign Fields or Global Change. Once your expression is
defined, you can save the formula using the Save As button on the Assign Fields window. Use the
Formula Dropdown list to select expressions previously stored with your schedule.

Safran RiskTM
89
Saved Setting may be selected the formula drop down box. By marking the “include settings from other
users” check box, you can select valuable expressions saved by other users.
Date calculator
How often have you tried to figure out what date it is 45 days from today, or which date is 37 days after
October 12, or even how many working days there are between May 1 , 2015 and September 25, 2016?
In Safran Risk, we have implemented a neat little feature to assist you in finding the answer to such
queries. By choosing ‘Date Calculator’ in the Home toolbar, you will be presented with the date
calculator as shown below:
The calculator takes in to consideration the calendar assigned to your current project, while you switch
between the different work patterns using the scroll keys.
Field Description
Start Date Enter the Start Date; Time / calculated by Safran Project
Units Between Enter Units / calculated by Safran Project. For hourly calendars, units will be in
hours, and for daily calendars, units input or calculated will be in days.
End Date Enter End Date; Time / calculated by Safran Project

Safran RiskTM
90
After entering any two of the three available fields, Safran Risk calculates the remaining field. Enter a
start and an end date to find the number of days between, enter a start date and duration to arrive at
the end date and so forth. You may switch between automatic and manual operation of the date
calculator. In addition to this, the date calculator has the following two calculation modes:
Mode Description
Calculator There are 0 days between a start date and an end date of the same date; i.e.
1.1.99 - 1.1.99=0
Analyze The duration between a start date and an end date of the same date is 1, i.e.
1.1.99 - 1.1.99=1. The time span or duration between the morning of the start
date until the end of end date is calculated as one working day. This is
identical to a network time analysis calculation. The same rule applies to
hourly calendars with the exception of one unit being one hour
ID Renumbering
Each Activity ID in a Safran Risk project must be unique. Enter your own IDs or use the IDs provided by
Safran Risk. You may want to structure your IDs to reflect type of work, Codes, References, Subprojects
or similar Activity information. Activity IDs can consist of up to 50 alphanumeric characters. Safran
automatically generates Activity IDs in increments of 10 starting with 00010. You can change the Activity
ID by typing over the Original ID. Safran Risk automatically changes the ID everywhere it occurs in the
network. For example, if the Activity is assigned as a successor to another activity, Safran changes the ID
for the logic.
You may want to build intelligence into your Activity IDs by assigning letters, numbers or codes that
reflect areas, system, departments or types of activities and more. The Barchart Editor provides a
“Permanent Renumber” feature that allows you to define Activity ID String and Sequence Count. Select
ID Renumbering in the Home toolbar.

Safran RiskTM
91
To be able to use this feature it is required that you have exclusive access to the network. If you group
your layout according to the same structure, Safran adds/inserts new activities using the next “count” for
Activity ID. You can also identify an activity with a description of up to 255 characters.
Assign Link Fields
Select the Assign Link fields function to globally change link fields for all or for a selected set of activities.
This feature allows you to apply changes or modifications through a single operation.
Please see the ‘To automatically link activities’ section for details on Assign Link Fields and also for details
on various types of links.
Project setup Many firms and organizations have developed standard userfield codes, working calendars, symbol
definitions, resource definitions and more. This section guides you through the ways you can configure
your project structure.
Calendars
Engineers, contractors, designers, suppliers and other trades employed on the same project may work
different hours, and everyone working on the project will have unique holiday and rest-periods
requirements. Different activities may progress at different rates. For example, one activity may be
continuous and proceed without interruption, while another may stop for weekends, and yet another
occur only on Mondays through Thursdays. Safran Risk stores these details in calendars. Each activity,
constraint or resource is assigned to run according to one of the predefined calendars. A calendar is used
to:
▪ Hold base units allowed for analysis: Hours, Days or Minutes

Safran RiskTM
92
▪ Hold details of holidays and rest periods that occur during a calendars span
▪ Calculate start and finish dates for activities and resources when the network is analyzed and
resources are scheduled.
Entering Calendar Data
Calendars consist of the number of working hours per day, as well as holidays, vacations, and other rest
periods, allowing Safran Risk to determine valid working periods. There is no need to enter hours per day
for hourly-based calendars, only non-working periods. Safran Risk supports an unlimited number of
calendars per project facilitating the modeling of extensive and complex requirements. Calendar sets are
assigned to each project. Calendars are assigned to the activities, resources and constraints in your
project plan. For example, if certain work requires a 5-day workweek, while other activities are
performed during a specific time period, you may create different calendars and assign the different
activities to them. Safran Risk utilizes calendar information in all calculations involving dates and time-
arithmetic, Schedule analysis, resource-load calculations, aggregate, etc. Calendars are essential in
defining detailed and accurate schedules.
Specifying Calendar Units
The minimum unit for activity duration is controlled by the calendar type entry and is specified for your
project. If you assign a calendar set specified with hours as units, all activity durations are perceived as
hours during input as well as during all calculations involving time-arithmetic.
Specifying Calendar Span
You specify the calendar span for the entire project by entering a calendar start date and a calendar
finish date.
Adding a New Calendar
Select the calendars from Data ribbon and select New Calendar on the right hand side of the calendar
editor window.

Safran RiskTM
93
Safran Risk now adds the new calendar line to the calendar editor window and defaults to using 7.5
hours per day. Now you may enter your own data including a description for the new calendar.
Fields Description
Calendar Calendar work pattern number, a number assigned by Safran Risk
Description Enter a description for your calendar
Hours/day Enter the number of working hours per day. Used for computing manpower
work load
Days/week Used when calculating Activity durations when duration is entered as
number of weeks
From Enter the start date for the non-working period
Until Enter the end date for the non-working period
Weekday(s) Enter a weekday as the non-working day, or select all to indicate vacations or
other nonworking periods
Copying a calendar
To copy an existing calendar, choose the Copy calendar option in the right hand side of the calendar
editor window.
Importing and Exporting Calendar Data
On the bottom of the calendar editor window, you will find the Import and Export options used to export
and import non-working periods data for a selected calendar. You can use these options to quickly build
a new calendar set with individual calendars from different calendar sets in your Safran database
Specifying Non-working Periods
Click the "New Non Work” button and Safran Risk adds a new line to the Non working Days table in the
calendar editor window. Use this table to enter new non-working information. Time off may be entered
as a specific date, for example January 1 , a weekday (Saturday, Sunday) or a vacation or holiday period
spanning several days or weeks. In either case, Safran Risk requires both the from and until date to be
entered. If you are working on an hourly or minute based calendar, the from/until date may be specified
down to the hour using the additional from/until hour fields.
Deleting Non-working Periods
Select the Delete Non Work option in the calendar editor window for deleting the selected non working
line.
Renaming a Calendar
To rename a calendar, simply edit the calendar description field. You are only allowed to edit the
calendars or calendar sets where you have been given update access rights. Save your changes to the
database after editing the calendar name to store the new name.

Safran RiskTM
94
Assigning a Calendar
The different calendars are assigned to activities, constraints and resources that make up your project’s
plan. By assigning different calendars, you may create a project plan that makes it possible for you to
plan and control complex project requirements. By default, Safran Risk suggests calendar 0 to all
activities, resources and constraints. If you have defined additional calendars, you may assign them to
the project elements by use of the appropriate forms or editors.
Changing Calendar Data
Rest periods and time-off can be added to calendars as described above. Modification of an existing
calendar by changing/deleting time-off periods or adding new time-off periods may affect activities
associated with it. If so, this will also affect your plans and schedules.
Deleting a Calendar
To delete the current calendar, choose Delete calendar from the calendar editor window. You are not
allowed to delete a calendar if it has been assigned to an activity, constraint or resource requirement.
Profiles
Safran Risk has facilities for distributing resource requirements and their associated costs in two ways,
linear or based on user-defined profiles. By default, Safran Risk performs a linear distribution. This may
be overridden by user input.
Linear Distribution
Safran Risk distributes the resource requirements (and Cost) evenly across the resources duration. In
Safran Risk, resource requirements may have both delays and/or durations. If you assign your resource a
duration, Safran Risk will spread the requirement proportionally over the resource duration, applying the
resource delay to calculate start and end date for the required resource. By applying multiple resource
requirements, including both delays and durations, it is therefore possible to create complex resource
profiles when summarized to the activity level.
Profiled Distribution
As an alternative to the proportional or flat load distribution, the use of profiles provides you with a
quick way to spread your requirement over time based on user defined distribution profiles. Again,
Safran Risk does all the work for you spreading the resource requirements over time. For example, you
might anticipate usage of a resource to be intensive at the beginning of an activity and taper off towards
completion. A graphical representation of this requirement would describe a front loaded curve. Safran
Risk distributes any resource requirement according to the curve you define. When utilizing a
distribution profile on your resources requirement, it is additionally possible to combine this with both
resource delays and durations. The profile will then be applied to the specified duration of the resource
requirement.
Adding and Editing Distribution Profiles
To add new or edit existing profiles, select Profiles in the Data ribbon. Select New Profile in the button of
the Profiles window. Enter your profile name in the Profile Name field and enter the necessary reference
points in the % time and % load fields.
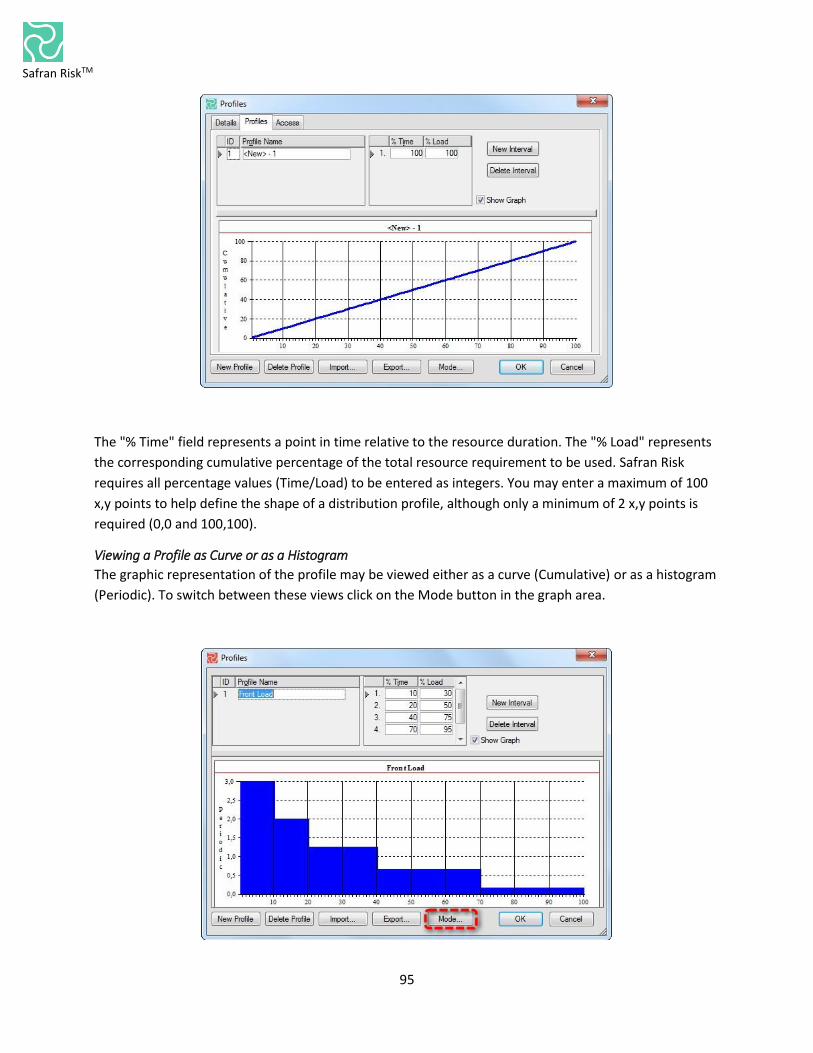
Safran RiskTM
95
The "% Time" field represents a point in time relative to the resource duration. The "% Load" represents
the corresponding cumulative percentage of the total resource requirement to be used. Safran Risk
requires all percentage values (Time/Load) to be entered as integers. You may enter a maximum of 100
x,y points to help define the shape of a distribution profile, although only a minimum of 2 x,y points is
required (0,0 and 100,100).
Viewing a Profile as Curve or as a Histogram
The graphic representation of the profile may be viewed either as a curve (Cumulative) or as a histogram
(Periodic). To switch between these views click on the Mode button in the graph area.

Safran RiskTM
96
Deleting a Profile
Highlight the profile you would like to delete and select Delete Profile. Safran Risk asks you to confirm
deletion of the profiles.
Importing and Exporting Profiles
Safran Risk support both tab separated text files and XML files.
Resources
You can develop a Critical Path that integrates activities, logic, resources and cost so that you can
effectively control your project. Activity durations and their logical constraints are the basis for a Critical
Path; however, the resulting schedule does not take into account resource requirements and their
availability. Your plan may not be considered as complete until you consider the question of resources.
Resources are physical elements needed to perform the work. They normally extend across activities and
projects. You can assign calendar and define the resources’ cost over time. To minimize time and cost of
a project, resources must be effectively controlled - particularly manpower or human resources. The
resources required by each activity and the quantities available over the relevant period will determine
whether each activity can still be scheduled at its earliest possible dates, or whether it needs to be
delayed to a time when the required amount of resources is available. When it comes to working with
resources, the following tasks and issues should be considered:
▪ What resources are required?
▪ When will the resources be required?
▪ A definition of the individual resources required
▪ The availability of each resource over time during the life of the project
▪ The unit cost of the resource. Does the contract allow for single constant cost rates throughout
the life of the project or are complex rates with escalation tables and overheads required?
▪ An estimation of the resource(s) required for each individual activity in the project
▪ Are the resources to be planned linearly spread or as profiles over the resource or activity
duration?
This may seem like a lot of options, issues and questions to take into consideration and it looks like a lot
of work. But basically these are the steps to follow:
Defining New Resources
Choose the Resources from the Data ribbon to add or modify resource definitions in your project.

Safran RiskTM
97
Choose New to add a resource definition to your resource definition set. Safran Risk inserts a new line, a
resource record in the window.
Field Description
Short Name Enter the resource short code. This code is used by the application in the list box.
Description Enter a description for the resource
Type Specify the Resource type. Available options are QTY or Cost. Only resources of
type QTY will be considered in a resource leveling process
Unit Rate The rate per unit for the resource. Available only for QTY type resources. The Unit
Cost Rate is used in cost calculations.
Deleting a Resource Definition
Presuming a resource definition is not in use, i.e. associated with any resources requirements, you are
allowed to delete it from your resource definition set, simply by clicking the Delete button.
Userfields
For information on how to add, modify and delete Userfields please read section “User defined data
(Userfields)” at page 16
Symbols
User defined symbol sets provide you with the ability to customize the Barchart view for presentation
and analysis purposes. The symbol sets hold all your defined symbol-styles and annotation defined for
your plan. You can configure the size, appearance, format, color, position and other elements of the
activity bar. Show one or more bars for each activity. Include conditional symbols for groups of activity or
single activity annotation. You can use the symbols to define a standard set of bars for your project, and
then choose the bars, symbols and text annotation you want to show. Symbol styles are saved as part of
your Barchart layout.

Safran RiskTM
98
Defining Symbols
Choose Symbols in Data ribbon to define and to view the defined symbols, edit existing symbols, create
new symbols, or remove/delete a symbol. Symbols are used to highlight or show different parts of the
schedule; for example, a baseline bar, a current bar, a progress bar or symbols with bars spanning a set
of user defined dates.
The symbol definition windows is tab separated with the four tabs of General, Symbol, Text and Groups.
The following attributes and information may be defined in the Symbols-general tab.
Field Description
Span Define start and end dates for bar
Delay Allows you to set a delay from start date
Automatically Drawn On All Activities: The bar and symbol will be visible on all activities. No
activities: The selected bars and symbol will not be shown on any activity.
Filtered activities: Allows you to draw the bar and symbol for selected
Activities/Conditional Bars.
Sample Shows an example of the bar and symbol configuration
Adding a New Symbol
Select the New option in the Symbols editor window. A new symbol “untitled” will be added on top of
your symbol list. Rename the symbol and use the panels to configure symbol attributes.
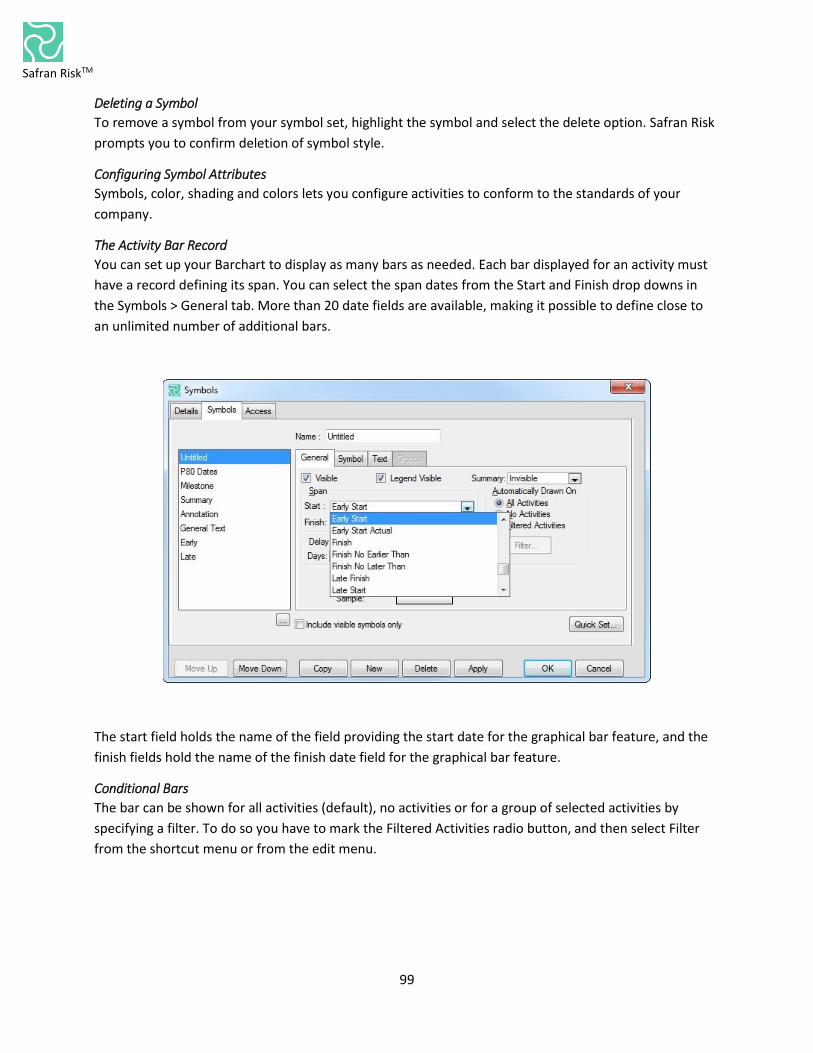
Safran RiskTM
99
Deleting a Symbol
To remove a symbol from your symbol set, highlight the symbol and select the delete option. Safran Risk
prompts you to confirm deletion of symbol style.
Configuring Symbol Attributes
Symbols, color, shading and colors lets you configure activities to conform to the standards of your
company.
The Activity Bar Record
You can set up your Barchart to display as many bars as needed. Each bar displayed for an activity must
have a record defining its span. You can select the span dates from the Start and Finish drop downs in
the Symbols > General tab. More than 20 date fields are available, making it possible to define close to
an unlimited number of additional bars.
The start field holds the name of the field providing the start date for the graphical bar feature, and the
finish fields hold the name of the finish date field for the graphical bar feature.
Conditional Bars
The bar can be shown for all activities (default), no activities or for a group of selected activities by
specifying a filter. To do so you have to mark the Filtered Activities radio button, and then select Filter
from the shortcut menu or from the edit menu.

Safran RiskTM
100
This option allows you to define conditional bars and symbols. Condition may, for example, be based on
float or criticality, selected parts of your project, or work breakdown structure and many more.
The Automatically Draw on No Activities option is valuable if you want to define symbols to be used as
single activity annotation.
Delay
You may want to draw a symbol or text annotation with a delay relative to the start or finish date field.
Add the delay in number of days and mark the use Calendar if you require the delay to take calendar
work patterns into account.
Choosing Symbols and Colors
An activity has three parts: a start symbol, the activity body or the main bar, and the finish symbol. To
select available industry standard symbols or change colors, select the symbols tab.

Safran RiskTM
101
The start and finish symbol can be selected from a list of 27 graphical shapes. The main bar may be
configured by selecting from 5 bar styles, 32 colors, 7 different hatches (patterns), 32 hatch colors and 32
colors for frame. Adding to this the bar can be specified with pattern color, frame color and frame style.
Choose Line Number
A symbol may be positioned relative to the activity row by selecting a line number. Valid positions are 2,
1, 0 , -1, - 2.
Specify Bar Position
You can specify symbol and bar offset by entering values in the Y-position and height fields. The Y-
position is relative to the activity line counted from top of line.
Necked Activity Bar
Mark the Neck check box to show rest and non-work time as a neck in the bar. Rest and non- work time
includes holidays and weekends. To restrict necking you may enter a minimum number of non-working
days before Safran draws a neck.
Showing Data on Bars
The text attribute allows you to add free text or include data items to be displayed together with the
activity bar for reference or information. The text label has three parts: a free text, Activity fields and a
free text. Enter your text or select a field from the drop down, then specify the appearance by choosing
color, character size, and font attributes: bold, italic or underline for the text field.

Safran RiskTM
102
Free text and activity fields may be positioned to the left or right of the bar, above or below the bar or
inside the bar. The text can be aligned relative to these positions by selecting options from the
Adjustment drop down list box. The Sample lets you preview the bar label position as you make changes.
Select the position that suits your requirements by selecting from the available options.
To Specify Summary Bar Attributes
You may define the look and feel of your summary bars in your Barchart Editor. For the group tab to be
active, your layout must be organized or grouped. Then choose the Group tab. Now you can mark the
Visible check box and specify properties. The Group type bar shows a continues bar for each group. Since
the summarized activity may contain periods when no work take place, the continues bar may not
always represent total duration accurately. By selecting the detailed bar, you can show planned work
more correctly as this bar indicates inactive time by a broken bar. Group bars may also be defined as
necked bar or as necked bar including holidays.
The Group tab can only be accessed if you are working within the Barchart Editor, and if Group
Properties are defined.
Symbol Definitions and Layouts
Symbols are used and displayed as part of the Barchart Editor layouts. Layouts are used to store and hold
the definitions of your library of different configurations. You will probably create different layouts to
show your project schedule to the different stakeholders in your project and to highlight your project
from different views. The use of symbols can be layout specific. This flexibility combined with the
capability of unnumbered layouts and unnumbered symbols is a great advantage when it comes to
reporting.

Safran RiskTM
103
We have already discussed the Group tab and the ability to define group bar attributes. Adding to this,
you will find additional features such as:
▪ Show visible symbols only - will reduce the symbols list to show only symbols marked as visible
for the selected layout
▪ Visibility applies to current project only - allows you to apply a symbol to the selected Barchart
Editor layout to this project only
Please study the Barchart Editor section for full details on how to create layouts and work with the
Barchart Editor.
Globals
Safran Risk allows you to define a set of variables to be used for your project. In Safran terms, these
variables are called Globals. The definition of Globals includes type and value. These variables are a set of
rather special fields that act as variables you can use throughout the application. As a set of special
fields, Globals can be used throughout your project, e.g. for creating a text global with the value “hello,”
or set a date global to 12.10.06.
Defining the Globals
Global definitions are stored within the Global set, and to be able to use this feature you must choose a
Global set for your project. You are allowed to define as many Global sets as required, and each Global
Set can contain as many Globals of type text, date or number as required for your project.
To define a new Global, select Global in the Data ribbon.

Safran RiskTM
104
To define new Globals, select global type and select New in Global window. The Text Global can be set to
any text or selected from project text attributes. There is also the option to set the global as part of
these text strings by specifying a start position and length of the text string. Date Globals can be set
equal to a specific date , or you can specify the Date Global relative to a set of system dates such as
<Today>, <Timenow>, <Cut-off> etc. The Number Global is defined by a decimal or integer number.
Using the Global
Once you have defined the global together with its expression, you can use it as an ordinary field in your
selected statements to filter and focus attention on specific areas within your plan. Your Global’s name is
always at the bottom of the list. If you define a Date Global as <cut-off> + 24 days, you can apply this to
your filter, selecting activities that have either an early start or finish within the next four weeks. Date
Globals can also be used to define the calendar start and finish for the Barchart editor and for grid lines
in the graphical area of the Barchart Editor. If your Text Global contains EPCI, you can use this to select
activities with a description containing the Global.
Rules
Using the Rule Set feature of Safran Risk allows you to define automatic field assignment. A rule set
consists of a list of predefined assignments that will help save keyboard time when entering new data to
your network. A rule set, including all defined rules, is assigned to your project. In many cases, you want
to set a code field or a function field identical to one or more characters from the Activity field. These
fields may be used for selection, organizing and grouping data. Instead of using advanced selection
criteria, you may instead enter a straightforward criteria like “Where F1=CL” ‘The rule set allows you to
define code logic between the Activity IDs, the F1-F20 fields and the R1-R30 reference fields and codes.
Defining Rules
To edit or define new Rule Sets choose Rules from the Data ribbon.

Safran RiskTM
105
All the individual rules you make should be named. Click New in the tab separated window to add a new
rule.
Specifying Rules
To specify a new rule, first select the Set Field from the drop down list box. Available fields are Activity
ID, Text Fields and Reference Fields. Then specify the expression by selecting the Field Name and the
range of characters from the starting position to the last position. To extract a string from any of the
available fields simply put the integer values indicating the position of the first and last characters of the
string.
Complex Rates
When you select to report on Cost, the Safran charts and report where it is relevant allow you to select
what cost to include when reporting. Complex rates allow you to use rate escalations and indirects
(Overhead 1-4, Cost of Money and General and Admin).
Defining Complex Rates
To use Complex rates with Safran Risk is rather simple. From the DATA ribbon, click on Complex Rates
and you will see the project information in the Details tab. Go to the Rates tab and click on New Rates to
define and create your rate records. You can define multiple periods with different rates for each record
you create.
To add a new record or remove an existing one you can use the New Rate and Delete Rate buttons. You
can apply the created rates to other projects across your company. For this purpose, go to FILE >
Properties and in the Details tab select the Rate Set you want.

Safran RiskTM
106
Remember to select the Complex option when you assign an existing Rate Set to your project.
Database Support tools
Safran Risk provides two practical tools to keep your database updated while you are working. To access
these tools go to DATA>Save and DB Support.
Check DB Updates
Use this tool to check the consistency of your database. Using this tool, Safran checks the scheduled
updates of activities, constraints and resources to the database to detect any inconsistencies.
For example, if you attempt to delete or update a record that has been removed by another user in the
meantime, the SQL command will fail, and you will be prevented to do any of your scheduled updates to
the database. Check DB Updates detects your attempts to do illegal operations to the database, and
allows you to cancel these. Thus, you get the chance to save your other changes to the database. A good
idea is to reload network data after such an event.

Safran RiskTM
107
Timer Setup
Enables the user to set an interval for automatic save to database, in addition to update of analyze
status.
Access Levels
Users who define a new project become the project Owner. The Owner shares his/her project with other
users or user groups by granting different levels of user access. The available access levels are described
below:
Exclusive
Allows exclusive update access to the project. If a user has opened the project in Exclusive mode, Safran
Risk does not allow additional users to access that project in Update mode.
Update
Allows Update access to the project by an 'unlimited' number of users. If multiple users enter updates
for the same activity, Safran Risk stores the update that was saved last. If more than one user is updating
the project simultaneously, the project status will be set to 'Not Analyzed'
Test
In Test mode, users are allowed to make changes to project data to see the effect on screen but are not
allowed to save changes to the database. Users may, however, save changes to a different project name
by use of the 'Save As' Option. Safran Risk supports an unlimited number of simultaneously users in Test
Mode.
Read
Users are only allowed to view data on-screen. No updates are allowed, either on screen or to the
database. Safran Risk supports an unlimited number of simultaneous users to access the project in Read
Mode.
User Locking
It is sometimes useful to see if another user is working with the same database so you cannot execute an
update. With this option, you can check which users are connected to the database. User locking
identifies which users prevent some operations such as changing the time now. You can click the User
Locking icon in the Data ribbon or use the shortcut key Ctrl+F9.

Safran RiskTM
108
Project Schedule Options Safran Risk allows you to modify the default schedule options. In most cases, the default configuration
should be sufficient. If this is not the case, it is easy to reconfigure the schedule. Common examples
might be the need to select the type of logic used to calculate the schedule or controlling calculations
involving out-of-sequence activities. Initially, you may have set the Time Analysis options during project
definition, although it is most likely that you accepted the Safran Risk default settings.
To Modify the Analysis Options Click on the small arrow in the PROJECT>Schedule ribbon.
Having done this, you are presented with the Schedule Options panel.
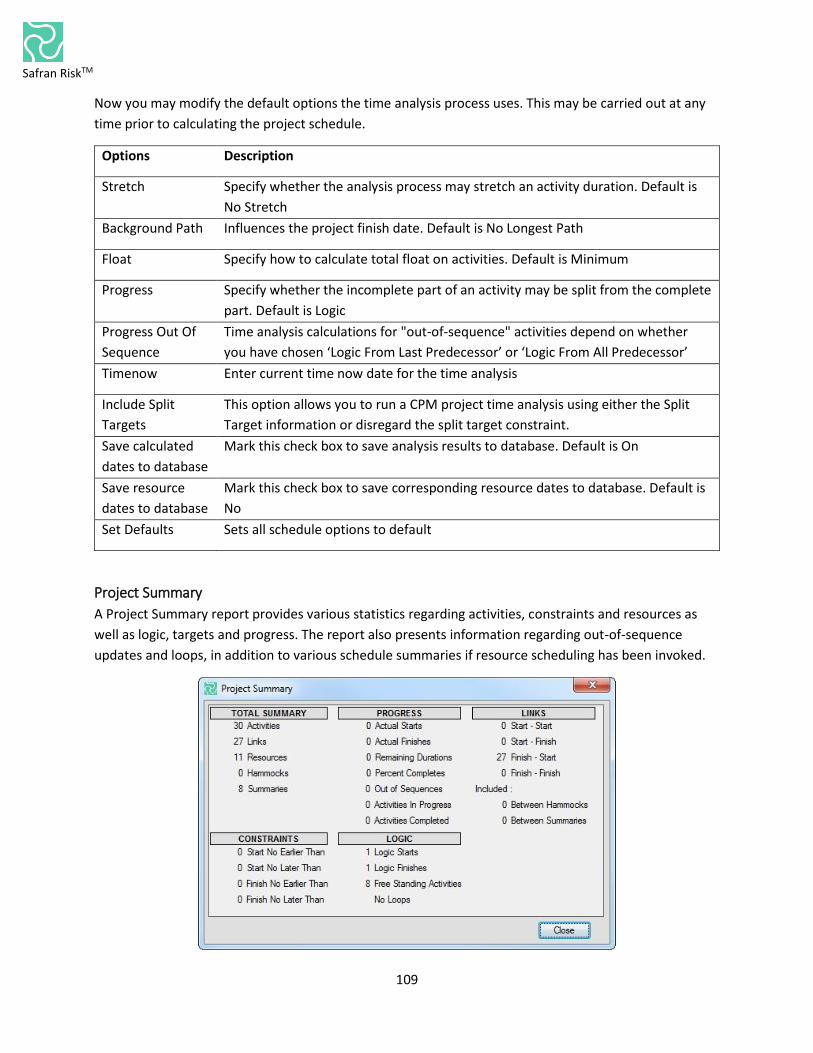
Safran RiskTM
109
Now you may modify the default options the time analysis process uses. This may be carried out at any
time prior to calculating the project schedule.
Options Description
Stretch Specify whether the analysis process may stretch an activity duration. Default is
No Stretch
Background Path Influences the project finish date. Default is No Longest Path
Float Specify how to calculate total float on activities. Default is Minimum
Progress Specify whether the incomplete part of an activity may be split from the complete
part. Default is Logic
Progress Out Of
Sequence
Time analysis calculations for "out-of-sequence" activities depend on whether
you have chosen ‘Logic From Last Predecessor’ or ‘Logic From All Predecessor’
Timenow Enter current time now date for the time analysis
Include Split
Targets
This option allows you to run a CPM project time analysis using either the Split
Target information or disregard the split target constraint.
Save calculated
dates to database
Mark this check box to save analysis results to database. Default is On
Save resource
dates to database
Mark this check box to save corresponding resource dates to database. Default is
No
Set Defaults Sets all schedule options to default
Project Summary
A Project Summary report provides various statistics regarding activities, constraints and resources as
well as logic, targets and progress. The report also presents information regarding out-of-sequence
updates and loops, in addition to various schedule summaries if resource scheduling has been invoked.

Safran RiskTM
110
Loop Check
A project may not be scheduled if the start of an activity is constrained by the start or finish of another
activity occurring later in a chain. This is called a loop. If a loop is detected, the activity and constraints
forming the loop will be displayed in the project summary report.
This option checks your project for logic loops only. This is only applicable if manual Schedule Option is
selected. Loop check is performed in real time if automatic Schedule option is switched on. You will be
notified if there are no loops in your schedule.
Out of Sequence The time analysis process takes into account information related to activity time progress and the
current Timenow date that you entered. In addition to activities being updated "in-sequence," i.e.
according to project logic, Safran Risk also supports "out-of-sequence" updating as this is not an unusual
situation in real life projects. If work is performed on an activity before its preceding activity is
completed, you may still update this activity. The exact time analysis calculations that take place for
"out-of-sequence" activities depends on whether you have chosen ‘Logic From Last Predecessor’ or
‘Logic From All Predecessor’ in Progress Out Of Sequence panel. The total number of out-of-sequence
updated activities is displayed in the Project Summary report as well.
Automatic Calculation
With this option, Safran Risk gives you the opportunity of calculating the Early Start and Early Finish
dates of the activities when:
1- You are importing a new project and you need to reschedule dates based on Timenow in Safran
2- You set constrains for your activities
By clicking on Automatic Calculation in the Project ribbon you can turn it on or off.
Safran RiskTM
111
Chapter 6 - Schedule Warnings Schedule Warnings provide you with information on your schedule quality and pays particular attention
to any areas that could present an issue when running a risk analysis. You can use the schedule warning
for assessing your schedule’s integrity and credibility.
Whenever you open up a new schedule, Safran Risk automatically prepares a Schedule Warning report
by analyzing the schedule and looking for the following items:
▪ Constraints:
- As Late As Possible
- Finish On
- Finish On Or After
- Finish On Or Before
- Must Finish On
- Must Start On
- Start On
- Start On Or After
- Start On Or Before
▪ Out of Sequence Activities
▪ Negative Lags
▪ Start to Finish Links
▪ Open-Ended Activities
▪ Lags Over 10 Percent
These warnings should be assessed within the context of the schedule. Some will have a more
detrimental effect than others; for example a ‘Must Finish On’ constraint will prevent the schedule from
moving in a free-flowing manner and can cause misleading results.
Open Items Shows a list of potential issues in the project that have not been accepted by the user. Clicking the
activity within the list will take you directly to the activity in your planned schedule. This is useful when
you need to check the activity details.
Accepted Items In the warning list provided by Safran, you may have an acceptable reason for why the item appears in
the list. In this case, you can add your reasons/arguments in the Note field and tick the ‘Accept’ box on.

Safran RiskTM
112
By clicking the ‘Accepted Items’ button, you will only see the list of items that have previously been
accepted. You can see the complete list of both accepted and not accepted activities if you click ‘All
Items’ button.
Exporting the Schedule Warning Using the Export, button, you can export your project’s schedule warnings into an XML file format.

Safran RiskTM
113
Chapter 7 - Project Risks Where global risks exist at the enterprise level, project risks are specific to the active project. Project
risks can be created by either importing a global risk or by creating a new, separate project risk.
Adding a New Project Risk To add a new Project Risk simply click on the ‘New Project Risk’ icon:
When a new project risk is added the following default values are assigned:
▪ Name - an initial unique value
▪ Description – blank
▪ Risk Type – Standard
▪ Probability – 100%
▪ Color – default risk color
▪ Notes – blank
All of these values can then be modified as necessary. The probability identifies the likelihood this risk
will occur. The color is used to further identify this risk in other parts of the system including reporting.
You are allowed to define as many Project Risks as required.
Safran Risk also allows you to include any of the Global Risks into the active project by selecting the
Global Risk from the drop down list and clicking the ‘Include in Project’ button.

Safran RiskTM
114
Risk Impact for Standard Risks When a new project risk is added, a default schedule impact is also added. To create a new risk impact
the following information is required:
Fields Options
Categories Schedule – Impacts the duration of the activities / project
Cost – Impacts the Fixed Cost element of the activities / project
Impact Type Relative – The impact, when it occurs, will be a percentage of the impacted
activities Schedule or Cost, dependent upon its Category
Absolute – The impact, when it occurs, will be an absolute value which will be
added to the impacted activities deterministic duration or cost
Distribution Triangle – Popular distribution for modelling the duration of activities
Uniform – Used when all values have an equal probability of occurring
Trigen – May be used when the extreme ends of Triangle appear unrealistic
Normal – May be used where historical data is available as normal distribution
Cumulative – Can be useful if historical data is available
Discrete – Used to model a specific set of values without any intermediate values
BetaPert – Useful when there is more emphasis around the most likely value
When creating the distribution function first select the required distribution shape as shown below.
Once this has been selected, the input values for the selected shape will become available. A visual
representation of the entered distribution function is dynamically displayed on the right-hand side of the
project risks.

Safran RiskTM
115
Impact Activities Independently A risk in Safran Risk is normally modeled as one risk event even if it is assigned to more than one activity.
This means that in each iteration all the assigned activities will be impacted in the same way. All the
activities with this risk will then also be implicitly correlated, which is one of the great benefits of using
Safran Risk. Sometimes however, you might not want the activities to be correlated just because they
are exposed to the same risk. This can be done with the “Impact activities independently” option.
By selecting this option, the risk will be modelled as one risk event per assignment. These risk events are
not correlated. The image below is a schematic illustration to visualize how selecting “Impact activities
independently” impacts the risks analysis. It shows a situation where we have one Risk that is assigned to
activities A, B and C. The risk has a likelihood of 70% and a relative schedule impact that is a triangular
distribution. The yellow flash indicates that the risk has occurred and the number is the impact in that
iteration. It is clear that with “Impact activities independently” not selected, the Risk either impacts all
the activities or none. This is because it is modeled as one risk event. With “Impact activities
independently” selected, each assignment is a risk event and therefore the risk can impact activities
differently in the same iteration.

Safran RiskTM
116
A useful occasion to use “Impact activities independently” is when you want to model estimating
uncertainty. Perhaps you want to create a risk called “High uncertainty” and assign it to all the activities
with high estimating uncertainty. If you do not select “Impact activities independently”, the activities
assigned to this risk will be correlated. However, just because one activity took longer than expected it
does not mean that all with the same uncertainty should do. By selecting “Impact activities
independently” the uncertainty will be modeled correctly.
Estimate Uncertainty Risks The “Estimate Uncertainty” risk type can be used to separate the estimate uncertainty from other risks.
Estimate uncertainty risks can only have a probability of 100% and they always impact activities
independently.
The big difference between Estimate Uncertainty and standard Risks is how they’re used in the mappings
tab. All the estimate uncertainty risks are displayed to the left and you can only select one per activity.
When you’re setting up Estimate Uncertainty risks you would normally use relative impacts. This allows
the risk to represent some general uncertainty that can be assigned to many activities.

Safran RiskTM
117
Risk Impact for Calendar Risks The risk impact for calendar risks are rather different compared to standard risks. To observe the
calendar risk impact, select one of the risk calendars from the dropdown list in the impact window.
You will then can get an overview of the calendar risk impact as the downtime period, number of
samples and the notes for that specific calendar.
Note that the probability for calendar risks are locked to 100%, which means the calendar will be used
for every iteration.
Mitigation In addition to supplying the risks initial, Pre-Mitigated impacts, you can also now define Post-Mitigated
impacts. These are defined in exactly the same way as the Pre-Mitigated impacts, by supplying a
probability the risk will occur and the resulting impacts in the event that it does.
Once the Post-Mitigated position has been defined it can easily be selected from the ‘Analyze’ tab, this
allows different mitigation strategies to quickly be compared against one another to determine the most
viable approach to take.

Safran RiskTM
118
Export and Import Project Risks Using the designated buttons, you can Export and Import project risks in either XML or Excel file format.
XML When project risks are exported to XML all the related information is also exported including risk
calendars, impacts, mappings and correlations.
When importing risks from an xml file the risks will be added to the existing risks.
Excel Exporting to excel can be very useful if you for example want to do mass updates or distribute your risk
register to parties that don’t have Safran Risk. It can also be used to import risks from other risk registers
into Safran Risk.
When exporting to excel the risks and impacts are exported, but not the mappings, correlations or risk
calendars.
When risks are imported from excel, Safran Risk compares the names of the imported risks to the names
of the existing risks. If the risk already exists, it will be updated. If it doesn’t exist it will be added.

Safran RiskTM
119
Delete Project Risks and impacts You can delete Project Risks by clicking the ‘Delete Project Risk’ icon. When you delete a Project Risk, all
the related impacts, mappings and correlations will be also deleted.

Safran RiskTM
120
Chapter 8 - Correlation Risks do not always occur independently of each other. When one risk occurs, the likelihood or impact of
another might be higher or lower. This is modelled in Safran Risk using a correlation matrix.
The Correlation Matrix The correlation matrix offers a practical way to correlate the probabilities and impacts of different risk
factors. This can often be an essential tool in order to model risks accurately. In this matrix, you can
specify the correlation between all risk factors that you have identified for your project (The exception
are the risks which impact activities independently. Since they can represent many independent risk
events, they cannot be correlated to other risks).
A risk is modelled using a number of probabilistic distributions (one for probability and one for each
impact). The correlation between two distributions describes the dependence between them (and
implicitly the dependence between the risks) on a scale from -1 to 1. The correlation of a distribution
with itself is conventionally considered as 1. A value of 0 means that the distributions are independent of
each other.
The correlation matrix is used to describe a statistical dependency between two or more input
distributions. It has a row and a column for each probability and impact that has been defined for the
project.
When you enter a number between -1 and 1 in the matrix you’re creating a dependency between two
distributions. If for example experience tells us that when a mechanical breakdown occurs, a fire is more
likely, this can be modelled. It is done by entering a positive value in the correlation matrix at the cross
section of Mechanical Breakdown probability and Fire probability.
Inconsistent Matrix Keep in mind that the matrix has to be consistent! For example, when having a relationship between
distributions A and B, and another relationship between B and C, we should have a relationship between
A and C as well, so all three are consistent.
If you, for any reason, type a value that results in an inconsistent matrix, you will get a warning. You can
fix the inconsistency manually by changing the values in the matrix (recommended) or let Safran Risk
replace them with values that result in a valid matrix. If the matrix is in an inconsistent state, you will not
be able to run the risk analysis with correlation. You can however leave the matrix in an inconsistent
state and fix it at a later time.

Safran RiskTM
121
In order to get the most efficient use of your table, Safran Risk allows you to see only the risk factors
with values in the matrix. To do so, simply click on ‘Hide Empty Cells’ icon.

Safran RiskTM
122
Chapter 9 - Risk Mapping In this chapter you will be guided through mapping the identified risks to your project.
What is Risk Mapping? Risk mapping is an important step in any risk management process. This process can often take place as
part of, but is not restricted to, regular risk workshops. Risk Mapping is a useful way to see and discuss
the risks within the team and identify the best scenarios for mitigating or eliminating the risks.
Assigning Risks The risk mappings screen presents the activities and the risks together in one easy to use view (as shown
below). The activities appear on the left-hand side with the risks available as checkboxes to the right.
One powerful feature of Safran Risk is the real-time distribution calculation that can be seen in the
bottom right of the above screenshot. As you assign risks to activities this will calculate an approximation
of the combined impact of all the risks on that activity. By default, this will use the Pre-Mitigated impacts
of the risks for its calculations, this can be changed in the options to use the Post-Mitigated impacts or
use the Pre and Post Mitigated selections that the user can make in the ‘Analyze’ tab.

Safran RiskTM
123
The activities that are displayed on the left will automatically be filtered based on any filter that is
applied to the schedule tab. This means that all of the information you have in your schedule is available
to present the activities in any way that is appropriate. A good example of this would be to organize the
activities by WBS, Phase or Activity Codes, that allows you to very easily allocate risks to sections or sub-
sections of, even very large projects.
In addition to using the filters that are applied to the schedule you can also further filter this list by
switching on the ‘Filter’ in the toolbar. This allows you to restrict the activities shown by entering
freeform text into either the Id or Description in conjunction with a wide selection of operators, such as
Contains, Starts with, Greater than etc.
It is also possible to filter the activity list to only show activities that have the selected risk(s) assigned.
This is done by clicking in the heading of the risk, in the example below the activities are filtered to only
show those that currently have either Design or Governance risks assigned to them.

Safran RiskTM
124
Risks can either be allocated to individual activities or they can be allocated at the summary level, in the
latter case the risks will automatically be allocated all the way down the hierarchy, making it a one-click
process to assign risks to complete sections of, or even the entire, project.
The right-hand section of the screen provides an overview of all the risks that are assigned to the
selected activity or summary, expanding the risks will provide further information on the impacts those
risks will have on the selected activity. When multiple risks are assigned to an activity you can specify
whether those risks should impact the item in series or in parallel, if they impact in series the impacts of
all the risks will be added together whereas, if they impact in parallel, only the largest of impacts will be
considered.
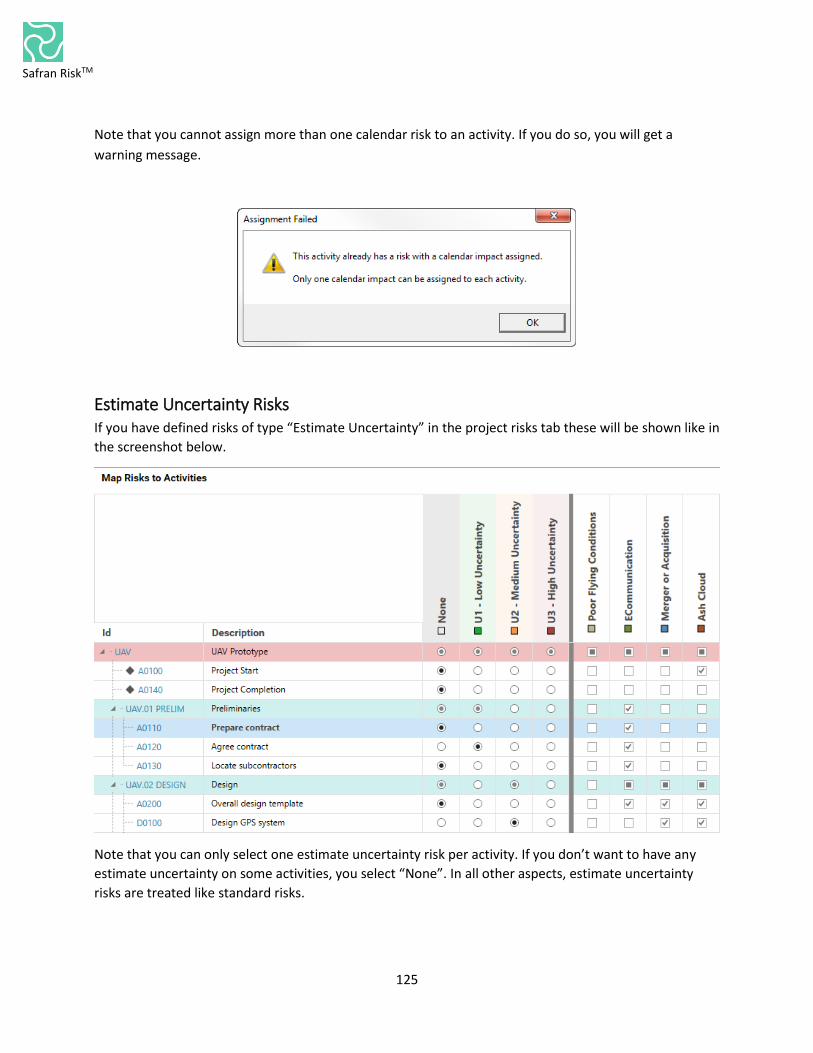
Safran RiskTM
125
Note that you cannot assign more than one calendar risk to an activity. If you do so, you will get a
warning message.
Estimate Uncertainty Risks If you have defined risks of type “Estimate Uncertainty” in the project risks tab these will be shown like in
the screenshot below.
Note that you can only select one estimate uncertainty risk per activity. If you don’t want to have any
estimate uncertainty on some activities, you select “None”. In all other aspects, estimate uncertainty
risks are treated like standard risks.

Safran RiskTM
126
Activity Uncertainty If you have defined activity uncertainty in your plan, this can be used in Safran Risk. To do this you need
to do two things:
• Make sure that the values are entered in the appropriate columns in the Scheduling tab. The
picture below shows an example of this.
• In the Risk Mapping Options, set the “Estimate Uncertainty Type” to “Use Activity Uncertainty”
If you do these two things, the Activity uncertainty will be visible in the Risk Mapping grid and it will be
used during the risk analysis. Note that you can’t edit them in Risk Mapping. This can only be done in the
Schedule tab.
Converting Activity Uncertainty to Estimate Uncertainty Risks Using Estimate Uncertainties instead of uncertainty on each activity offers some benefits. It’s easier to
maintain, since instead of having to maintain individual numbers on potentially thousands of activities.,
you just have a few categories of numbers. This simplifies the task of changing what for example “low
uncertainty” should mean. Using Estimate Uncertainty risk also allows you to easier see the impact on
the Project in the reports, for example the sensitivity analysis.
If you have individual uncertainties on the activities in the project, Safran Risk allows you to convert
these into Estimate Uncertainty risks. To do this you just click the “Convert Uncertainty” button in the
toolbar. This should give you a dialog that looks something like this:

Safran RiskTM
127
Safran Risk has put all the activity uncertainties into groups depending on their size and created an
Estimate Uncertainty Risk for each group. The groups are given automatic names that can be changed
before clicking “Create Risks”.
When you click “Create Risks” the new estimate uncertainty risks are created and the activities that had
uncertainty in the schedule will be mapped to one of the newly created risks. Once you’ve done this you
can run a risk analysis using the new risks and make sure the results are similar.
The results won’t be exactly the same, but should be similar enough for it not to have any significant
impact on the risk analysis.
If you would like to go back to using the activity uncertainties defined in the project, you can just go to
Options and set the “Estimate Uncertainty Type” back to “Use Activity Uncertainty”.
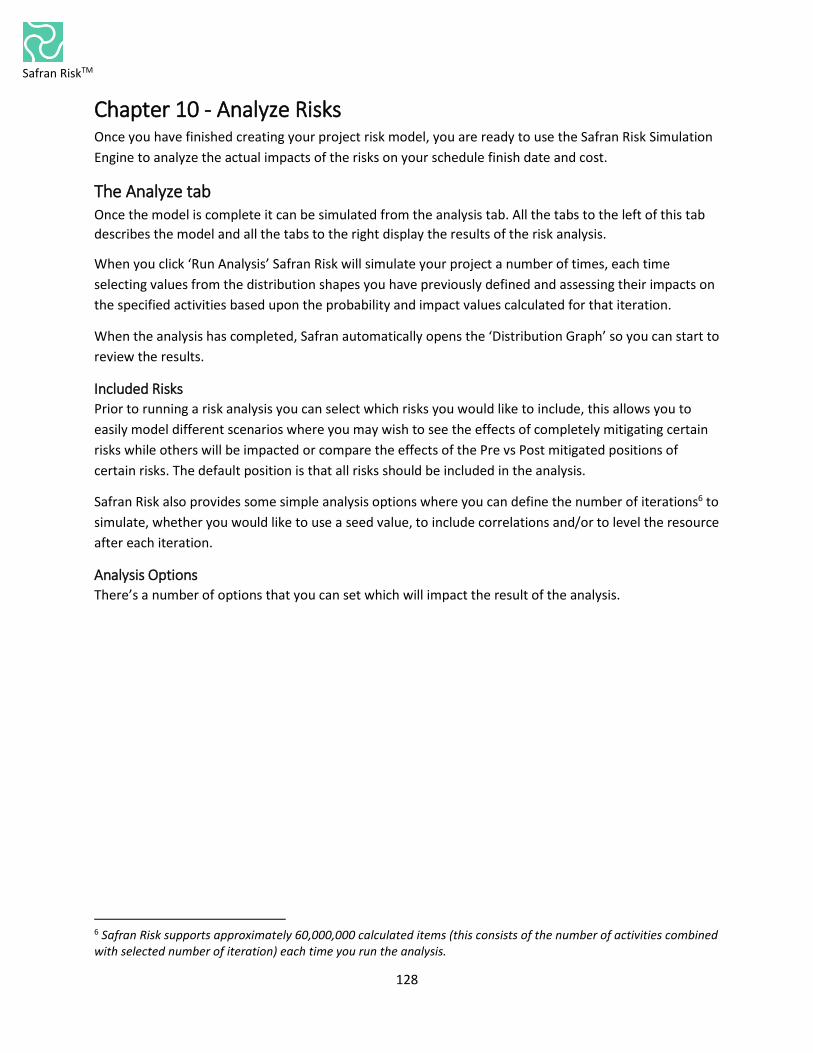
Safran RiskTM
128
Chapter 10 - Analyze Risks Once you have finished creating your project risk model, you are ready to use the Safran Risk Simulation
Engine to analyze the actual impacts of the risks on your schedule finish date and cost.
The Analyze tab Once the model is complete it can be simulated from the analysis tab. All the tabs to the left of this tab
describes the model and all the tabs to the right display the results of the risk analysis.
When you click ‘Run Analysis’ Safran Risk will simulate your project a number of times, each time
selecting values from the distribution shapes you have previously defined and assessing their impacts on
the specified activities based upon the probability and impact values calculated for that iteration.
When the analysis has completed, Safran automatically opens the ‘Distribution Graph’ so you can start to
review the results.
Included Risks Prior to running a risk analysis you can select which risks you would like to include, this allows you to
easily model different scenarios where you may wish to see the effects of completely mitigating certain
risks while others will be impacted or compare the effects of the Pre vs Post mitigated positions of
certain risks. The default position is that all risks should be included in the analysis.
Safran Risk also provides some simple analysis options where you can define the number of iterations6 to
simulate, whether you would like to use a seed value, to include correlations and/or to level the resource
after each iteration.
Analysis Options There’s a number of options that you can set which will impact the result of the analysis.
6 Safran Risk supports approximately 60,000,000 calculated items (this consists of the number of activities combined with selected number of iteration) each time you run the analysis.

Safran RiskTM
129
Number of Iterations
A number between 1 and 10000 that determines how many times the project will be simulated during
the risks analysis.
Seed
Seeds are integers that are used for generating the exact sequence of pseudorandom numbers for
Safran Risk simulation modeling. With a blank seed value, Safran will run the simulation every time with
a randomly selected seed number. However, as we have selected a fixed seed value, the simulation
results will be reproducible every time the analysis is run.
Using seed values are beneficial for developing risk models as you can change your risk model and clearly
see how your results are affected by the changes alone and not the effects of any randomization.
Include Correlations
With this option checked the values set in the correlation tab will affect the result of the analysis.
Resource level after each iteration
If this option is selected, then whichever resource levelling options are supplied in the schedule tab will
be applied to each iteration of the risk analysis.
Step Through
If you want to see what the schedule looks like during each iteration you can select this option. To be
able to see how the schedule is affected by the risks is a great way to verify that your model is correct.

Safran RiskTM
130
Focus Activities The focus activities in Safran Risk are activities that you have a special interest in. They would typically be
major milestones in a project. Adding activities as focus activities lets you do a few extra things:
• Show only the focus activities in the Distribution Graph tab. This lets you quickly have a look at
the results that really matter to you.
• Calculate the drivers of the focus activities in the Drivers tab
• Calculate how the exclusion of a risk affect the finish date and cost of a focus activity in the
Sensitivity tab

Safran RiskTM
131
Chapter - 11 Result Summary The results summary view provides some key overview information of the last completed analysis.
This includes information such as the number of risks and activities analyzed, and the probability of
finishing within the deterministic finish date and cost of the project.

Safran RiskTM
132
Chapter - 12 Distribution Graph When you run the risk analysis, Safran automatically generates a Risk Histogram for finish date, duration
and cost.
The distribution graph is by default displayed for the entire project; however, you may choose to see the
results an activity or a summary.
When you select one activity, Safran shows only the histogram and the related information for that
activity.
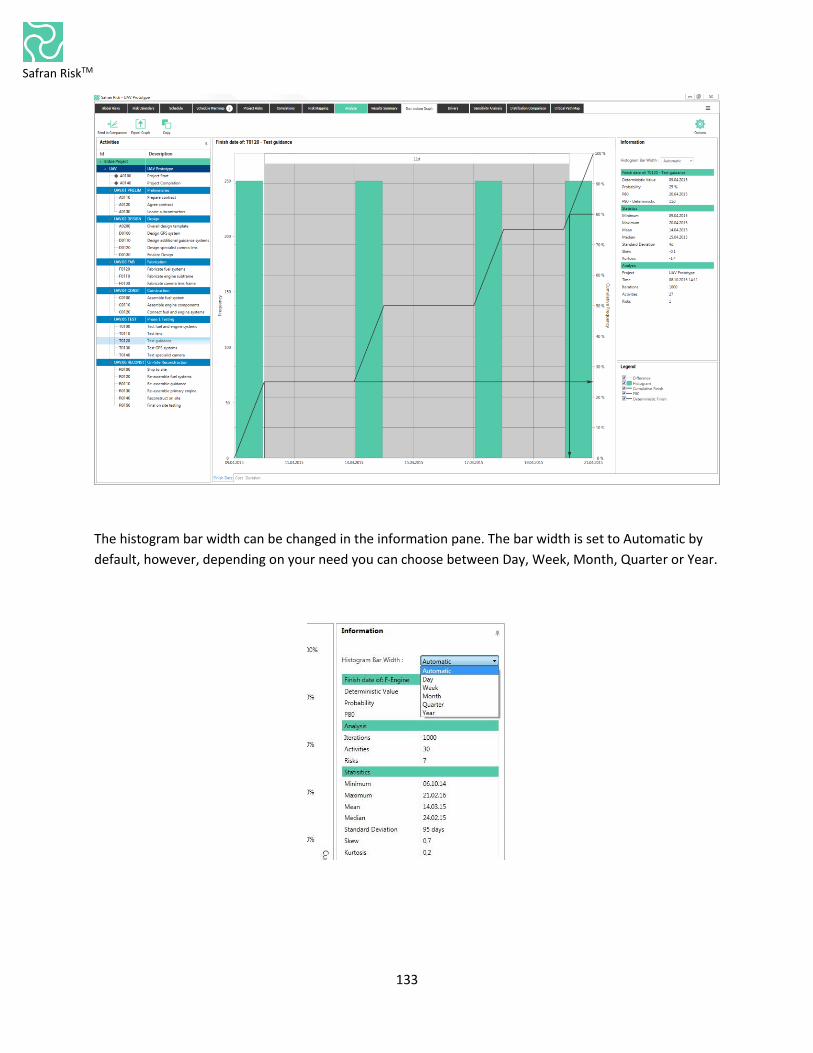
Safran RiskTM
133
The histogram bar width can be changed in the information pane. The bar width is set to Automatic by
default, however, depending on your need you can choose between Day, Week, Month, Quarter or Year.

Safran RiskTM
134
Depending on which histogram you select, either Finish Date or Cost, the information pane provides you
with the related information from the analysis results. The information pane consists of three main
areas:
▪ Finish date/Cost
- Deterministic Value: The activity or project scheduled finish date or cost
- Probability: The likelihood of achieving the deterministic value
▪ Annotations
Here the values of the arrow and curtain annotations are shown. See below for details on how to
set them up.
▪ Statistics
- Minimum: The earliest finish date or the lowest cost
- Maximum: The latest finish date or the greatest cost
- Mean: The mean value for the finish date or cost
- Median: The median value for the finish date or cost
- Standard Deviation: The amount of variation in days or cost
- Skew: Shows how symmetrical the date/cost distribution is in your model. in the skew in
a symmetrical distribution = 0, right sided asymmetrical distribution = positive skew, left
sided asymmetrical distribution = negative skew
- Kurtosis: shows how the data distribution matches the normal (Gaussian) distribution.
Kurtosis is 0 when data distribution matches the normal distribution, Kurtosis is negative
when data distribution is flatter than normal, while it is positive when the data
distribution is more peaked than normal
▪ Analysis
- Iterations: Shows how many simulations have been run against the current risk model
- Activities: The number of activities involved in the analysis process
- Risks: The number of identified risks
If you would like to use the results from this analysis to compare against other scenarios or save these
results for comparison at a later time you can send results to the Distribution Comparison report by
clicking the ‘Send to Comparison’ button on the ribbon. You also have the ability to export the graph as
an image or copy it to the clipboard.

Safran RiskTM
135
More information on the ‘Send to Comparison’ function can be found in section ‘Distribution
Comparison’.
Activity Tree In the activity tree you pick the Activity or WBS that you’re interested in seeing the results for. The tree
will have the same content and grouping as the tree in the schedule tab. In other words, the activity list
will change when you change the view (Outline View/Group View), the layout, grouping and/or filter in
the Schedule tab.
If you want to quickly filter it down further you can click on the Filter Icon.
This gives you some textboxes in the id and description columns where you can type in what you’re
searching for. As default the filter will try to find rows that start with the text you’re typing. For other
options, such as finding rows containing a text you can click on the “Aa” symbol.
Another way to filter is to only show your focus activities. To do this you just click the Focus Activities
icon.
Focus Percentiles Safran Risk lets you set three percentiles that are used to display information about the output
distributions. These can be set in the Options pane. The same percentiles can also be changed from the
Sensitivity Analysis and the Distribution Comparison tabs.

Safran RiskTM
136
Graph Options You can set a number of properties for the graph, such as color and line width, in the Options pane.
Graph Annotations There’s two types of annotations that can be added to the distribution graph. Arrow and Curtain
annotations. Arrow annotations visually connect a value on the x-axis to one on the y-axis, for example it
can show the probability of the deterministic value or it can show a certain percentile. Curtain
annotations highlight the difference between two values on the x-axis.
To add or modify annotations you go to the Options pane. To add a new annotation, you click on the + to
the right of Arrow Annotations or Curtain Annotations. To remove an annotation you click on the – next
to that annotation. The values you can select in the From and To fields are Deterministic, Mean, and the
Percentiles that you’ve set up under the Focus Percentiles section.
The annotations will be shown visually in distribution graph and as values in the information grid.
Data View and Post Analysis By clicking on the Data View icon in the Distribution Graph, you can see the values that the Curve and
Histogram were created from. The values are presented in a grid where each line is an iteration during
the risk analysis. On each line you can see the Finish Date, Cost and Duration for that iteration. You can
also see which risks impacted the plan during that iteration, and by how much.

Safran RiskTM
137
Risks impacting the duration have a square and risks impacting the cost has a dollar sign. Red means that
the impact was negative (longer duration / higher cost) and green means that the impact was positive.
To see the exact value of the risk you can hover the mouse over a cell. If the risk is set to impact activities
independently a grey square is shown. This is because the risk might have impacted activities differently
during the same iteration.
If you want to see what the plan actually looked like during a particular iteration you can just click on the
number in the leftmost column. This takes you to the schedule tab where the plan is shown as it was
during that iteration. This can be a very efficient way of verifying that your risk model has worked as
expected.
When you select an activity (or summary) in the tree on the left side, the values for that activity will be
shown in the grid. The risk impacts will always be the same whichever activity you select. However, the
risks not impacting the selected activity directly will be greyed out.
If you want to use the data from this view in another tool you can click on export data or copy data.
Export data exports the data csv file. Copy data copies it to the windows clipboard in a format that you
can just paste into for example Microsoft Excel.

Safran RiskTM
138
Chapter 13 - Drivers It is of great importance to clarify what Risk Drivers mean in Safran terminology. Within our project plan,
we identify risks, assign them to the related activities and calculate their impacts. As we have already
seen, a project activity may be affected by one or more risk impacts.
We can define risk drivers as the elements (or factors /causes), which may lead to different project
outcomes than those we have planned.
Safran Risk provides a list of project finish and project cost risk drivers on the left-hand side and activity
project finish and cost drivers on the right-hand side.
The risk drivers are ranked by those risks that, during the simulations, were most tightly correlated to
either delays in the project finish or overspends in the project cost.
Similarly, the activity drivers are ranked by those activities that, during the simulations, were most tightly
correlated to either delays in the project finish or overspends in the project cost.
In the presented risk driver graph, you can click either on the project risks or on the activities and you
will be automatically redirected to the corresponding risk or activity page.

Safran RiskTM
139
Any of the graphs you choose can be exported as an image by clicking either of the two export icons in
the ribbon. Images can be copied to the clipboard or saved as a ‘.PNG’ image file.
Driver Options There’s a number of Options in the drivers tab that lets you choose how the values are calculated and
what the tornados should look like.
Driver Calculations
If you’ve selected focus activities in the Analyze tab, this option allows you to look at what’s driving a
focus activity instead of the entire project. You can also select the correlation calculation method. Either
Spearman or Pearson.
Driver Options
In here you can choose what the graphs should look like and how many risks and activities that should be
included.

Safran RiskTM
140
Chapter 14 - Sensitivity Analysis The drivers report allows you to identify which risks are responsible for delaying the project completion
or causing cost overruns. Sensitivity analysis takes this a step further by providing you with detailed
information on precisely how much of an effect these risks have in term of days and/or cost units.
In order to run the sensitivity analysis simply click on the ‘Calculate Impacts’ button and Safran will
initiate the analysis.
When running using the default, ‘Single Pass’ method the sensitivity analysis will perform an initial run
with all the risks included, it will then systematically re-run the entire analysis excluding one risk at a
time to allow it to gather specific information on the impacts of each individual risk.
When the analysis has completed Safran shows the results for all the risks in your plan. The Impacts pane
lists all of the risks, initially sorted by schedule impact; the Compare Risk Curves pane shows all the
corresponding curves for these risks, color-coded according to the color that was chosen for the risk
when it was created.
Any of these curves can be hidden or shown by clicking the checkbox next to each risk in the Impacts
pane. You can also select or deselect all curves by ticking on or off the box on the left hand side of
Exclude Risk field.

Safran RiskTM
141
Safran Risk provides an instant visualization of the different risk impacts at any selected confidence level.
To view the impact each risk has to the schedule at different confidence simply change the selected
confidence in the options. The values for the updated confidence level are immediately visible in both
the Impacts pane and the annotations on the Compare Risk Curves chart.
The bar graphs within the Impacts pane, also known as a ‘Tornado Plot’, show the relative magnitude of
both the schedule and cost impacts. It also shows the direction of the impact (positive or negative) for
each risk element.
If you’ve selected one or more Focus Activities in the Analyze tab, you can also see how much a risk
impacts an activity. You do this by selecting one of your focus activities in the dropdown in the upper
right corner. Note that if you add more focus activities you have to re-run the sensitivity analysis to see
the new focus activities in the drop down. Below this drop down you can select the percentile that you
are interested in.
To change the percentiles, you go to Focus Percentiles in the Options pane.
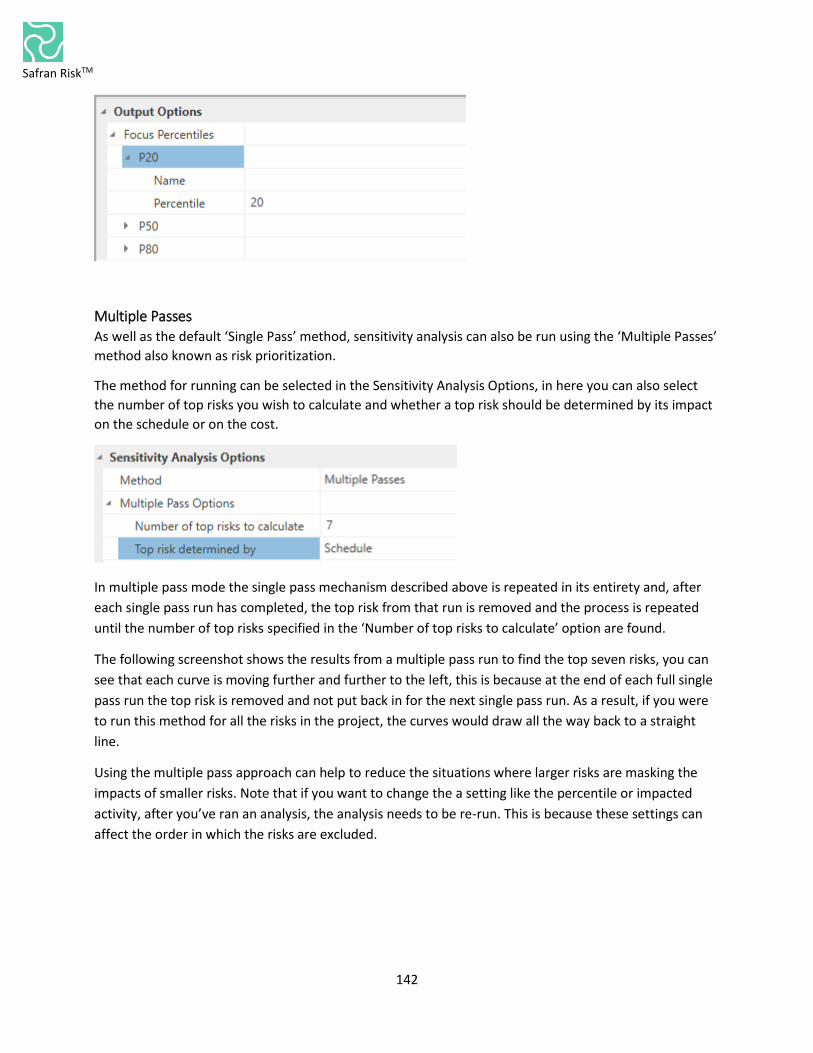
Safran RiskTM
142
Multiple Passes As well as the default ‘Single Pass’ method, sensitivity analysis can also be run using the ‘Multiple Passes’
method also known as risk prioritization.
The method for running can be selected in the Sensitivity Analysis Options, in here you can also select
the number of top risks you wish to calculate and whether a top risk should be determined by its impact
on the schedule or on the cost.
In multiple pass mode the single pass mechanism described above is repeated in its entirety and, after
each single pass run has completed, the top risk from that run is removed and the process is repeated
until the number of top risks specified in the ‘Number of top risks to calculate’ option are found.
The following screenshot shows the results from a multiple pass run to find the top seven risks, you can
see that each curve is moving further and further to the left, this is because at the end of each full single
pass run the top risk is removed and not put back in for the next single pass run. As a result, if you were
to run this method for all the risks in the project, the curves would draw all the way back to a straight
line.
Using the multiple pass approach can help to reduce the situations where larger risks are masking the
impacts of smaller risks. Note that if you want to change the a setting like the percentile or impacted
activity, after you’ve ran an analysis, the analysis needs to be re-run. This is because these settings can
affect the order in which the risks are excluded.

Safran RiskTM
143
Tornado View In addition to s-curves the results of the sensitivity analysis can be presented as a tornado.
To do this you click the Tornado icon in the toolbar. The tornado shows both the schedule and the cost
impact as default. To change the tornado settings you click Options | Tornado Chart Options.

Safran RiskTM
144
Chapter 15 - Scatter Plot In the Scatter Plot you can compare two distributions and see how they’re correlated to each other. You
can also see the Joint Confidence Level (JCL) for a combination of two values. E.g.: What’s the probability
of finishing before date x and below cost y? The plot visualizes each iteration as a dot, which position is
determined by the two values that you choose.
The picture above shows the default setup of the Scatter Plot. In it we’re comparing the project finish
date (on the x axis) and the project cost (on the y axis). The plot tells us that there is only a 7% chance of
finishing before the deterministic finish date and below the deterministic cost. This is visualized by the
green markers in the lower left corner. The red markers in the top right corner shows that there is a 79%
chance of being both late and over budget.
X and Y Axis The two axes in the plot are controlled via the settings on the two tabs in the upper left part of the
screen. Each axis in the plot has a Result type, Target Value and Project Part.
The Result Type can be Finish Date, Cost or Duration.
The Target Value can be set to the deterministic value or any custom value.
The project parts for the x and y axis are locked by default, meaning that you compare values for the
same activity, summary or project. If you’d like to compare, let’s say the duration of activity A with the
cost of activity B you can do this by going to the “Y Axis” tab and unchecking “Same as X Axis”.
Comparing different project parts can be useful in order to figure out if the correlation in your model is
working as expected.
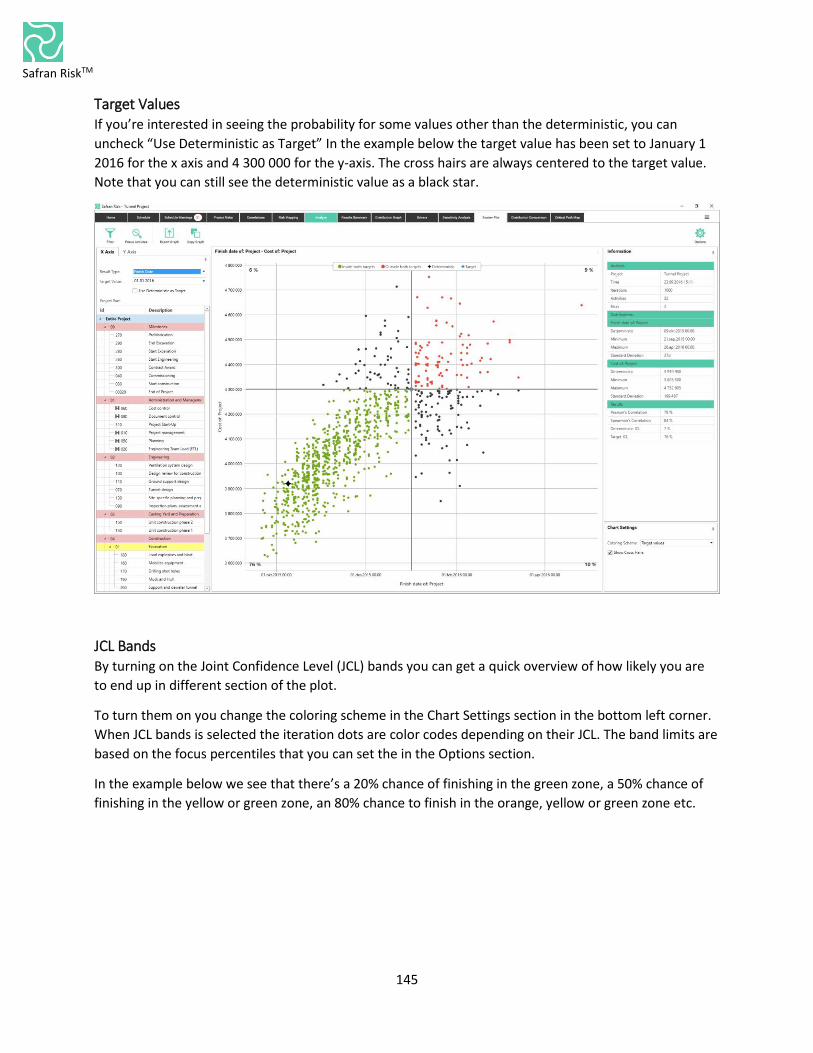
Safran RiskTM
145
Target Values If you’re interested in seeing the probability for some values other than the deterministic, you can
uncheck “Use Deterministic as Target” In the example below the target value has been set to January 1
2016 for the x axis and 4 300 000 for the y-axis. The cross hairs are always centered to the target value.
Note that you can still see the deterministic value as a black star.
JCL Bands By turning on the Joint Confidence Level (JCL) bands you can get a quick overview of how likely you are
to end up in different section of the plot.
To turn them on you change the coloring scheme in the Chart Settings section in the bottom left corner.
When JCL bands is selected the iteration dots are color codes depending on their JCL. The band limits are
based on the focus percentiles that you can set the in the Options section.
In the example below we see that there’s a 20% chance of finishing in the green zone, a 50% chance of
finishing in the yellow or green zone, an 80% chance to finish in the orange, yellow or green zone etc.

Safran RiskTM
146

Safran RiskTM
147
Chapter 16 - Distribution Comparison Sensitivity analysis provides an automatic mechanism for calculating and assessing the impacts of
individual risks on your project, Distribution Comparison allows you to perform similar analysis in a more
flexible, controllable way.
As explained earlier in the ‘Distribution Graph’ section, whenever you run an analysis you have the
option to send the current results for comparison by clicking the ‘Send to Comparison button’.
All of the results that are sent to distribution comparison will be saved until you remove them either by
removing all using ‘Clear Graph’ or individually using ‘Delete Distribution’.
The results are saved independently of which project you have open. This means that you can not only
perform comparisons of different scenarios within a project by selecting / deselecting groups of risks but
you can also perform the same comparison across any projects within your organization.
Each result can be given a meaningful title and all of the associated information such as the deterministic
value, probability of completion, number of risks included etc. can all be viewed in the Details pane.
You can compare the distribution at any of your three selected focus percentiles. You switch between
them by using the drop down above the grid. If you want to change the percentiles, you go to Focus
Percentiles under Options.

Safran RiskTM
148
Consistent with all the Safran Risk outputs you can either use the Export Graph button to save the results
to a file or you can use the Copy button to save the results to the clipboard. You also have the possibility
to export/Import the graphs in a XML file format which could be useful for comparing a number of
different scenarios.
Reports The distributions exported to Distribution Comparison are collected in a report. By clicking on the
Reports button you can create new reports or switch to another report. When exporting the distribution
from the Distribution Graph, it ends up in the currently open report.
The reports have a name, a description and a notes field.
Trending In order to see how the risk analysis results have changed over time, the distribution comparison report
has a mode called “Trending”. In this mode the x axis shows when the analysis was done (the model
date) and the y axis shows the result. For each analysis, the values of the focus percentiles are plotted.
This results in a plot like the one below.
The model date is automatically set to the date you ran the analysis but can be changed in the table.
This graph can be very useful in describing whether the uncertainty in a project is increasing or
decreasing.
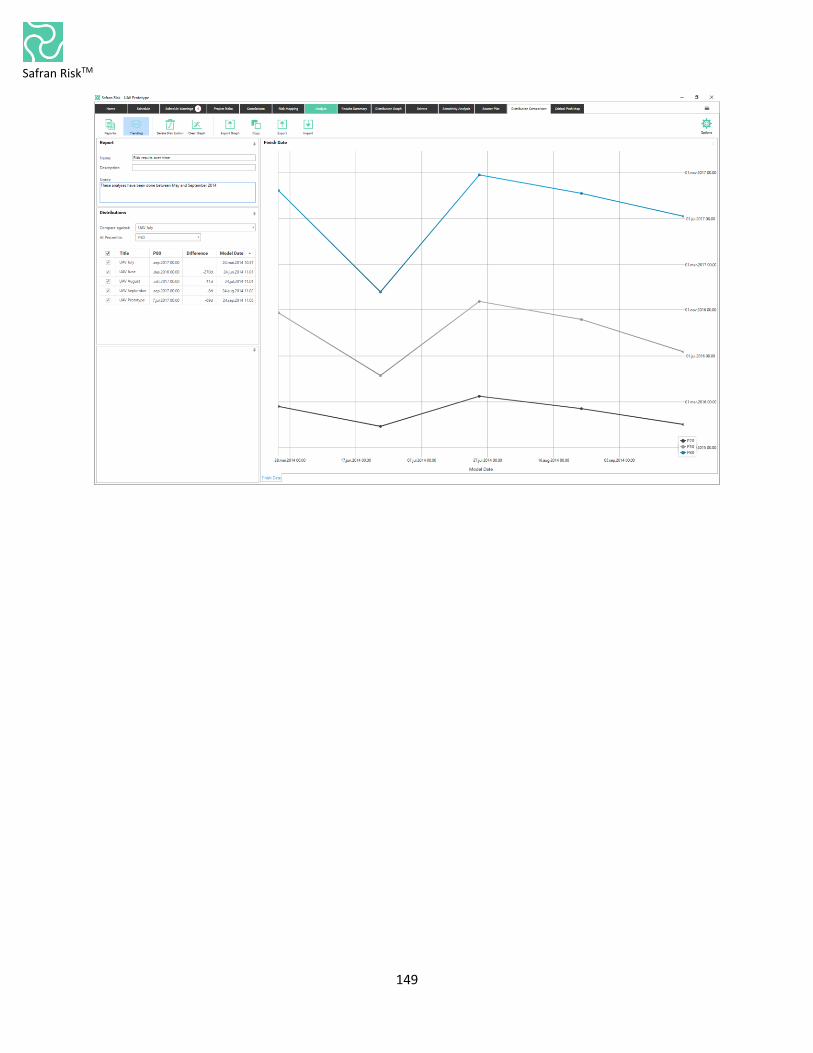
Safran RiskTM
149

Safran RiskTM
150
Chapter 17 - Critical Path Map When schedule risks are being considered the traditional deterministic critical path is quite often no
longer the most critical path.
The Safran Risk Critical Path Map provides a detailed insight into the effects the risk model has on the
activities and paths through the schedule.
To run a critical path analysis you must have previously run a risk analysis, once this has been done
simply click ‘Critical Path Analysis’ to generate the following information.
The Critical Path Map is divided into three main sections:
1- Critical Paths
The critical paths pane shows all the paths through the schedule that were critical during at least one of
the risk simulations. The Frequency column indicates how often a path appeared as critical during the
analysis, the color column corresponds to the points that are plotted on the path plot chart (see Path
Plot), the checkbox allows you to show / hide activities on the selected path in the Gantt View and also
the related points on the path plot.
2- Gantt View
The Gantt view pane, by default, shows all the activities that were critical during the analysis.
The data table shows how critical each activity was, ‘1’ means the activity always appeared on the critical
path, it also shows the deterministic start and finish dates of each activity.
The Gantt chart shows these activities positioned according to their deterministic dates, it also shows all
the paths that each activity was critical on, and this list is sorted initially on the criticality column (most
critical first).
3- Path Plot
The path plot pane provides a visual representation of exactly where on the curve each of the listed
critical paths appear. Each dot represents one iteration colored by the path that was critical for that
iteration and shows the relative duration of that iteration.
This can provide important information not traditionally available, for example, you may find that the
path that appears to be critical with the highest frequency is largely isolated to those iterations with a
smaller duration whereas paths that are critical less frequently are actually responsible for those
iterations where the project completed in the longest duration.
The path plot can either be saved to a file (Export Graph) or copied to the clipboard (Copy).
The Gantt chart, shown centrally below, displays activities from the selected paths and how often each
activity was critical during the analysis. The list can be filtered to display all activities, only activities that
are exclusive to the selected paths or only activities that are common to the selected paths.
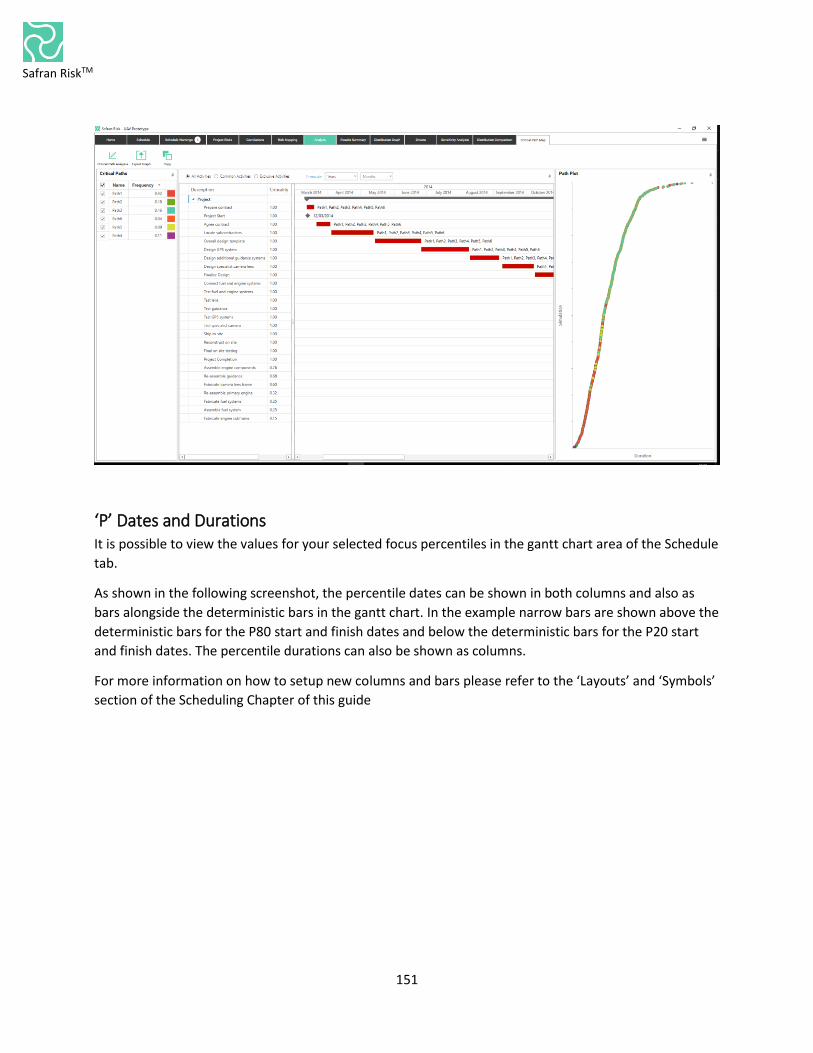
Safran RiskTM
151
‘P’ Dates and Durations It is possible to view the values for your selected focus percentiles in the gantt chart area of the Schedule
tab.
As shown in the following screenshot, the percentile dates can be shown in both columns and also as
bars alongside the deterministic bars in the gantt chart. In the example narrow bars are shown above the
deterministic bars for the P80 start and finish dates and below the deterministic bars for the P20 start
and finish dates. The percentile durations can also be shown as columns.
For more information on how to setup new columns and bars please refer to the ‘Layouts’ and ‘Symbols’
section of the Scheduling Chapter of this guide

Safran RiskTM
152

Safran RiskTM
153
Appendix A – Constraints Safran Project uses Critical Path Method to calculate activity dates. This method is based on estimated
activity durations together with the logical relationships between the activities. Project logic may not
reflect all conditions and sometimes you need to impose constraints on specific dates. You can constrain
certain activities, which affects the way Safran Project calculates dates for activities and links.
Logic One of the key elements when modeling a project work is the ability to logically link activities using
different types of relationships or constraints. The constraint type specifies the relationship between the
preceding and the succeeding activity. There are four types of constraints:
Finish to Start Constraint (FS)
The start of an activity depends on the finish of the preceding one.
Activity B may not start until activity A has finished.
Start to Start Constraint (SS)
The activity may not start until the preceding activity has started.
Activity B may not start until activity A has started.
Finish to Finish Constraint (FF)
The activity may not finish until the preceding activity has finished.
A B
A B
A B

Safran RiskTM
154
Activity B may not finish until activity A has been completed.
Start to Finish Constraint (SF)
The activity may not finish until the activity preceding it has started.
Activity B may not finish until Activity A has started. The SF constraint discussed above is rarely needed in
practice.
All of the constraints above may be modified by use of both positive and negative delays. It is therefore
possible to specify whether a succeeding activity is to start immediately, if there is to be an overlap or
whether there should be a delay.
Date Constraints In many projects, it may be necessary to impose dates on certain activities that need to have higher
priority than the project logic itself. Examples of such may be specific dates that must be met in order to
achieve either desired or contractual goals in the project. Date constraints or Target dates may be used
to lock the start or finish of a single activity, a phase of work, a particular work package, a sub project or
the entire project. Target dates have higher priority than logical constraints and will have an effect on
the schedule analysis calculations further influencing float values.
Date constraints may be assigned to both activities and logic constraints. The latter is called a Split
Target. The following Date Constraints or Target dates are available in Safran Project:
Date Constraints – Activities Description
Target Start Early Date to impose an earliest start date for the activity
Target Start Late Date to impose a latest start date for the activity
Target Complete Early Date to impose an earliest completion date for the activity
Target Complete Late Date to impose a latest completion date for the activity
Fixed Start Fixed mandatory, Start date for the Activity. Overrides all other
targets
Fixed Finish Fixed mandatory, Finish date for the Activity. Overrides all other
targets
A B
Safran RiskTM
155
As Late As Possible Uses the activity free float to push the activity to start as late as
possible without delaying any succeeding activities
Date Constraints – Logic Description
Split Target Logic date and float constraint
Target Start Early
Target Start Early is used to prevent an activity from beginning before a specified date. If a value for the
field is entered, it means that the activity must not commence before this date. It may however start
later than this date.
Target Start Late
In order to determine that the activity early start must not be later than a particular date, a Target Start
Late date may be specified. This will allow the activity to start earlier than the specified date, but not
later.
Target Complete Early
Target Complete early specifies that the activity must not be complete earlier than this date. The
Activity's early finish date may not be before the Target Complete Early date.
Target Complete Late
Target Complete Late is used to specify that the activity must not finish later than this date. The Activity's
early finish date may not be after the Target Complete Late date
Fixed Start
A Fixed Start date is the date on which an activity must start. If a Fixed Start date is present, it takes
precedence over all other targets. A Fixed Start date sets both early and late start dates to the imposed
date.
Fixed Finish
A Fixed Finish date is the date on which an activity must finish. If a Fixed Start date is present, it takes
precedence over all other targets. A Fixed Start date sets both early and late start dates to the imposed
date.
As Late As Possible An As Late as Possible constraint is used to delay the activity as much as possible without delaying any
succeeding activities. The As Late as Possible constraint uses the activity free float to delay the start and
finish dates.

Safran RiskTM
156
Split Targets
Split targets are used where a natural break occurs in the network. If a split target value is entered to a
logic constraint, it acts as a barrier between the set of preceding activities and the set of succeeding
activities, making the two sets independent of each other. The preceding activity may not complete later
than the split target date, and the succeeding activity is not allowed to commence before this date.
The split target date may be used as a means of distributing the available float in the network. Float is an
asset common for all activities on the project path. A split target date may therefore be used to
distribute the float between project phase, sub-projects, or areas of responsibility. Using split targets
prevents any single part of a project from acquiring all available float.
Activity A Activity B
Activities
belonging to
sub-project X
Activities
belonging to
sub-project Y
Split target
date

Safran RiskTM
157
For more information please visit:
• Safran Risk Online Demos
http://www.safran.com/products/safran-risk/
• Safran Support
http://www.safran.com/services/support
• Safran Training
http://www.safran.com/services/training/
Contact Stavanger Safran Software Solutions AS P.O. Box 8118 N-4068 Stavanger Norway +47 4000 4707
Houston Safran Software Solutions LLC 19500 State Hwy 249 Suite 110 Houston, TX 77070 USA +1-888-572-8190
Oslo Safran Software Solutions AS P.O. Box 82 N-1325 Lysaker Norway +47 4000 4707
London Safran Software Solutions AS Southbank Technopark 90 London Road London SE1 6LN United Kingdom +44 7799663101

Safran RiskTM
158